Abstract
With the increase in greenwashing, corporate greenwashing governance has become a crucial component of urban environmental management. Industrial clusters are a key form of urban economic organization, yet the mechanisms through which they affect corporate greenwashing remain unclear. This study examines how different types of industrial agglomeration influence corporate greenwashing using a sample of Chinese A-share listed companies. The key findings include the following: (1) Specialized agglomeration inhibits corporate greenwashing through a “supervision” effect generated by intra-industry competition, while diversified agglomeration exacerbates greenwashing via a “collusion” effect arising from inter-industry cooperation. (2) The inhibitory role of specialized agglomeration is amplified under conditions of low public and strong government environmental concern, while the promotional effect of diversified agglomeration becomes more pronounced in contexts of high public and weak government environmental concern. Government environmental concern can be categorized into “general” and “specific” types, with the former being more effective in governing corporate greenwashing. (3) Specialized agglomeration demonstrates superior efficacy in curbing greenwashing among firms with green innovations related to energy-saving, alternative energy production, waste management, and transportation, while diversified agglomeration intensifies greenwashing tendencies in firms without green innovations. (4) Collusive greenwashing under diversified agglomeration yields short-term firm value gains but incurs hidden costs, including elevated operational risks and declining profit margins. This research provides critical insights for promoting corporate green transition and fostering zero-carbon industrial clusters.
1. Introduction
As global environmental issues intensify, the transition to green and sustainable economic development has become a dominant trend. Corporations, as key actors in economic activities, are under widespread scrutiny for their environmental responsibilities, which have become critical factors in assessing corporate value and enhancing competitiveness [1,2,3]. Driven by profit motives, some companies have begun to exaggerate their environmental performance through false or misleading claims, a practice known as “greenwashing”. According to a report by ESG risk assessment firm RepRisk (RepRisk is an information consulting firm specializing in providing ESG (Environmental, Social, and Governance) risk assessment services. Official website: https://www.reprisk.com/, accessed on 5 April 2025), global greenwashing incidents across industries and regions have increased annually from 2012 to 2022. In 2023, one in every four climate-related ESG risk events was related to greenwashing. Although the overall number of greenwashing cases declined in 2024, high-risk greenwashing cases surged by over 30% (source of information: https://www.reprisk.com/research-insights/reports/a-turning-tide-in-greenwashing-exploring-the-first-decline-in-six-years, accessed on 5 April 2025). Corporate greenwashing, as a form of pseudo-social responsibility, not only renders environmental disclosure signals ineffective [4] but also crowds out genuinely green firms in the market, leading to a “bad money drives out good” effect that harms environmental protection. Therefore, exploring ways to govern corporate greenwashing is crucial for advancing green and low-carbon development.
Against the backdrop of global economic integration and intensifying international competition, the phenomenon of industrial agglomeration has become increasingly prominent, such as the Silicon Valley high-tech industrial cluster in the United States, the Munich automotive industrial cluster in Germany, and the Harbin aviation cluster in China. These industrial clusters not only serve as vital engines for local economic growth but also facilitate the large-scale application of low-carbon technologies and the promotion of circular economies, becoming frontiers for green and low-carbon transitions in various countries. For instance, the UK plans (source of information: https://www.gov.uk/government/publications/energy-white-paper-powering-our-net-zero-future, accessed on 5 April 2025) to invest 1 billion pounds by 2025 in deploying carbon capture, utilization, and storage technologies in industrial clusters, aiming to deliver four low-carbon clusters by 2030 and at least one net-zero carbon cluster by 2040. Similarly, China proposed (source of information: https://www.cnenergynews.cn/huanbao/2024/12/26/detail_20241226192932.html, accessed on 5 April 2025) in 2024 to further develop the Guangdong–Hong Kong–Macao Greater Bay Area and the Yangtze River Delta integration, aiming to build world-class green and low-carbon industrial clusters. The construction of green and low-carbon clusters relies on the collective efforts of cluster firms. However, some recent studies have found that some cluster firms, especially small and medium-sized enterprises, may falsely claim voluntary participation in environmental initiatives to improve their financial performance without making actual investments [5]. Moreover, such “greenwashing” behaviors exhibit peer effects within clusters [6], severely hindering local green and low-carbon development. Therefore, for cluster firms, improving governance mechanisms for greenwashing is paramount. Achieving this goal first requires understanding how industrial agglomeration influences corporate greenwashing, a question of practical significance.
Current research on the determinants of corporate greenwashing primarily focuses on environmental compliance motivations [7,8], image management motivations [1,2,3], profit maximization motivations [9], and environmental regulations [10,11,12]. Few studies have explored the impact of industrial agglomeration on corporate greenwashing from a competitive–cooperative perspective, and there is a lack of theoretical support for the green practices of industrial clusters. The externalities of industrial agglomeration typically include MAR externalities, Jacobs externalities, and Porter externalities. Research on their impacts on firms seldom distinguishes between types of agglomeration, and there is room for further development of externality theories. From a competitive–cooperative perspective, industrial agglomeration may promote local competition due to limited resources, thereby generating a “supervision” effect that reduces greenwashing. Alternatively, it may enhance inter-firm collaboration through increased communication and integration, leading to a “collusion” effect that increases greenwashing. What impact does industrial agglomeration have on corporate greenwashing? How does it influence? How should greenwashing in cluster firms be governed? These questions remain unanswered.
As the world’s second-largest economy, China boasts a vast market, a large number of firms, and a variety of industrial clusters. In recent years, China has vigorously promoted green development, but the corporate green transformation has also led to the “greenwashing” phenomenon. Grounded in the Chinese context, this study selects Chinese firms as a sample to provide empirical support. The paper utilizes data from Chinese A-share listed companies from 2009 to 2019 to address the following key questions: First, what are the impacts of specialized and diversified industrial agglomeration on corporate greenwashing and their underlying mechanisms? Second, from the perspective of external supervision (government and public environmental concern) and firm internal characteristics (green innovation and pollution attributes), how should greenwashing among cluster firms be governed? Third, what are the economic consequences of cluster firms greenwashing?
Our research may make the following marginal contributions to the existing studies. First, this paper extends the determinants of corporate greenwashing from the meso-level industrial organization perspective. Unlike previous studies focusing on firm characteristics and external pressures, this study explores the impact of industrial agglomeration on corporate greenwashing from the perspective of competitive–cooperative relationships. Second, it extends the benefits of Porter externalities and the negative externalities of cluster firm collaboration from a sustainable development perspective, providing more empirical evidence for the differential impacts of heterogeneous industrial agglomeration. Third, heterogeneity analyses were conducted from the perspectives of external supervision and firm characteristics. In the heterogeneity analysis of external supervision, government environmental concern was categorized into “general” and “specific” types. In the heterogeneity analysis of firm characteristics, green innovation was further divided into seven categories based on the content of firms’ green patent applications. These analyses are more detailed and in-depth than previous similar explorations and provide theoretical guidance for governing corporate greenwashing in industrial clusters.
2. Literature Review
2.1. Industrial Agglomeration Externalities and Their Environmental Impacts
Industrial agglomeration refers to the concentration of micro-firms in the same geographic space. Marshall [13] attributed this phenomenon to labor market sharing, specialized division of labor, and knowledge spillovers, summarized as MAR externalities, which focus on the impact of single-industry agglomeration. Jacobs [14] argued that the agglomeration of different industries promotes the integration of complementary knowledge, thereby enhancing regional innovation and economic vitality, summarized as Jacobs externalities. Porter [15] emphasized the competitive effects of industrial agglomeration, which drive firms to focus on their core strengths and innovate—known as Porter externalities. In addition, scholars have identified negative externalities of agglomeration, such as overcrowding [16] and technological lock-in [17].
In the context of sustainable development, there is a debate among scholars regarding whether industrial agglomeration reduces [18,19] or increases [20] environmental pollution. Some scholars have proposed that the impact of industrial agglomeration on environmental pollution is nonlinear and varies by type of agglomeration. For example, some scholars found that specialized agglomeration has an inverted U-shaped relationship with haze pollution, while diversified agglomeration increases haze [21]. Existing research has also explored the impact of industrial agglomeration on corporate carbon emissions [22] and environmental responsibility fulfillment [23] from a micro perspective, but few studies have examined “greenwashing” in cluster firms.
2.2. Motivations and Governance of Corporate Greenwashing
Corporate greenwashing refers to the practice of exaggerating one’s environmental performance through false or misleading claims [24]. The motivations behind this behavior can be categorized into three main aspects. First, political motives for environmental compliance, where companies engage in greenwashing to establish an environmentally friendly image in order to obtain government subsidies or policy incentives [7] or to avoid environmental penalties [8]. Second, market motives for image management, such as creating a green brand image to enhance stakeholder trust, improve corporate reputation, and achieve differentiated competition [1,2,3], which encourages companies to exaggerate their actual environmental performance. Third, economic motivations for profit maximization. Genuine green innovation or the adoption of environmental equipment requires significant financial investment, leading short-sighted managers to engage in greenwashing to meet financial performance targets [9] or reduce financing costs [25]. Research on governing corporate greenwashing can be divided into formal and informal regulations. Formal regulations include government-mandated supervision [12] and standardized disclosure requirements [10], while informal regulations include increased public environmental awareness [10] and media and stakeholder oversight [11].
In summary, despite significant progress in understanding the externalities of industrial agglomeration and the determinants of greenwashing, there are still research gaps. First, current research on how industrial agglomeration affects environmental protection tends to focus on the macro-level, with limited attention to the micro-level. Second, in the context of growing interest in cluster social responsibility and corporate greenwashing, few studies have explored the impact of industrial agglomeration on corporate greenwashing, leaving a gap in the exploration of antecedents of corporate greenwashing from a competitive-cooperative perspective. Third, different types of industrial agglomeration may emphasize different externalities, but existing studies rarely distinguish between cluster types when exploring the impact of industrial agglomeration on corporate green development, lacking comparative studies on the externalities of heterogeneous clusters from a micro perspective.
3. Theoretical Analysis and Research Hypotheses
3.1. Specialized Agglomeration and Corporate Greenwashing: The Supervision Effect
Specialized industrial agglomeration refers to the concentration of firms from the same industry in a specific region. According to Porter’s externality theory, firms in the same region face homogeneous location conditions, factor endowments, policy environments, and market potential, leading to intense market competition, which is most pronounced in specialized agglomeration. Increased local competition incentivizes firms to genuinely fulfill environmental responsibilities to gain a competitive edge [26], reducing the need for greenwashing. Moreover, geographic agglomeration helps alleviate information asymmetry among firms [27], enabling competitors to leverage geographic proximity to verify the authenticity of environmental disclosures [28], thereby increasing the cost and risk of greenwashing and enhancing the supervision effect. Firms, fearing penalties for being caught “greenwashing” [4], are less likely to engage in it. Thus, we propose the following hypothesis:
H1.
Specialized industrial agglomeration inhibits corporate greenwashing.
3.2. Diversified Agglomeration and Corporate Greenwashing: The Collusion Effect
Diversified industrial agglomeration refers to the concentration of firms from different industries in a specific region. Jacobs’ externality theory suggests that competition among different industries is minimal, and the agglomeration of multiple industries in a region facilitates cross-industry interactions, promoting the exchange and integration of market information and complementary knowledge, thereby enhancing inter-firm collaboration [29]. Firms in collaborative networks typically have symbiotic relationships, where any “misstep” by one firm can trigger a “domino effect”, harming others. When firms discover greenwashing by their partners, exposing it may not reduce penalties from stakeholders [30], but remaining silent may allow them to benefit from such misconduct, potentially reducing their sense of social responsibility [31] and encouraging them to turn a blind eye. In other words, the likelihood of greenwashing being exposed in clusters is relatively low, making “greenwashing” a low-cost strategy for responding to environmental demands. Thus, we propose the following hypothesis:
H2.
Diversified industrial agglomeration promotes corporate greenwashing.
In summary, the logical framework for the impact of industrial agglomeration on corporate greenwashing is depicted in Figure 1.
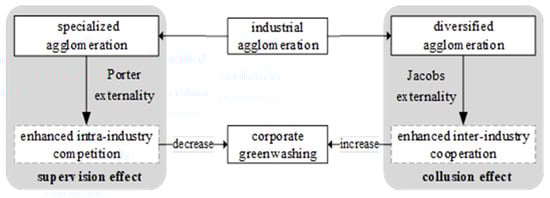
Figure 1.
Logical framework for the impact of industrial agglomeration on corporate greenwashing. Note: The variables enclosed in dashed boxes denote the mechanism variables.
4. Research Design
4.1. Sample Selection and Data Sources
The sudden public health crisis at the end of 2019 significantly impacted corporate strategic decisions in 2020 and subsequent years. Including samples from both pre- and post-crisis periods could bias the results. Additionally, since the China City Statistical Yearbook stopped publishing the employment data required for measuring industrial clustering after 2020, the availability of data after 2020 is limited. Considering these factors, this study selects Chinese A-share listed companies from 2009 to 2019 as the sample, with the following adjustments: (1) excluding financial firms; (2) excluding ST, *ST, and PT firms; (3) excluding firms with missing or abnormal data for required variables. The final sample consists of 1213 firms over 11 years, yielding 9143 firm–year observations. The original data for corporate greenwashing (gws) comes from ESG ratings provided by Bloomberg, Huazheng, and Hexun third-party agencies. Public environmental concern data are derived from the Baidu Search Index, and government environmental concern data are obtained from municipal government work reports using Python 3.12.x’s jieba library for text analysis. Data on industrial agglomeration, green innovation, and control variables are sourced from the China City Statistical Yearbook, China Labor Statistical Yearbook, CSMAR database, Qichacha database (https://www.qcc.com/, accessed on 5 April 2025), Tianyancha database (https://www.tianyancha.com/, accessed on 5 April 2025), China Statistical Yearbook, and China Urban Construction Statistical Yearbook.
4.2. Econometric Model
To examine the impact of different types of industrial agglomeration on corporate greenwashing, the following econometric model is constructed:
where represents the level of corporate greenwashing, and represents the level of industrial agglomeration in the city where the firm is located, including specialized agglomeration () and diversified agglomeration (). are control variables, represents time fixed effects, represents regional fixed effects (fixed at the province level), is the random error term, and is the constant term. Subscripts i and t denote the firm and year, respectively.
4.3. Variable Definitions
1. Dependent variable: Corporate Greenwashing (gws). Generally, corporate environmental disclosure represents communication with external stakeholders, focusing on what firms “say”, which can be used to measure symbolic environmental practices. The gap between what firms “say” and what they actually “do” in terms of environmental protection represents corporate greenwashing [32]. Following previous studies [25,33], this study uses Bloomberg’s ESG disclosure score for environmental disclosure () to measure what firms “say” and Huazheng’s ESG rating for environmental performance () to measure what firms “do”. Corporate greenwashing is calculated as follows:
where () and () represent the mean values of environmental disclosure and performance scores, respectively. and represent the standard deviations of environmental disclosure and performance scores, respectively. A higher score indicates that firms “say” more than they “do”, reflecting a higher level of greenwashing.
Based on the above formula, the greenwashing level of each company was calculated. The average greenwashing level of A-share listed companies in each city in China was used to represent the overall greenwashing level of the city, and spatial-temporal distribution maps of corporate greenwashing were drawn (see Figure 2 and Figure 3). Cities without data either had no A-share listed companies or the local listed companies lacked relevant environmental responsibility ratings. A comparison of the two figures reveals that, first, the overall greenwashing level across the country has increased, indicating that corporate greenwashing urgently needs to be governed; second, the gap in greenwashing levels between regions has widened, with significant increases in greenwashing in the economically developed and economically agglomerated areas in the southeast. This suggests that how to govern greenwashing within economically agglomerated regions has become a meaningful topic. This once again demonstrates the practical value of the research in this paper.
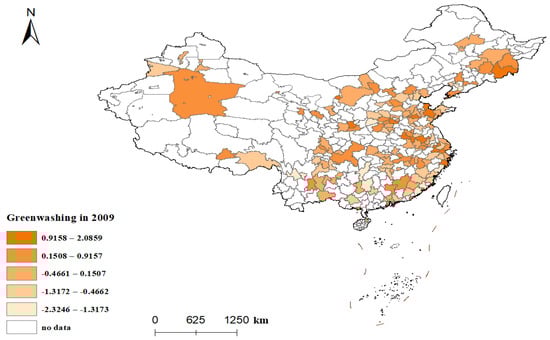
Figure 2.
The spatial distribution of corporate greenwashing levels in 183 Chinese cities in 2009. Note: The map was created using data from the National Geographic Information Public Service Platform of China, with no modifications made to the base map. The same applies to all other maps.
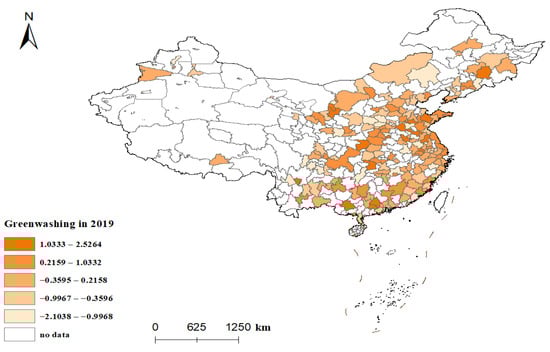
Figure 3.
The spatial distribution of corporate greenwashing levels in 237 Chinese cities in 2019.
2. Independent variables: industrial agglomeration, including specialized agglomeration and diversified agglomeration. The location quotient is used to eliminate the impact of regional-scale differences and accurately reflect the spatial distribution of regional factors. This study calculates industrial agglomeration at the city level using employment data.
(1) Specialized agglomeration (agg_spe). Following Wu et al. (2022) [34], specialized agglomeration is calculated as follows:
where represents the total employment in industry j in city k in year t; represents the total employment in city k in year t; represents the total employment in industry j nationwide in year t; and represents the total national employment in year t.
(2) Diversified agglomeration (agg_div). Following Ning et al. (2016) [35], diversified agglomeration is calculated as follows:
where represents the employment in industry h in city k in year t; represents the total employment in industry h nationwide in year t; and h represents industries other than the firm’s primary industry j. Equation (4) excludes the firm’s own industry employment to avoid the influence of specialized agglomeration on diversification.
3. Control variables. To control for the impact of other firm characteristics on greenwashing and avoid biases in the results due to omitted variable issues, following previous studies [36,37], this paper includes the following control variables: firm size (size, the natural logarithm of total assets plus one), leverage ratio (lev, total liabilities divided by total assets), asset transferability (sold, net fixed assets divided by total assets), the shareholding ratio of the largest shareholder (top1), firm age (age, the difference between the statistical cutoff date and the establishment date), and growth opportunities (growth, the growth rate of main business revenue). Since all econometric models in this paper employ a fixed-effects model with time and regional fixed effects, time and region-related variables have been absorbed.
4.4. Descriptive Statistics
Table 1 presents the descriptive statistics for the sample. The standard deviation of corporate greenwashing (gws) is nearly 12.00, with a range of 101.01, indicating significant variation in greenwashing among sample firms. Figure 4 shows that the frequency of corporate greenwashing is right-skewed, with a “long tail” distribution indicating that firms with severe greenwashing are relatively more common than those with green silence. Firms with “greenwashing” levels below negative twenty account for 3.45% of the sample, while those with levels above twenty account for 5.56%. Compared to diversified agglomeration (agg_div), specialized agglomeration (agg_spe) has a larger standard deviation and range, indicating greater variation in specialized agglomeration levels across regions.

Table 1.
Descriptive statistics.
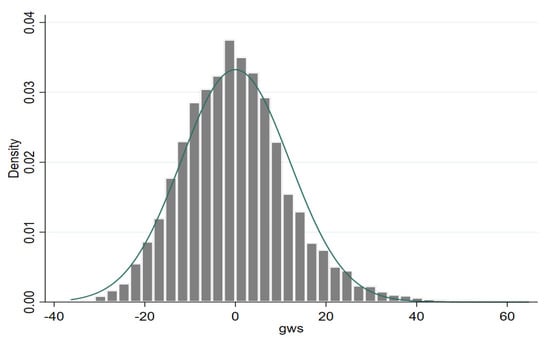
Figure 4.
Frequency distribution of corporate greenwashing.
5. Empirical Analysis
5.1. The Impact of Industrial Agglomeration on Corporate Greenwashing
Table 2 reports the results of the impact of two types of industrial agglomeration on corporate greenwashing. Columns (1)–(3) show that specialized agglomeration significantly inhibits corporate greenwashing. A 1% increase in specialized agglomeration reduces greenwashing by 0.18%, supporting H1. Columns (4)–(6) show that diversified agglomeration significantly promotes corporate greenwashing. A 1% increase in diversified agglomeration increases greenwashing by 1.02%, supporting H2.
Table 2.
Benchmark regression: industrial agglomeration and corporate greenwashing.
5.2. Endogeneity and Robustness Tests
5.2.1. Endogeneity Tests
The baseline regression confirms that specialized agglomeration inhibits corporate greenwashing, while diversified agglomeration promotes it. However, the model may suffer from endogeneity due to reverse causality or omitted variables.
1. Reverse causality. There may be a reverse causal relationship between industrial agglomeration and corporate greenwashing, as greenwashing may convey misleading information to external stakeholders, influencing other firms’ location and business decisions, thereby affecting local specialized and diversified agglomeration. To address this, the two-stage least squares (2SLS) method is employed. Following Xu et al. (2022) [38] and Combes et al. (2010) [39], the product of the 1984 city population and the inverse of terrain ruggedness is used as the instrumental variable for specialized agglomeration (IV_spe), and the product of the 1984 city population and whether a railway was opened in 1933 is used as the instrumental variable for diversified agglomeration (IV_div). Terrain ruggedness is calculated using Feng et al. (2007)’s method [40]. The rationale for these instrumental variables is that historical and geographical characteristics influence current industrial agglomeration [41] but do not directly affect current corporate greenwashing. Specifically, the 1984 city population reflects the city’s scale, terrain ruggedness affects population density (higher ruggedness generally leads to sparser populations, making it difficult to form specialized agglomeration effects), and railways, as infrastructure, reduce transportation costs and promote diversified economic agglomeration, thereby fostering diversified agglomeration. These variables are associated with current industrial agglomeration due to historical and geographical continuity. The 2SLS regression results are shown in Table 3. The Kleibergen–Paap rk LM statistics are 21.71 and 273.31, both rejecting the null hypothesis of underidentification at the 1% level. The Kleibergen–Paap rk Wald F statistics are 21.65 and 280.59, both exceeding the Stock-Yogo critical value of 16.38 at the 10% significance level, indicating no weak instrument problem. Thus, the instrumental variables are valid. Columns (2) and (4) of Table 3 show that the coefficients for specialized agglomeration are significantly negative, and those for diversified agglomeration are significantly positive, consistent with the baseline regression results. The study hypotheses remain valid after mitigating endogeneity.
Table 3.
Endogeneity test: instrumental variable method.
2. Omitted variables. To address endogeneity due to omitted variables, additional control variables and industry fixed effects are introduced. First, adding control variables. Considering that independent directors can supervise corporate behavior and strengthen internal controls, and that return on assets provides a financial basis for green practices, the proportion of independent directors (Ind) and return on assets (ROA) are added as control variables. Additionally, regional-level control variables are included, specifically human capital (hr), GDP per capita (pgdp), and carbon dioxide emissions (carbon). Human capital is measured as the proportion of university students in the city’s population, and carbon dioxide emissions are calculated based on energy consumption in electricity, transportation, and heating, following Glaeser and Kahn (2010) [19] and H. Li et al. (2013) [42]. The results, shown in columns (1)–(2) of Table 4, indicate that the coefficients for specialized agglomeration are significantly negative, and those for diversified agglomeration are significantly positive, consistent with the baseline regression. Second, adding industry fixed effects. The sample firms belong to 16 primary industries and 68 secondary industries. To control for industry differences, industry fixed effects are added at the primary industry level. The regression results, shown in columns (3)–(4) of Table 4, are consistent with the baseline regression.
Table 4.
Endogeneity test: adding control variables and industry fixed effects.
5.2.2. Robustness Tests
Further robustness tests are conducted. First, replacing the dependent variable. The environmental responsibility score from Hexun’s social responsibility rating is used to measure actual environmental practices, replacing the Huazheng score in the original variable (gws) to construct a new corporate greenwashing variable (gws_hexun). The regression results are shown in columns (1)–(2) of Table 5. Second, changing the sample period. In April 2013, the Shenzhen Stock Exchange issued the “Measures for the Assessment of Information Disclosure by Listed Companies”, categorizing listed companies’ information disclosure into four levels based on assessment results. This significantly promoted corporate environmental disclosure, potentially affecting greenwashing. Thus, the sample period is adjusted to 2014–2019, and the regression results are shown in columns (3)–(4) of Table 5. Third, removing outliers. To eliminate the impact of extreme values, the corporate greenwashing variable (gws) is winsorized at the 1% level on both ends to create a new variable, gws_w, and the regression is rerun. The results are shown in columns (5)–(6) of Table 5. All robustness tests indicate that the coefficients for specialized agglomeration are significantly negative, and those for diversified agglomeration are significantly positive, confirming the robustness of the baseline regression results.
Table 5.
Robustness tests.
5.3. Mechanism Tests
The Causal Steps Approach was once an important method for testing mechanisms. However, as research has progressed, an increasing number of scholars have raised concerns about it, citing issues such as endogeneity and low efficiency in mechanism identification. Consequently, the popularity of the Causal Steps Approach in economic mechanism testing is gradually declining. Following Jiang (2022) [43] and Lyu et al. (2024) [44], a more prevalent practice now is to only examine the first two steps of the Causal Steps Approach, namely, the effect of the independent variable X on the dependent variable Y and the effect of the independent variable X on the mediating variable M. The effect of M on Y is substantiated through theoretical and empirical evidence. This paper will employ this approach for mechanism testing. The following model (5) is used to examine whether the independent variable—industrial agglomeration—has the expected impact on the mechanism variables, thereby testing the mechanisms. Here, represents the mechanism variable, and other variables are as defined in Model (1).
5.3.1. The Underlying Motivation of the Inhibitory Effect of Specialized Agglomeration on Greenwashing: The Supervision Effect Generated by Intra-Industry Competition
As previously noted, specialized agglomeration reduces corporate greenwashing due to Porter externalities, which increase local competition and enhance the supervision effect. To test this, the study uses the strength of intra-industry competition (com) as the mechanism variable. Intra-industry competition (com) is measured using the inverse of the Herfindahl index calculated using revenue data for firms in the same region and industry. The specific formula is as follows:
where represents the revenue of firm i in industry j in city k in year t; represents the total revenue of all listed firms in industry j in city k in year t; and represents the number of listed firms in industry j in city k in year t. The results, shown in columns (1)–(3) of Table 6, indicate that the coefficients for specialized agglomeration (agg_spe) are significantly positive at the 1% level, confirming that specialized agglomeration significantly enhances intra-industry competition. In line with previous research, intense local competition can drive firms to either genuinely enhance their fulfillment of environmental responsibilities to gain a competitive edge [26] or curb greenwashing out of concern for the associated risks and costs [27,28]. In summary, the hypothesis that specialized agglomeration reduces corporate greenwashing by increasing intra-industry competition is valid.
Table 6.
Mechanism tests.
5.3.2. The Underlying Motivation of the Promotional Effect of Diversified Agglomeration on Greenwashing: The Collusion Effect Generated by Inter-Industry Cooperation
Diversified agglomeration increases corporate greenwashing due to Jacobs externalities, which enhance local collaboration and the collusion effect. Model (5) is used to test this, with the mechanism variable representing the local inter-industry cooperation level (coo), measured as the proportion of local firms among the top five suppliers and customers in terms of procurement and sales. Specifically, first, listed firms that disclose their top five suppliers and customers, and their procurement and sales amounts are selected. Second, the cities of these suppliers and customers are identified using the Qichacha and Tianyancha databases, and those located in the same city as the listed firm are selected. Third, the proportion of procurement and sales from these local suppliers and customers relative to the firm’s total annual business is calculated. The results, shown in columns (4)–(6) of Table 6, indicate that the coefficients for diversified agglomeration (agg_div) are significantly positive, confirming that diversified agglomeration significantly enhances local collaboration with upstream and downstream firms. According to previous research [30,31], the strengthening of local inter-industry cooperation will reduce the risk of corporate greenwashing exposure, which in turn may indirectly encourage corporations to engage in greenwashing. In summary, the hypothesis that diversified agglomeration promotes corporate greenwashing by increasing local inter-industry cooperation is valid.
6. Heterogeneity Analysis
6.1. External Supervision Perspective: Differences in Public and Government Environmental Concern
6.1.1. Differences in Public Environmental Concern
Institutional theory suggests that firms are embedded in social structures, and their behavior is influenced by existing social institutions and systems. Public environmental concern, as a typical informal institution, can shape societal expectations for environmental protection and influence corporate green governance and disclosure decisions by increasing market demand for green products [45] and environmental supervision [46], potentially substituting or complementing the “supervision” or “collusion” effects of industrial agglomeration. This may have a substitutive or complementary effect on the “supervision” or “collusion” effects generated by the above-mentioned industrial agglomeration. Thus, the impact of industrial agglomeration on corporate greenwashing may vary with different levels of public environmental concern. Following previous research [47], public environmental concern (pub) is measured using the Baidu search index for “environmental pollution” at the city level. The trend of public environmental concern in China from 2011 to 2019 is shown in Figure 5, which experienced a shift from fluctuating upward to downward. Is this shift beneficial? The sample is divided into high and low public environmental concern groups based on the median of pub, and separate regressions are conducted for each group. The results, shown in Table 7, indicate that specialized agglomeration has a stronger inhibitory effect on corporate greenwashing under low public environmental concern. This indicates that the “supervision” effect generated by specialized agglomeration and the “supervision” effect from public environmental concern serve as substitutes. In contrast, diversified agglomeration has a stronger promotional effect on corporate greenwashing under high public environmental concern, possibly because high public concern increases the demand for green products and stakeholders’ expectations for green development, strengthening firms’ motivation to collude in “greenwashing”. Notably, these results suggest that excessive public environmental concern in clusters may not be beneficial; thus, the transition of public environmental concern in China from high to low is scientifically sound.
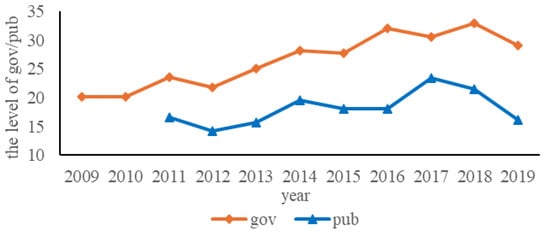
Figure 5.
The temporal trends in government or public environmental concern.
Table 7.
Heterogeneity analysis: differences in public environmental concern.
6.1.2. Differences in Government Environmental Concern
In China’s political and economic system, the government exerts strong control over the economy through mandatory regulatory measures and ownership control [48], serving as a key source of political legitimacy for firms and having the authority to allocate strategic resources such as project approvals, permits, funding, and subsidies. Therefore, government environmental concern differs from public environmental concern and often has a stronger deterrent effect and the ability to reduce information asymmetry [49]. Following previous research [50], government environmental concern (gov) is measured using the frequency of environmental terms in municipal government work reports as a proportion of the total text. The specific statistical method is as follows. First, municipal government work reports are manually collected from local government websites. Second, Python’s jieba library is used for text segmentation. Finally, the frequency of environment-related terms is counted, and the proportion is calculated. The environment-related terms specifically include “environmental protection”, “pollution”, “energy consumption”, “emission reduction”, “ecology”, “green”, “low-carbon”, “air”, “chemical oxygen demand”, “sulfur dioxide”, “carbon dioxide”, “PM10”, and “PM2.5”. According to Figure 5, government environmental concern in China showed an upward trend from 2009 to 2019. A word cloud of the key terms over these 11 years is presented in Figure 6. The sample is divided into high and low government environmental concern groups based on the median of gov, and separate regressions are conducted. The results, shown in Table 8, indicate that specialized agglomeration has a stronger inhibitory effect on corporate greenwashing under high government environmental concern. This suggests that the deterrent effect from government environmental concern and the “supervision” effect from specialized agglomeration are complementary. In contrast, diversified agglomeration has a stronger promotional effect on corporate greenwashing under low government environmental concern, possibly because low government concern stimulates firms’ opportunistic behavior in environments with weak inter-firm supervision. Thus, government environmental concern plays a positive role in reducing corporate greenwashing in clusters, the current increase in government environmental concern in China is necessary.
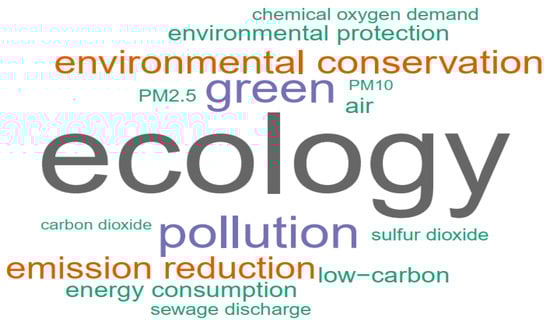
Figure 6.
Word cloud of environment-related terms in government work reports of all Chinese cities from 2009 to 2019.
Table 8.
Heterogeneity analysis: differences in government environmental concern.
Based on the word cloud maps for 2009 and 2019 (see Figure 7 and Figure 8), it can be observed that the focus of government environmental concern in China has changed. According to Figure 7 and Figure 8, compared to 2009, in 2019, the difference in frequency between specific environmental terms such as “chemical oxygen demand”, “sulfur dioxide”, and “air” and general environmental protection terms such as “ecology”, “pollution”, and “green” has grown. This indicates that the Chinese government’s environmental concern has become more extensive, with more general terms replacing more specific ones in government work reports. Does this shift lead to a loss of focus in supervision or play a “deterrent” role in more environmental contexts? To explore this question, this paper categorizes the above environmental keywords into “specific” and “general” based on their meanings. It further divides government environmental concern into “specific” and “general” types based on the ratio of the frequency of these terms to the total number of words in government work reports. The sample is then subgrouped and regressed under high and low government environmental concern scenarios, with the results shown in Figure 9. The effect of specialized agglomeration in curbing greenwashing is stronger under high levels of “general” government environmental concern, while the effect of diversified agglomeration in promoting greenwashing is stronger under low levels of “specific” government environmental concern. This suggests that “general” government environmental concern is more conducive to greenwashing governance.
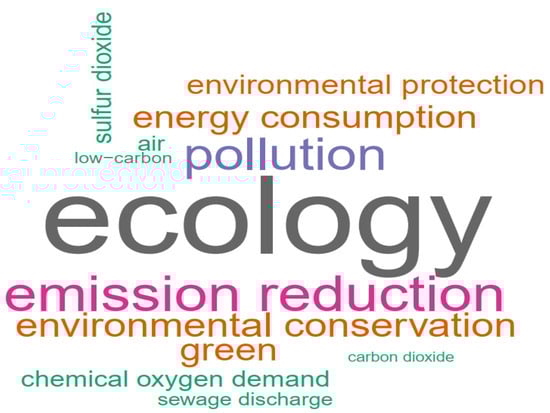
Figure 7.
Word cloud of environment-related terms in government work reports of all Chinese cities in 2009.
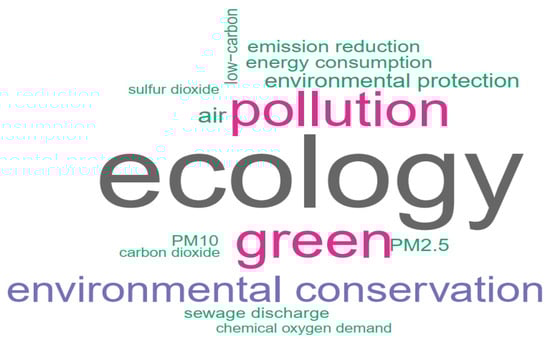
Figure 8.
Word cloud of environment-related terms in government work reports of all Chinese cities in 2019.
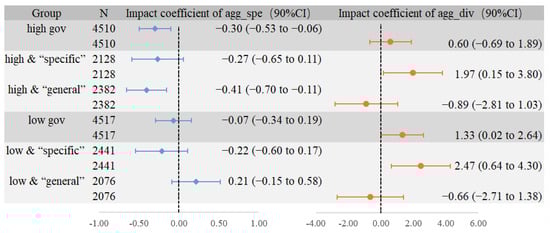
Figure 9.
The heterogeneity of government environmental attention types to the impact of industrial agglomeration on corporate greenwashing.
6.2. Internal Characteristics Perspective: Differences in Green Innovation and Pollution Attributes
6.2.1. Differences in Green Innovation Levels
Corporate green innovation is a way to fulfill environmental responsibilities, promote green transformation, and enhance competitive position [3]. Firms with different levels of green innovation have varying competitiveness and market attention [51], leading to differences in disclosure quality when faced with the “supervision” effect of specialized agglomeration and the “collusion” opportunities of diversified agglomeration. Following previous research, green innovation (GI) is measured using the number of green patent applications in the current year. Observing the sample, it was found that out of 9143 samples, 4175 had no green innovation, accounting for 45.7%. Therefore, the samples were grouped according to whether the firms had green innovation in the current year. The original data for green patents is sourced from the World Intellectual Property Organization (WIPO) patent database. By matching the patent classification numbers with the WIPO’s green patent directory, green patents that meet the criteria are selected. The regression results, shown in columns (1)–(2) of Table 9, indicate that specialized agglomeration is more effective in reducing greenwashing among firms with green innovation. This is likely because firms with green innovation tend to attract more attention from peers and are subject to stronger “supervision” effects in specialized clusters. In contrast, diversified agglomeration is more likely to increase greenwashing among firms without green innovation, possibly because these firms have weaker environmental performance and are more inclined to “greenwash” to establish a green transformation image and gain a competitive edge when facing collusion opportunities. Further, based on the content of green patents, corporate green innovation is divided into seven categories: administrative regulation and design, energy saving, nuclear power, alternative energy production, waste management, agriculture and forestry, and transportation. The proportions of these seven types of green innovation among the sample firms are shown in Figure 10. Grouped regression analyses by green innovation type reveal that, compared with firms engaging in other types of green innovation, the effect of specialized agglomeration in curbing greenwashing is more pronounced for firms involved in energy-saving, alternative energy production, waste management, and transportation-related innovations (see Figure 11).
Table 9.
Heterogeneity analysis: differences in green innovation levels.
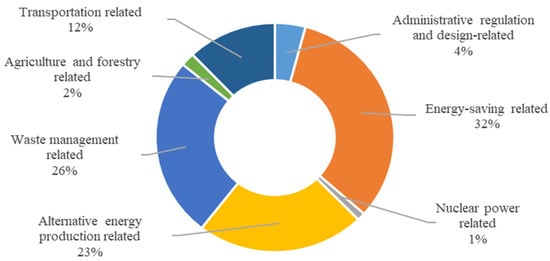
Figure 10.
The types of green innovation and their proportions among the sample firms.
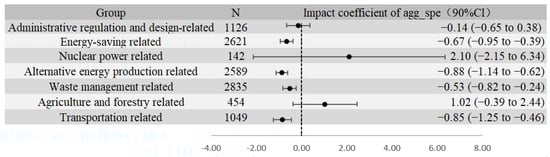
Figure 11.
The heterogeneity of green innovation types to the impact of specialized agglomeration on corporate greenwashing.
6.2.2. Differences in Pollution Attributes
Firms in different industries cause varying levels of environmental pollution. Heavy polluters face stricter environmental regulations and higher societal expectations for environmental governance, while also finding green transformation more challenging, leading to stronger motivations for greenwashing [52]. This may result in the “supervision” effect of specialized agglomeration being more pronounced for heavy polluters, as they have more room to reduce greenwashing, and the collusion opportunities of diversified agglomeration being more exploited by heavy polluters, as they stand to gain more from greenwashing. To test this, the sample is divided into heavy polluters and non-heavy polluters based on the “List of Industries Subject to Environmental Verification of Listed Companies” (The heavily polluting industries specifically include the following: non-metallic mineral products industry; non-metallic mineral mining and selection industry; textile industry; beverage, alcohol, and refined tea manufacturing industry; power, heat production and supply industry; metal products industry; petroleum processing, coking, and nuclear fuel processing industry; non-ferrous metal smelting and rolling industry; chemical raw materials and chemical products manufacturing industry; rubber and plastic products industry; chemical fiber manufacturing industry; petroleum and natural gas extraction industry; ferrous metal mining and selection industry; non-ferrous metal mining and selection industry; paper and paper products industry; coal mining and washing industry; ferrous metal smelting and rolling industry; textile, apparel, and clothing industry; leather, fur, feather, and their products, as well as footwear industry.) published by China’s Ministry of Ecology and Environment. The regression results, shown in Table 10, indicate that the “supervision” effect of specialized agglomeration and the “collusion” effect of diversified agglomeration are both more pronounced for heavy polluters.
Table 10.
Heterogeneity analysis: differences in pollution attributes.
7. Economic Consequences: Is Collusive Greenwashing Beneficial?
The motivation for corporate greenwashing is typically to convey positive information or conceal negative information to customers, investors, and other stakeholders, ultimately gaining benefits such as increased sales, investment, and bank credit [1,3,9,25]. Diversified agglomeration, by enhancing local inter-industry cooperation, provides more opportunities for collusive greenwashing. However, is “greenwashing” truly beneficial in this context? On the one hand, when firms in a clustered area collude in greenwashing, external stakeholders, due to high information asymmetry, may find it difficult to identify greenwashing behavior. In such cases, a false green image may bring real benefits to firms [53]. On the other hand, greenwashing is inherently a form of pseudo-social responsibility, inconsistent with the trend toward green and low-carbon development. Collusive relationships may not be stable, with potential reallocation of interests within the alliance [31]. Moreover, once greenwashing is exposed, it can damage competitiveness and corporate image, resulting in corresponding penalties [4]. Based on this analysis, this study examines the economic consequences of greenwashing induced by diversified agglomeration from the perspectives of operational risk, profit margins, and firm value, providing a theoretical basis for strategic choices and green practices in diversified agglomeration. The interaction term between diversified agglomeration (agg_div) and corporate greenwashing (gws), agg_div*gws, is constructed to capture the combined impact of diversified agglomeration and greenwashing, and the following model (7) is used for the economic consequences test:
where represents operational risk (risk), profit margin (opm), or firm value (value). Operational risk is measured as the standard deviation of the firm’s revenue over the next three years, profit margin is the ratio of operating profit to revenue, and firm value is measured using Tobin’s Q. Other variables are as previously defined.
The results, shown in Table 11, indicate that the interaction term coefficients are significantly positive, negative, and positive in columns (1)–(3), respectively. This indicates that while greenwashing induced by diversified agglomeration may increase firm value in the short term, it also raises operational risks and reduces profit margins. This is because such behavior may damage the firm’s commercial reputation and market trust. Although surrounding firms may not expose this behavior due to cooperative relationships and risk contagion, the firm may be at a disadvantage in business negotiations, which is not conducive to its long-term sustainable development.
Table 11.
Economic consequences test.
8. Research Contributions and Limitations
In the context of industrial clusters becoming a significant driver of economic development, studying the impact of industrial agglomeration on corporate greenwashing can help governments build green and low-carbon industrial clusters and coordinate economic growth with environmental protection. This study makes the following marginal contributions to existing literature: First, it expands the determinants of corporate greenwashing from a meso-level industrial organization perspective. Second, it supplements the empirical evidence of the positive role of Porter externalities and the negative role of cluster firm cooperation from a sustainable development perspective. This enriches the research on the impact of heterogeneous industrial agglomeration. Third, in the heterogeneity analysis of external supervision and firm characteristics, it categorizes government environmental concern into “general” and “specific” types. It also subdivides green innovation into seven categories based on the content of green patent applications. This deepens the relevant research.
Based on the current policies, economic conditions, and environmental context, we propose the following practical recommendations based on our research findings.
First, the governance of corporate greenwashing in clusters should differentiate between cluster types and adopt targeted measures. This study shows that specialized agglomeration inhibits corporate greenwashing through the “supervision” effect generated by intra-industry competition, while diversified agglomeration exacerbates greenwashing via the “collusion” effect arising from inter-industry cooperation. Therefore, in specialized clusters, fair competition should be encouraged, and supervision should be promoted through emission reduction standards and information disclosure requirements. In diversified industrial clusters, it is crucial to be vigilant against the risks of collusion fraud, establish whistleblower incentive mechanisms and accountability systems, and support firms in building green supply chains.
Second, to build green industrial clusters, it is necessary to enhance government environmental concern, particularly increasing “general” environmental concern, and guide public environmental concern to remain moderate. According to the results of the heterogeneity analysis of external supervision, on the one hand, increasing government environmental concern in industrial clusters is conducive to green development, with “general” environmental concern more effective than “specific”. Therefore, the government should strengthen the supervision of corporate environmental protection and expand the scope of supervision. On the other hand, the role of public environmental concern is not always positive, so the government should dialectically guide public environmental concern to mitigate its potential negative effects.
Third, to efficiently utilize limited resources, the government should prioritize high-risk firms based on firm heterogeneity when reviewing “greenwashing” in industrial clusters. The study shows that the impact of industrial agglomeration on greenwashing varies with firm characteristics. For example, the government should focus on supervising firms with low levels of green innovation and adjust the review priorities according to the type of agglomeration, prioritizing non-heavy-polluting firms in specialized agglomeration and heavy-polluting firms in diversified agglomeration.
Fourth, firms should recognize that while greenwashing may yield short-term gains, it can also damage commercial reputation and market trust, increase operational risks, reduce profit margins, and be detrimental to long-term sustainable development. Therefore, corporate managers should abandon short-sighted thinking, strive for green transformation, and truthfully disclose relevant progress.
Our study also has some limitations, which can be addressed in future research as follows. Given the significant differences in economic, political, and cultural contexts across countries and regions, the impact of industrial agglomeration on corporate greenwashing under varying institutional conditions is a topic that warrants further in-depth research. This study is based on the Chinese context and cannot confirm the universality of the conclusions in other institutional settings. Future research could use samples from other countries and consider national characteristics to further explore this issue. In addition, this paper uses a sample of all industry firms and does not focus on specific industries. Future research could conduct in-depth studies targeting manufacturing, strategic emerging industries, and so on.
9. Research Conclusions
Using data from Chinese A-share listed companies from 2009 to 2019, this study examines the impact of specialized and diversified agglomeration on corporate greenwashing from a competitive–cooperative perspective. The findings reveal the following:
- (1)
- Specialized agglomeration inhibits corporate greenwashing through the “supervision” effect generated by increased intra-industry competition, while diversified agglomeration exacerbates greenwashing via the “collusion” effect arising from increased inter-industry collaboration.
- (2)
- Heterogeneity analysis from the external supervision perspective shows that specialized agglomeration has a stronger inhibitory effect on corporate greenwashing under low public and high government environmental concern, while diversified agglomeration has a stronger promotional effect under high public and low government environmental concern. Further, the inhibitory effect of specialized agglomeration is stronger when “general” government concern is high, while the promotional effect of diversified agglomeration on greenwashing is stronger when “specific” government attention is low.
- (3)
- From the perspective of firm characteristics, specialized agglomeration is more effective in reducing greenwashing among firms with green innovations related to energy-saving, alternative energy production, waste management, and transportation, while diversified agglomeration is more likely to increase greenwashing among firms without green innovation. Compared with non-heavy-polluting firms, both types of agglomeration have stronger effects on heavy-polluting firms.
- (4)
- Economic consequences tests show that while collusive greenwashing under diversified agglomeration increases firm value, it also raises operational risk and reduces profit margins, hindering sustainable development.
Author Contributions
The authors contributed equally to all sections of this paper. In terms of writing, H.G. prepared the original draft, while X.A. and H.G. reviewed and edited the paper. All authors have read and agreed to the published version of the manuscript.
Funding
This research was funded by the General Project of the National Social Science Foundation of China (grant number: 22BTJ067).
Institutional Review Board Statement
Not applicable.
Informed Consent Statement
Not applicable.
Data Availability Statement
The specific data sources have been noted within the text. For further inquiries, please contact the author.
Acknowledgments
The authors would like to thank the editors and anonymous reviewers for their constructive comments and suggestions.
Conflicts of Interest
The authors declare no conflicts of interest.
References
- Cho, C.H.; Laine, M.; Roberts, R.W.; Rodrigue, M. The frontstage and backstage of corporate sustainability reporting: Evidence from the Arctic National Wildlife Refuge Bill. J. Bus. Ethics 2018, 152, 865–886. [Google Scholar] [CrossRef]
- Schmuck, D.; Matthes, J.; Naderer, B. Misleading consumers with green advertising? An affect–reason–involvement account of greenwashing effects in environmental advertising. J. Advert. 2018, 47, 127–145. [Google Scholar] [CrossRef]
- Bataineh, M.J.; Sánchez-Sellero, P.; Ayad, F. Green is the new black: How research and development and green innovation provide businesses a competitive edge. Bus. Strategy Environ. 2024, 33, 1004–1023. [Google Scholar] [CrossRef]
- Seele, P.; Gatti, L. Greenwashing revisited: In search of a typology and accusation-based definition incorporating legitimacy strategies. Bus. Strategy Environ. 2017, 26, 239–252. [Google Scholar] [CrossRef]
- Lund-Thomsen, P.; Lindgreen, A.; Vanhamme, J. Industrial clusters and corporate social responsibility in developing countries: What we know, what we do not know, and what we need to know. J. Bus. Ethics 2016, 133, 9–24. [Google Scholar] [CrossRef]
- Lu, J.; Wang, C.; Jamali, D.; Gao, Y.; Zhang, C.; Liang, M. A novel framework to unearth corporate hypocrisy: Connotation, formation mechanism, manifestation, and contagion effect. Bus. Ethics Environ. Responsib. 2022, 31, 1136–1156. [Google Scholar] [CrossRef]
- Ren, S.; He, D.; Zhang, T.; Chen, X. Symbolic reactions or substantive pro-environmental behaviour? An empirical study of corporate environmental performance under the government’s environmental subsidy scheme. Bus. Strategy Environ. 2019, 28, 1148–1165. [Google Scholar] [CrossRef]
- Zhang, D. Can environmental monitoring power transition curb corporate greenwashing behavior? J. Econ. Behav. Organ. 2023, 212, 199–218. [Google Scholar] [CrossRef]
- Thomas, J.; Yao, W.; Zhang, F.; Zhu, W. Meet, beat, and pollute. Rev. Account. Stud. 2022, 27, 1038–1078. [Google Scholar] [CrossRef]
- Cormier, D.; Magnan, M.; Van Velthoven, B. Environmental disclosure quality in large German companies: Economic incentives, public pressures or institutional conditions? Eur. Account. Rev. 2005, 14, 3–39. [Google Scholar] [CrossRef]
- Lyon, T.P.; Montgomery, A.W. Tweetjacked: The impact of social media on corporate greenwash. J. Bus. Ethics 2013, 118, 747–757. [Google Scholar] [CrossRef]
- Zhao, Y.-N.; Lee, C.-C. The impact of vertical environmental regulation mechanism on greenwashing. J. Clean. Prod. 2024, 475, 143637. [Google Scholar] [CrossRef]
- Marshall, A. Principles of Economics; Palgrave Macmillan: London, UK, 2013. [Google Scholar]
- Jacobs, J. The Economy of Cities; Vintage: New York, NY, USA, 2016. [Google Scholar]
- Porter, M.E. Clusters and the New Economics of Competition; Harvard Business Review: Boston, MA, USA, 1998; Volume 76. [Google Scholar]
- Accetturo, A. Agglomeration and growth: The effects of commuting costs. Pap. Reg. Sci. 2010, 89, 173–190. [Google Scholar] [CrossRef]
- Østergaard, C.R.; Park, E. What makes clusters decline? A study on disruption and evolution of a high-tech cluster in Denmark. Reg. Stud. 2015, 49, 834–849. [Google Scholar] [CrossRef]
- Ding, J.; Liu, B.; Shao, X. Spatial effects of industrial synergistic agglomeration and regional green development efficiency: Evidence from China. Energy Econ. 2022, 112, 106156. [Google Scholar] [CrossRef]
- Glaeser, E.L.; Kahn, M.E. The greenness of cities: Carbon dioxide emissions and urban development. J. Urban Econ. 2010, 67, 404–418. [Google Scholar] [CrossRef]
- Hong, Y.; Lyu, X.; Chen, Y.; Li, W. Industrial agglomeration externalities, local governments’ competition and environmental pollution: Evidence from Chinese prefecture-level cities. J. Clean. Prod. 2020, 277, 123455. [Google Scholar] [CrossRef]
- Liu, Y.; Ren, T.; Liu, L.; Ni, J.; Yin, Y. Heterogeneous industrial agglomeration, technological innovation and haze pollution. China Econ. Rev. 2023, 77, 101880. [Google Scholar] [CrossRef]
- Chu, S.; Chen, L.; Liu, Y. Does industrial agglomeration curb corporate carbon emissions? A perspective of financial constraints. Int. Rev. Econ. Financ. 2024, 96, 103673. [Google Scholar] [CrossRef]
- Tan, W.; Shen, M.; Pang, Y.; Liu, Y. Bank agglomeration and corporate environmental responsibility performance: Evidence from Chinese bank branch data. Int. Rev. Financ. Anal. 2024, 91, 103021. [Google Scholar] [CrossRef]
- de Freitas Netto, S.V.; Sobral, M.F.F.; Ribeiro, A.R.B.; Soares, G.R.d.L. Concepts and forms of greenwashing: A systematic review. Environ. Sci. Eur. 2020, 32, 19. [Google Scholar] [CrossRef]
- Zhang, D. Are firms motivated to greenwash by financial constraints? Evidence from global firms’ data. J. Int. Financ. Manag. Account. 2022, 33, 459–479. [Google Scholar] [CrossRef]
- Flammer, C. Does product market competition foster corporate social responsibility? Evidence from trade liberalization. Strateg. Manag. J. 2015, 36, 1469–1485. [Google Scholar] [CrossRef]
- Bacolod, M.; Blum, B.S.; Rangel, M.A.; Strange, W.C. Learners in cities: Agglomeration and the spatial division of cognition. Reg. Sci. Urban Econ. 2023, 98, 103838. [Google Scholar] [CrossRef]
- Yao, S.; Li, S. Soft or hard information? A trade-off selection of environmental disclosures by way of peer imitation and geographical distance. Appl. Econ. 2018, 50, 3315–3330. [Google Scholar] [CrossRef]
- Takeda, Y.; Kajikawa, Y.; Sakata, I.; Matsushima, K. An analysis of geographical agglomeration and modularized industrial networks in a regional cluster: A case study at Yamagata prefecture in Japan. Technovation 2008, 28, 531–539. [Google Scholar] [CrossRef]
- Pizzetti, M.; Gatti, L.; Seele, P. Firms talk, suppliers walk: Analyzing the locus of greenwashing in the blame game and introducing ‘vicarious greenwashing’. J. Bus. Ethics 2021, 170, 21–38. [Google Scholar] [CrossRef]
- Fang, X.; Cho, S.-H. Cooperative approaches to managing social responsibility in a market with externalities. Manuf. Serv. Oper. Manag. 2020, 22, 1215–1233. [Google Scholar] [CrossRef]
- Eliwa, Y.; Aboud, A.; Saleh, A. ESG practices and the cost of debt: Evidence from EU countries. Crit. Perspect. Account. 2021, 79, 102097. [Google Scholar] [CrossRef]
- Marquis, C.; Toffel, M.W.; Zhou, Y. Scrutiny, norms, and selective disclosure: A global study of greenwashing. Organ. Sci. 2016, 27, 483–504. [Google Scholar] [CrossRef]
- Wu, K.; You, K.; Ren, H.; Gan, L. The impact of industrial agglomeration on ecological efficiency: An empirical analysis based on 244 Chinese cities. Environ. Impact Assess. Rev. 2022, 96, 106841. [Google Scholar] [CrossRef]
- Ning, L.; Wang, F.; Li, J. Urban innovation, regional externalities of foreign direct investment and industrial agglomeration: Evidence from Chinese cities. Res. Policy 2016, 45, 830–843. [Google Scholar] [CrossRef]
- Tian, X.; Shi, D. Facilitating or Inhibiting: A Study on the Impact of Artificial Intelligence on Corporate Greenwashing. Sustainability 2025, 17, 2154. [Google Scholar] [CrossRef]
- Zervoudi, E.K.; Moschos, N.; Christopoulos, A.G. From the Corporate Social Responsibility (CSR) and the Environmental, Social and Governance (ESG) Criteria to the Greenwashing Phenomenon: A Comprehensive Literature Review About the Causes, Consequences and Solutions of the Phenomenon with Specific Case Studies. Sustainability 2025, 17, 2222. [Google Scholar] [CrossRef]
- Xu, M.; Tan, R.; He, X. How does economic agglomeration affect energy efficiency in China?: Evidence from endogenous stochastic frontier approach. Energy Econ. 2022, 108, 105901. [Google Scholar] [CrossRef]
- Combes, P.-P.; Duranton, G.; Gobillon, L.; Roux, S. Estimating agglomeration economies with history, geology, and worker effects. In Agglomeration Economics; University of Chicago Press: Chicago, IL, USA, 2010; pp. 15–66. [Google Scholar]
- Feng, Z.; Tang, Y.; Yang, Y. The relief degree of land surface in China and its correlation with population distribution. ACTA Geogr. Sin.-Chin. Ed. 2007, 62, 1073. [Google Scholar]
- Wahl, F. Does medieval trade still matter? Historical trade centers, agglomeration and contemporary economic development. Reg. Sci. Urban Econ. 2016, 60, 50–60. [Google Scholar] [CrossRef]
- Li, H.; Lu, Y.; Zhang, J.; Wang, T. Trends in road freight transportation carbon dioxide emissions and policies in China. Energy Policy 2013, 57, 99–106. [Google Scholar] [CrossRef]
- Jiang, T. Mediating effects and moderating effects in causal inference. China Ind. Econ. 2022, 5, 100–120. [Google Scholar]
- Lyu, Y.; Bai, Y.; Zhang, J. Green finance policy and enterprise green development: Evidence from China. Corp. Soc. Responsib. Environ. Manag. 2024, 31, 414–432. [Google Scholar] [CrossRef]
- Tong, Q.; Anders, S.; Zhang, J.; Zhang, L. The roles of pollution concerns and environmental knowledge in making green food choices: Evidence from Chinese consumers. Food Res. Int. 2020, 130, 108881. [Google Scholar] [CrossRef] [PubMed]
- Gu, Y.; Ho, K.-C.; Yan, C.; Gozgor, G. Public environmental concern, CEO turnover, and green investment: Evidence from a quasi-natural experiment in China. Energy Econ. 2021, 100, 105379. [Google Scholar] [CrossRef]
- Tao, Y.; Wang, D.; Ye, Y.; Wu, H.; Zhang, Y. The role of public environmental concern on corporate social responsibility: Evidence from search index of web users. Energy Econ. 2023, 126, 107041. [Google Scholar] [CrossRef]
- Guthrie, D. China and Globalization: The Social, Economic and Political Transformation of Chinese Society; Routledge: Oxfordshire, UK, 2012. [Google Scholar]
- Meng, X.; Zeng, S.; Tam, C.M. From voluntarism to regulation: A study on ownership, economic performance and corporate environmental information disclosure in China. J. Bus. Ethics 2013, 116, 217–232. [Google Scholar] [CrossRef]
- Chen, J.; Zhu, D.; Ding, S.; Qu, J. Government environmental concerns and corporate green innovation: Evidence from heavy-polluting enterprises in China. Bus. Strategy Environ. 2024, 33, 1920–1936. [Google Scholar] [CrossRef]
- Ho, K.-C.; Shen, X.; Yan, C.; Hu, X. Influence of green innovation on disclosure quality: Mediating role of media attention. Technol. Forecast. Soc. Change 2023, 188, 122314. [Google Scholar] [CrossRef]
- Hu, S.; Wang, A.; Du, K. Environmental tax reform and greenwashing: Evidence from Chinese listed companies. Energy Econ. 2023, 124, 106873. [Google Scholar] [CrossRef]
- Li, W.; Li, W.; Seppänen, V.; Koivumäki, T. Effects of greenwashing on financial performance: Moderation through local environmental regulation and media coverage. Bus. Strategy Environ. 2023, 32, 820–841. [Google Scholar] [CrossRef]
Disclaimer/Publisher’s Note: The statements, opinions and data contained in all publications are solely those of the individual author(s) and contributor(s) and not of MDPI and/or the editor(s). MDPI and/or the editor(s) disclaim responsibility for any injury to people or property resulting from any ideas, methods, instructions or products referred to in the content. |
© 2025 by the authors. Licensee MDPI, Basel, Switzerland. This article is an open access article distributed under the terms and conditions of the Creative Commons Attribution (CC BY) license (https://creativecommons.org/licenses/by/4.0/).