1. Introduction
In response to the escalating threat of climate change, numerous countries have implemented measures aimed at significantly reducing carbon dioxide (CO
2) emissions. The building sector, a major contributor to pollution, is now subjected to stringent regulations focusing on energy efficiency, particularly in Europe, encompassing both economical heating solutions and enhanced thermal performance. These regulations apply not only to new constructions but also to the renovation of existing buildings that fail to meet current standards [
1]. Given the prevalence of such buildings in Europe, it is crucial to retrofit them to ensure the entire building stock contributes effectively to reducing energy waste.
A substantial number of schools are outdated buildings, which not only creates energy challenges but also directly impacts the occupants’ comfort. Historically, the primary concern during the construction of these schools was not the indoor environmental quality. However, recent research indicates that classroom ambient conditions significantly influence academic performance, particularly among younger students [
2].
Young schoolchildren, due to their faster metabolism, smaller size, and developing immune systems, are particularly sensitive to indoor air quality (IAQ). This heightened sensitivity makes them more vulnerable to indoor pollutants, which can impair concentration, negatively affect school performance (grades, etc.), and lead to general health issues, resulting in increased absenteeism [
3]. Also, thermal comfort is crucial for young pupils, as their ability to concentrate for extended periods is limited. Therefore, maintaining a satisfactory indoor environment is essential to enhance the learning capabilities of young students.
Environmental policies often prioritize minimizing energy consumption, sometimes at the expense of improving indoor environmental quality (IEQ) for occupants. This is particularly concerning in schools, where pupils spend long hours in the same room. Energy-efficient retrofits, such as increased thermal resistance of the building envelope (R-value) by increasing insulation, high-performance glazing, and energy-efficient heating, ventilation, and air conditioning (HVAC) systems, are commonly implemented to reduce energy consumption. While these measures effectively lower heating and cooling demands, they can inadvertently impact the indoor environment if not carefully managed. For example, improving building envelope insulation to prevent heat loss can also reduce natural ventilation, leading to increased levels of indoor pollutants, such as CO
2, volatile organic compounds (VOCs), and particulate matter. Similarly, thermal comfort issues, such as overheating in well-insulated buildings during warm seasons, can arise if passive cooling strategies are not incorporated. Some drastic energy-saving measures can result in lowering indoor air temperatures during the winter, affecting thermal comfort [
4].
When renovating school buildings, it is imperative to prioritize IEQ alongside energy savings. An uncomfortable indoor environment often leads to higher-than-expected energy costs, as occupants adjust their behavior to improve comfort, typically by increasing energy use. Thermal comfort and IAQ are critical parameters in promoting the well-being and academic success of schoolchildren. Zomorodian et al. [
3] highlighted that few studies on thermal comfort in schools were conducted between 1969 and 2015. However, since then, numerous studies have been published, driven by the need to save energy and improve IEQ in educational settings, particularly within the European Union.
Recent research indicates that current standards are inadequate for pupils [
3,
5,
6,
7,
8,
9]. Babich et al. [
5] compared different IEQ standards by analyzing four school buildings in northern Italy, assessing their CO
2 levels, indoor air temperature, and thermal sensations of pupils of various ages, from February 2022 to April 2022. Their findings suggested that the widely used Fanger model is not suitable for young people due to their distinct physiological factors. The study also noted that pupils effectively ventilate their classrooms by opening doors and windows. Almagro-Lidón et al. [
6] studied different age groups and found that children aged 6–8 have a broad tolerance range for temperature, but this tolerance decreases at puberty. Adults generally prefer warmer environments than young people, indicating that schools need to be designed differently, as the Fanger model is not suitable for young students. Thermal discomfort in school environments can significantly impair children’s cognitive abilities by reducing their concentration, increasing fatigue, and causing physical symptoms, such as headaches and irritability. When students experience temperatures outside their comfort range—particularly in underheated or poorly regulated spaces—they report higher levels of dissatisfaction and distraction. This discomfort disrupts their ability to focus, process information, and engage effectively in learning activities, ultimately hindering academic performance and well-being. Almeida et al. [
7] found that when using the PMV analytical approach, the metabolic rate should be adjusted using children’s body surface area as a correction factor. Despite this, no perfect agreement was found between the calculated PMV and the average thermal sensation reported in questionnaires. Torriani et al. [
8] observed that environmental adaptation increases with age, with the ideal temperature associated with neutral thermal sensation rising by 1 °C per age stage. This variation in metabolic rates across different age groups further indicates that the Fanger model is unsuitable for children. Recently, Aparicio-Ruiz et al. [
9] demonstrated as well that in hot climates, children prefer lower temperatures than adults. The predicted mean vote (PMV) index often underestimates temperature sensations, leading to discomfort, especially in naturally ventilated environments where indoor air velocity exceeds 0.2 m/s. These findings underscore the need to extend thermal comfort studies in schools due to the differences between children and adults. The PMV index appears more restrictive compared to the EN 15251 model [
10]. Asif et al. [
11] noted a strong influence of indoor and outdoor temperatures on clothing choices, with both genders perceiving thermal sensations differently, though no significant difference in neutral temperatures was observed between the sexes. A new model designed to improve upon the PMV was developed, but its accuracy remained below 50%. Sun et al. [
12] highlighted that thermal sensation varies throughout the day, influenced by factors such as the time of the class and the nature of pre-class activities. This variability necessitates adapting classroom environments to suit the specific group of students present. Zhang et al. [
13] recommended adjusting the PMV for children by inversely determining the metabolic rate, avoiding the need for direct metabolic rate assumptions.
Air pollution, particularly indoor air pollution, poses significant risks to human health. Annually, nearly 7 million people worldwide are affected by outdoor air pollution, with 3.2 million impacted by indoor air pollution. Various indoor pollutants—including particulate matter (PM), volatile organic compounds (VOCs), carbon monoxide (CO), carbon dioxide (CO
2), ozone (O
3), radon, polycyclic aromatic hydrocarbons (PAHs), aerosols, and microbes—can degrade IAQ and harm human health [
14]. Branco et al. [
15] noted that CO
2, used as a measure of the ventilation rate, primarily originates from occupants and the ventilation system, while PM mainly comes from the surrounding environment. Other pollutants are generally linked to classroom materials, such as furniture, carpets, and paint. Requia et al. [
16] examined fine particles from vehicles operating near schools, finding that indoor particle levels were much higher than outdoor levels, likely due to nearby traffic. This can have serious health consequences and affect school performance. Abhijith et al. [
17] showed that CO
2 and fine particle levels increased during school hours, with the finest particles (PM2.5 and PM1) depending mainly on outdoor exposure. Yu et al. [
18] demonstrated that the position of the classroom and the opening of windows and doors significantly influenced CO
2 levels. Opening interior doors or windows had minimal impact compared to those leading outside. Chiesa et al. [
19] evaluated the performance of independent mechanical ventilation devices in a school building. These devices were effective when used with set values not to be exceeded, but they are expensive, take up space, and are impractical for most existing schools. Piscitelli et al. [
20] investigated the airborne transmission of COVID-19, showing that the virus was more likely to be transmitted in polluted air. The virus is transmitted via droplets suspended in the air, so inadequate air recycling increases the risk of contamination. Most current air filtration systems are unsatisfactory, with low efficiency, harmful reaction products, or filters that require regular replacement, which are often neglected. Hybrid systems are commonly used, and innovative solutions may soon emerge [
21]. Yu et al. [
22] reported on advances in air conditioning for thermal comfort and IAQ. Globally, air quality is not a policy priority—thermal comfort and energy savings are more emphasized. While air conditioning addresses the historical problem of balancing thermal comfort and energy savings, it is not ideal. Effective pollutant filtration requires multiple filters, which are not always efficient, and some produce harmful by-products and consume significant energy.
Thermal comfort and IAQ are interrelated since ventilation impacts heating and cooling demands. However, few studies simultaneously address thermal comfort, IAQ, and energy consumption [
4]. Natural ventilation alone often cannot ensure thermal comfort and IAQ under extreme conditions, while continuous mechanical ventilation leads to high energy consumption. Therefore, mixed-mode ventilation and corresponding control strategies, potentially leveraging IoT and AI, should be further explored [
23]. Implementing these technologies involves several key steps. First, a network of sensors must be installed to monitor indoor and outdoor environmental parameters, such as temperature, humidity, CO
2 levels, air quality, and occupancy. These sensors form the backbone of the IoT infrastructure, enabling real-time data collection. The data are then transmitted via wireless communication protocols to a centralized platform, where they can be processed and analyzed. AI algorithms, particularly those based on machine learning and predictive modeling, can then be employed to determine optimal ventilation strategies by learning from historical patterns and adapting to real-time conditions. These algorithms can control actuators connected to windows, fans, and HVAC systems, dynamically switching between natural and mechanical ventilation modes to maintain comfort and efficiency. A user interface, such as a dashboard, allows building managers or occupants to monitor system performance and provide feedback, while the AI continues to refine its decisions through continuous learning. Ultimately, this integration of IoT and AI enables a smart, adaptive ventilation system that balances comfort, air quality, and energy efficiency in a sustainable and responsive manner.
Heibati et al. (2021) [
23] assessed the energy, indoor air quality, and moisture performance of a three-story building using an integrated model in order to accurately calculate the building performance. Vilčeková [
2] assessed IEQ conditions in classrooms over a year in an old building, finding the lowest operative temperature in spring (17.6 °C), the lowest relative humidity in winter (21.1%), and the highest CO
2 levels in autumn (2041 ppm), along with the highest total volatile organic compounds (TVOCs) concentration (514 µg/m
3).
In Europe, many schools are housed in old buildings that do not meet current energy-saving and comfort standards’ requirements. Most regulations focused on energy savings rather than thermal comfort, leading to issues such as sick building syndrome (SBS), which includes symptoms like asthma, fatigue, and loss of concentration. Allab et al. [
24] conducted an energy audit on thermal comfort and IAQ, using measurements and questionnaires. They found excessive energy consumption and discomfort at a university in Paris, emphasizing the need for optimization of central systems to heat and ventilate appropriately. Merabtine et al. [
25] recommended better control of ventilation and heating elements at a low-energy university in France, highlighting the challenge of maintaining energy consumption within standards while satisfying both IAQ and thermal comfort requirements. In Italy, Leccese et al. [
26] developed a method for prioritizing renovation work at a university in Pisa, by ranking aspects of IEQ and classrooms based on data collection, parameter selection, and analysis. The study emphasized the importance of choosing appropriate weights for each aspect, as these significantly impact the results. Torriani et al. [
27] explored the perception of thermal comfort and IAQ based on the control users believe they have over their environment. The study found that perceived control makes indoor conditions more bearable, leading to energy savings.
Monge-Barrio et al. [
28] assessed IEQ in nine naturally ventilated schools in northern Spain, finding that natural ventilation provided excellent IAQ during the heating season but led to thermal discomfort and higher energy consumption. Despite this, school performance was not affected, and the study highlighted the shift in priority from energy sobriety to health during the COVID-19 pandemic.
Building upon the state-of-the-art, several solutions have been studied to address the technical challenges, making it possible to find a trade-off between IEQ and energy consumption.
Joe Lin et al. [
29] developed a numerical model to optimize energy consumption and thermal comfort using a modified PMV model and an artificial neural network. Their recommended technical solutions resulted in a 16.51% reduction in energy demand and a 49.06% improvement in thermal comfort. Shrestha et al. [
30] conducted a study in Nepal, where many buildings are constructed using local materials. The study demonstrated that adapted design, particularly through natural ventilation, can passively improve the thermal comfort of these buildings at a lower cost. These findings are also applicable to temperate climates. Bay et al. [
31] utilized computational fluid dynamics (CFD) modeling to determine the best scenario for thermal comfort, IAQ, and the preservation of historic buildings in Texas, where hot and humid summers pose significant constraints. The study found that combining night ventilation with mechanical ventilation during summer and spring was the most effective solution.
An innovative Digital Twin framework for HVAC systems (HVACDT) aimed at reducing energy consumption while enhancing thermal comfort was proposed by Hosamo et al. [
32]. This framework, designed for facility managers, integrates building information modeling (BIM) with real-time sensor data to optimize HVAC operations via MATLAB R2025a. Tested with data from a Norwegian office building, the system used an artificial neural network (ANN) and a multi-objective genetic algorithm (MOGA) to adjust HVAC components based on decision variables, such as temperature and pressure. The framework effectively balanced comfort and efficiency, as confirmed by metrics for predicted percentage dissatisfied (PPD) and energy usage. Tsolkas et al. [
33] proposed pre-programming HVAC systems by forecasting building conditions and occupant needs to optimize thermal comfort and energy consumption.
Numerous studies have indicated that certain renovations and construction of low-emission buildings often fail to achieve satisfactory levels of both indoor comfort and energy efficiency. Therefore, it is crucial to conduct extensive research across diverse sites, climates, immediate environments (such as residential and industrial zones), and regulatory frameworks. This comprehensive approach will build a robust body of knowledge to guide future school construction, ultimately benefiting a large number of students and reducing costs by preventing the need for subsequent upgrades to buildings that should comply with current standards.
Despite advancements in building technologies and regulations, there remains a significant gap in achieving optimal IEQ and energy efficiency in school buildings, particularly in older structures. Existing studies often lack comprehensive data across varied climates and environments, leading to inconsistent results and recommendations. This inconsistency in findings has limited the development of universally effective renovation strategies. This study contributes a novel approach by integrating in situ measurements with a validated numerical model, allowing for precise forecasting of both energy demand and IEQ improvements before and after refurbishment. By focusing on a 1970s elementary school in France, this research provides critical insights into how renovation strategies impact real-world conditions, addressing key challenges in existing standards. Unlike prior works that rely primarily on theoretical models or generalized recommendations, this study emphasizes empirical validation and site-specific optimization, enhancing the applicability of its findings for future school renovations across different climates and environments. These breakthroughs aim to bridge the persistent gap between building technology advancements and their practical effectiveness, offering a data-driven framework for improving IEQ and energy performance in aging school infrastructure.
Some questions still remain about IEQ improvement strategies, challenges, and decision-making tools to be utilized:
How do different renovation strategies impact the IEQ and energy efficiency of school buildings across various climates and environments?
What are the specific challenges and limitations of current IEQ and energy-efficiency standards in older school buildings?
Answers to these questions aim to address the critical issues in the field and guide future research toward more effective and comprehensive strategies. This case study aims to enhance the IEQ of a 1970s elementary school in France. In situ measurements of indoor air temperature, relative humidity, and CO2 levels are conducted before and after the school’s refurbishment. The data are processed and analyzed to validate a developed numerical model for forecasting energy demand and IEQ, as well as for optimization purposes.
2. Materials and Methods
2.1. Case Study Description
The present study was conducted at Lamairesse School, located at Jacquiert in Saint-Martin-sur-le-Pré, located in eastern Paris and slightly south of Reims, France. Its geographical placement underscores the 27 km separation between the school and the Reims-Prunay weather station, which served as the source for the climatic data used in this research. The local climate is temperate, influenced by both semi-oceanic and semi-continental regimes, which play a significant role in determining indoor thermal conditions. Within this type of educational establishment, the heating activation period extends from mid-October to late May, reflecting the need for sustained thermal management across varying seasonal demands.
Driven by the goal of enhancing student comfort while simultaneously reducing the financial burden associated with energy consumption, the town council initiated a comprehensive renovation project for the school. The primary objectives centered on optimizing thermal comfort, increasing the effective thermal resistance of the building envelope, such as the insulation material—which had been nonexistent prior to the renovations—improving heating regulation, and establishing an efficient ventilation system to eliminate the reliance on window opening for CO₂ control. Before these upgrades, ventilation depended entirely on a natural airflow system, which was often inadequate in maintaining indoor air quality.
Originally constructed in the 1970s, the building has a net floor heated area of 1351 m
2, comprising an 832 m
2 ground floor and a 519 m
2 upper floor, as depicted in
Figure 1. The upper floor features a single row of classrooms arranged alongside a south-facing corridor with substantial glazing spanning 44 m
2, which contributes to passive solar heat gain. On the ground floor, classrooms are distributed across the northern and southern sides, separated by a central corridor, ensuring a balanced spatial configuration for thermal performance assessments.
During the study, environmental sensors (see
Table 1 below) were strategically installed in classrooms 1 and 2 on the ground floor (south side) and in classrooms 3 and 4 on the upper floor (north side), as shown in
Figure 1c. The renovation phase that included the increase of the thermal resistance by installing insulation materials spanned from June to September 2022, followed by additional improvements aimed at optimizing building performance. Loft insulation was completed in October, while the air handling unit (AHU) installation was finalized in November, becoming fully operational from that point forward. For thermal insulation, the external walls were reinforced with 160 mm of semi-rigid hemp, enclosed in steel cladding, whereas 250 mm of mineral wool was installed through blown-in insulation in the unused loft space, enhancing the building’s thermal performance. In September, an additional temperature sensor was integrated into the heating regulation system to refine control strategies. Prior to this update, regulation relied solely on a north-side sensor, which frequently led to overheating on the southern side of the building, particularly in October, April, and May. The installation of a south-side sensor markedly improved heating distribution, ensuring a more precise and adaptive regulatory framework.
Regulatory adjustments were implemented progressively, with modifications to the hot water supply temperature ensuring refined thermal efficiency. The first adjustment, introduced on 11 October 2022, set the supply temperature at 65–60 °C for an outdoor temperature of −10 °C, providing improved heating calibration across different zones of the building. A subsequent adjustment on 16 November 2022 further optimized the heating efficiency by lowering the supply temperature to 60–55 °C under the same outdoor conditions. Since 16 November 2022, this revised setting has remained in place with a consistent circulator speed. The heating system operates on an automated basis, wherein the boilers activate when indoor temperatures drop below the setpoint and transition to standby or shut off once temperatures exceed the threshold. These adjustments apply equally to the reduced heating mode during nights and weekends, as well as to standard occupancy hours during the day. Even during standby periods, circulators continue running to maintain the boiler in a ready state, ensuring seamless responsiveness when heat is required.
In terms of operational parameters, the boilers are scheduled to start operation annually on 1 October and shut down on 30 May, reflecting the typical thermal demand pattern of the facility. Heating setpoints are calibrated to maintain temperatures between 19 and 20 °C during occupancy mode and at 17 °C during reduced mode. However, in practice, observations indicated that the actual indoor temperature tended to stabilize at approximately 22 °C during occupancy and around 20 °C in reduced mode. This variance highlights the combined influence of improved thermal resistance of the building envelope, refined regulation, and residual heat effects within the building, reinforcing the overall success of the renovation in achieving its intended comfort and energy-efficiency goals. Two types of sensors were used for measurements: Qualis 10 (Qualis, Huntsville, AL, USA) and TempU 03 (Shenzhen Tzone Digital Technology Co., Ltd., Shenzhen, China).
Table 1 depicts their characteristics.
2.2. Post-Processing Methodology
Installed sensors throughout the study enabled the collection of extensive experimental data, primarily focusing on temperature, relative humidity, and, during specific periods, CO₂ levels. The sensors were consistently placed above a desk positioned in the middle of the classroom (4 m from the window and 4 m from the corridor). Its height generally ranged between 0.8 and 1 m, corresponding to a seating position for young people. Measurement campaigns were conducted at five distinct intervals: from 10 to 16 November 2021, from 29 June to 17 August 2022, from 9 to 16 November 2022, from 3 May to 4 July 2023, and from 23 October to 15 December 2023. These datasets provided a comprehensive overview of the environmental conditions within the school building, facilitating a detailed analysis of thermal comfort and indoor air quality variations over time.
The collected data were used to generate various graphical representations using Python v3.11, enabling the visual comparison of temperature and relative humidity trends, the plotting of predicted percentage dissatisfied (PPD) as a function of predicted mean vote (PMV), and the generation of psychrometric charts. Overlaying temperature and relative humidity values on the same graph was particularly useful for detecting potential external sources of moisture. Since warmer air has a greater capacity to retain water vapor, it typically leads to a reduction in relative humidity, whereas cooler air results in higher relative humidity levels. In theory, these fluctuations should appear symmetrical in graphical representations—any detected asymmetry suggests an additional input of absolute humidity, which could originate from outdoor environmental factors or occupants themselves, impacting indoor air quality.
Certain assumptions were necessary to ensure the accuracy of the PMV-PPD analysis. Indoor air velocity was set at 0.15 m/s, a standard approximation for enclosed spaces with moderate airflow. Based on our observations, clothing insulation levels were estimated at 0.5 for summer and 1.0 for winter [
34], based on typical seasonal indoor clothing adjustments. Additionally, student metabolic activity was assumed at 1.1 met, which corresponds to a sedentary state, such as writing or reading. These estimations followed standard recommendations provided by the calculation tool, ensuring consistency with established thermal comfort evaluation methodologies.
Through these detailed measurement campaigns and analytical processes, the study was able to refine its understanding of thermal conditions within the school environment, highlighting key factors influencing air quality and comfort. The methodological assumptions made in the PMV-PPD calculations aligned with widely accepted standards in thermal comfort assessments, although future studies could benefit from additional direct measurements, particularly regarding radiant temperatures and dynamic air movement patterns. This would allow for an even more precise evaluation of the interplay between temperature regulation, occupant behavior, and the effectiveness of ventilation strategies in optimizing indoor environmental quality.
To ensure a precise evaluation of indoor thermal comfort conditions, only data corresponding to children’s occupancy hours, from 8:00 to 17:00, were retained. This approach allowed for a targeted assessment of comfort levels during active periods when students and staff are present. Nighttime readings were excluded, as the school remained unoccupied during those hours, making such data irrelevant to the study’s primary objectives.
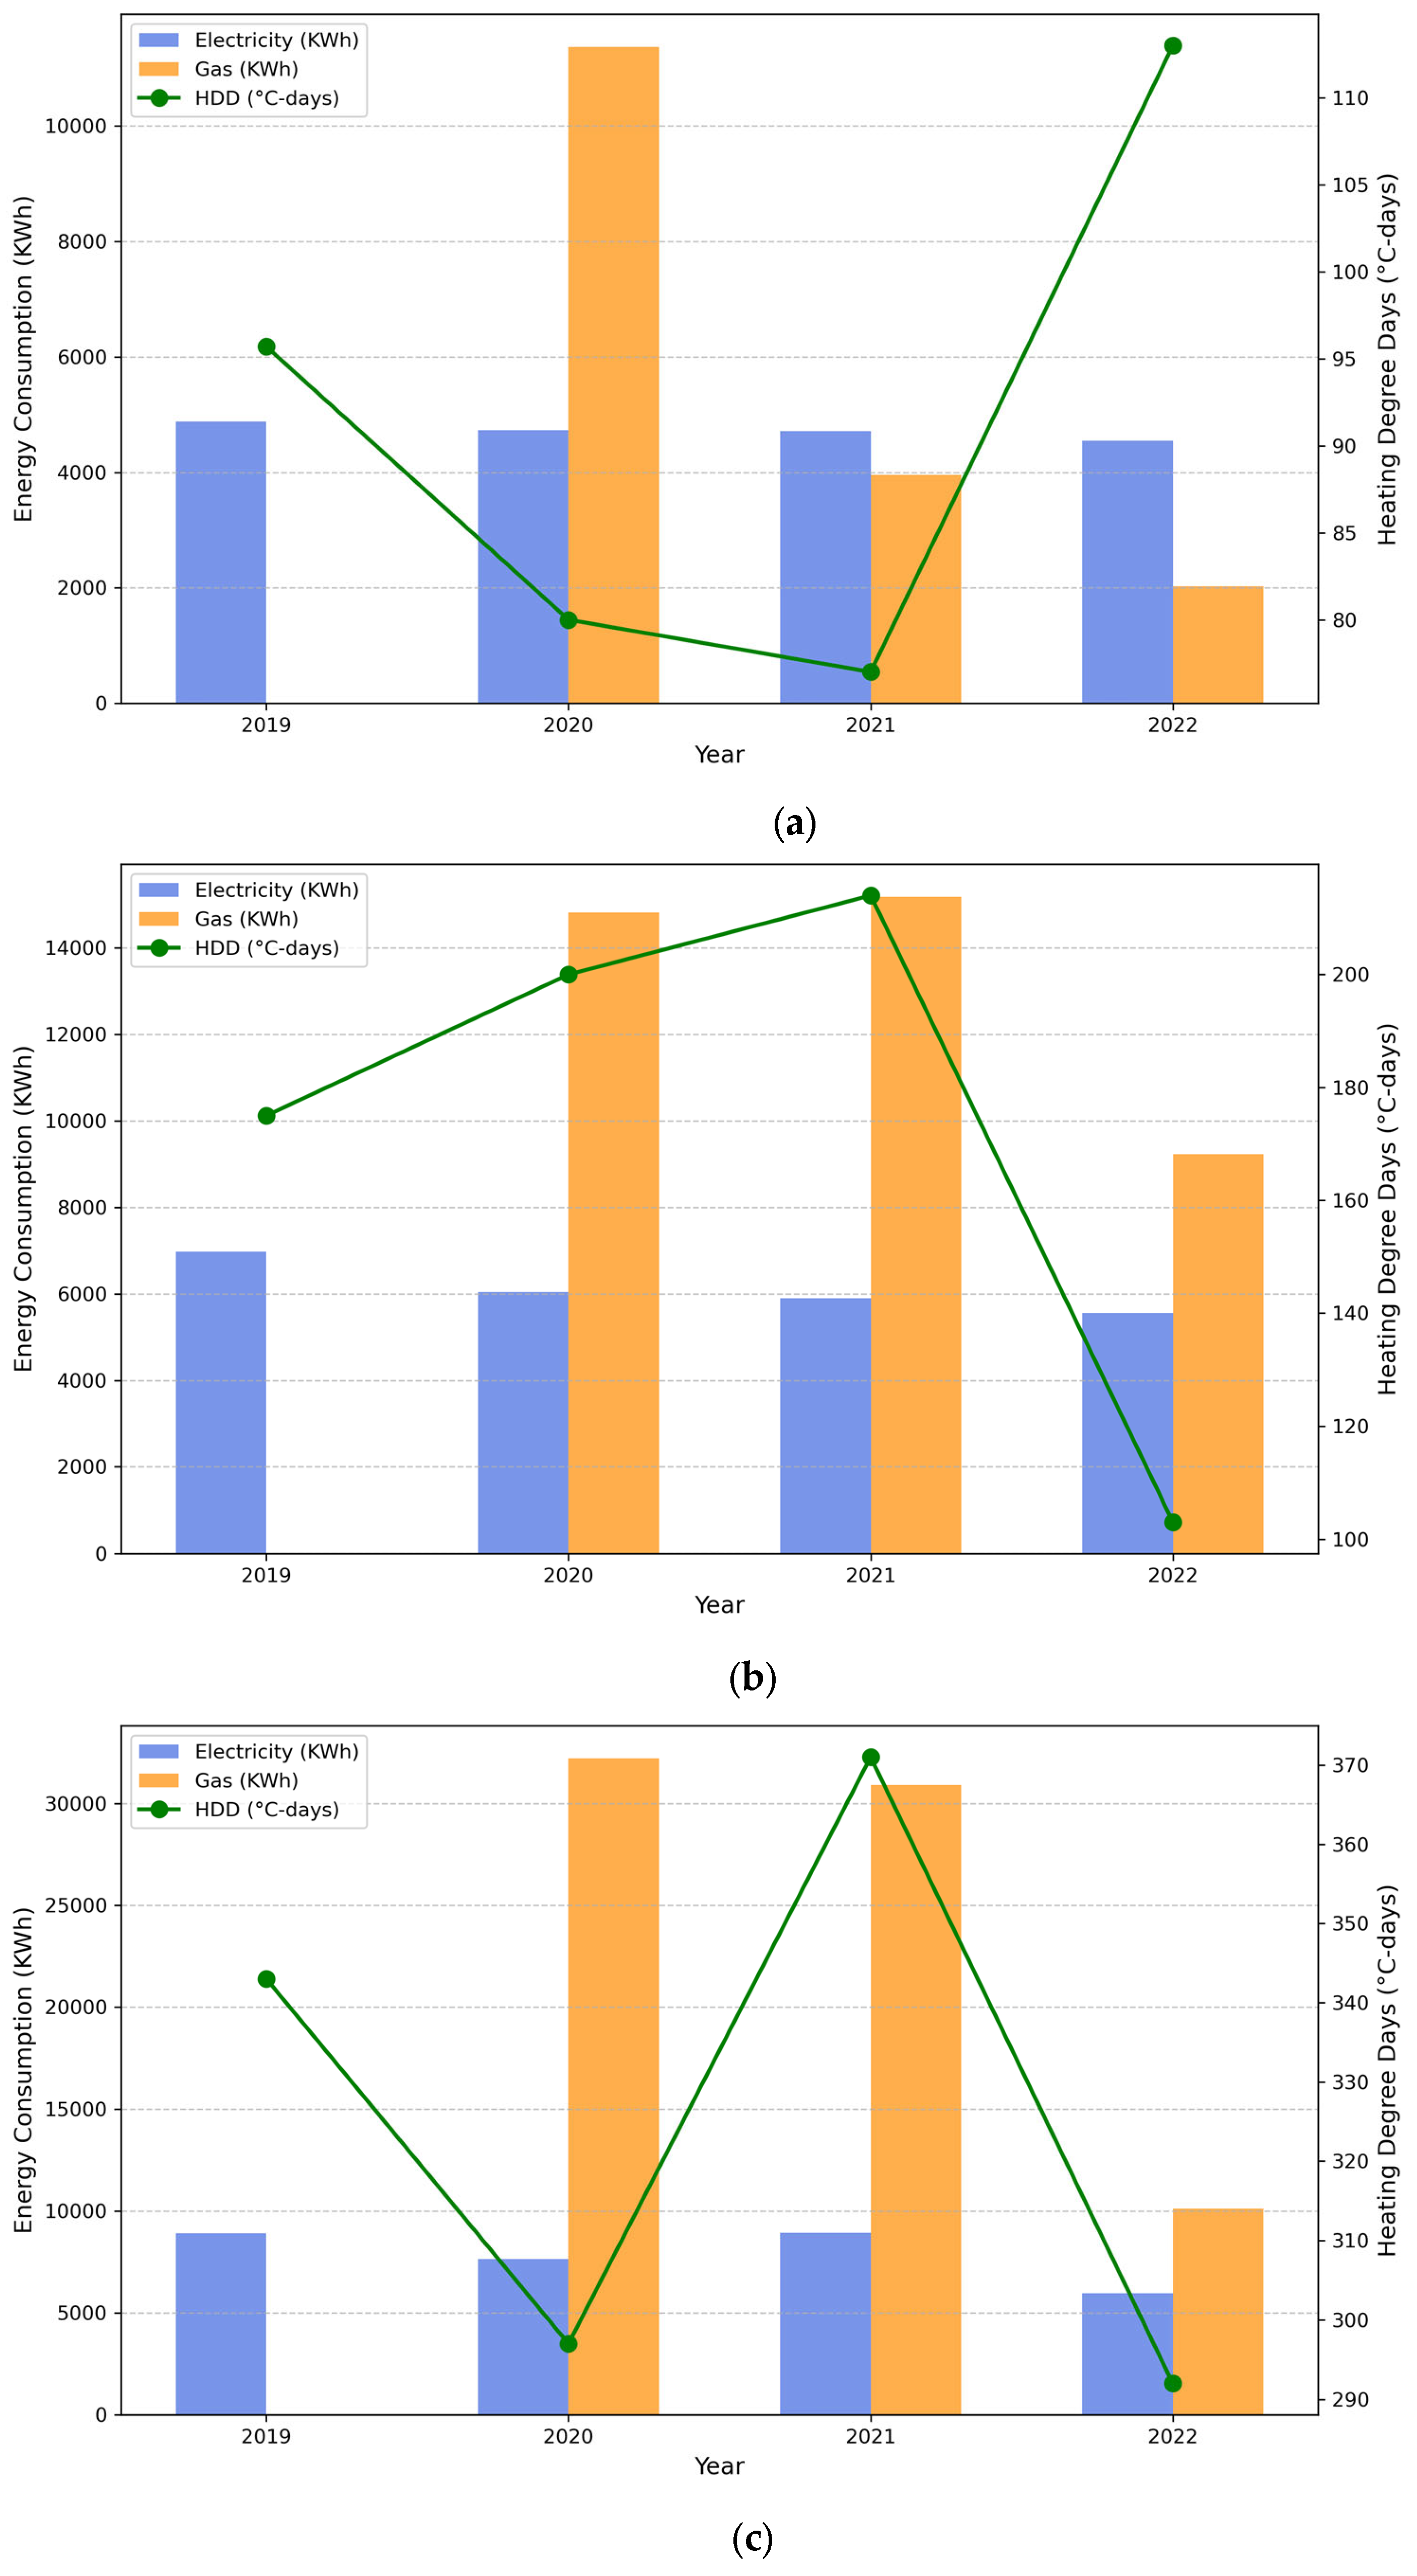
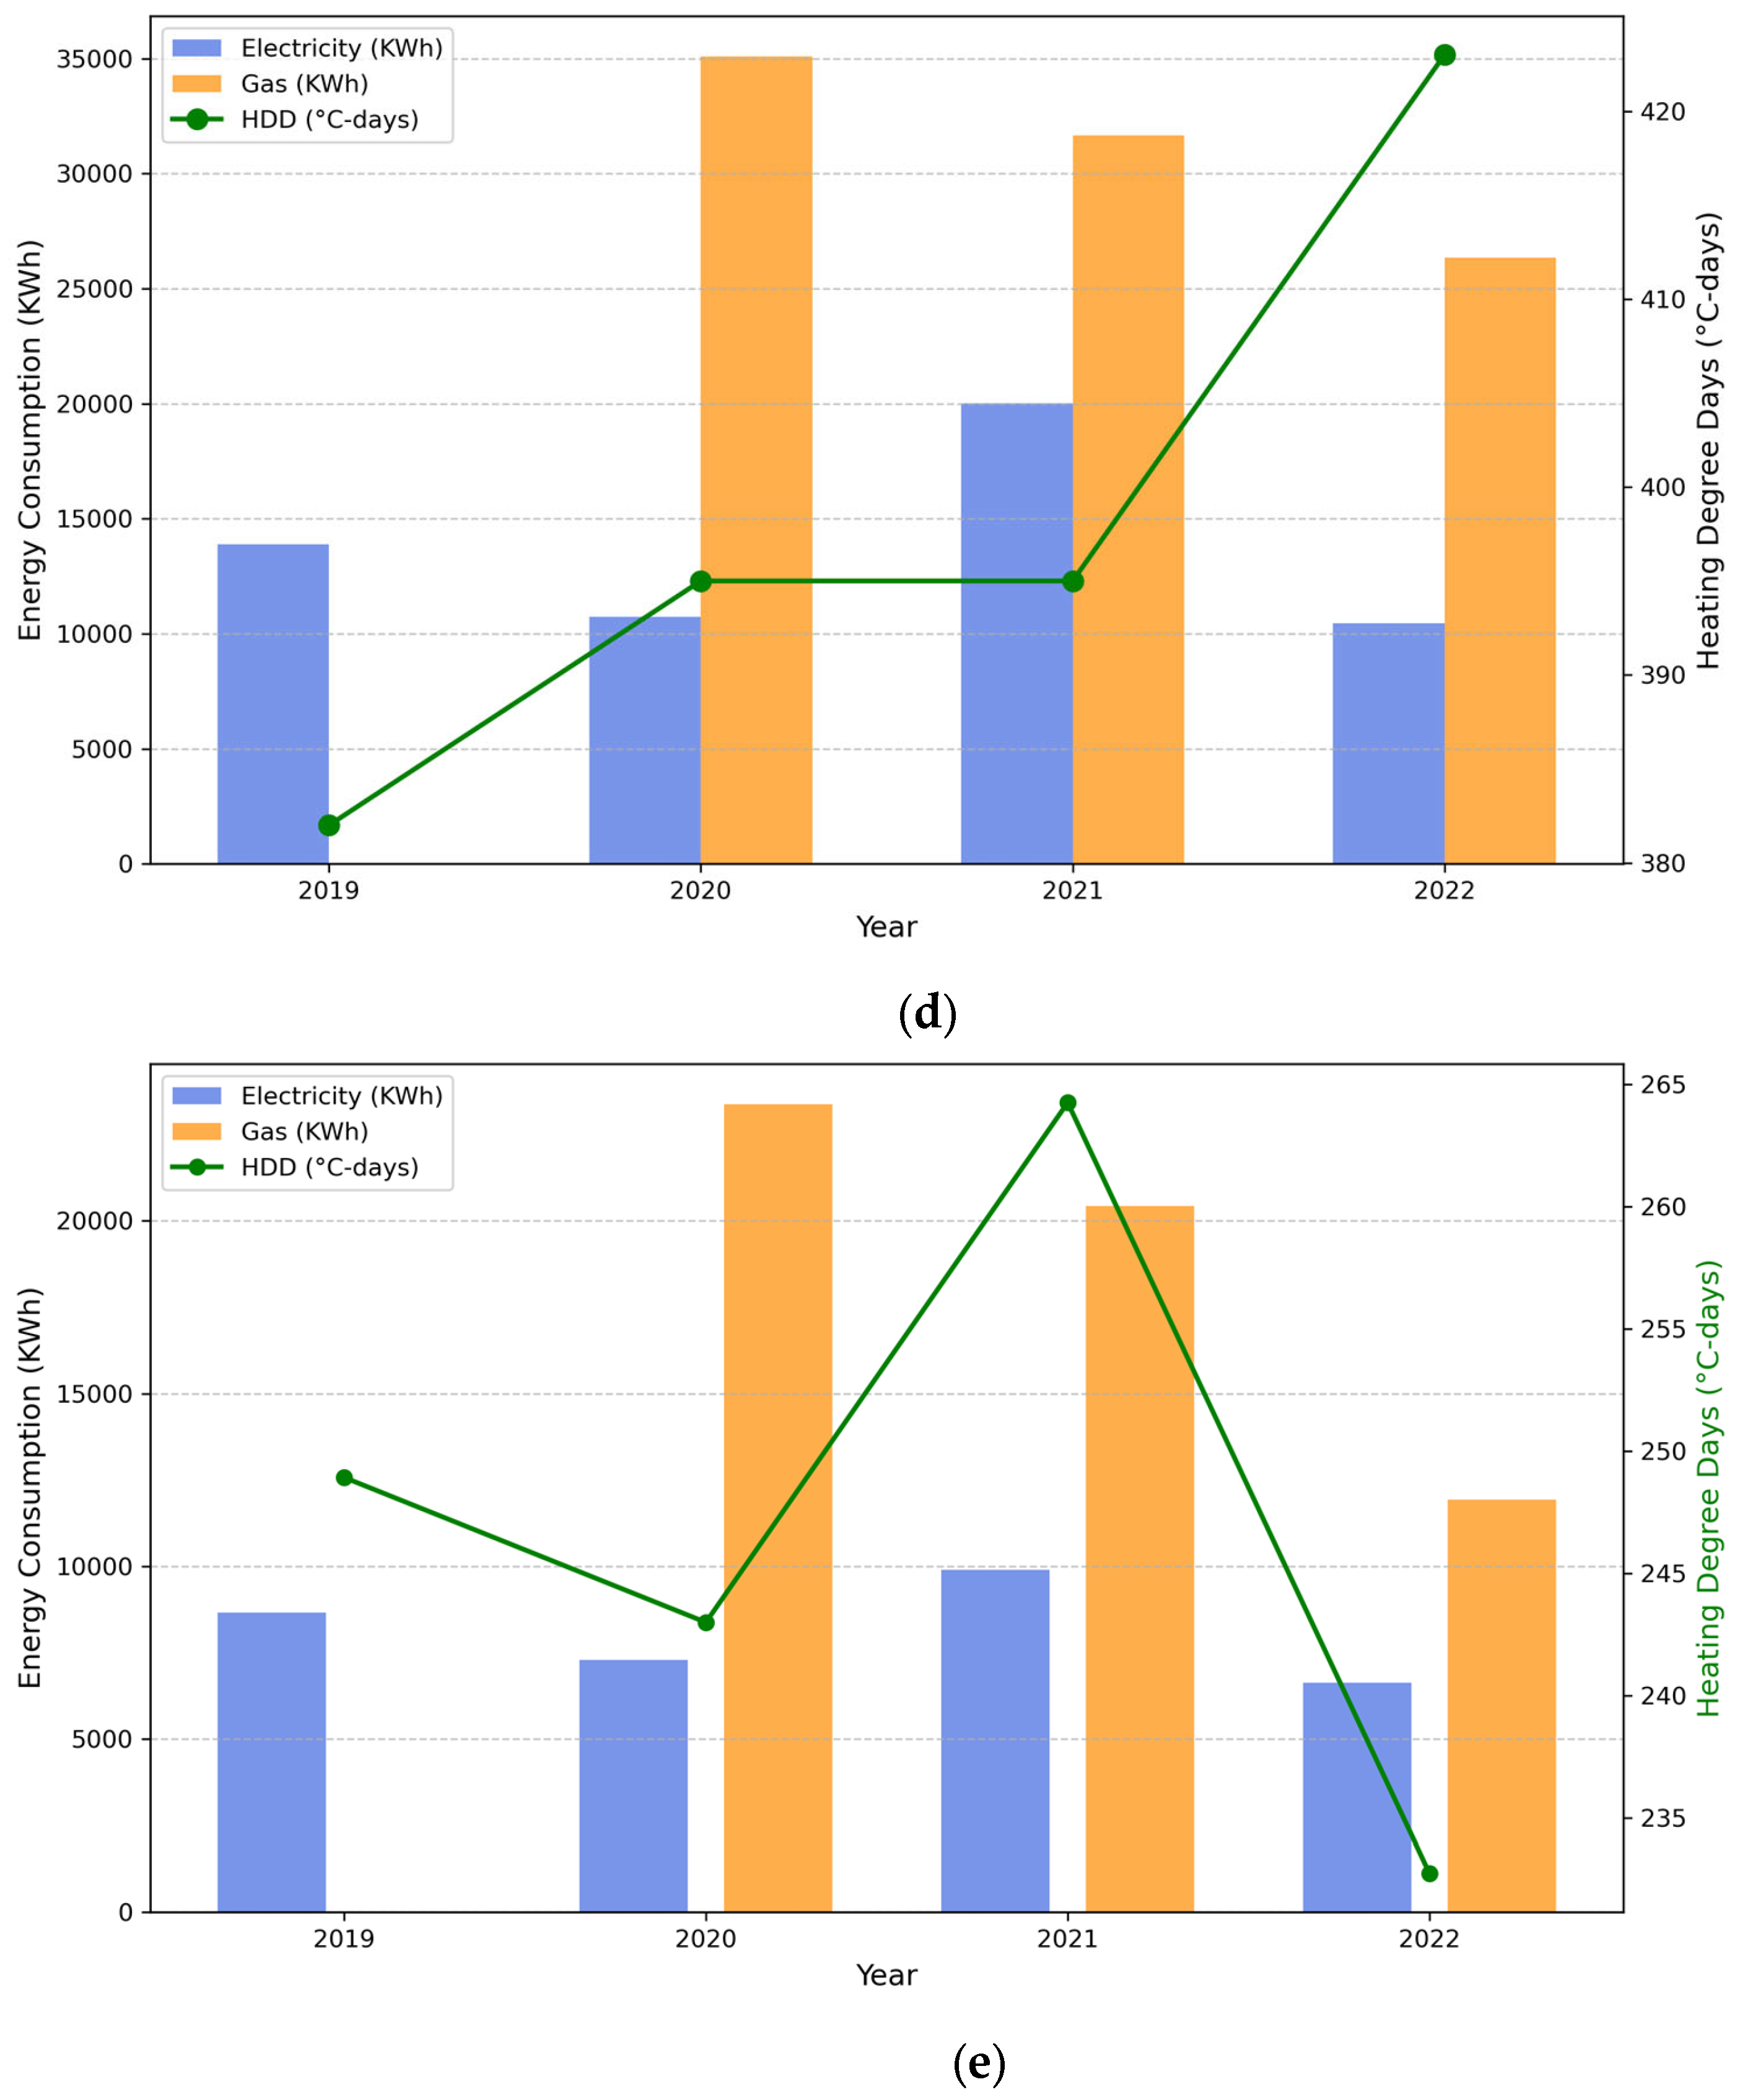
To explain the variations observed in the recorded thermal data, the heating degree days (HDD) indicator was incorporated into the analysis (see
Appendix A and
Appendix B). HDD serves as a fundamental metric in estimating a building’s heating and cooling requirements in response to external climatic conditions. It is calculated as the difference between a reference indoor temperature—typically 18 °C—and the daily average outdoor temperature. Two types of HDD exist: HDD, which applies during colder months when heating demand rises, and cooling degree day (CDD), which becomes relevant in warmer periods when cooling is required. In winter, CDD values remain at zero, as cooling is unnecessary, whereas HDD values increase proportionally to colder temperatures. In summer, the trend reverses, with CDD values rising while heating HDD values remain negligible.
Ideally, a well-designed building should maintain indoor conditions independently of fluctuating weather patterns, and HDD analysis helps verify this principle. To further refine the study’s conclusions, energy consumption data from 2019 to 2022 were examined alongside weather conditions. This comparative evaluation allowed for an assessment of how the renovations influenced energy efficiency by correlating heating and cooling demands with external temperatures.
Beyond HDD, solar gain was identified as a critical factor, particularly due to the building’s extensive glazed area (
Figure 1). The large window surfaces increase exposure to solar radiation, which can significantly influence internal temperatures by introducing excess heat during warmer months. Weather data, such as HDD values and maximum daily irradiance, were sourced from infoclimat.fr, providing insight into external climatic fluctuations. The HDD and CDD were computed using methodologies employed by energy professionals, ensuring their reliability in heating and cooling performance assessments.
Figure 2 depics weather data including oudoor temperature, solar irradiation, HDD and CDD over the summer season (2022 and 2023).
A psychrometric chart was also employed as a fundamental tool in analyzing air conditions and their effects on thermal comfort. This graphical representation consolidates various physical properties, including temperature, relative humidity, enthalpy, and moisture content. By incorporating real-world measurements, it enables the identification of air transformations, such as heating, cooling, humidification, and dehumidification, all of which directly impact occupant comfort levels. The psychrometric chart is essential in the design of efficient heating, ventilation, and air conditioning (HVAC) systems, providing a foundation for optimizing energy consumption while ensuring a stable indoor environment. The greater the deviation from optimal thermal conditions, the higher the energy demand required to restore comfort, emphasizing the importance of preemptive adjustments in building performance strategies.
By integrating HDD analyses, meteorological observations, solar gain considerations, and psychrometric assessments, this study offers a comprehensive evaluation of indoor climate control in a school setting. These findings contribute valuable insight into how renovation efforts influence thermal stability, energy efficiency, and occupant well-being, underscoring the need for continuous refinement of passive and active climate regulation strategies in educational environments.
Through the analysis of specific environmental measurements, including CO2 concentration, it was possible to establish a direct relationship between indoor temperature variations and CO2 accumulation. The correlation observed between simultaneous increases in both parameters confirmed that student occupancy was the primary source of CO2 emissions and thermal load within the building. The presence of students naturally contributed to higher metabolic activity, leading to increased CO2 exhalation and localized heat generation. This effect was particularly pronounced in densely occupied classrooms, where human activity intensified thermal fluctuations and air composition changes.
Beyond validating student occupancy as a key factor in CO2 production, this relationship also served as an indicator of broader ventilation efficiency. A significant and concurrent rise in CO2 levels alongside indoor temperature could point to ventilation system inefficiencies or thermal regulation inadequacies, potentially impairing indoor comfort. If the ventilation system failed to promptly remove excess CO2 or regulate air exchange rates, air stagnation may occur, exacerbating discomfort and reducing overall air quality. Similarly, inadequate temperature control mechanisms, such as improper heating or cooling distribution, may further amplify the problem, leading to excessive warmth or insufficient ventilation in specific zones.
3. Results Analysis
3.1. PPD vs. PMV over the Winter Season
In school environments, where students have varying levels of activity, clothing insulation or thermal resistance, and sensitivity to temperature changes, using both PMV and PPD allows for a more comprehensive thermal comfort assessment. This correlation helps facility managers and designers to optimize HVAC systems to maintain PMV within acceptable limits while minimizing PPD, identify periods of discomfort and adjust ventilation, heating, or cooling strategies accordingly, and ensure a conducive learning environment, as thermal discomfort can negatively impact concentration and cognitive performance.
Figure 3 depicts the predicted percentage dissatisfied (PPD) versus the predicted mean vote (PMV) profiles during some short periods over three winter seasons (2021, 2022, and 2023), covering pre- and post-building renovation periods.
Between 10 and 16 November 2021 (
Figure 3a), prior to renovation, measurement data indicated a slightly cool but generally satisfactory thermal sensation, with PMV values consistently above −0.5. Importantly, nearly all occupants reported satisfaction regarding their thermal environment during this pre-renovation period, reflecting an overall comfortable indoor climate.
A comparative analysis of thermal conditions before and after renovations for the same seasonal period (
Figure 1) revealed a noticeable shift toward a warmer indoor sensation following the interventions. This suggests that building envelope upgrades by adding insulation, and the installation of a new regulation system, have had a measurable positive impact on thermal comfort. However, it is essential to acknowledge that milder climatic conditions in 2022—reflected in the reduced heating degree days (HDD) of 280 °C in November 2022 compared to 372 °C in November 2021—may also have contributed to this improvement. Thus, both the renovation measures and external climatic factors must be considered in assessing the observed temperature changes.
Post-renovation occupant satisfaction rates remained high, albeit slightly reduced compared to the pre-renovation period, with PMV values consistently maintained between −1 and +1. To further evaluate trends over time, an extended measurement period from 23 October to 15 December allowed for a weekly analysis of PPD versus PMV data. This longer observation period effectively captured significant seasonal climate variations in northeastern France, highlighting the progressive decrease in outdoor temperatures as winter approaches.
Despite overall neutral to slightly cool indoor thermal sensations (PMV consistently above −1), a clear correlation emerged between colder external conditions and corresponding cooler indoor sensations. This suggests that external weather fluctuations continued to exert an influence on indoor environments, revealing residual limitations in the building’s thermal resistance and regulation system performance. The findings indicate that while the renovations have enhanced thermal stability, there remains room for further optimization to mitigate sensitivity to outdoor conditions.
Notably, PPD values remained below 20% dissatisfied occupants—frequently under 10%—validating the general effectiveness of the thermal regulation measures in ensuring comfort for the majority of users. Interestingly, when examining weekly data, the coldest outdoor weeks did not consistently correspond to the coolest indoor conditions, suggesting that the renovated building envelope exhibited some buffering capacity against external temperature fluctuations. This observation underscores the effectiveness of the building’s thermal inertia but also highlights the need for additional refinements to enhance insulation and optimize climate regulation systems for even greater resilience against seasonal variability.
Looking forward, further investigation into occupant behavior, HVAC system efficiency, and real-time adaptive thermal controls could provide deeper insight into optimizing indoor comfort. Future studies could also examine how variations in occupant density and activity levels influence thermal perceptions, helping to refine predictive models for improved building performance. Additionally, exploring dynamic insulation strategies and integrating advanced climate-responsive technologies may offer further enhancements in thermal regulation, ensuring long-term sustainability and occupant satisfaction.
3.2. PPD vs. PMV over the Summer Season
Figure 4 illustrates the PPD vs. PMV across selected short intervals during two consecutive summer seasons (2022 and 2023).
Between 29 June and 17 August 2022 (
Figure 4a–i), analysis of the PPD vs. PMV profiles revealed notable thermal sensation variability, both between weeks and within individual weeks. More than half of the observed weeks demonstrated significant deviations from the ASHRAE Standard 55—American Society of Heating, Refrigerating, and Air-Conditioning Engineers (ASHRAE)—Thermal Environmental Conditions for Human Occupancy [
34]—recommended comfort range (−0.5 to +0.5), leading to PPD satisfaction rates frequently falling below 50%. These findings indicate periods of thermal discomfort that require further investigation.
Considerable intra-week fluctuations were recorded, with PMV values spanning from −2 to +3—an atypical range that suggests inconsistencies in thermal regulation. Particularly in early July, several negative PMV values emerged, raising concerns regarding measurement reliability and potential anomalies in recorded data. Interestingly, meteorological indicators, such as degree days (HDD and CDD) and solar radiation, exhibited less dramatic variations, implying that external climatic factors alone may not fully account for these observed inconsistencies. Instead, ongoing construction activities during this timeframe likely influenced thermal conditions through increased human presence and operational disruptions. A comparative assessment of the post-renovation period from May to June 2023 (
Figure 4j–u) illustrated a marked improvement in thermal comfort. With students present and both the newly implemented regulation systems and night ventilation fully operational, PMV indices predominantly remained within the −1 to +1 range, while PPD values rarely exceeded 20%. This demonstrated substantial progress toward achieving stable and satisfactory indoor conditions. Despite this advancement, persistent week-to-week variations suggest that further optimization is warranted, particularly in refining thermal regulation responsiveness to daily environmental changes.
Additionally, strong diurnal variations indicated evolving thermal sensations throughout the day, reinforcing the presence of microclimate conditions within the building rather than a uniform thermal environment. This heterogeneity suggests localized influences—such as varying occupancy densities, heat gains from equipment usage, and differences in air circulation patterns—that contributed to the observed inconsistencies. Future studies could focus on spatial mapping of indoor temperatures to pinpoint specific areas requiring targeted intervention.
Finally, measurements from two distinct probes exhibited consistent data patterns, strengthening confidence in the reliability of recorded results. However, addressing the remaining thermal variability will require deeper exploration into dynamic insulation strategies, adaptive regulation mechanisms, and occupant behavior patterns. Further research into integrating predictive climate-responsive controls and real-time thermal monitoring could enhance stability, ensuring consistently comfortable indoor conditions across different seasons and usage patterns.
3.3. Temperature and Relative Humidity
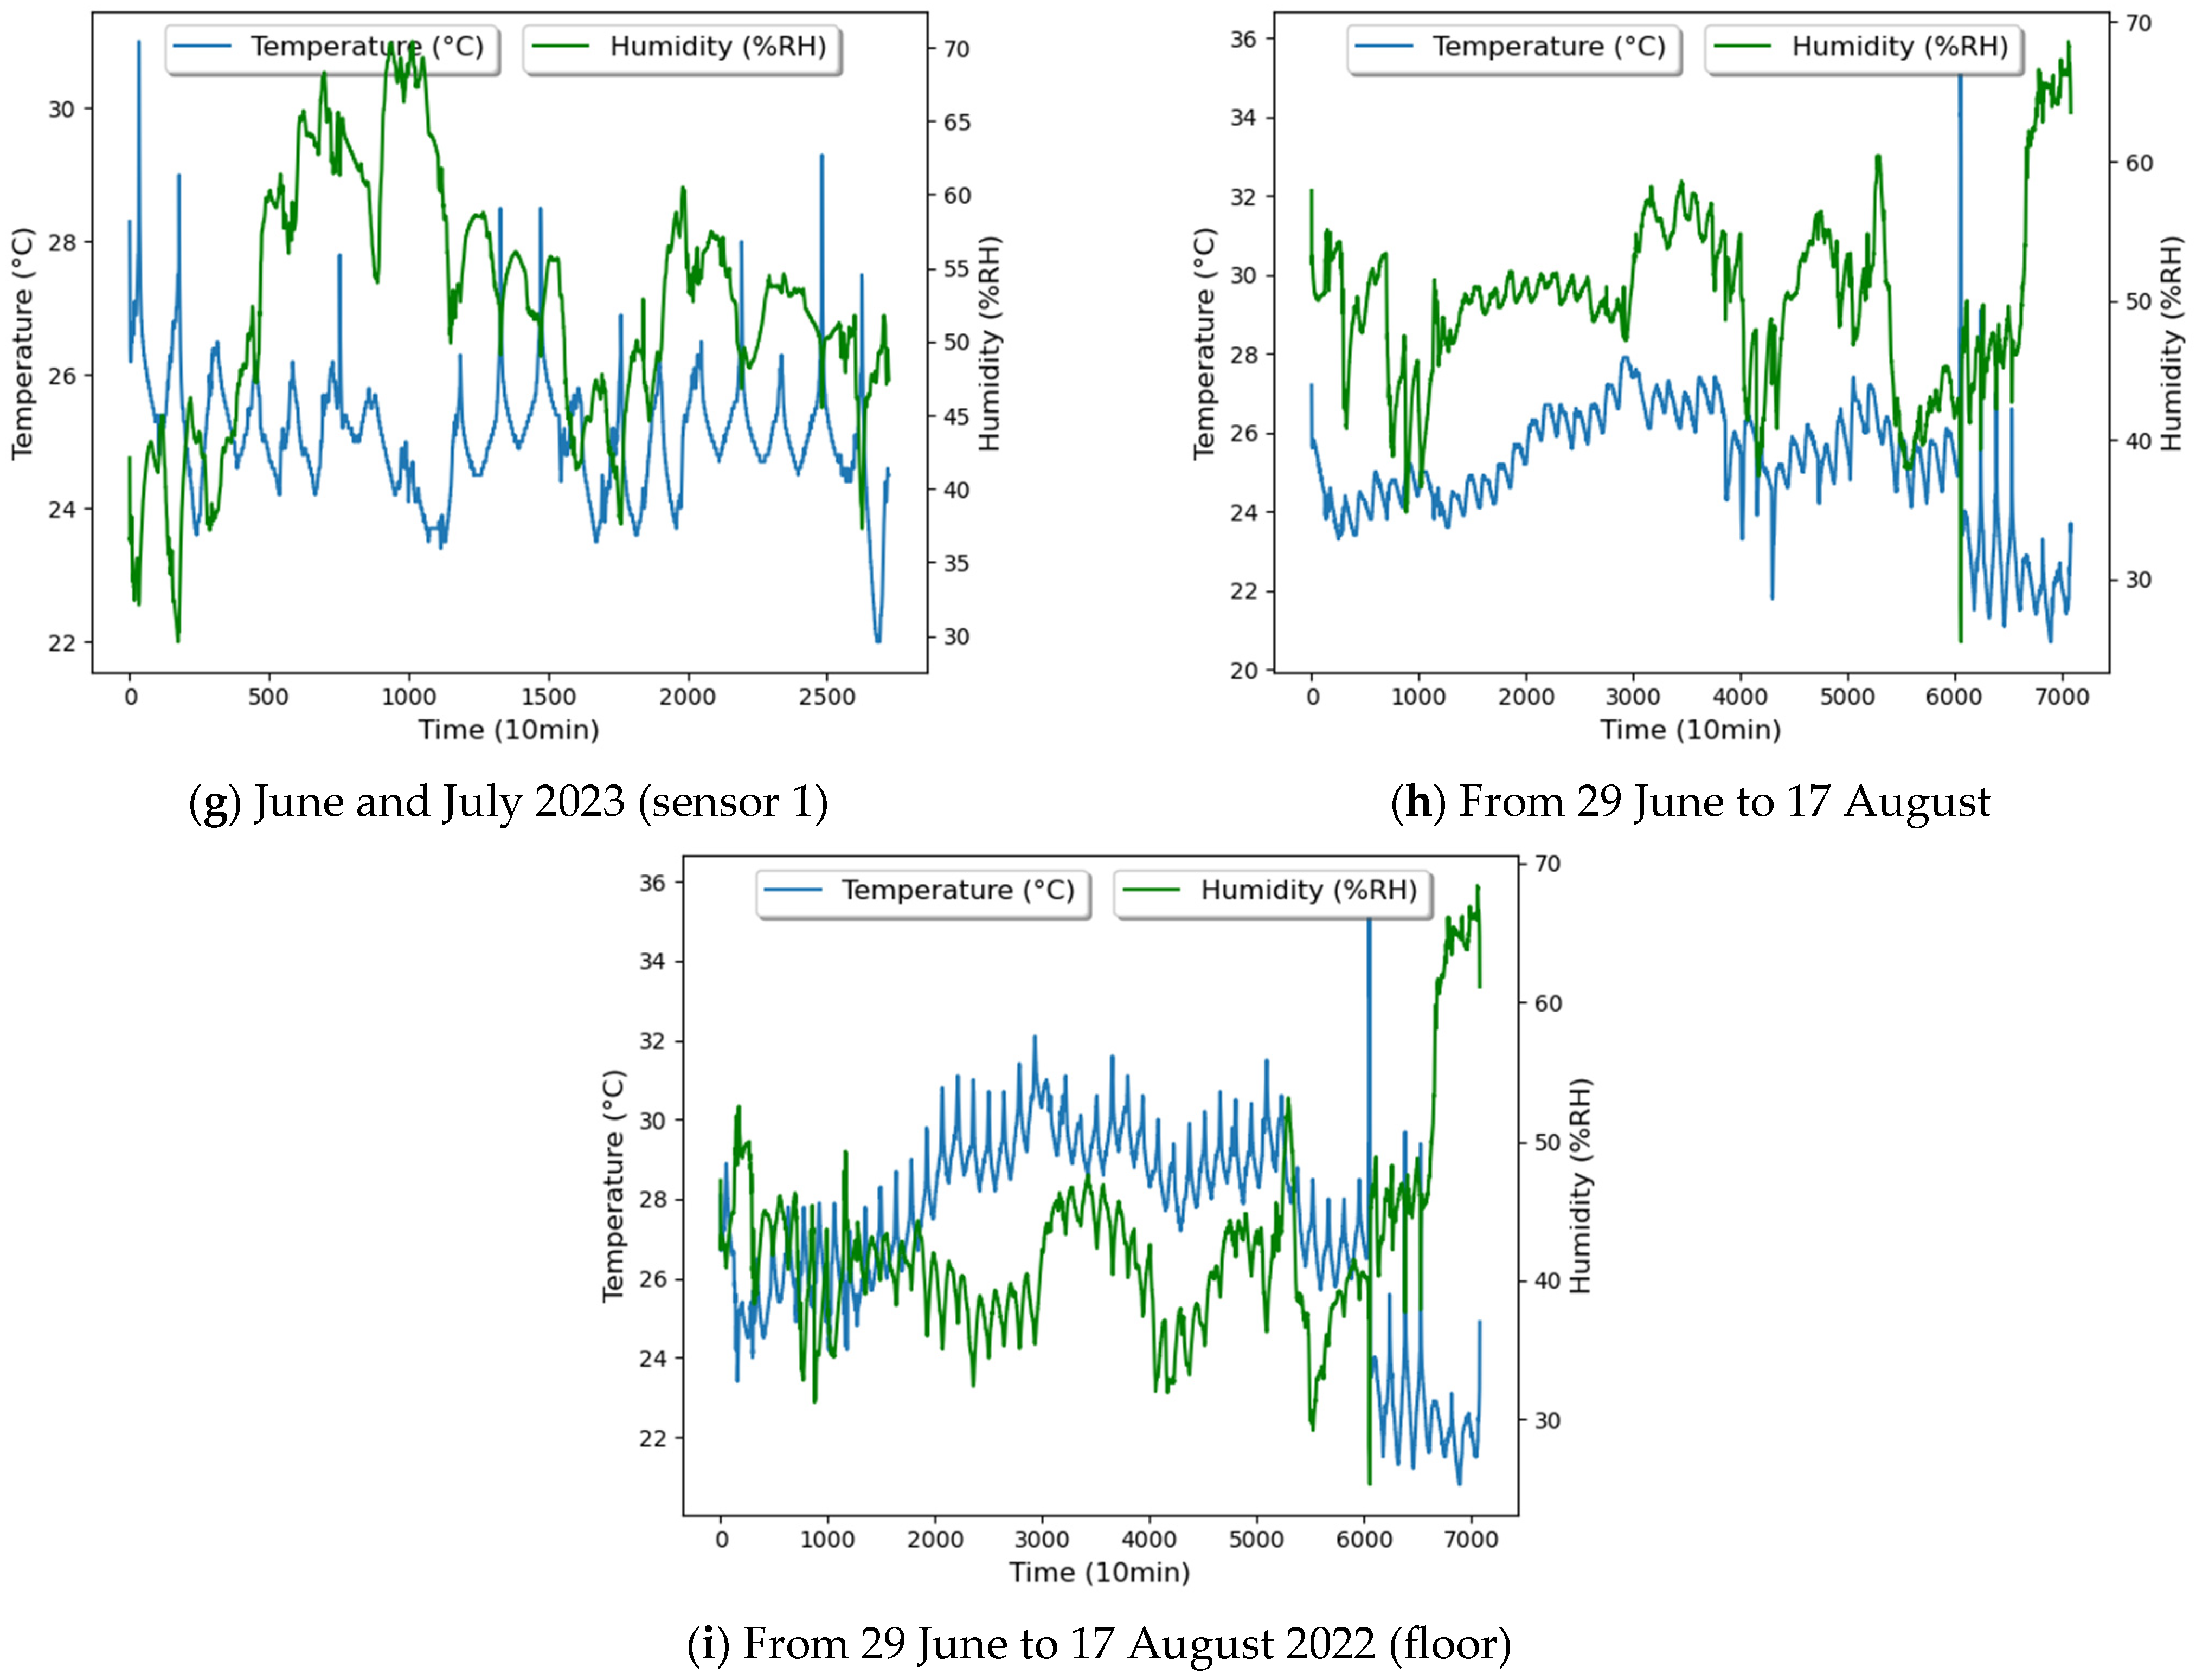
Figure 5 shows indoor air temperature and relative humidity profiles under winter and summer conditions.
Throughout the winter months, indoor temperatures remained relatively high, fluctuating between 20 and 25 °C, ensuring consistent occupant comfort (
Figure 5a–c). These results highlight the effectiveness of the post-renovation heating system in maintaining stable indoor thermal conditions. However, the relatively elevated temperatures suggest potential opportunities for further heating optimization, particularly in terms of energy efficiency. Implementing adaptive heating strategies or more precise regulation could enhance performance while reducing unnecessary energy consumption.
Relative humidity largely remained within comfortable ranges (30–60%), contributing to a pleasant indoor environment. However, an atypical peak of 20% recorded in December 2023 warrants further investigation. Low relative humidity levels can lead to discomfort, including dry-air-related issues, such as irritation of the skin, throat, and respiratory system. This anomaly suggests the need for refining humidity control mechanisms, possibly through enhanced ventilation strategies or automated humidity regulation.
The upper floor experienced pronounced overheating during the summer of 2022, with frequent recorded temperatures reaching 30 °C (
Figure 5h,i). This situation presents an interesting case, as external meteorological factors alone do not fully account for the observed thermal conditions. The unique circumstances of summer 2022—characterized by ongoing construction activity and student absence—likely contributed to these thermal anomalies. Reduced occupancy may have altered natural ventilation patterns, while construction operations may have introduced additional heat sources, exacerbating indoor temperatures.
Despite the overheating challenges, relative humidity remained satisfactory within the recommended range of 30–60%, ensuring acceptable air quality. However, these findings indicate a need for further refinements in passive cooling strategies, such as improved shading, dynamic ventilation adjustments, or the integration of more efficient thermal insulation for upper floors. Future studies could also assess the impact of building orientation and solar exposure to optimize cooling mechanisms.
With fully operational thermal regulation systems and student occupancy reinstated (
Figure 5d–g), indoor environmental conditions demonstrated notable improvements during the post-renovation spring period (May–June 2023). Relative humidity consistently remained within optimal ranges (30–60%), promoting a comfortable indoor atmosphere. Recorded temperatures fluctuated between 21 and 28 °C, predominantly clustering around 25 °C.
While these values were well-suited for summer, they appeared slightly elevated for late spring, suggesting potential overheating challenges due to solar gain. The building’s extensive glazing (44 m2) likely played a significant role in increasing indoor temperatures by allowing substantial sunlight penetration, particularly in spaces with direct floor and wall exposure. This indicates a need for further refinements in solar management strategies, such as incorporating external shading devices, heat-reflective coatings, or smart blinds to mitigate the excessive heat buildup.
Additionally, long-term thermal monitoring across seasons could offer deeper insights into optimizing building performance. Future research should consider dynamic indoor–outdoor heat exchange modeling, integrating advanced adaptive cooling technologies, and assessing occupant feedback to refine thermal regulation strategies further.
3.4. Givoni Diagram
The psychrometric diagram is a valuable tool for evaluating thermal comfort in schools, particularly when used alongside the Givoni diagram. The psychrometric chart provides a detailed representation of air properties, including temperature, relative humidity, among others—allowing for precise analysis of environmental conditions. When applied to school settings, it helps assess whether indoor spaces fall within the thermal comfort zone, ensuring optimal learning environments. The Givoni diagram, on the other hand, focuses on passive design strategies by correlating climate data with architectural solutions. By integrating both tools, researchers and designers can determine whether natural ventilation, shading, or thermal mass adjustments are necessary to maintain comfort levels. This combined approach enables a more comprehensive understanding of how external climatic conditions influence indoor environments, leading to informed decisions on building design and energy efficiency.
Figure 6 illustrates the Givoni diagram with a focus on the thermal comfort zone and the zone around it, suggesting to use natural ventilation to improve thermal sensation, as all the data points remained in such two zones.
Measurements indicated that nearly all recorded data points fell within the thermal comfort zone, demonstrating a highly favorable outcome where environmental conditions remained consistently optimal throughout both winter and summer periods (see
Section 3.1 and
Section 3.2).
However, the interval from 29 June to 17 August 2022 (
Figure 6g–j) exhibited the highest number of outlier points beyond the comfort zone, coinciding precisely with the renovation phase. This period was marked by notable instability in the PPD-PMV indices, as reflected in the PPD-PMV plots (
Figure 4a–i,
Section 3.2), where substantial thermal sensation variations were recorded. The disruptions likely stemmed from temporary modifications in airflow dynamics, insulation properties, or HVAC performance, resulting in a transient decline in thermal comfort. In contrast, the May–June 2023 period (
Figure 6e,f), characterized by children occupancy, maintained conditions predominantly within the comfort zone, albeit close to its upper threshold. Several outlier points were detected, most likely attributable to measurement inconsistencies or localized microclimatic influences, which may include occupant density, ventilation patterns, or the thermal inertia of surrounding materials. Winter conditions, on the other hand, proved to be particularly satisfactory, as temperatures remained slightly cooler yet well within acceptable comfort limits, reinforcing the stability of environmental control mechanisms during colder months. These findings underscore the resilience of thermal conditions in the observed space, with seasonal fluctuations exerting a minimal impact on overall comfort levels.
3.5. Indoor Air Quality
Overall, the vast majority of CO
2 concentrations remained highly satisfactory, consistently staying below 800 ppm (
Figure 7), indicating that indoor air quality remained within optimal limits throughout the observation period. This threshold suggests effective ventilation control, ensuring that accumulated CO
2 levels did not reach discomforting or health-affecting concentrations. A clear correlation between temperature and CO
2 levels was observed, reinforcing the premise that children occupancy served as a primary factor influencing CO
2 accumulation. The metabolic activity of students, combined with varying classroom densities and ventilation patterns, contributed to dynamic fluctuations in CO
2 concentration throughout the day. Nevertheless, the ventilation system demonstrated remarkable efficiency, as evidenced by its ability to regulate air exchange rates and maintain CO
2 concentrations consistently below 800 ppm, even during periods of elevated temperatures. This performance suggests that ventilation strategies, including natural airflow mechanisms and mechanical intervention, function optimally to offset increased CO
2 emissions linked to human presence and environmental thermal conditions. The stability of CO
2 levels, despite temperature variations, underscores the effectiveness of air renewal processes in mitigating potential air stagnation risks. Moreover, the findings highlight the importance of maintaining high ventilation rates in school environments to sustain cognitive performance, concentration levels, and overall student well-being, since prolonged exposure to elevated CO
2 levels—even within non-critical thresholds—can subtly impact cognitive efficiency. The results reinforce the necessity of adaptive ventilation management, ensuring that CO
2 levels remain well-regulated despite seasonal temperature shifts and fluctuations in occupancy density.
A practical example reinforcing this observation can be drawn from a monitored classroom in a primary school located in Troyes, France [
25], during the spring term. Despite full occupancy of 25 students and external temperatures exceeding 25 °C, CO
2 levels consistently remained below 750 ppm throughout the day. This was achieved through a combination of automated window actuators and ceiling-mounted mechanical ventilation units that adjusted airflow based on real-time CO
2 sensor readings. The system’s responsiveness ensured that even during peak activity periods—such as after lunch or during group exercises—air quality remained within optimal thresholds. This case exemplifies how integrating smart ventilation technologies with occupancy-based control strategies can effectively maintain indoor air quality, supporting both health and cognitive performance in educational settings.
4. Discussion
The findings of this study confirmed that energy renovations significantly enhanced both thermal comfort and IAQ within the school building. Prior to these renovations, winter conditions were already satisfactory; however, the interventions allowed for a reduction in temperature setpoints while sustaining a high level of thermal comfort.
Despite these advancements, overheating issues emerged during the summer, with noticeable temperature spikes occurring as early as May. This overheating was primarily attributed to the building’s extensive glazed surfaces, which facilitated considerable solar heat gain. The impact of this excessive solar exposure was particularly evident when analyzing continuous daily temperature plots, as opposed to time-limited readings restricted to school hours (8:00–17:00). These elevated temperatures predominantly manifested in the evening, after students had vacated the premises, mitigating daytime discomfort in classrooms.
Interestingly, an examination of PPD–PMV correlations (
Figure 4j–u) revealed minimal indications of perceived discomfort due to excessive temperatures, suggesting that the thermal peak occurred primarily after 17:00. This phenomenon appeared to be effectively managed through night overventilation, which facilitated the dissipation of stored thermal energy accumulated throughout the day. By strategically leveraging cooler nighttime temperatures, this passive cooling strategy contributed to enhanced daytime thermal stability, reducing excessive heat exposure during school hours and effectively shifting the discomfort peak to the evening.
The effectiveness of this cooling mechanism was further reinforced by the use of bio-based material insulation, such as wood wool, which exhibits superior thermal inertia when compared to conventional mineral-based insulation, such as fiberglass. This increased thermal inertia attenuated internal temperature fluctuations by slowing heat transfer, thereby stabilizing indoor conditions and enhancing thermal resiliency [
35]. When integrated with night overventilation, this building envelope retrofit strategy further delayed the progression of heat accumulation, thereby refining the building’s overall thermal performance.
Regarding indoor air quality, the installation of the air handling unit (AHU) played a crucial role in maintaining excellent IAQ. This system allowed for sufficient air exchange while ensuring that windows remained closed—an essential factor, as windows were previously relied upon for ventilation. By implementing mechanically controlled air circulation, the AHU significantly improved air quality consistency, reducing reliance on occupant-driven ventilation behavior while minimizing exposure to external pollutants.
These findings emphasized the importance of integrating passive cooling strategies, high-inertia insulation materials, and advanced ventilation systems in energy-efficient school environments. The combined effects of night overventilation and hemp-based insulation illustrated how thermal comfort can be optimized without excessive mechanical cooling dependence, ensuring both sustainability and cost efficiency in school facility management.
5. Conclusions and Work Limitations
This study confirmed that the energy renovations successfully achieved two critical objectives: maintaining optimal winter thermal comfort despite reduced heating setpoints and ensuring exceptional indoor air quality through the air handling unit, which marks a significant improvement compared to the pre-renovation situation that relied on natural window ventilation. The findings validated the effectiveness of the technical solutions implemented, particularly the semi-rigid hemp exterior insulation and the north/south differential regulation, which played a key role in stabilizing thermal conditions and enhancing energy efficiency.
However, as highlighted in the literature review, the PPD-PMV index presented inherent limitations when assessing children’s thermal comfort, given their unique metabolic characteristics compared to adults. This methodological bias could result in discrepancies between objective thermal measurements and the students’ actual comfort perception, underscoring the need for more refined thermal comfort models tailored specifically to children. Additionally, summer overheating, while largely occurring outside school occupancy hours, remains a concern. With climate change contributing to rising temperatures and more frequent heatwaves, this issue could become more problematic in the future. The management of solar gain, therefore, emerged as a critical aspect for further optimization, requiring improved shading strategies and advanced passive cooling techniques to prevent excessive heat accumulation within indoor spaces.
The study’s findings must also be interpreted in light of certain limitations. The precise placement of environmental sensors within classrooms was not specified, meaning that spatial variations in thermal and air conditions could have influenced recorded data. For instance, sensors positioned near windows or external walls may reflect different thermal dynamics compared to those located at the center of the room. Additionally, while meteorological data were sourced from a reliable station located 27 km away, some key parameters, such as solar radiation, wind speed, and atmospheric pressure, were not analyzed in detail. Since solar radiation is a critical determinant of overheating, and atmospheric conditions influence ventilation performance, a more comprehensive integration of meteorological variables would enhance the robustness of future thermal comfort assessments. Another important consideration is the building’s thermal inertia, which plays a crucial role in temperature regulation but was not explicitly quantified. Factors such as construction materials, wall thickness, and thermal mass effects—especially in relation to summer overheating—remain unmeasured despite the apparent effectiveness of the night overventilation strategy. Assessing thermal inertia in greater detail would allow for more precise optimization of passive cooling mechanisms and overall thermal stability.
To recall, to the question of how do different renovation strategies impact IEQ and energy efficiency of school buildings across various climates and environments, renovation strategies, such as insulation upgrades, window replacements, lighting modernization, and HVAC improvements, significantly enhanced IEQ and energy efficiency in schools, though their effectiveness varied by climate. In colder regions, thermal insulation and airtightness reduced heat loss and energy use, while in warmer climates, solar shading and natural ventilation mitigated overheating. Smart ventilation systems, like demand-controlled ventilation, improved air quality by adjusting airflow based on occupancy and CO₂ levels. Case studies showed that combining envelope improvements with efficient lighting and heating systems can reduce energy consumption by over 45% while maintaining optimal IEQ, especially when tailored to local environmental conditions.
When it comes to the specific challenges and limitations of current IEQ and energy-efficiency standards in older school buildings, older school buildings face structural and regulatory barriers that hinder compliance with modern IEQ and energy-efficiency standards. Many lack the infrastructure for advanced HVAC systems or real-time monitoring, making retrofitting complex and costly. Budget constraints often limit the scope of renovations, while existing standards may not fully address the unique needs of aging educational facilities. Additionally, efforts to improve energy efficiency—such as sealing buildings—can inadvertently reduce ventilation, compromising air quality, unless balanced with mechanical systems. These limitations underscore the need for adaptive, cost-effective renovation strategies that consider both technical feasibility and the well-being of students and staff.
For future school renovations, integrating child-specific thermal comfort models, enhancing passive overheating prevention methods through solar shading and thermal mass utilization, and optimizing ventilation–thermal regulation coupling would be key priorities. A systemic approach combining these strategies would ensure that energy efficiency, thermal comfort, and indoor air quality remain aligned, contributing to the development of healthier, more sustainable learning environments capable of adapting to future climatic challenges.


