Article

From Perception to Sustainability: Validating a Tool to Assess Students’ Awareness of the Ecological, Utilitarian, and Cultural Roles of Plants

by
Sena Seçil Akpınarlı
* and
Pınar Köseoğlu
Department of Biology Education, Faculty of Education, Hacettepe University, Ankara 06800, Türkiye
*
Author to whom correspondence should be addressed.
Sustainability 2025, 17(12), 5540; https://doi.org/10.3390/su17125540
Submission received: 21 May 2025 / Revised: 7 June 2025 / Accepted: 12 June 2025 / Published: 16 June 2025

Abstract

:
This study presents the development of the Plant Perception Scale (PPS), a multidimensional tool designed to assess high school students’ awareness of the ecological, utilitarian, and cultural significance of plants. Positioned within the broader goal of Education for Sustainable Development (ESD), the scale aims to identify perception gaps that may hinder students’ engagement with biodiversity and sustainability. Following a rigorous development process—including item generation, expert review, pilot testing, and psychometric validation—the final 21-item scale revealed a three-factor structure: Ecological Awareness and Sustainability Perception (12 items), Utility-Oriented Plant Perception (5 items), and Cultural and Aesthetic Perception (4 items). Exploratory Factor Analysis confirmed data suitability (KMO = 0.920; Bartlett’s χ2(210) = 2245.215, p < 0.001). Confirmatory Factor Analysis supported the structure with strong fit indices (χ2/df = 2.204; CFI = 0.949; RMSEA = 0.055). Internal consistency was high (Cronbach’s α = 0.88 for the total scale; factor α values ranged from 0.823 to 0.939). The PPS contributes to sustainable education by offering a reliable framework to evaluate plant-related awareness among adolescents and can serve as a diagnostic and pedagogical tool to guide curriculum development and educational interventions in support of the SDGs.

1. Introduction

Plants play an essential role in sustaining life on Earth and in supporting sustainable development [1]. They produce a significant portion of the planet’s atmospheric oxygen [2], regulate the carbon cycle [3], serve as primary producers in food webs [4], and provide essential ecosystem services such as food, medicine, fuel, and raw materials [5]. These contributions place plants at the core of ecological systems and link them directly to global sustainability goals, particularly Sustainable Development Goal (SDG) 15: Life on Land, which emphasizes the protection, restoration, and promotion of biodiversity. Despite their vital importance, plants are often overlooked in education and everyday life—a phenomenon known as plant blindness [6]. In response, researchers have proposed the more educationally constructive term plant awareness disparity [7], which frames this issue not as a fixed deficiency but rather as a modifiable gap in attention, knowledge, and value attribution [8]. The dimensions of this disparity—attentional engagement, emotional interest, conceptual knowledge, and relative preference—reflect broader educational competencies aligned with Education for Sustainable Development (ESD) [9,10], particularly in cultivating ecological literacy, empathy, and systems thinking in learners [11].
In recent years, research in plant neurobiology and inter-plant communication has further challenged the traditionally anthropocentric view that separates animals and plants. Studies suggest that plants can perceive environmental stimuli, exhibit adaptive behaviors, and even signal to each other through chemical and electrical means [12,13]. These emerging insights support a more integrated understanding of life and cognition, reinforcing the argument that plants deserve greater representation in both science education and broader cultural discourse. Including such perspectives not only complements ecological and educational goals but also broadens the conceptual foundation of plant perception.
Numerous studies have shown that both children and adolescents tend to favor animals over plants in educational settings, often failing to recall plant species or understand their ecological functions [14,15,16]. Wandersee et al. [6], for example, found that even pre-service biology teachers predominantly named animals when asked to list living organisms. Such findings point to a systemic bias in biology education and highlight a gap in the implementation of SDG 4.7, which calls for quality education that promotes sustainable development, biodiversity literacy, and appreciation of cultural diversity [17]. If learners are not equipped with awareness and appreciation of plant life, education risks failing its transformative role in sustainability.
Beyond their ecological functions, plants are deeply embedded in cultural, aesthetic, and symbolic systems. They appear in mythology, religion, folklore, art, and community traditions, often carrying meanings tied to identity and heritage [18]. Yet this cultural connection is deteriorating, particularly among younger generations [19,20] threatening not only biodiversity but also biocultural diversity—a concept recognizing the interdependence of ecological and cultural systems [21]. Education for Sustainable Development (ESD) aims to empower learners to make informed decisions and responsible actions for environmental integrity, economic viability, and a just society, for present and future generations [11,22]. It encompasses learning content and outcomes, pedagogy, and the learning environment and is rooted in values such as justice, equity, and cultural diversity. Within the framework of ESD, integrating cultural aspects into environmental education enhances relevance, accessibility, and student engagement, and directly supports SDG 4.7’s call for inclusive and culturally sensitive education.
Educational strategies that target plant awareness disparity often reflect the transformative pedagogies promoted by ESD [23]. These include hands-on learning (e.g., school gardens), culturally relevant species use [24], nature walks [25,26], and innovative projects like the “Pet Plant Project” [27]. More recently, digital tools such as mobile apps and game-based technologies have demonstrated promise in increasing student motivation and engagement with plant-focused content [28,29]. These approaches are aligned with the vision of ESD to foster not only knowledge but also values, attitudes, and behaviors required for sustainable living [22]. These diverse strategies exemplify how ESD can move beyond instrumental learning outcomes toward more transformative educational experiences. As discussed in recent interdisciplinary literature, sustainability education benefits from integrating both cognitive and affective dimensions, while also emphasizing cultural contextualization and learner agency [30,31]. This perspective underlines the importance of biocultural diversity as a bridge between ecological literacy and culturally grounded values within sustainability-oriented pedagogies.
Although several valuable instruments have been developed to assess students’ perceptions of plants, including the widely used Plant Attitude Questionnaire [32] and the Plant Awareness Disparity Index [33,34], existing tools predominantly emphasize the ecological and cognitive aspects of plant awareness. These contributions have significantly advanced our understanding of learners’ relationships with plants, especially in the context of environmental education. However, plant perception is inherently multifaceted and also includes socio-cultural dimensions such as everyday utility, cultural symbolism, and aesthetic appreciation—elements that are closely tied to biocultural diversity and cultural sustainability. Recognizing this complexity, the present study builds upon previous work by introducing a new, context-sensitive, and developmentally appropriate instrument that captures ecological, functional, and cultural dimensions of plant perception. To this end, the Plant Perception Scale (PPS) was developed and psychometrically validated as a multidimensional tool designed to assess high school students’ plant-related perceptions across these intertwined domains. The scale comprises three key dimensions: Ecological Awareness and Sustainability Perception, Utility-Oriented Plant Perception, and Cultural-Aesthetic Plant Perception. For instance, items such as “Plant diversity in nature is important for ecosystem health,” “Many everyday products like paper, cotton, and clothing are made from plants,” and “Certain plants are used in traditional ceremonies, beliefs, and artworks” illustrate how the scale reflects the multifaceted structure of plant perception, encompassing both environmental and socio-cultural aspects. Beyond merely measuring students’ levels of awareness, the PPS offers a valuable tool for evaluating the effectiveness of instructional practices integrated into sustainability education, providing concrete data for educators, curriculum developers, and researchers. The scale is intended to support the monitoring of pedagogical interventions aimed at enhancing plant awareness, enable cross-cultural and developmental comparisons of students’ plant perceptions, and contribute to the advancement of holistic nature literacy within the broader framework of Education for Sustainable Development (ESD).

2. Materials and Methods

This study was designed as scale development research based on a descriptive survey model, which is frequently employed in educational and psychological research to examine latent constructs such as perceptions, attitudes, and beliefs [35]. The descriptive survey design aims to identify and interpret individuals’ current opinions, thoughts, attitudes, or psychological characteristics, and to explore how these attributes relate to specific variables or demographic factors [36].
As a methodological framework, the study followed systematic procedures commonly applied in scale development studies, including item generation, expert review, pilot testing, and validation analyses [35,37,38].

2.1. Instrument

The Plant Perception Scale (PPS) was developed to assess high school students’ perceptions of the ecological (in terms of sustainability and biodiversity), functional, cultural, and aesthetic roles of plants. Each stage of the scale development process was carried out systematically and in accordance with academic measurement and evaluation standards. The overall process of the study is illustrated in Figure 1.
In the first phase, a comprehensive item pool was created, and a draft version of the scale was developed based on this pool. The draft form was then reviewed by experts to assess its content and face validity. Expert opinions were obtained from various fields including art and design, biology education, botany, the Turkish language, and educational measurement and evaluation. Based on this feedback, the items were revised and a pilot version of the scale was prepared and administered.
In the second phase, the revised scale was tested using both Exploratory Factor Analysis (EFA) and Confirmatory Factor Analysis (CFA) to evaluate its construct validity. Additionally, findings related to internal consistency reliability, item analysis, and inter-factor correlation analyses were reported in detail. All scale items were developed in Turkish, and the applications were conducted entirely in the Turkish language.

2.2. Participants

In this study, high school students from various grade levels at an Anatolian High School located in Ankara, in the Central Anatolia Region of Türkiye, were included. Participants were selected through a purposive sampling method at three different stages of the study [39]. With approval from school administrators and teachers, classrooms deemed suitable for participation were randomly selected, and all students within those classes were invited to participate in the study. Participation was entirely voluntary, and students were informed about the purpose, procedure, and confidentiality principles of the study prior to data collection. Since many of the participants were under the age of 18, informed consent forms were also distributed to and signed by their parents or legal guardians prior to data collection. All procedures were conducted in accordance with ethical guidelines for research involving minors.
A total of 630 high school students participated in the study, distributed across three implementation phases.
In the pilot phase, 30 students from the 12th grade (12 female, 18 male) were included. These participants had completed biology units covering plant-related content in prior years and were included to observe item performance and wording clarity.
In the Exploratory Factor Analysis (EFA) phase, 200 students (100 female, 100 male) from the 11th and 12th grades participated. These students had studied plant-related topics in their biology curriculum, allowing the structure of the scale to be evaluated based on sufficient prior content exposure.
In the Confirmatory Factor Analysis (CFA) phase, 400 students (180 female, 220 male) from the 9th and 10th grades were included. These students had not yet covered plant-related content in detail and had not received comprehensive theoretical instruction on the subject. Their limited exposure ensured that the scale’s structure could be tested in a context with minimal prior conceptual influence. Overall, 53.6% of the participants were male (N = 338) and 46.3% were female (N = 292). Regarding grade-level distribution:
  • 28.3% were in 9th grade (N = 170).
  • 38.4% were in 10th grade (N = 230).
  • 21.7% were in 11th grade (N = 130).
  • 11.6% were in 12th grade (N = 70).
The detailed demographic characteristics of the participants are presented in Table 1. It should be noted that data on participants’ rural or urban background and socioeconomic status were not collected. This limits the generalizability of the findings to broader populations with diverse demographic characteristics.

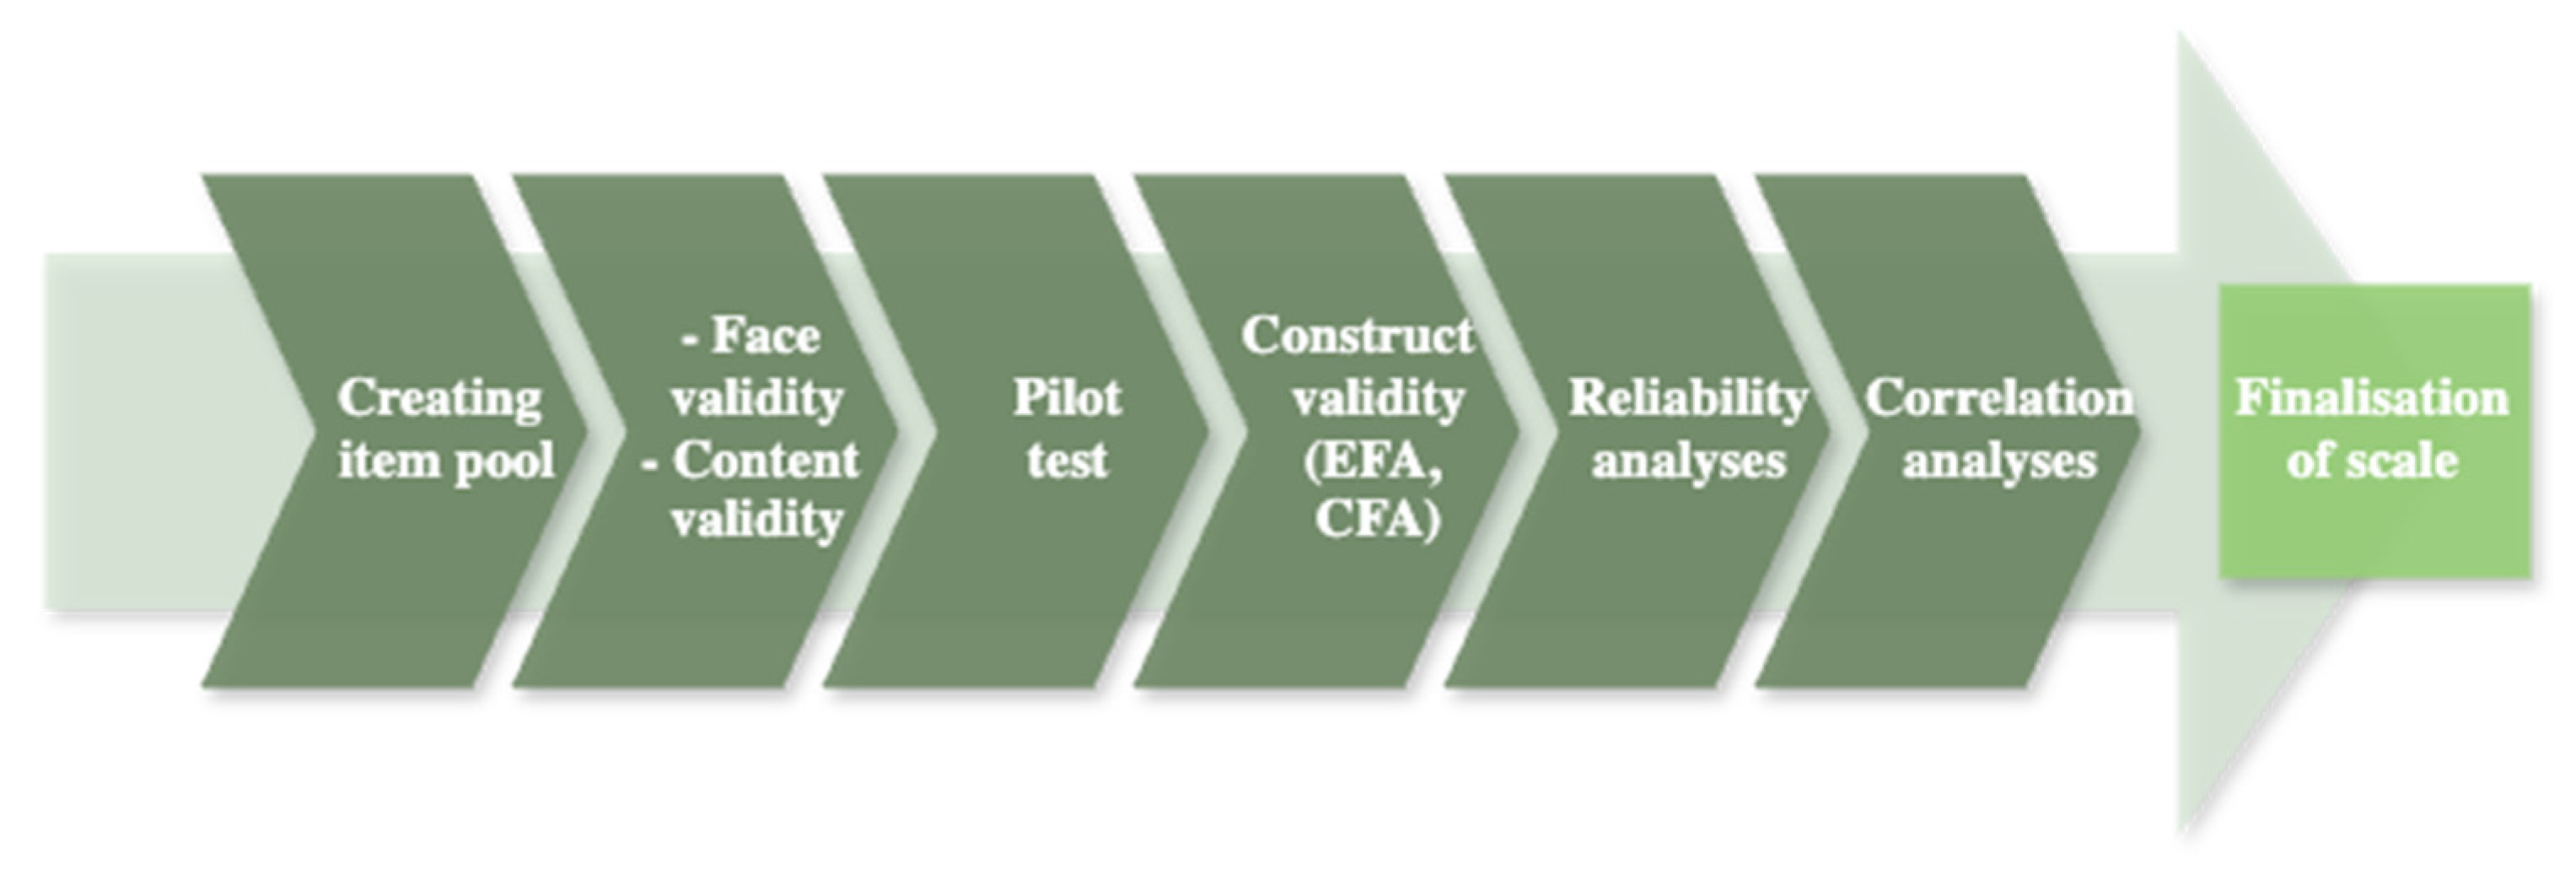
2.3. Item Pool Development

In the first phase of the scale development process, the emphasis by [38] on ensuring that scale items directly reflect the construct being measured was taken into account. Accordingly, a comprehensive item pool was created to develop a valid and reliable instrument that captures students’ perceptions of plants—including aspects of sustainability, ecological awareness, biodiversity, the roles of plants in daily life, and their cultural and aesthetic value.
This process began with an extensive literature review on topics such as plant blindness [40], plant awareness disparity [7], environmental attitudes and sustainability education [41], biocultural diversity [21], plant literacy [42], and the symbolic representation of plants in culture [18]. Based on these studies, relevant keywords such as plant blindness, plant awareness disparity, biocultural diversity, plant literacy, environmental sustainability, ecological awareness, and plant symbolism were used to guide the search.
Although the final items were developed specifically for this study, they were conceptually informed by prior instruments and theoretical frameworks in the literature. For example, items reflecting ecological roles were inspired by themes emphasized in the Plant Awareness Disparity Index [7], while cultural-symbolic elements drew upon research on plant representations in cultural contexts [18,21]. However, the wording, structure, and phrasing of all 26 items were newly generated by the authors to ensure contextual relevance and developmental appropriateness for high school students in Türkiye. From this review, both ecologically and culturally grounded item statements were developed using clear and age-appropriate language suitable for high school students.
The initial items were first reviewed by a Turkish language expert for grammar, fluency, and semantic appropriateness. Revisions were made based on the feedback received. Subsequently, the items were evaluated by a biology education specialist, a botanist, and an art and design academician. In the final step, feedback on clarity and usability was gathered from three practicing biology teachers to further refine the items.
At the end of this systematic process, a total of 26 items were included in the initial item pool. Each stage was conducted transparently and methodologically, ensuring that the resulting item pool was ready for face and content validity assessment.

2.4. Face and Content Validity

Face validity refers to whether an instrument appears, on the surface, to measure what it intends to measure [35]. Content validity, on the other hand, involves a more structured evaluation of whether each item adequately represents the construct being measured [43]. In this study, the face and content validity of the Plant Perception Scale (PPS) were established through the following steps:
Initially, a draft form consisting of 26 items was evaluated by a biology education specialist and an art-education academician to assess face validity. The biology education expert evaluated the items for scientific accuracy and alignment with biology curricula, while the art educator assessed their representativeness of cultural and aesthetic dimensions. As a result of this review, 4 items were excluded due to unclear wording or lack of alignment with the conceptual framework.
To ensure content validity, the remaining 21 items were submitted to seven experts specializing in biology education, botany, environmental education, arts, and cultural studies. Each expert’s contribution reflected their academic specialization: biology education and botany scholars focused on ecological and scientific soundness; environmental educators examined the items’ alignment with sustainability principles; the arts and cultural studies expert considered their aesthetic-cultural resonance; and the measurement specialist ensured item representativeness and clarity. Each expert was asked to rate the appropriateness of the items on a 3-point scale (1 = not appropriate, 3 = fully appropriate). According to the Content Validity Ratio (CVR) criteria by [44], no items fell below the acceptable CVR threshold of 0.75. The overall Content Validity Index (CVI) of the scale was calculated as 0.89, which exceeds the recommended threshold and thus confirms the content validity of the instrument. The final version of the scale consists of 21 items.

2.5. Pilot Study

During the preparation of the trial version of the scale, the instructions were clearly formulated, and 21 items were randomly ordered to construct the initial draft form. One of the key decisions at this stage concerned the number of response options. Based on evidence suggesting that five-point Likert scales do not pose disadvantages in terms of reliability and validity, the scale was structured using the following options: “Strongly Agree” (5 points), “Agree” (4 points), “Neutral” (3 points), “Disagree” (2 points), and “Strongly Disagree” (1 point).
To determine the sample size for the pilot study, the recommendations of [45] were considered. These authors suggest that sample sizes between 12 and 25 or 20 and 50 participants are generally sufficient for pilot testing. Accordingly, 30 high school students participated in this phase. The main objective of the pilot study was to evaluate the clarity of the items, the way they were interpreted, and the time required to complete the form.
After administering the trial form, individual interviews were conducted with each participant, during which open-ended questions were used to assess the comprehensibility of the items. These interviews provided in-depth insight into how participants interpreted and made sense of the scale items. The qualitative data obtained revealed that participants found the items to be clear, consistent, and meaningful. Furthermore, there was a high level of alignment between the quantitative responses and the qualitative interview data.
The average completion time for the trial form was recorded as approximately 15–20 min, which was considered appropriate for practical use. Based on these evaluations, it was concluded that the pilot version of the scale was suitable for use in the main application without requiring further revision.

2.6. Data Analysis

In this study, the construct validity of the scale was tested through Exploratory Factor Analysis (EFA) and Confirmatory Factor Analysis (CFA), conducted in two separate phases. EFA was employed to determine whether the data were suitable for uncovering underlying factors and to identify the number of latent dimensions [46]. Subsequently, CFA was conducted on an independent sample to verify the factor structure and relationships identified in the EFA [47].
The internal consistency of the PPS was assessed using Cronbach’s alpha coefficients. In addition, item analysis was performed, and correlations between the subdimensions of the scale were calculated. Before the analyses, all negatively worded items were reverse-coded to align with the scale’s direction of measurement.
All data analyses, including EFA, internal consistency reliability (Cronbach’s alpha), item–total correlation analysis, and Pearson correlation analysis, were conducted using IBM SPSS Statistics (Version 30.0). The confirmatory factor analysis (CFA) was carried out using AMOS (Version 24.0).

2.7. Item Analysis

In this study, item analyses of the scale were conducted by calculating Corrected Item–Total Correlations (CITC) and Discrimination Indices (DI). The item discrimination was assessed by comparing the top and bottom 27% groups based on total scores using independent-sample t-tests [48].
According to Table 2, CITC values ranged from 0.310 to 0.732, all of which exceed the minimum recommended threshold of 0.30 [49]. These results indicate that the items are internally consistent with the overall scale.
Regarding the Discrimination Index (DI), the results of the t-tests revealed statistically significant differences for all items (p < 0.001), with t-values ranging from 3.59 (Item 16) to 36.035 (Item 6). This supports that each item effectively distinguishes between participants with high and low levels of the measured trait [50]. Moreover, items with CITC values close to 0.30 were retained in the analysis due to their content relevance and contribution to construct validity [38].

3. Results and Discussion

This section of the study presents the results of the structural validity (EFA and CFA), reliability, and item analysis of the scale.

3.1. Construct Validity

3.1.1. Exploratory Factor Analysis (EFA)

The Plant Perception Scale (PPS) developed in this study consists of 21 items. Exploratory Factor Analysis (EFA) was conducted to assess the construct validity of the scale. The EFA process was reported in five stages as recommended by [46,51]:
(1)
The final version of the scale with 21 items was administered to 200 high school students. The sample size met the minimum 5:1 participant-to-item ratio as suggested by [52,53].
The Kaiser–Meyer–Olkin (KMO) measure was 0.920, which is considered excellent according to [39,49]. Bartlett’s test of sphericity was also significant (x2 = 2245.215, df = 210, p < 0.001), indicating that the dataset was suitable for factor analysis (Table 3).
All item factor loadings range from 0.656 to 0.861, exceeding the threshold of 0.300 recommended by [49]. No items were excluded from the analysis.
(2)
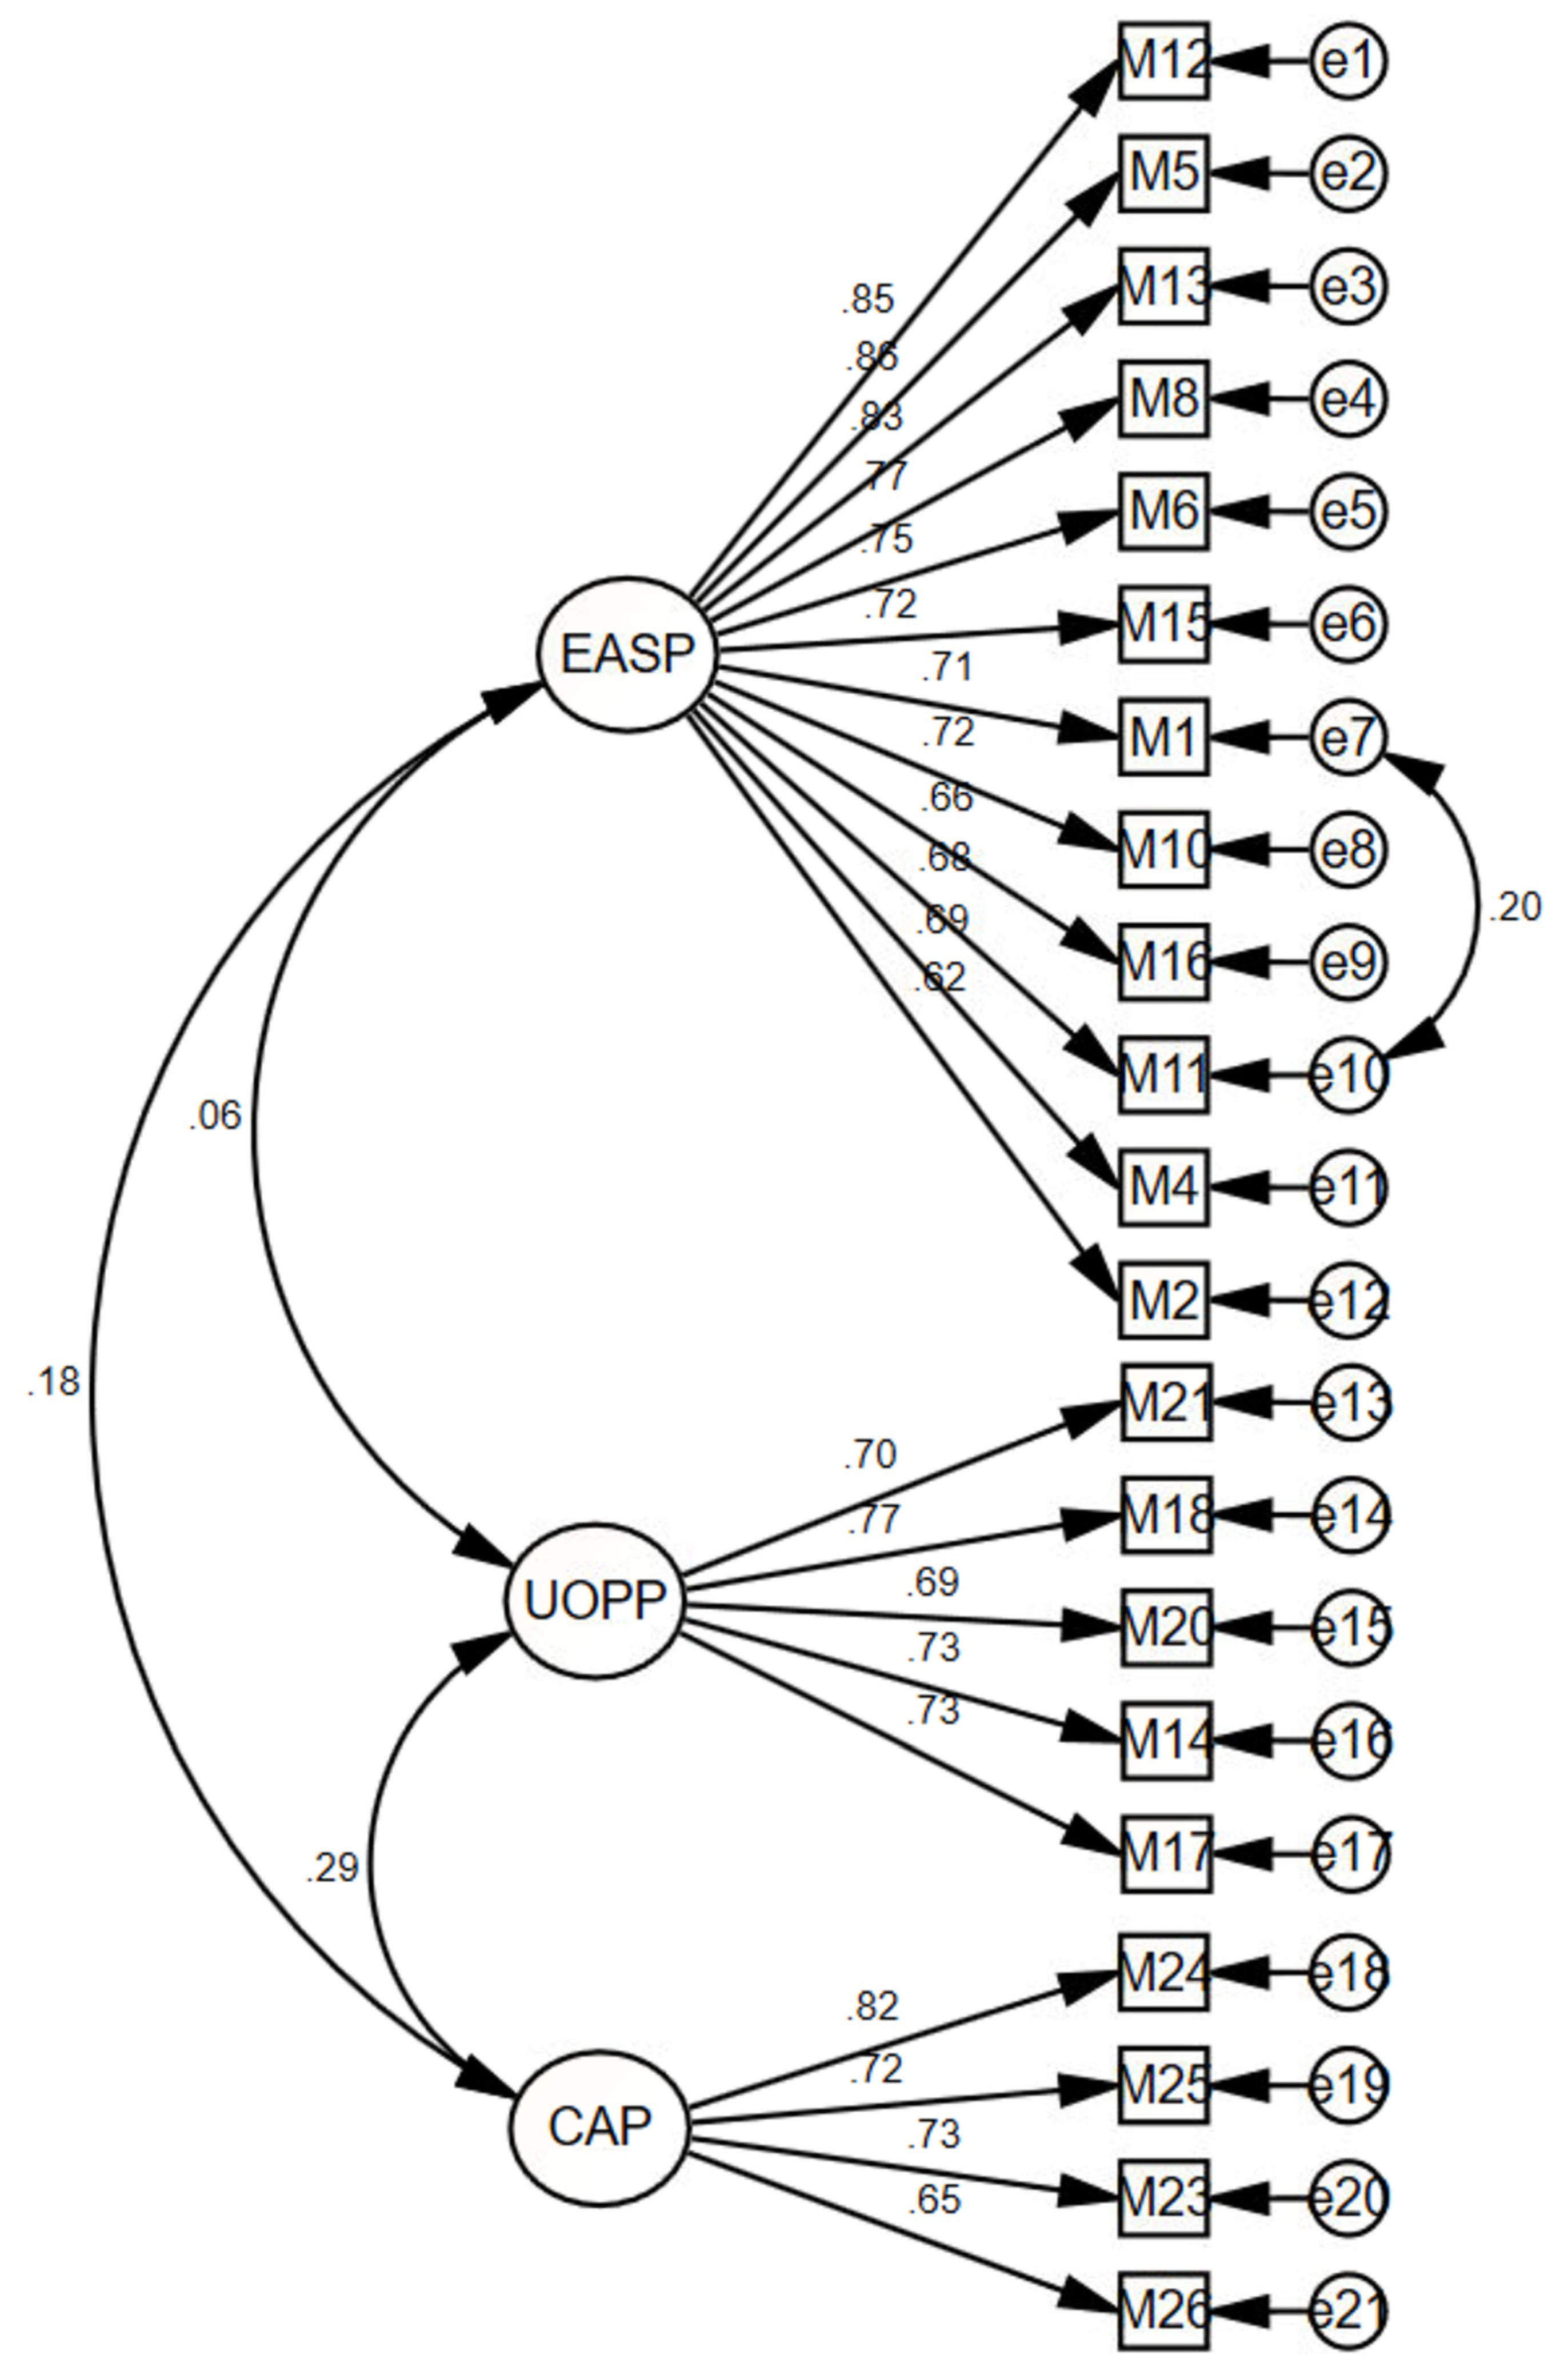
All items had factor loadings between 0.656 and 0.861. These values exceed the 0.300 threshold recommended by [49]. No cross-loadings were detected, and each item loaded significantly on its corresponding factor.
(3)
Three factors with eigenvalues greater than 1 were extracted, accounting for 62.015% of the total variance. The first factor explained 34.948%, the second 17.124%, and the third 9.943% of the variance. According to [54], a total variance explained above 60% is considered acceptable in the social sciences. The scree plot (Figure 2) revealed a clear inflection point after the third component, supporting the three-factor solution [55].
(4)
As the factors were assumed to be correlated, the Oblimin rotation method was applied (Table 4). The inter-factor correlations ranged from 0.081 to 0.249, indicating that the factors were related yet distinguishable.
(5)
Based on the thematic content of the items, the factors were named as follows:
  • Factor 1: Ecological Awareness and Sustainability Perception (EASP).
  • Factor 2: Utility-Oriented Plant Perception (UOPP).
  • Factor 3: Cultural and Aesthetic Perception (CAP).
These results suggest that students are not only aware of the ecological importance of plants but also respond to their cultural and utilitarian roles. This pattern indicates that educational programs aiming to foster holistic plant awareness should integrate interdisciplinary content that highlights both scientific and socio-cultural perspectives. Each factor of the scale reflects a unique aspect of this multifaceted perception. For example, the ecological awareness and sustainability factor can guide outdoor or inquiry-based learning practices. The utility-oriented plant perception factor supports curriculum designs that emphasize ethnobotany or everyday plant use. Meanwhile, the cultural-aesthetic plant perception factor offers opportunities for integrating local traditions, literature, or art-based activities into plant education. These connections allow educators to align their teaching strategies more closely with the specific aspects of plant awareness emphasized by the scale.

3.1.2. Confirmatory Factor Analysis (CFA)

At this stage, the accuracy of the three-factor structure of the PPS, which was developed through Exploratory Factor Analysis (EFA), was tested by conducting Confirmatory Factor Analysis (CFA) [56]. This analysis aimed to determine whether the variable groups contributing to the identified factors were adequately represented by those factors [57,58]. Data were collected from 400 high school students, and a first-order CFA model was constructed using AMOS. In this model, the latent variables (factors) and their interrelationships, along with their associations with observed variables (items), were examined.
In the CFA model, the factors of the scale were defined as latent variables, and the scale items were defined as observed variables [46]. The latent variables were labeled as Factor 1 (Ecological Awareness and Sustainability Perception), Factor 2 (Utility-Oriented Plant Perception), and Factor 3 (Cultural and Aesthetic Perception), while the observable variables were named according to their item codes (e.g., M1–M26). As seen in Figure 3, ellipses represent latent variables, rectangles represent observed variables, and circles (e1–e21) represent error terms.
The path diagram (Figure 3) presents standardized regression weights (factor loadings). These indicate the strength of each item’s association with its respective factor [59]. The standardized factor loadings ranged from 0.62 (M2) to 0.86 (M5) for Factor 1, from 0.69 (M20) to 0.77 (M18) for Factor 2, and from 0.65 (M26) to 0.82 (M24) for Factor 3. According to [54], factor loadings above 0.40 are considered acceptable in most social science contexts.
Only one modification was applied in the model, adding a covariance between the error terms of M1 and M11. This modification, which was theoretically justified and suggested by the modification indices, was implemented to improve model fit without compromising conceptual clarity [59,60].
The correlations between latent factors were also examined. The correlations between Factor 1 and Factor 2 (r = 0.06), Factor 1 and Factor 3 (r = 0.18), and Factor 2 and Factor 3 (r = 0.29) were found to be low. While higher correlations may suggest convergence among constructs, low correlations are not inherently problematic. In fact, when constructs are theoretically distinct—as in this study—such low correlations may meaningfully reflect their conceptual independence. As [47] notes, low inter-factor correlations in CFA can indicate orthogonal or semi-orthogonal dimensions, especially when supported by theoretical rationale.
The unequal distribution of items across the three factors, particularly the presence of 12 items in Factor 1 (Ecological Awareness and Sustainability Perception) compared to only 4 items in Factor 3 (Cultural and Aesthetic Perception), can be interpreted from both a conceptual and psychometric perspective. The extensive item concentration in Factor 1 may reflect the integrated perception of ecological awareness and sustainability among students, suggesting that these concepts are frequently experienced together and thus elicit a wider range of responses. In contrast, the compact structure of Factor 3 indicates that culturally and aesthetically grounded perceptions of plants may be more narrowly defined yet still form a coherent and distinguishable dimension.
Model fit was assessed using various indices (Table 5): χ2/df = 2.204; AGFI = 0.894; GFI = 0.915; NFI = 0.911; CFI = 0.949; IFI = 0.949; TLI = 0.942; RMSEA = 0.055. According to the accepted thresholds in the literature, χ2/df values less than 3 indicate acceptable model fit [47] and fit indices above 0.90 for GFI, NFI, CFI, IFI, and TLI support an adequate fit [61,62]. The RMSEA value (0.055) also meets the criterion for close fit (≤0.06). These results indicate that the three-factor structure of the PPS is well-supported by the data. Educators may use the scale not only as an assessment tool but also as a guide to tailor instruction. For instance, if students demonstrate lower awareness of the cultural-aesthetic factor, teachers could incorporate culturally significant plant species, local myths, or visual arts into their lessons to foster deeper engagement and appreciation.

3.2. Reliability Analysis

In this section, the reliability analyses of the PPS are presented.

Internal Consistency Analysis

Cronbach’s alpha coefficients were used [63] to assess the internal consistency of the overall scale and its factors. The results are as follows.
  • Entire scale (21 items): α = 0.884.
  • Factor 1—Ecological Awareness and Sustainability Perception (12 items): α = 0.939.
  • Factor 2—Utility-Oriented Plant Perception (5 items): α = 0.850.
  • Factor 3—Cultural and Aesthetic Perception (4 items): α = 0.823.
According to [64], alpha values above 0.70 indicate acceptable reliability. The obtained coefficients suggest that the PPS demonstrates high internal consistency at both the overall and subscale levels.
Cronbach’s alpha reflects how consistently the items in a scale measure the same construct. However, as [49] notes, the alpha value can increase with the number of items. Therefore, high alpha values should be interpreted alongside item analyses and theoretical coherence of the scale.

3.3. Descriptive Statistics

Table 6 presents the descriptive statistics for each item in the PPS. Across the three factors, mean values range from 3.63 (M5) to 4.15 (M26), suggesting generally favorable perceptions among students. Items in the Ecological Awareness and Sustainability Perception factor showed slightly more variability (e.g., M5: M = 3.63, SD = 1.12; M12: M = 3.71, SD = 1.15), indicating a broader spread in responses, possibly reflecting differences in students’ exposure to environmental education. In contrast, items in the Cultural and Aesthetic Perception factor yielded the highest mean score (M26: M = 4.15, SD = 0.91) and lower standard deviations overall, suggesting greater consensus around culturally embedded plant perceptions. Interestingly, despite containing the fewest items, this factor also demonstrated conceptual clarity and internal coherence, supporting its inclusion as a distinct construct within the scale.

3.4. Correlation Analysis Among the Factors of the PPS Instrument

In order to assess the relationships between the factors of the PPS and the total score, Pearson correlation analyses were conducted.
To examine the relationships between the three factors of the Plant Perception Scale (PPS) and the overall scale score, Pearson correlation analyses were conducted using data from both the EFA (N = 200) and CFA (N = 400) samples. In both datasets, the highest correlation was observed between Factor 1: Ecological Awareness and Sustainability Perception and the total score (EFA: r = 0.870, p < 0.001; CFA: r = 0.869, p < 0.001), indicating that this factor plays a central role in plant-related attitudes. This finding is consistent with previous studies emphasizing the significance of ecological awareness in shaping perceptions toward plant life (e.g., [14,65]. Factor 2: Utility-Oriented Plant Perception and Factor 3: Cultural and Aesthetic Perception also showed statistically significant and moderate correlations with the total score in both samples (EFA: r = 0.484 and 0.476; CFA: r = 0.452 and 0.482, respectively), supporting their contribution to the overall construct.
As for inter-factor relationships, the results revealed relatively low or weak correlations among the three factors, with some non-significant results (e.g., r = 0.048 between Factor 1 and Factor 2 in the CFA sample, p = 0.340). This suggests that each factor captures a distinct and conceptually independent aspect of plant perception. Particularly, the weak and insignificant association between ecological awareness and utility-oriented perception indicates that participants differentiate between understanding plants in terms of sustainability and recognizing them for their utilitarian functions. These patterns confirm the scale’s multidimensional structure and highlight the need to consider each factor separately in both research and educational interventions (Table 7).

4. Conclusions

The present study aimed to develop and validate the Plant Perception Scale (PPS), a multidimensional instrument designed to assess high school students’ perceptions of plants across ecological, utilitarian, and cultural-aesthetic factors. The results of both Exploratory and Confirmatory Factor Analyses provide compelling evidence supporting the structural validity of the three-factor model. The scale demonstrated high internal consistency, with Cronbach’s alpha values well above the acceptable threshold for all factors.
EFA revealed a robust factor structure, with all items loading significantly on their intended constructs and explaining over 62% of the total variance, surpassing the commonly accepted benchmark of 60% for psychological constructs [66]. The commonalities and factor loadings met or exceeded established criteria [49], affirming item adequacy. The subsequent CFA confirmed this structure, yielding satisfactory fit indices (e.g., CFI = 0.949; RMSEA = 0.055), further validating the multidimensional model.
A theoretically grounded modification—covariance between M1 and M11—was introduced to improve model fit. This decision was informed by the content overlap between the items, both emphasizing the indispensable role of plants in sustaining life and environmental balance, which may result in correlated error terms [59].
Furthermore, reliability analyses confirmed the scale’s internal consistency. Despite a few items presenting borderline Corrected Item-Total Correlation values, all items were retained based on theoretical relevance and conceptual comprehensiveness. The statistically significant discrimination indices between the upper and lower 27% groups further supported item effectiveness in distinguishing perception levels [50].
Correlational findings revealed that while the three factors were moderately associated with the total score, their interrelations remained low or non-significant, supporting the conceptual independence of each factor. This reinforces the idea that ecological awareness, utilitarian value, and cultural-aesthetic perception represent distinct, yet collectively comprehensive, facets of plant perception [27].
Overall, the PPS serves as a valid and reliable tool for assessing plant perception among high school students. It holds potential for use in educational diagnostics, curriculum design, and future research aiming to address plant blindness and promote botanical literacy. Future studies may consider applying the PPS across different age groups and cultural contexts to further validate its universality and sensitivity. Ultimately, the PPS can inform instructional planning by revealing which factors of plant perception require further emphasis in different student populations. This enables educators to design learning experiences that align with Education for Sustainable Development (ESD) principles, incorporating transformative pedagogies such as experiential outdoor projects, storytelling involving culturally relevant plants, or interdisciplinary activities that integrate biology with arts, history, or social studies. In this way, the PPS not only serves as an assessment tool but also contributes to the pedagogical advancement of holistic botanical literacy.
Beyond its educational contributions, the PPS can support broader sustainability efforts by aligning with specific Sustainable Development Goals (SDGs). In particular, it is closely related to SDG 4.7.1, which assesses the extent to which Education for Sustainable Development (ESD) is integrated into national education policies, curricula, teacher education, and student assessments. The scale’s three factors—ecological awareness, utilitarian perception, and cultural-aesthetic plant perception—can inform practical improvements in each of these areas. Moreover, it resonates with SDG 2.5, which addresses plant genetic resources and biodiversity, by helping raise the visibility of plant-related knowledge in both educational and policy contexts. A notable gap remains in SDG 15: Life on Land, where “plant biodiversity” is not explicitly mentioned, underscoring a systemic underrepresentation of plants in environmental discourse—an issue this study directly addresses. According to the 2024 SDG Index, Türkiye ranks 72nd out of 166 countries, with significant challenges noted in SDG 4: Quality Education. In this regard, the PPS can serve not only as a diagnostic and instructional tool but also as an advocacy instrument for integrating the ecological and cultural importance of plants into national curricula and sustainability policies. Additionally, the study argues for the development of a dedicated goal or indicator focused on plant biodiversity within the broader SDG framework.

5. Limitations of the Study

The findings of this study provide strong evidence supporting the validity and reliability of the Plant Perception Scale (PPS), contributing to the existing literature on plant-related attitudes. Nevertheless, several limitations should be acknowledged when interpreting the results.
First, the scale development and validation processes were conducted with a sample of 600 high school students (200 for EFA and 400 for CFA) from a specific region in Türkiye. Therefore, the generalizability of the findings to other cultural, geographical, or socioeconomic contexts remains limited. The cross-cultural applicability of the PPS has not yet been established.
Second, although the exploratory and confirmatory factor analyses provide valuable insights into the structural validity of the scale, the temporal stability (test–retest reliability) of the PPS was not examined in this study. Future research is recommended to assess the consistency of the scale over time using longitudinal designs.
In light of these limitations, it is recommended that the PPS be further tested across diverse populations and educational settings, using various data collection methods, to strengthen its validity and practical utility in broader contexts.

Author Contributions

S.S.A. designed the study, collected and analyzed the data, and wrote the manuscript. P.K. supervised the research process throughout the development of the study. All authors have read and agreed to the published version of the manuscript.

Funding

This research received no external funding.

Institutional Review Board Statement

The study was conducted in accordance with the Declaration of Helsinki, and the protocol was approved by the Ethics Committee of Hacettepe University (Decision Date: 24 October 2024, Decision No: 24).

Informed Consent Statement

Informed consent was obtained from all subjects involved in the study.

Data Availability Statement

The data that support the findings of this study are available from the corresponding author upon reasonable request.

Acknowledgments

This study is related to the first author’s PhD thesis, which is being conducted under the supervision of the second author at the Institute of Educational Sciences, Hacettepe University.

Conflicts of Interest

The authors declare no conflicts of interest.

References

  1. Raven, P.H.; Evert, R.F.; Eichhorn, S.E. Biology of Plants, 7th ed.; W. H. Freeman and Company: New York, NY, USA, 2005. [Google Scholar]
  2. Field, C.B.; Behrenfeld, M.J.; Randerson, J.T.; Falkowski, P. Primary production of the biosphere: Integrating terrestrial and oceanic components. Science 1998, 281, 237–240. [Google Scholar] [CrossRef] [PubMed]
  3. Pan, Y.; Birdsey, R.A.; Fang, J.; Houghton, R.; Kauppi, P.E.; Kurz, W.A.; Phillips, O.L.; Shvidenko, A.; Lewis, S.L.; Canadell, J.G.; et al. A large and persistent carbon sink in the world’s forests. Science 2011, 333, 988–993. [Google Scholar] [CrossRef] [PubMed]
  4. Odum, E.P.; Barrett, G.W. Fundamentals of Ecology, 5th ed.; Brooks/Cole: Belmont, CA, USA, 2005. [Google Scholar]
  5. Millennium Ecosystem Assessment. Ecosystems and Human Well-Being: Biodiversity Synthesis; World Resources Institute: Washington, DC, USA, 2005; Available online: https://www.millenniumassessment.org/en/Synthesis.html (accessed on 6 June 2025).
  6. Wandersee, J.H.; Schussler, E.E. Preventing plant blindness. Am. Biol. Teach. 1999, 61, 82–86. [Google Scholar] [CrossRef]
  7. Parsley, K.M. Plant awareness disparity: A case for renaming plant blindness. Plants People Planet 2020, 2, 598–601. [Google Scholar] [CrossRef]
  8. Pany, P.; Lörnitzo, A.; Auleitner, L.; Heidinger, C.; Lampert, P.; Kiehn, M. Using students’ interest in useful plants to encourage plant vision in the classroom. Plants People Planet 2019, 1, 261–270. [Google Scholar] [CrossRef]
  9. Sanders, D.; Nyberg, E.; Snaebjornsdottir, B.; Wilson, M.; Eriksen, B.; Brkovic, I. Beyond plant blindness: Seeing the importance of plants for a sustainable world. In State of the World’s Plants Symposium; Royal Botanic Gardens Kew: London, UK, 2017. [Google Scholar]
  10. Thomas, H.; Ougham, H.; Sanders, D. Plant blindness and sustainability. Int. J. Sustain. High. Educ. 2022, 23, 41–57. [Google Scholar] [CrossRef]
  11. UNESCO. Education for Sustainable Development Goals: Learning Objectives; UNESCO Publishing: Paris, France, 2017; Available online: https://unesdoc.unesco.org/ark:/48223/pf0000247444 (accessed on 20 May 2025).
  12. Trewavas, A. Aspects of plant intelligence. Ann. Bot. 2003, 92, 1–20. [Google Scholar] [CrossRef]
  13. Karban, R. Plant behaviour and communication. Ecol. Lett. 2008, 11, 727–739. [Google Scholar] [CrossRef]
  14. Balas, B.; Momsen, J.L. Attention “blinks” differently for plants and animals. CBE–Life Sci. Educ. 2014, 13, 437–443. [Google Scholar] [CrossRef]
  15. Balding, M.; Williams, K.J.H. Plant blindness and the implications for plant conservation. Conserv. Biol. 2016, 30, 1192–1199. [Google Scholar] [CrossRef]
  16. Fančovičová, J.; Prokop, P. Plants have a chance: Outdoor educational programmes alter students’ knowledge and attitudes towards plants. Environ. Educ. Res. 2011, 17, 537–551. [Google Scholar] [CrossRef]
  17. United Nations (UN). Transforming Our World: The 2030 Agenda for Sustainable Development; United Nations: New York, NY, USA, 2017; Available online: https://sdgs.un.org/2030agenda (accessed on 20 May 2025).
  18. Díaz, S.; Settele, J.; Brondízio, E.S.; Ngo, H.T.; Agard, J.; Arneth, A.; Balvanera, P.; Brauman, K.A.; Butchart, S.H.M.; Chan, K.M.A.; et al. Pervasive human-driven decline of life on Earth points to the need for transformative change. Science 2019, 366, eaax3100. [Google Scholar] [CrossRef]
  19. Blue, S.; Hargiss, C.L.; Norland, J.; Dekeyser, E.S.; Comeau, P. Plant blindness represents the loss of generational knowledge and cultural identity. Nat. Sci. Educ. 2023, 52, e20106. [Google Scholar] [CrossRef]
  20. Ryplová, R.; Pokorny, J. Fostering interdisciplinarity through technology enhanced learning of transpiration. Proj. Based Educ. Other Activ. Strateg. Sci. Educ. 2020, 17, 245–252. [Google Scholar]
  21. Toledo, V.M. Biocultural diversity and local power in Mexico: Challenging globalisation. Int. Soc. Sci. J. 2011, 63, 151–162. [Google Scholar]
  22. UNESCO. ESD for 2030: Education for Sustainable Development—A Roadmap; UNESCO Publishing: Paris, France, 2020; Available online: https://unesdoc.unesco.org/ark:/48223/pf0000374802 (accessed on 20 May 2025).
  23. Amprazis, A.; Papadopoulou, P. Key competencies in education for sustainable development: A valuable framework for enhancing plant awareness. Plants People Planet 2024. [Google Scholar] [CrossRef]
  24. Pany, P. Students’ interest in useful plants: A potential key to counteract plant blindness. Plant Sci. Bull. 2014, 60, 18–27. [Google Scholar]
  25. Akpınarlı, S.S.; Akaydın, G. Investigation of student biology teachers’ views on field-based plant exploration exercises in a botany course. SHS Web Conf. 2024, 206, 01007. [Google Scholar] [CrossRef]
  26. Akpınarlı, S.S.; Akaydın, G.; Köseoğlu, P. Increasing the Plant Awareness of Prospective Biology Teachers: A Mixed Methods Study. Stud. Soc. Educ. Sci. 2023, 2023, 183. [Google Scholar]
  27. Krosnick, S.E.; Baker, J.C.; Moore, K.R. The pet plant project: Treating plant blindness by making plants personal. Am. Biol. Teach. 2018, 80, 339–345. [Google Scholar] [CrossRef]
  28. Akpınarlı, S.S.; Köseoğlu, P. Technological Tools in Education: Actionbound Experience of Prospective Biology Teachers. MIER J. Educ. Stud. Trends Pract. 2024, 14, 226–247. [Google Scholar] [CrossRef]
  29. Kissi, L.; Dreesmann, D. Plant visibility through mobile learning? Implementation and evaluation of an interactive Flower Hunt in a botanic garden. J. Biol. Educ. 2018, 52, 344–363. [Google Scholar]
  30. Martínez-Harms, M.J.; Balvanera, P.; Infante, C.; Moreno, C.; Brondizio, E.S. An interdisciplinary framework for understanding biocultural diversity: Key concepts and methodological challenges. Sustainability 2022, 14, 12289. [Google Scholar]
  31. Martínez, A.C.; Hernández-Barrios, C.; Ramos, C. Unlocking the potential of responsible management education through sustainable development goals: A multilevel framework. Sustain. Dev. 2023, 31, 78–92. [Google Scholar]
  32. Fančovičová, J.; Prokop, P. Development and initial psychometric assessment of the Plant Attitude Questionnaire. J. Sci. Educ. Technol. 2010, 19, 415–421. [Google Scholar] [CrossRef]
  33. Kadirhanoğulları, M.K.; Önel, A. Bitki Farkındalığı Eşitsizlik İndeksinin Türkçeye Uyarlanması. EKEV Akad. Derg. 2023, 161–174. [Google Scholar] [CrossRef]
  34. Parsley, K.M.; Daigle, B.J.; Sabel, J.L. Initial development and validation of the plant awareness disparity index. CBE–Life Sci. Educ. 2022, 21, ar63. [Google Scholar] [CrossRef] [PubMed]
  35. Lamm, K.W.; Lamm, A.J.; Edgar, D. Scale development and validation: Methodology and recommendations. J. Int. Agric. Ext. Educ. 2020, 27, 24–35. [Google Scholar] [CrossRef]
  36. Creswell, J.W.; Creswell, J.D. Research Design: Qualitative, Quantitative, and Mixed Methods Approaches, 5th ed.; SAGE Publications: Thousand Oaks, CA, USA, 2018. [Google Scholar]
  37. Boateng, G.O.; Neilands, T.B.; Frongillo, E.A.; Melgar-Quiñonez, H.R.; Young, S.L. Best practices for developing and validating scales for health, social, and behavioral research: A primer. Front. Public Health 2018, 6, 149. [Google Scholar] [CrossRef]
  38. DeVellis, R.F.; Thorpe, C.T. Scale Development: Theory and Applications, 5th ed.; SAGE Publications: Thousand Oaks, CA, USA, 2021. [Google Scholar]
  39. Sharma, S. Applied Multivariate Techniques; John Wiley & Sons: Hoboken, NJ, USA, 1996. [Google Scholar]
  40. Yılmaz, Z.; Selvi, M. Biyoloji Öğretmen Adaylarının Bitki Farkındalığının Belirlenmesi. Ondokuz Mayis Univ. J. Educ. Fac. 2023, 42, 359–430. [Google Scholar] [CrossRef]
  41. Olsson, D.; Gericke, N.; Chang Rundgren, S.-N. The effect of implementation of education for sustainable development in Swedish compulsory schools—Assessing pupils’ sustainability consciousness. Environ. Educ. Res. 2016, 22, 176–201. [Google Scholar] [CrossRef]
  42. Uno, G.E. Botanical literacy: What and how should students learn about plants? Am. J. Bot. 2009, 96, 1753–1759. [Google Scholar] [CrossRef] [PubMed]
  43. Ayre, C.; Scally, A.J. Critical values for Lawshe’s content validity ratio: Revisiting the original methods of calculation. Meas. Eval. Couns. Dev. 2014, 47, 79–86. [Google Scholar] [CrossRef]
  44. Lawshe, C.H. A quantitative approach to content validity. Pers. Psychol. 1975, 28, 563–575. [Google Scholar] [CrossRef]
  45. Sheatsley, P.B. Questionnaire construction and item writing. In Handbook of Survey Research; Rossi, P.H., Wright, J.D., Anderson, A.B., Eds.; Academic Press: New York, NY, USA, 1983; pp. 195–230. [Google Scholar]
  46. Tabachnick, B.G.; Fidell, L.S. Using Multivariate Statistics, 7th ed.; Pearson: Boston, MA, USA, 2019. [Google Scholar]
  47. Kline, R.B. Principles and Practice of Structural Equation Modeling, 4th ed.; Guilford Press: New York, NY, USA, 2016. [Google Scholar]
  48. Cohen, R.J.; Swerdlik, M.E. Intelligence and its measurement. In Psychological Testing and Assessment: An Introduction to Tests and Measurements; Mayfield Publishing Company: Mountain View, CA, USA, 2009; pp. 289–321. [Google Scholar]
  49. Field, A.; Gaitanou, C. Discovering Statistics Using SPSS, 3rd ed.; SAGE Publications: London, UK, 2009. [Google Scholar]
  50. Furr, R.M.; Bacharach, V.R. Psychometrics: An Introduction, 2nd ed.; SAGE Publications: Thousand Oaks, CA, USA, 2014. [Google Scholar]
  51. Huck, S.W. Reading Statistics and Research, 6th ed.; Pearson: Boston, MA, USA, 2012. [Google Scholar]
  52. Bryman, A.; Cramer, D. Quantitative Data Analysis with SPSS 12 and 13: A Guide for Social Scientists; Routledge: London, UK, 2005. [Google Scholar]
  53. Gorsuch, R.L. Factor Analysis, 2nd ed.; Psychology Press: New York, NY, USA, 2015. [Google Scholar]
  54. Stevens, J.P. Applied Multivariate Statistics for the Social Sciences, 5th ed.; Routledge: New York, NY, USA, 2009. [Google Scholar]
  55. Cattell, R.B. The scree test for the number of factors. Multivar. Behav. Res. 1966, 1, 245–276. [Google Scholar] [CrossRef]
  56. Harrington, D. Confirmatory Factor Analysis; Oxford University Press: New York, NY, USA, 2009. [Google Scholar]
  57. Brown, T.A. Confirmatory Factor Analysis for Applied Research, 2nd ed.; Guilford Press: New York, NY, USA, 2015. [Google Scholar]
  58. Hoyle, R.H. Confirmatory Factor Analysis. In Handbook of Applied Multivariate Statistics and Mathematical Modeling; Tinsley, H., Brown, S., Eds.; Academic Press: San Diego, CA, USA, 2000; pp. 465–497. [Google Scholar]
  59. Byrne, B.M. Structural Equation Modeling with AMOS: Basic Concepts, Applications, and Programming, 3rd ed.; Routledge: New York, NY, USA, 2016. [Google Scholar]
  60. Schumacker, R.E.; Lomax, R.G. A Beginner’s Guide to Structural Equation Modeling, 4th ed.; Routledge: New York, NY, USA, 2016. [Google Scholar]
  61. Hu, L.T.; Bentler, P.M. Cutoff criteria for fit indexes in covariance structure analysis: Conventional criteria versus new alternatives. Struct. Equ. Model. 1999, 6, 1–55. [Google Scholar] [CrossRef]
  62. Schermelleh-Engel, K.; Moosbrugger, H.; Müller, H. Evaluating the fit of structural equation models: Tests of significance and descriptive goodness-of-fit measures. Methods Psychol. Res. Online 2003, 8, 23–74. [Google Scholar]
  63. Raubenheimer, J.E. An item selection procedure to maximise scale reliability and validity. SA J. Ind. Psychol. 2004, 30, 59–64. [Google Scholar] [CrossRef]
  64. George, D.; Mallery, P. IBM SPSS Statistics 26 Step by Step: A Simple Guide and Reference, 16th ed.; Routledge: New York, NY, USA, 2020. [Google Scholar]
  65. Schussler, E.E.; Link-Perez, M.A.; Weber, K.M.; Dollo, V.H. Exploring plant and animal content in elementary science textbooks. J. Biol. Educ. 2010, 44, 123–128. [Google Scholar] [CrossRef]
  66. Velicer, W.F.; Fava, J.L. Effects of variable and subject sampling on factor pattern recovery. Psychol. Methods 1998, 3, 231–251. [Google Scholar] [CrossRef]
Figure 1. Process of the study.
Sustainability 17 05540 g001
Figure 2. Scree plot showing the eigenvalues associated with each component.
Sustainability 17 05540 g002
Figure 3. Path diagram from the Confirmatory Factor Analysis (CFA) illustrating the standardized factor loadings of items on the three latent constructs.
Sustainability 17 05540 g003
Table 1. Participants’ characteristics.
f%
Participation in an in-school environmental project or activityYes28547.5
No31552.5
Content of the environmental activityTree planting16026.7
Clean-up activity14524.2
Observation based activity13021.7
Other7512.5
Membership in an environmental or nature clubYes19833.0
No40267.0
Time spent in natureA few times per year9015.0
Once a year508.3
A few times per month16026.7
Once a month7011.7
A few times per week13021.7
Once a week10016.7
Plant growing at home or in gardenYes31051.7
No29048.3
Table 2. CITC and DI values.
ItemCorrected Item-Total CorrelationCronbach’s Alpha if Item DeletedGroupsSDMeant
120.7320.871Upper27%
Lower27%
0.476
0.935
4.67
2.26
16.857 *
50.6890.872Upper27%
Lower27%
0.000
0.773
5.00
2.31
25.535 *
130.7020.872Upper27%
Lower27%
0.760
0.994
4.37
2.65
10.119 *
80.6450.875Upper27%
Lower27%
0.000
0.520
5.00
2.65
33.255 *
60.6180.875Upper27%
Lower27%
0.000
0.476
5.00
2.67
36.035 *
150.6380.875Upper27%
Lower27%
0.000
0.567
5.00
2.59
31.202 *
10. 5690.877Upper27%
Lower27%
0.492
0.861
4.61
3.11
11.29 *
100.5740.877Upper27%
Lower27%
0.389
0.937
4.82
3.08
12.221 *
160.5820.876Upper27%
Lower27%
0.499
1.064
4.57
4.00
3.59 *
110.5650.877Upper27%
Lower27%
0.000
0.602
5.00
2.57
29.616 *
40.6150.876Upper27%
Lower27%
0.000
0.609
5.00
2.69
27.938 *
20.5220.879Upper27%
Lower27%
0.000
0.582
5.00
2.96
25.739 *
210.3120.885Upper27%
Lower27%
0.492
1.063
4.61
3.76
5.345 *
180.3200.884Upper27%
Lower27%
0.420
0.991
4.78
3.00
12.144 *
200.3100.886Upper27%
Lower27%
0.000
0.492
5.00
2.61
35.675 *
140.3790.882Upper27%
Lower27%
0.540
1.040
4.52
3.44
6.734 *
170.3100.886Upper27%
Lower27%
0.000
0.599
5.00
2.59
29.518 *
240.3610.884Upper27%
Lower27%
0.499
1.040
4.57
2.56
12.858 *
250.3100.886Upper27%
Lower27%
0.000
0.567
5.00
2.59
31.202 *
230.3700.882Upper27%
Lower27%
0.000
0.520
5.00
2.65
33.255 *
260.3600.884Upper27%
Lower27%
0.000
0.517
5.00
2.81
31.079 *
* p < 0.001, df = 106, N = 108. Note: Mean and SD values are based on responses to a 5-point Likert scale ranging from 1 (“Strongly Disagree”) to 5 (“Strongly Agree”). t-values represent results from independent samples t-tests comparing the top and bottom 27% groups.
Table 3. The KMO and Bartlett’s sphericity test results.
KMO Measure of Sampling AdequacyApprox. χ2dfSig.
0.9202245.215210<0.001
Note: KMO = Kaiser–Meyer–Olkin measure of sampling adequacy; χ2 = Chi-square value; df = degrees of freedom; Sig. = significance level (p-value). The chi-square value represents the result of Bartlett’s Test of Sphericity.
Table 4. Information on the exploratory factor analysis for the PPS.
ItemsF1F2F3
Factor 1: Ecological Awareness and Sustainability Perception
M12. A sustainable future is possible even without protecting plants. (-)0.861
M5. Plants are important for protecting the soil and maintaining ecological balance.0.849
M13. The existence of plants is vital for sustainable agriculture and food security.0.843
M8. The extinction of plant species does not affect other organisms or ecosystems. (-)0.785
M6. Plant diversity in nature is important for ecosystem health.0.783
M15. Plants contribute to regulating the water cycle and preserving air quality.0.774
M1. Plants are vital for the continuity of life.0.756
M10. Conserving endemic plant species is important for biodiversity.0.752
M16. Practices related to plants contribute to solving environmental problems.0.745
M11. The role of plants in climate change is insignificant. (-)0.744
M4. Plants provide shelter and protection for some animals in nature.0.714
M2. Each plant species contributes to biological diversity in nature.0.656
Factor 2: Utility-Oriented Plant Perception
M21. Plants are widely used for health purposes in both traditional and modern medicine. 0.807
M18. Plants are neither used as spices nor as healing products. (-) 0.805
M20. Plants are the main components of natural cosmetic and cleaning products. 0.796
M14. Plants support human life by providing food, medicine, and various raw materials. 0.771
M17. Many everyday products like paper, cotton, and clothing are made from plants. 0.759
Factor 3: Cultural and Aesthetic Perception
M24. Plants are frequently used in folk motifs and decorative arts. 0.836
M25. Certain plants are used in traditional ceremonies, beliefs, and artworks. 0.820
M23. Plants do not aesthetically improve the environments they are found in. (-) 0.792
M26. Plants reflect the historical and ecological characteristics of a region. 0.772
21 Items12 Items5 Items4 Items
Note: Factor loadings represent standardized coefficients indicating the strength of association between each item and the latent factor.
Table 5. Model-data fit values for the data concerning the PPS.
Fit IndexesPerfect Fit CriteriaAcceptable Fit CriteriaFit Values for the PPS
a χ2/df0.00 ≤ χ2/df ≤22 ≤ χ2/df ≤ 32.204
b GFI0.95 ≤ GFI ≤ 1.000.90 ≤ GFI ≤ 0.950.915
b CFI0.95 ≤ CFI ≤ 1.000.90 ≤ CFI ≤ 0.950.949
b NFI0.95 ≤ NFI ≤ 1.000.80 ≤ NFI ≤ 0.950.911
b TLI0.95 ≤ TLI ≤ 1.000.80 ≤ TLI ≤ 0.950.942
c AGFI0.90 ≤ AGFI ≤ 1.000.85 ≤ AGFI ≤ 0.900.894
d RMSEA0.00 ≤ RMSEA ≤ 0.050.05 ≤ RMSEA ≤ 0.080.055
a [47,61], b [46,59,61], c [62] d [61]. Note: GFI = Goodness-of-Fit Index, CFI = Comparative Fit Index, NFI = Normed Fit Index, TLI = Tucker–Lewis Index, AGFI = Adjusted Goodness-of-Fit Index, RMSEA = Root Mean Square Error of Approximation.
Table 6. Descriptive statistics for each item on the PPS (N = 200).
FactorItemsMeanStandard Deviation
Ecological Awareness and Sustainability PerceptionM123.711.15
M53.631.12
M133.671.16
M84.010.95
M64.060.96
M153.920.99
M14.000.89
M104.020.97
M164.080.93
M114.001.04
M43.990.97
M24.090.84
Utility-Oriented Plant PerceptionM213.990.99
M184.011.04
M203.940.98
M143.980.96
M174.020.98
Cultural and Aesthetic PerceptionM243.701.14
M253.980.98
M234.050.98
M264.150.91
Note: Mean and standard deviation (SD) values are based on responses to a 5-point Likert scale ranging from 1 (“Strongly Disagree”) to 5 (“Strongly Agree”).
Table 7. Correlations between PPS scores and factor scores for exploratory factor analysis (EFA) and Confirmatory factor analysis (CFA) participants.
Factor 1Factor 2Factor 3Total Scale
EFAFactor 110.0850.1260.870 *
Factor 20.08510.270 *0.484 *
Factor 30.1260.270 *10.476 *
Total Scale0.870 *0.484 *0.476 *1
CFAFactor 110.0480.140 *0.869 *
Factor 20.04810.240 *0.452 *
Factor 30.140 *0.240 *10.482 *
Total Scale0.869 *0.452 *0.482 *1
* p < 0.01, N = 200 (for EFA), N = 400 (for CFA). Note: Values represent Pearson correlation coefficients. All values are based on standardized factor scores.
Disclaimer/Publisher’s Note: The statements, opinions and data contained in all publications are solely those of the individual author(s) and contributor(s) and not of MDPI and/or the editor(s). MDPI and/or the editor(s) disclaim responsibility for any injury to people or property resulting from any ideas, methods, instructions or products referred to in the content.

