1. Introduction
Autonomous vehicles (AVs) are rapidly transforming modern transportation, offering the potential to improve traffic safety, reduce congestion, and enhance operational efficiency. According to the SAE classification system, AVs are divided into six levels based on their degree of autonomy, ranging from Level 0 (no automation) to Level 5 (full automation). As of 2023, most commercially available AVs fall under Level 2 or Level 3, still requiring some form of human supervision. However, the gradual deployment of Level 4 and higher AVs—capable of fully autonomous driving under specific conditions—is expected to redefine future mobility systems.
The emergence of AVs has prompted extensive research to understand their implications for traffic dynamics. Studies have focused on various dimensions, such as crash mitigation potential [
1], traffic safety at different penetration levels [
2,
3], efficiency gains [
4], and infrastructure requirements [
5]. A significant number of these investigations rely on microscopic traffic simulation tools such as VISSIM, which offer high-resolution modeling of vehicle behavior and interactions [
6]. Recent studies have further emphasized the need to explore nonlinear impacts of AV penetration, especially under varying geometric and demand scenarios [
1,
2].
One of the most critical stages in AV deployment is the mixed traffic phase, where autonomous and human-driven vehicles (HDVs) coexist. This period presents challenges due to differences in driving behavior, response times, and decision-making consistency. Highways—with high speeds and complex geometries such as merging and weaving zones—are particularly vulnerable to these dynamics.
Although prior research shows that AVs can improve traffic flow and reduce delays, these benefits vary depending on AV penetration rates, behavior types, and roadway features. Many existing studies focus on overly simplified or isolated conditions, making it difficult to generalize findings to complex, real-world freeway systems.
To address these limitations, this study conducts a comprehensive VISSIM-based simulation to examine how AV penetration, driving behavior, and freeway geometry affect traffic performance and safety. Four representative freeway segments—basic straight sections, weaving zones, on-ramp merging areas, and AV-exclusive lanes—are modeled under varied traffic demands, ramp flow ratios, and AV behavior profiles. This factorial design enables a more realistic assessment of freeway readiness for mixed traffic conditions and helps identify the conditions under which AVs deliver meaningful operational benefits. Similar to recent efforts in dynamic system modeling using deep learning and physics-informed neural networks [
7,
8], our approach emphasizes the importance of capturing behavioral heterogeneity in simulation.
2. Literature Review
2.1. The Impact of AV Penetration on Traffic Performance
Several studies have demonstrated that increasing AV penetration can enhance traffic flow and road capacity, particularly beyond certain threshold levels [
1]. For instance, reductions in vehicle conflicts and smoother lane usage have been observed when AV share exceeds 30% [
2]. Other simulation results indicate improvements in speed stability and system-wide travel times under higher AV adoption [
3,
4]. Nonetheless, some researchers report contradictory findings, noting that moderate levels of AV penetration can induce flow disruptions or increase congestion in bottleneck zones due to behavioral mismatch between AVs and HDVs [
5,
6].
Despite these insights, most of the current literature considers a limited number of roadway scenarios and penetration levels. Our study aims to address this limitation by simulating a broad spectrum of AV adoption rates under multiple freeway configurations, offering deeper understanding of nonlinear performance patterns.
2.2. Influence of AV Behavior on Traffic Outcomes
Driving behavior plays a vital role in shaping traffic system performance. Studies have shown that cautious AVs can improve safety by minimizing lane changes and headway fluctuations, while aggressive AVs may optimize flow at the expense of stability [
9,
10]. The diversity in AV driving styles has led to heterogeneous results across simulation studies, highlighting the importance of coordinated AV behaviors for maximizing network efficiency [
1,
10].
Recent works have explored how different behavioral models affect intersection and freeway segment performance, with some noting that overly conservative AVs may unintentionally increase delay [
11,
12]. However, few studies systematically evaluate a range of AV behaviors across varying traffic and roadway conditions. Our work extends this research by modeling cautious, normal, and aggressive AV profiles and comparing their impacts under consistent simulation conditions.
2.3. Role of Road Type and Network Features
Roadway geometry significantly affects AV performance outcomes. Researchers have noted that continuous-flow environments like highways are more conducive to AV benefits than signalized arterial networks [
13,
14]. In particular, diverging and merging areas pose unique challenges for mixed traffic due to complex lane-changing demands and acceleration–deceleration patterns [
15,
16,
17]. While cooperative driving has been proposed as a potential solution [
18], few studies explore these effects across a wide variety of freeway segments.
The current study addresses this gap by including segment types such as weaving zones, construction-induced lane closures, and AV-exclusive lanes. By doing so, we investigate how geometric complexity interacts with AV behavior and market share to affect traffic dynamics.
2.4. Gaps in Scenario Diversity and Simulation Design
Many prior studies have focused on simplified or idealized freeway conditions, using fixed traffic volumes and uniform AV parameters. However, real-world freeway systems often include more complex and dynamic scenarios, such as the following:
Merging and diverging zones with variable on/off-ramp flow intensities.
Traffic disturbances due to construction-induced lane closures or bottlenecks.
Dedicated AV lanes that modify vehicle interaction dynamics.
Variations in speed limits and service levels based on traffic demand.
Despite their importance, these elements are rarely considered together in a unified and systematic modeling framework. In response, this study incorporates four representative freeway segment types—basic straight sections, weaving zones, on-ramp merging areas, and AV-exclusive lanes—into a comprehensive VISSIM-based simulation. By systematically varying AV penetration rates, behavior profiles, traffic volumes, and ramp flow ratios, the simulation captures realistic freeway dynamics under mixed traffic conditions and supports a scalable approach for evaluating AV integration strategies.
2.5. Comprehensive Scenario Modeling
Researchers have increasingly called for holistic scenario-based modeling frameworks that incorporate multiple variables, such as vehicle behavior, demand level, and infrastructure design. Some studies have explored theoretical thresholds for AV stability [
15], while others have proposed centralized control strategies for optimizing CAV operations [
19,
20]. Nevertheless, most lack empirical validation across diverse network settings.
Our simulation matrix integrates these variables within a factorial design, making it possible to isolate and assess the marginal effects of each parameter. This enables a more detailed analysis of the conditions under which AVs deliver tangible improvements to traffic systems.
3. Methodology
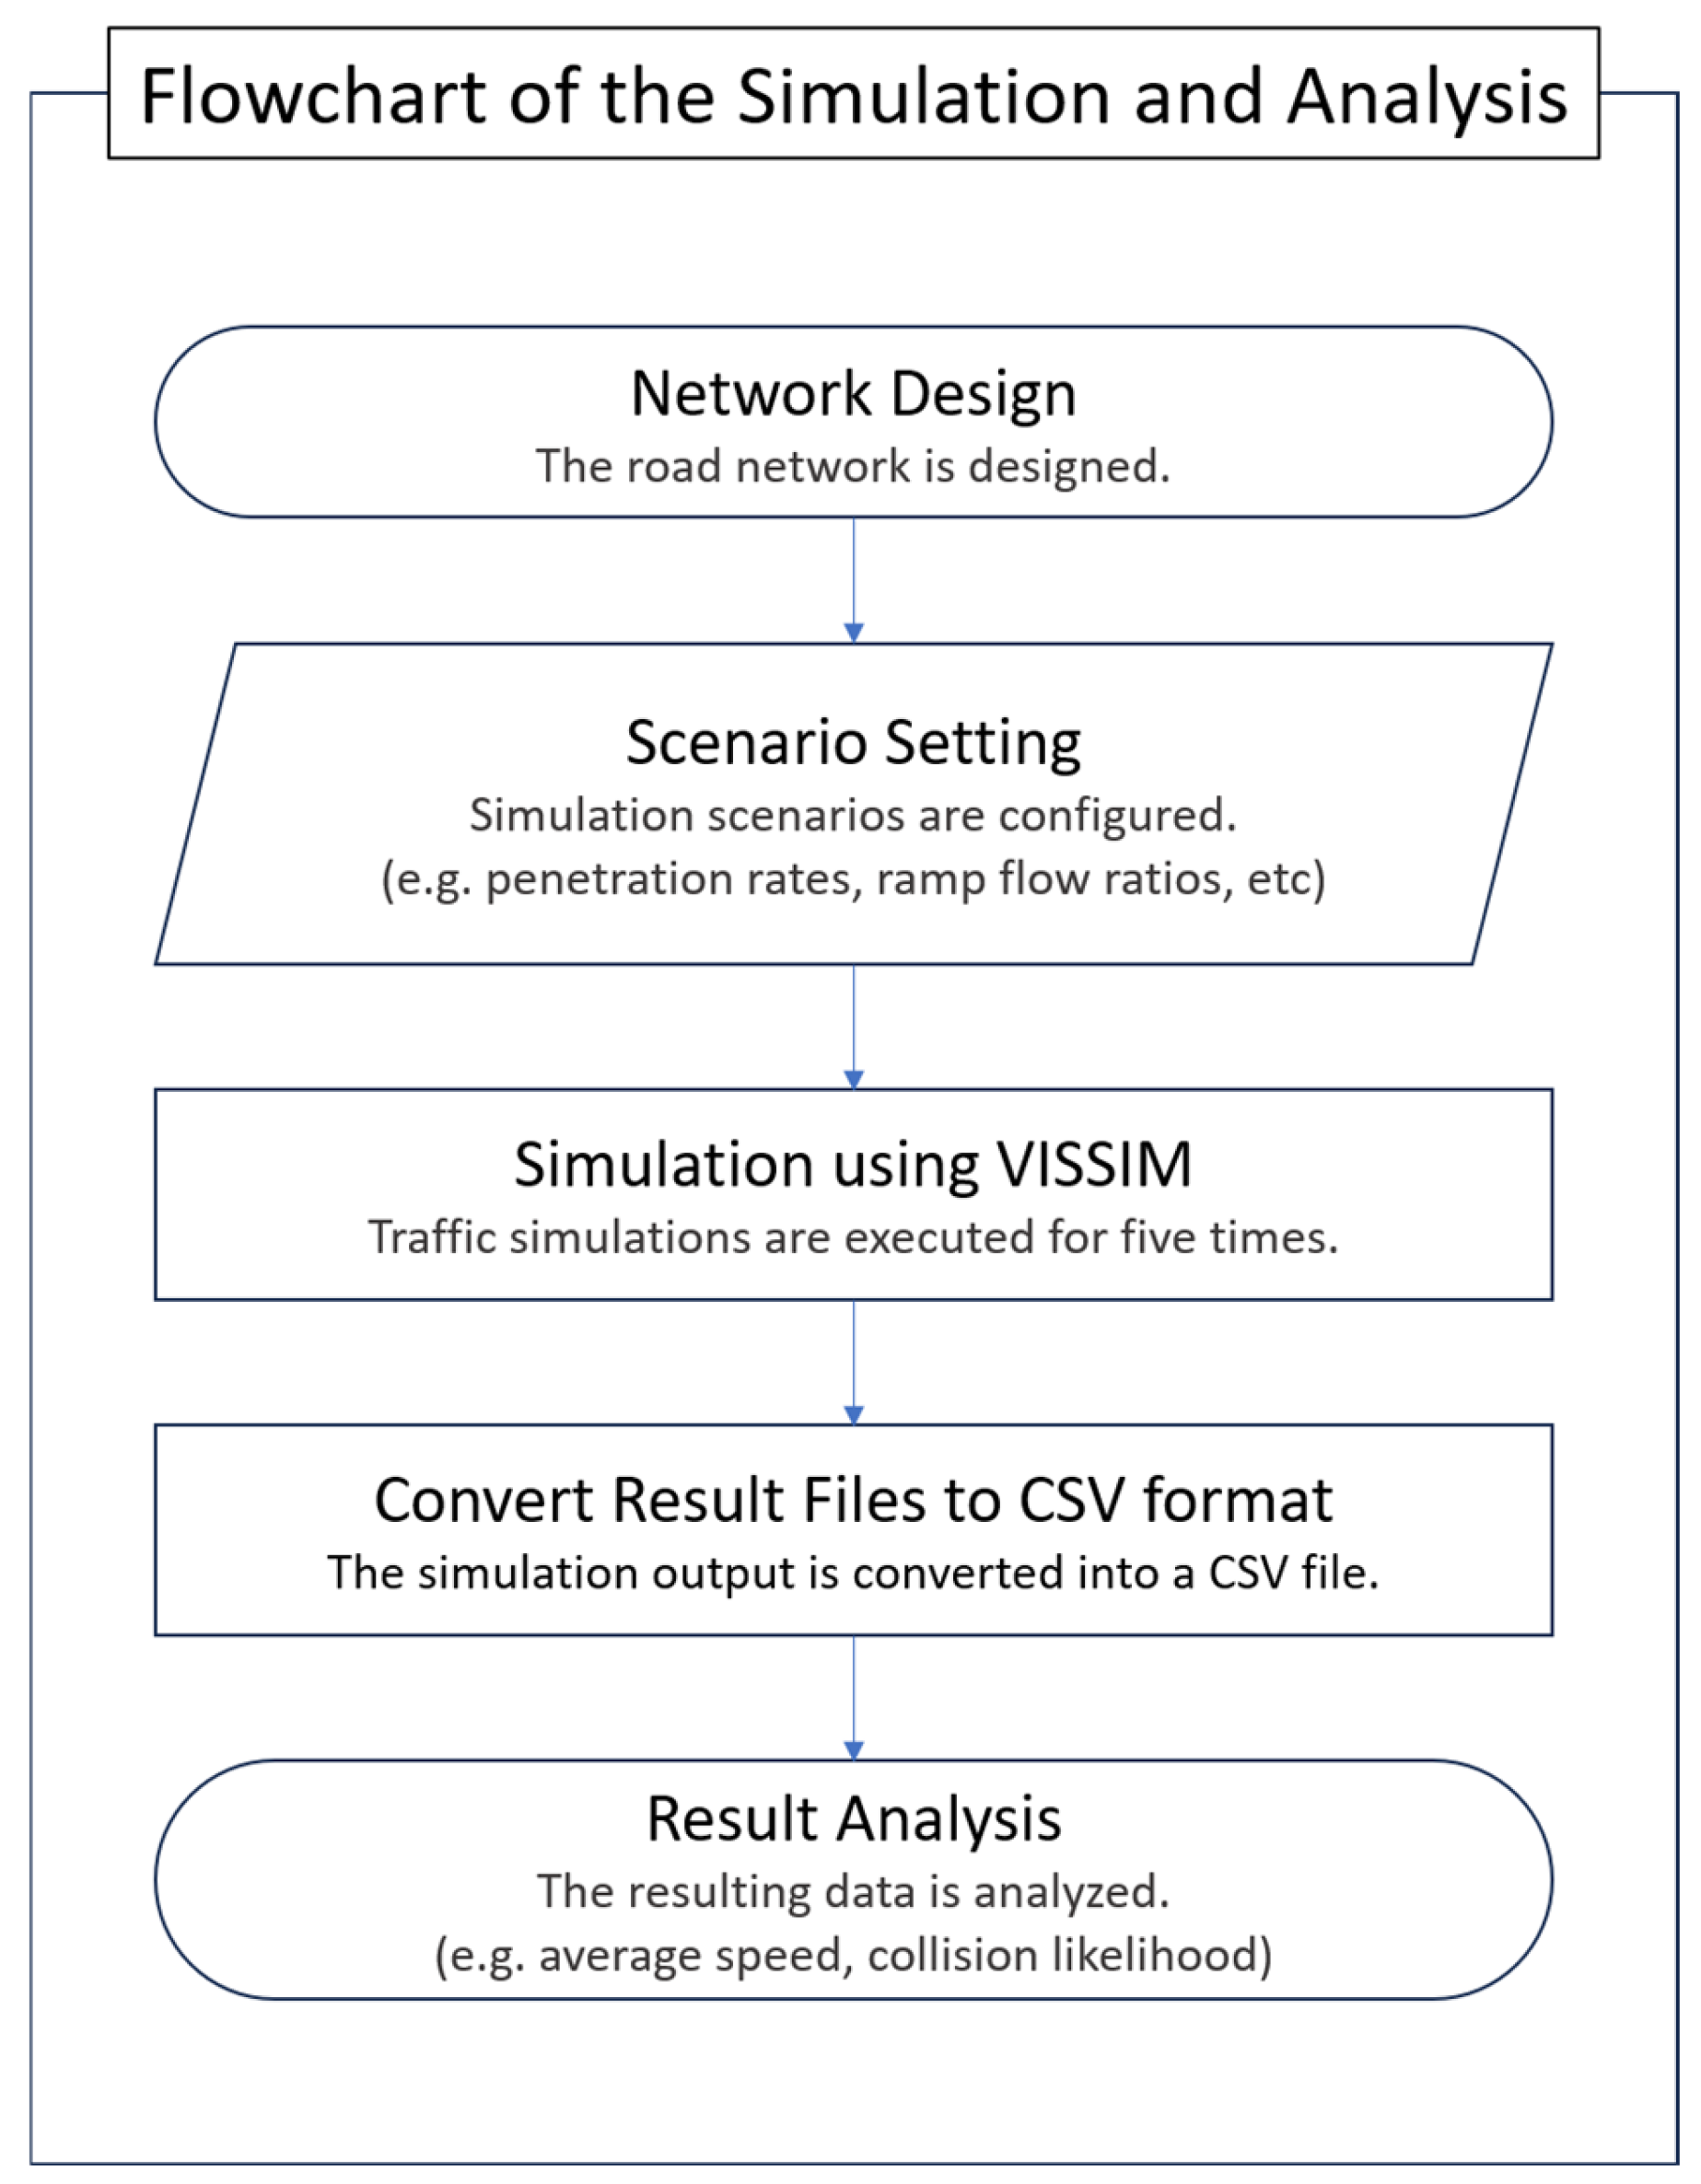
This study adopts a comprehensive microscopic simulation-based approach to evaluate the impact of autonomous vehicle (AV) penetration on traffic performance and safety in continuous-flow freeway environments. The key objective is to quantify how various factors—such as AV market share, traffic demand level, and merging/diverging intensity—interact with road geometry to influence operational efficiency and conflict frequency. By leveraging the capabilities of the VISSIM simulation platform (version 2024, PTV Group, Karlsruhe, Germany), this study aims to provide robust empirical insights that support data-driven policy and infrastructure planning during the transitional period toward mixed autonomy. The overall simulation process is summarized in
Figure 1.
3.1. Simulation Platform Selection
Among the available microscopic simulation tools, including SUMO and CityFlow, VISSIM was selected for its high granularity and superior flexibility in customizing vehicle dynamics, car-following models, and network geometry. VISSIM’s well-established Wiedemann driver behavior models enable precise calibration of driving behavior parameters, making it particularly suitable for simulating heterogeneous traffic composed of both AVs and human-driven vehicles (HDVs).
3.2. Network Architecture
The simulation network was developed to emulate a prototypical uninterrupted-flow freeway environment based on guidelines from the 2013 Korean Highway Capacity Manual. The baseline configuration features a 5 km three-lane freeway with directional flow, augmented with auxiliary on-ramps and off-ramps, each extending 500 m. To represent a wide spectrum of freeway operating conditions, the simulation network included four representative segment types:
This segment is a standard three-lane freeway without merging or diverging points. It serves as a control environment to examine the baseline effects of AV penetration under uninterrupted flow. Since the geometry is simple, it isolates the impact of AV behavior from external influences such as on-ramp turbulence.
This segment features both on- and off-ramp connections over a short segment length, requiring frequent lane changes within a constrained area. It simulates complex interactions where vehicles must merge and diverge within a limited distance, creating high turbulence and potential conflict points. The weaving intensity was controlled using different ramp flow ratios (5–30%), allowing for realistic analysis of AV effects under varying traffic dynamics.
This segment contains a dedicated on-ramp merging into the freeway’s rightmost lane. The focus here is on longitudinal interactions and the merging process under mixed traffic. Various ramp-to-mainline flow ratios (5–30%) were used to simulate light to heavy inflow demand. This setup evaluates how AV behavior influences conflict rates and capacity during the merging process.
Identical in geometry to Segment C, this version designates the innermost (leftmost) lane as an AV-only lane. The configuration aims to evaluate whether behavioral segregation improves overall flow and safety in high-conflict merging environments. By separating AVs from HDVs, the segment allows analysis of whether homogenous behavior within a lane can reduce lane-change conflicts and enhance throughput.
Each segment was developed to mimic real-world freeway patterns and bottlenecks. Together, these segments provide a robust framework for analyzing how different combinations of AV penetration, behavior, and road geometry influence traffic operations. The detailed layout of each segment is summarized in
Table 1.
3.3. Scenario Matrix Design
A factorial experimental design was employed to generate simulation scenarios by systematically varying three core parameters:
AV penetration rate: {0%, 20%, 40%, 60%, 80%, 100%}.
Traffic demand (service level): {A, B, C, D, E, F}, corresponding to per-lane volumes of 600, 1000, 1350, 1750, 2200, and 2600 pcphpl, respectively.
Ramp flow ratio: applied in merging and diverging segments to reflect variable entry/exit demand intensity.
Each scenario utilized a default speed limit of 100 km/h, with the exception of speed-reduction scenarios (Segment G), which were limited to 80 km/h. AV volumes were assigned in proportion to the total traffic demand based on the designated penetration level.
The total number of unique scenarios across all combinations of road types, AV penetration, traffic demand, and ramp ratios exceeded 1500, providing a rich basis for sensitivity analysis and multivariate comparisons.
3.4. Vehicle Classification and Behavior Modeling
Vehicles were divided into two primary classes: human-driven vehicles (HDVs) and autonomous vehicles (AVs). HDVs were further segmented into passenger cars, trucks, and buses to reflect heterogeneous driving patterns. AVs were sub-classified based on driving style into three behavior models—cautious, normal, and aggressive—representing differing levels of headway preference, acceleration aggressiveness, and lane-changing strategy.
By default, the simulation assumed an equal distribution of AV driving behaviors, assigning 33.33% of AVs to each behavior category (cautious, normal, aggressive), unless otherwise specified in targeted scenario analyses.
To enhance the realism of the simulation, different car-following models were applied to each vehicle type: AVs used the Wiedemann 99 model, while HDVs followed the Wiedemann 74 model. The key behavioral parameters were as follows:
Gap time (CC1): 1.5 s (cautious), 0.9 s (normal), 0.6 s (aggressive).
Standstill distance (CC0): 1.5 m (cautious/normal), 1.0 m (aggressive).
Acceleration at 80 km/h (CC9): 1.2–2.0 m/s2, depending on aggressiveness.
Cooperative lane-changing: enabled for normal and aggressive AVs; disabled for HDVs and cautious AVs.
Max deceleration for mandatory lane change (own/trailing): adjusted per behavior type.
Detailed AV behavior parameters used in the simulation are provided in
Table 2.
By applying these detailed parameters according to vehicle type and behavioral characteristics, the simulation was able to effectively model the diverse interactions between human drivers and autonomous vehicles in real-world traffic environments.
3.5. Simulation Execution and Evaluation Metrics
All scenarios were simulated using VISSIM for a duration of 4200 simulation seconds (70 min), following a warm-up period. Each scenario was repeated five times using different random number seeds to mitigate the effects of stochastic variation. The detailed simulation settings are summarized in
Table 3.
Performance was evaluated using the following key performance indicators (KPIs):
Conflict counts were extracted using VISSIM’s built-in trajectory file and analyzed using post-processing tools. These indicators collectively offer a holistic view of both operational efficiency and safety under mixed traffic conditions.
4. Results
This section presents the outcomes of microscopic simulations conducted on seven freeway segment types, each reflecting unique geometric or operational features. Key performance indicators—average speed, travel time, rear-end collision risk, and lane-change conflicts—were analyzed across varying AV penetration rates and traffic conditions.
4.1. Segment A: Basic Straight Section
Simulation outcomes from the basic three-lane freeway segment revealed that the impact of autonomous vehicle (AV) integration on both traffic efficiency and safety is relatively limited in geometrically simple, uninterrupted flow conditions.
4.1.1. Traffic Efficiency
Figure 2a shows that average speed increased only marginally as AV penetration rose from 0% to 100%, with the highest-demand condition (2600 pcphpl) improving from 93.58 km/h to 95.70 km/h—a change of just over 2%. This trend was consistent across all volume levels, with mid-range demand scenarios showing similarly modest gains. At low demand levels (≤1000 pcphpl), traffic was already operating near free-flow conditions (≥105 km/h), leaving little room for further improvement. These results suggest that AVs alone do not substantially enhance throughput in basic freeway segments.
4.1.2. Safety Outcomes
Figure 2b illustrates the frequency of rear-end conflicts, which also showed no significant improvement. In fact, collision risk slightly increased at intermediate AV shares (e.g., peaking at 11.60 conflicts at 60% AV under 2600 pcphpl), potentially due to behavioral mismatches between AVs and human-driven vehicles. Although a slight decline in collisions was observed at higher AV penetration levels, the change was neither dramatic nor consistent. In low and moderate demand conditions, rear-end conflicts remained low regardless of AV ratio, indicating that AV presence had little measurable impact on longitudinal safety in these scenarios.
4.1.3. Conclusion for Segment A
Taken together, the results suggest that AV deployment in basic freeway segments offers minimal performance benefits, particularly under saturated or free-flow conditions. While modest improvements in speed and collision rates were observed at high AV penetration levels, the overall effect remained small. These findings underscore the need for caution when generalizing the advantages of AVs and point to the importance of roadway complexity and traffic dynamics in determining their true operational value.
4.2. Segment B: Weaving Zone
This segment represents a 5 km, three-lane freeway section with a design speed of 100 km/h, characterized by both merging and diverging traffic flows. To evaluate the effects of AV deployment under varying weaving intensities, simulations were conducted using six ramp flow ratios—5%, 10%, 15%, 20%, 25%, and 30%—defined as the proportion of ramp traffic relative to the mainline traffic volume. Each scenario was tested across a range of AV penetration levels from 0% to 100%.
4.2.1. Traffic Efficiency
Figure 3 illustrates the simulation results for the weaving segment, showing how traffic performance varies across ramp-to-mainline volume ratios and AV penetration levels. Simulation results for the weaving segment demonstrate that the traffic performance impact of AVs is strongly dependent on the ramp-to-mainline volume ratio. When the ramp flow accounted for only 5% of mainline traffic, increased AV penetration consistently improved average speeds, especially under moderate to high traffic volumes. In such scenarios, AVs helped stabilize flow and reduce turbulence caused by merging behavior.
However, when the ramp flow ratio exceeded 10%, the efficiency benefits of AVs diminished. At 20% and above, average speeds either plateaued or declined as AV penetration increased. For example, at a 30% ramp ratio and high demand, even 100% AV deployment failed to restore flow conditions, with speeds falling below 20 km/h. This indicates that excessive lateral interactions can override the stabilizing effect of AV control logic, particularly when behavioral diversity is not managed.
This unexpected performance drop is attributed to the behavioral composition of AVs in the simulation, in which one-third were configured as “cautious.” These vehicles exhibit longer gap acceptance and reduced lane-changing assertiveness, which in high-conflict environments like weaving zones, results in traffic turbulence and bottlenecks. The findings suggest that without adaptive or coordinated behavior strategies, simply increasing the AV ratio may not yield efficiency gains in complex geometric segments.
4.2.2. Safety Outcomes
Figure 4 shows the simulated lane-change conflict outcomes under different AV penetration rates and ramp merging ratios. Lane-change conflict frequency also varied with the ramp-to-mainline volume ratio. At 5%, increasing the AV share substantially reduced lane-change conflicts—up to a 73% drop at full AV penetration under high demand. This reflects the benefits of consistent and predictable AV merging behavior in simple conditions.
Conversely, at ramp ratios above 15%, conflict frequencies began to increase again as the AV share grew. At a 30% ramp ratio, conflicts exceeded 260 at 100% AV penetration under peak flow. This outcome is likely driven by the conservative nature of one-third of the AV fleet (cautious profile), which prolongs decision times and exacerbates merging disruptions. In high weaving intensity environments, such caution can unintentionally create new safety risks.
4.2.3. Impact of AV Behavior Composition
Figure 5 shows the average speed outcomes for the Weaving Segment under 100% aggressive AV behavior across various ramp and volume conditions. The composition of autonomous vehicle (AV) driving behavior significantly influences traffic performance, particularly in complex weaving scenarios. In earlier simulations assuming an equal distribution of cautious, normal, and aggressive AVs (33.3% each), the results showed limited benefits from higher AV penetration, especially as the ramp-to-mainline traffic ratio increased. Under heavy weaving conditions, average speeds stagnated or declined, reflecting the disruptive effects of cautious AVs that hesitated during merging and delayed overall flow.
In contrast, simulations using 100% aggressive AVs revealed a consistent and substantial improvement in average speeds across all traffic volumes and ramp ratios. Even in high ramp scenarios (20% and above), where mixed-behavior AVs struggled to maintain flow, aggressive AVs preserved high-speed conditions and stabilized throughput. This behavior stems from their assertive decision-making, which reduces hesitation during lane changes and enables more efficient gap utilization.
These findings suggest that traffic benefits from AV deployment are not solely dependent on the proportion of AVs but also on the nature of their behavioral algorithms. As Level 4+ AVs become commercially available, variations in behavior across manufacturers could reintroduce instability unless managed through coordination protocols or behavior standardization. Future infrastructure and policy frameworks must consider not only AV presence but also how AVs behave—ensuring behavior-aware integration strategies are in place to realize their full potential in high-demand, complex traffic environments.
4.2.4. Conclusion for Segment B
The performance of AVs in weaving zones is strongly influenced by the ramp-to-mainline traffic volume ratio. When ramp volumes are low (≤10%), increasing the share of AVs contributes positively to traffic conditions—improving average speeds and reducing lane-change conflicts through more consistent and responsive driving behavior.
In contrast, under higher ramp demand conditions (≥20%), these advantages tend to diminish or even reverse. In particular, when cautious AV behaviors are present in the fleet, prolonged merging decisions can lead to flow disruptions and increased lateral interactions. To ensure AV deployment remains effective in such geometrically complex areas, strategies must account not only for AV market share but also for behavior composition and appropriate infrastructure design. Tailored interventions—such as dedicated AV lanes, behavior harmonization protocols, or ramp metering—may be necessary to fully realize the benefits of AV integration in high-conflict freeway segments.
4.3. Segment C: On-Ramp Merging Segment
This segment represents a 5 km, three-lane freeway section with a design speed of 100 km/h, characterized by both merging and diverging traffic flows. To evaluate the effects of AV deployment under varying weaving intensities, simulations were conducted using six ramp flow ratios—5%, 10%, 15%, 20%, 25%, and 30%—defined as the proportion of ramp traffic relative to the mainline traffic volume. Each scenario was tested across a range of AV penetration levels from 0% to 100%.
4.3.1. Traffic Efficiency
Figure 6 presents the simulation results for the Merging Segment (Segment C), showing average speeds under various AV penetration levels and ramp volumes. Segment C is a 5 km, three-lane freeway with a design speed of 100 km/h, including ramp inflows at varying proportions relative to mainline traffic. Simulation results show that the effect of AV penetration on traffic efficiency depends strongly on the level of ramp demand.
At low ramp volumes (5%), average speed increases steadily with higher AV ratios, especially under high traffic conditions. This suggests that AVs help smooth merging interactions in simpler traffic scenarios, enhancing flow stability.
However, when ramp volume exceeds 10%, the benefits reduce. In moderate to high ramp ratios (≥15%), average speed declines as AV share increases—particularly at high demand (1750–2200 pcphpl). This decline is most prominent in the 25% and 30% ramp cases. The likely cause is cautious AV behavior delaying merges and causing turbulence and local slowdowns near the ramp.
Thus, while AVs improve efficiency under mild merging conditions, their advantage decreases in complex environments without additional coordination strategies such as ramp metering or behavior alignment.
4.3.2. Safety Outcomes
Figure 7 presents the lane-change conflict outcomes for the On-ramp Merging Segment (Segment C) under different AV penetration levels and ramp merging ratios. The simulation results reveal a complex relationship between AV penetration and lane-change conflict frequency in on-ramp merging scenarios. At low ramp volume ratios (5–10%), AV deployment shows a marginal benefit, with conflict frequency either slightly decreasing or remaining stable across increasing AV ratios. For example, under a 5% ramp ratio and moderate traffic demand, conflicts remained consistently low regardless of AV share, suggesting minimal impact on merging dynamics in simple scenarios.
However, as ramp volume ratios increased (≥15%), conflict frequency rose sharply—particularly at intermediate AV ratios (40–80%). In the 30% ramp scenario, the highest conflict levels were observed around 60–80% AV penetration, indicating that partial automation may exacerbate merging disruptions. This is likely due to behavioral heterogeneity and the conservative nature of cautious AVs, which delay merging maneuvers and prolong interaction with surrounding vehicles.
Interestingly, conflict levels declined slightly at full AV penetration (100%) in several high ramp scenarios. This suggests that consistency in AV behavior and improved coordination at full deployment may help mitigate the safety degradation seen at mixed autonomy levels.
These findings highlight that AVs do not uniformly reduce lane-change risks in merging zones. Instead, safety outcomes depend heavily on ramp volume, traffic demand, and the proportion of AVs in the flow. Strategies such as behavior harmonization and infrastructure support may be required to ensure safe operations in high-demand merging environments.
4.3.3. Conclusion for Segment C
The effectiveness of AV deployment in on-ramp merging segments is highly contingent upon the proportion of ramp traffic relative to the mainline flow. When ramp demand is low (≤10%), increased AV penetration tends to enhance traffic performance by improving speed and maintaining low lane-change conflict frequency. These benefits reflect AVs’ capacity to stabilize merging under simple, low-intensity conditions.
However, under moderate to high ramp ratios (≥15%), traffic efficiency and safety outcomes deteriorate with rising AV penetration—especially at intermediate AV ratios (40–80%). Average speeds decline, and lane-change conflicts increase, indicating that cautious AV behavior and interaction complexity can offset the benefits of automation. Interestingly, full AV penetration (100%) partially restores stability by reducing behavioral heterogeneity and improving merging coordination.
These findings underscore that AV benefits in merging zones are not universal. Targeted strategies such as ramp metering, behavior calibration, and AV cooperation protocols are necessary to ensure reliable performance in complex, high-demand merging environments.
4.4. Segment D: AV-Exclusive Lane (1st Lane Reserved for AVs)
To evaluate the impact of lane designation on traffic performance, Segment D introduces an AV-exclusive lane in the same on-ramp merging site used in Segment C. Specifically, the innermost lane (1st lane) is reserved solely for autonomous vehicles. This configuration enables a direct comparison with Segment C to assess whether lane segregation can alleviate the negative effects observed under high AV penetration and ramp flow conditions. By analyzing changes in average speed and lane-change conflicts, the analysis aims to determine the operational effectiveness of AV-exclusive infrastructure under mixed and full AV deployment scenarios.
4.4.1. Traffic Efficiency
Figure 8 illustrates the average speed outcomes for Segment D with an AV-exclusive lane under varying ramp inflow ratios and AV penetration levels. The implementation of an AV-exclusive lane in Segment D shows differentiated impacts on traffic efficiency depending on both the ramp inflow ratio and overall traffic demand. Compared to Segment C, where AVs mixed with human-driven vehicles across all lanes, Segment D offers improved flow performance under certain conditions.
At low ramp inflow ratios (5–10%), the AV-exclusive lane enhances average speed across nearly all traffic volumes. Notably, under high mainline demand (2200 pcphpl), average speed increases steadily as the AV ratio rises, reaching over 90 km/h at full AV penetration in the 5% ramp case. This indicates that dedicating space for AVs helps preserve flow quality, especially during merging.
However, as ramp ratios increase (15% or higher), the benefits begin to taper off. While speeds remain more stable than in Segment C, degradation occurs at intermediate AV ratios (40–60%) and lower speed zones appear, particularly under high traffic demand. Still, in contrast to the sharp decline seen in Segment C under similar conditions, Segment D maintains higher overall speeds—suggesting that the exclusive lane buffers some of the disruption caused by merging and cautious AV behavior.
These findings suggest that AV-exclusive lanes can contribute to stabilizing merging operations and preserving traffic flow, particularly when AV market share is substantial and ramp demand is moderate. However, design strategies must still consider coordination between AV and non-AV lanes to ensure balanced utilization and mitigate speed differential issues.
4.4.2. Safety Outcomes
Figure 9 presents the lane-change conflict outcomes for Segment D with an AV-exclusive lane, under various ramp inflow ratios and AV penetration levels. The simulation results for Segment D, which incorporates an AV-exclusive lane, reveal meaningful changes in lane-change conflict patterns compared to the baseline case in Segment C without the exclusive lane.
At low ramp ratios (5–10%), the presence of an AV-exclusive lane slightly reduces lane-change conflict frequencies across most traffic volumes, especially under high AV penetration levels (≥80%). For example, at a 5% ramp ratio and 2200 pcphpl, conflicts decrease from 23 (Segment C) to 16 (Segment D), indicating smoother merging and reduced vehicle interaction due to AV segregation.
As ramp ratios increase to 15–20%, the differences become more pronounced. Conflict peaks observed at intermediate AV penetration levels (40–60%) in Segment C are significantly dampened in Segment D. The AV-exclusive lane appears to buffer the turbulence caused by cautious AV behavior, preventing conflict escalation. For instance, at a 20% ramp ratio and 1750 pcphpl, Segment D records only 144 conflicts at a 40% AV ratio, compared to 233 in Segment C—an improvement of nearly 40%.
In high ramp ratio conditions (25–30%), where conflict risks were most severe in Segment C due to mixed behavior and dense merging zones, the AV-exclusive lane helps to contain the growth of conflicts. Although conflict frequencies still rise with higher AV penetration, the peak values are substantially lower than those in Segment C. For example, at a 30% ramp ratio and 1350 pcphpl, the maximum conflicts recorded in Segment D are 208, compared to 265 in Segment C.
These findings demonstrate that implementing an AV-exclusive lane can mitigate the negative safety impacts seen in high-demand merging zones, especially where mixed AV behavior contributes to interaction delays. By isolating AVs into a dedicated lane, behavioral consistency is improved, reducing the frequency and severity of disruptive lane changes. Overall, the AV-exclusive lane is shown to be an effective infrastructure strategy for enhancing safety under mixed autonomy and varying ramp inflows.
4.4.3. Conclusion for Segment D
The simulation results for Segment D indicate that implementing an AV-exclusive lane can be an effective strategy for improving traffic operations in freeway merging areas, particularly under specific demand and geometric conditions. Compared to Segment C, where AVs shared lanes with human-driven vehicles, Segment D achieved higher average speeds and lower lane-change conflict frequencies in most scenarios.
The AV-exclusive lane was especially effective when ramp inflow ratios were low to moderate (5–15%) and the AV penetration rate was relatively high (≥60%). Under these conditions, traffic flow remained stable even at high demand levels, and merging disruptions were minimized due to reduced interaction between AVs and human drivers. In contrast, under low AV ratios or very high ramp demands (≥25%), the benefits diminished, and lane underutilization or congestion in non-AV lanes could occur.
Therefore, AV-exclusive lanes are most efficient when the following apply:
AV market share is moderate to high (typically ≥60%);
Ramp inflow ratios are low to moderate (≤15%);
Traffic volume is high, and efficient merging management is critical.
To maximize effectiveness, these lanes should be paired with supporting strategies, such as adaptive lane management, coordinated merging controls, and dynamic assignment based on real-time AV presence. Without such integration, the benefits of lane segregation may be partially offset by inefficiencies in lane balancing and merging complexity.
5. Discussion
As autonomous vehicles (AVs) transition from experimental deployment to real-world implementation, it is increasingly evident that roadway operations cannot remain static. The results of this study highlight that AV penetration rates and behavioral profiles fundamentally reshape traffic dynamics—requiring a shift toward adaptive, context-sensitive infrastructure planning and traffic management strategies.
5.1. Behavior-Sensitive Infrastructure Design
AVs exhibit diverse behavioral profiles depending on their programming, ranging from cautious (longer headways, conservative gap acceptance) to aggressive (shorter headways, assertive lane changes). These differences have tangible effects:
In merging zones or weaving segments, cautious AVs can create turbulence by hesitating during gap acceptance, reducing capacity and increasing lane-change conflicts.
Conversely, aggressive AVs may improve throughput but introduce lateral safety risks in human-dominated flows.
As such, infrastructure must be responsive to these behavioral traits. For example:
AV-exclusive lanes should be considered where AV market share is high and behavior consistency can be ensured.
Ramp metering or dynamic merging controls may be required to balance cautious AVs with fast-moving human traffic.
Dedicated infrastructure zones (e.g., AV corridors) can be planned for segments with high ramp-to-mainline complexity.
5.2. Penetration-Driven Operational Phasing
AV benefits are not linear with penetration rate. This study shows the following:
At low AV ratios (≤20%), human driver dominance limits AV impact.
At mid-level AV ratios (40–60%), performance may degrade due to mixed behaviors and coordination failures.
Only at high AV ratios (≥80%) do flow stability and safety consistently improve—especially when AV behavior is harmonized.
Thus, roadway operations must evolve dynamically alongside AV adoption. A recommended approach includes the following:
Phase 1 (Low AV share): Focus on compatibility and safety. Use signage, communication protocols (e.g., V2X), and conservative lane-use strategies.
Phase 2 (Intermediate AV share): Address transitional inefficiencies via lane balancing, behavior calibration, and conflict management tools.
Phase 3 (High AV share): Enable more aggressive optimization—dedicated lanes, AV-prioritized intersections, and real-time coordination platforms.
5.3. Need for Standardized Behavior Protocols
As manufacturers adopt varied behavioral algorithms to optimize comfort, safety, or efficiency, behavioral heterogeneity among AVs will increase. This study suggests that such differences could become a new source of traffic volatility—particularly in mixed traffic scenarios. Actions to mitigate this risk include the following:
Regulatory bodies should consider behavior standardization frameworks for AVs, ensuring interoperability and predictability.
Inter-AV communication protocols (e.g., cooperative merging, platooning standards) can align behaviors in high-density flows.
Infrastructure-assisted behavior modulation, such as smart ramps that adjust AV behavior based on real-time conditions, may offer further integration opportunities.
6. Conclusions
This study comprehensively examined the operational and safety impacts of autonomous vehicle (AV) deployment in freeway environments, using high-resolution VISSIM simulations across seven distinct segment types. By systematically varying AV penetration levels, driving behavior profiles, and geometric features such as ramp inflow ratios, this research offers a nuanced understanding of how AVs interact with complex road systems under mixed traffic conditions.
The results confirm that the benefits of AV deployment are highly conditional—not only on market share but also on the behavioral characteristics of AVs and the geometric complexity of the road network. In simple segments such as basic straight sections, AV integration had minimal impact on traffic performance, with only marginal gains in speed and safety. In contrast, merging and weaving zones exhibited strong sensitivity to AV behavior and ramp volume. While AVs improved flow stability under light ramp conditions, performance deteriorated at intermediate AV ratios or high ramp inflow, largely due to cautious driving behavior delaying merging maneuvers.
This study also demonstrated that infrastructure design plays a critical mediating role. In particular, AV-exclusive lanes mitigated some of the negative effects observed in high-demand merging zones, reducing lane-change conflicts and improving average speeds when AV market share was substantial (≥60%). These findings underscore the importance of behavior-aware infrastructure strategies, such as dynamic lane assignments, behavior harmonization protocols, and adaptive merging controls.
As Level 4+ AVs become increasingly common, behavioral heterogeneity across manufacturers may emerge as a new source of volatility in mixed traffic systems. This calls for the development of regulatory and technological frameworks to ensure interoperability, coordination, and real-time behavioral adaptation.
In conclusion, the transition to autonomous freeway mobility demands not only technological advancement but also strategic evolution in traffic operations, policy, and infrastructure design. AV behavior, market penetration, and roadway complexity must be jointly considered to fully realize the safety and efficiency potential of autonomous transportation.
Author Contributions
Conceptualization, M.P.; Methodology, M.P. and T.E.; Software and formal analysis, T.E.; Validation and supervision, M.P.; Writing—original draft, M.P. and T.E.; Writing—review and editing, M.P. All authors have read and agreed to the published version of the manuscript.
Funding
This work is supported by the Korea Agency for Infrastructure Technology Advancement (KAIA) grant funded by the Ministry of Land, Infrastructure and Transport (Grant RS-2022-00141102).
Institutional Review Board Statement
Not applicable.
Informed Consent Statement
Not applicable.
Data Availability Statement
The original contributions presented in this study are included in the article. Further inquiries can be directed to the corresponding author.
Conflicts of Interest
Author Minju Park is employed by SIANDIS Inc. The remaining author declare that the research was conducted in the absence of any commercial or financial relationships that could be construed as a potential conflict of interest.
References
- Ye, L.; Yamamoto, T. Modeling connected and autonomous vehicles in heterogeneous traffic flow. Phys. A 2018, 490, 269–277. [Google Scholar] [CrossRef]
- Shin, S.; Cho, Y.; Lee, S.; Park, J. Assessing traffic-flow safety at various levels of autonomous-vehicle market penetration. Appl. Sci. 2024, 14, 5453. [Google Scholar] [CrossRef]
- Liu, Y.; Guo, J.; Taplin, J.; Wang, Y. Characteristic analysis of mixed traffic flow of regular and autonomous vehicles using cellular automata. J. Adv. Transp. 2017, 2017, 8142074. [Google Scholar] [CrossRef]
- Matalqah, I.; Shatanawi, M.; Alatawneh, A.; Mészáros, F. Impact of different penetration rates of shared autonomous vehicles on traffic: Case study of Budapest. Transp. Res. Rec. 2022, 2676, 396–408. [Google Scholar] [CrossRef]
- Zhang, T.; Gao, K. Will autonomous vehicles improve traffic efficiency and safety in urban road bottlenecks? The penetration rate matters. In Proceedings of the 2020 IEEE 5th International Conference on Intelligent Transportation Engineering (ICITE), Beijing, China, 11–13 September 2020; pp. 366–370. [Google Scholar] [CrossRef]
- Guo, X.-Y.; Jia, A. Study on traffic flow mixed with autonomous vehicles and human-driven vehicles. In Proceedings of the 2022 3rd International Conference on Intelligent Design (ICID), Xi’an, China, 21–23 October 2022; pp. 166–171. [Google Scholar] [CrossRef]
- Chen, Y.; Liu, X.; Rao, M.; Qin, Y.; Wang, Z.; Ji, Y. Explicit speed-integrated LSTM network for non-stationary gearbox vibration representation and fault detection under varying speed conditions. Reliab. Eng. Syst. Saf. 2025, 254, 110596. [Google Scholar] [CrossRef]
- Ji, Y.; Huang, Y.; Yang, M.; Leng, H.; Ren, L.; Liu, H.; Chen, X. Physics-informed deep learning for virtual rail train trajectory following control. Reliab. Eng. Syst. Saf. 2025, 261, 111092. [Google Scholar] [CrossRef]
- Xie, H.; Ren, J.; Lei, J. Influence of lane-changing behavior on traffic flow velocity in mixed traffic environment. J. Adv. Transp. 2022, 8150617. [Google Scholar] [CrossRef]
- Rao, R.; Park, S.Y.; Chang, G. Developing the guidelines for managing autonomous vehicle flows on congested highways: A case study of MD-100. Simulation 2021, 97, 367–382. [Google Scholar] [CrossRef]
- Pan, A.; Zhang, X.; Nakamura, H.; Alhajyaseen, W.K.M. Investigating the efficiency and safety of signalized intersections under mixed flow conditions of autonomous and human-driven vehicles. Arab. J. Sci. Eng. 2020, 45, 8607–8618. [Google Scholar] [CrossRef]
- Niroumand, R.; Hajibabai, L.; Hajbabaie, A.; Tajalli, M. Effects of autonomous driving behavior on intersection performance and safety in the presence of white phase for mixed-autonomy traffic stream. Transp. Res. Rec. 2022, 2676, 112–130. [Google Scholar] [CrossRef]
- He, S.; Guo, X.; Ding, F.; Qi, Y.; Chen, T. Freeway traffic speed estimation of mixed traffic using data from connected and autonomous vehicles with a low penetration rate. J. Adv. Transp. 2020, 1361583. [Google Scholar] [CrossRef]
- So, J.; Hwangbo, J.; Kim, S.H.; Yun, I. Analysis on autonomous vehicle detection performance according to various road geometry settings. J. Intell. Transp. Syst. 2022, 27, 384–395. [Google Scholar] [CrossRef]
- Bahavarnia, M.; Taha, A.F. How many autonomous vehicles are required to stabilize traffic flow? arXiv 2024, arXiv:2408.11212. [Google Scholar] [CrossRef]
- Wang, L.; Guo, Y.; Liu, Y.; Zhu, J. Mixed traffic flow characteristics analysis under different proportion of autonomous vehicles. Proc. SPIE 2024, 13064, 1306439. [Google Scholar] [CrossRef]
- Zhang, J.; Li, Y.; Guo, Y.; Ma, K. Study on traffic flow characteristics in mixed automated and manual driving conditions. In Proceedings of the 2022 China Automation Congress (CAC), Xiamen, China, 25–27 November 2022; pp. 1003–1007. [Google Scholar] [CrossRef]
- Fang, X.; Li, H.; Tettamanti, T.; Eichberger, A.; Fellendorf, M. Effects of automated vehicle models at the mixed traffic situation on a motorway scenario. Energies 2022, 15, 2008. [Google Scholar] [CrossRef]
- Algomaiah, M.; Li, Z. Next-generation interchange control based on centralized management of connected and autonomous vehicles. IEEE Access 2019, 7, 82939–82955. [Google Scholar] [CrossRef]
- Carvalho, L.; Guerra, A.R.M.; Wang, X.; Manjunatha, P.; Elefteriadou, L. Simulation platform for testing and evaluation of CAV trajectory optimization and signal control algorithm integrated with commercial traffic simulator. In Proceedings of the 2022 Winter Simulation Conference (WSC), Singapore, 11–14 December 2022; pp. 1672–1682. [Google Scholar] [CrossRef]
Figure 1.
Flowchart illustrating the overall simulation and analysis process.
Figure 1.
Flowchart illustrating the overall simulation and analysis process.
Figure 2.
Simulation results for the Basic Segment: (a) average speed across AV penetration rates and traffic demand levels; (b) rear-end collision frequency under the same conditions.
Figure 2.
Simulation results for the Basic Segment: (a) average speed across AV penetration rates and traffic demand levels; (b) rear-end collision frequency under the same conditions.
Figure 3.
Simulation results for the Weaving Segment (Segment B): (a–f) average speed across varying AV penetration rates and traffic volumes, under different ramp merging/diverging ratios (5%, 10%, 15%, 20%, 25%, 30%, respectively).
Figure 3.
Simulation results for the Weaving Segment (Segment B): (a–f) average speed across varying AV penetration rates and traffic volumes, under different ramp merging/diverging ratios (5%, 10%, 15%, 20%, 25%, 30%, respectively).
Figure 4.
Lane-change conflict outcomes for the Weaving Segment (Segment B): (a–f) simulated lane-change conflict frequency across varying AV penetration rates and traffic volumes, under different ramp merging/diverging ratios (5%, 10%, 15%, 20%, 25%, 30%, respectively).
Figure 4.
Lane-change conflict outcomes for the Weaving Segment (Segment B): (a–f) simulated lane-change conflict frequency across varying AV penetration rates and traffic volumes, under different ramp merging/diverging ratios (5%, 10%, 15%, 20%, 25%, 30%, respectively).
Figure 5.
Average speed outcomes for the Weaving Segment (Segment B) under 100% aggressive AV behavior: (a–f) simulated average speeds across varying AV penetration rates and traffic volumes, under different ramp merging/diverging ratios (5%, 10%, 15%, 20%, 25%, 30%, respectively).
Figure 5.
Average speed outcomes for the Weaving Segment (Segment B) under 100% aggressive AV behavior: (a–f) simulated average speeds across varying AV penetration rates and traffic volumes, under different ramp merging/diverging ratios (5%, 10%, 15%, 20%, 25%, 30%, respectively).
Figure 6.
Average speed outcomes for the On-ramp Merging Segment (Segment C): (a–f) simulated average speed across varying AV penetration rates and traffic volumes, under different ramp merging ratios (5%, 10%, 15%, 20%, 25%, 30%, respectively).
Figure 6.
Average speed outcomes for the On-ramp Merging Segment (Segment C): (a–f) simulated average speed across varying AV penetration rates and traffic volumes, under different ramp merging ratios (5%, 10%, 15%, 20%, 25%, 30%, respectively).
Figure 7.
Lane-change conflict outcomes for the On-ramp Merging Segment (Segment C): (a–f) simulated lane-change conflict frequencies across varying AV penetration rates and traffic volumes, under different ramp merging ratios (5%, 10%, 15%, 20%, 25%, 30%, respectively).
Figure 7.
Lane-change conflict outcomes for the On-ramp Merging Segment (Segment C): (a–f) simulated lane-change conflict frequencies across varying AV penetration rates and traffic volumes, under different ramp merging ratios (5%, 10%, 15%, 20%, 25%, 30%, respectively).
Figure 8.
Average speed outcomes for Segment D with an AV-exclusive lane: (a–f) simulated average speeds across varying AV penetration rates and traffic volumes, under different ramp inflow ratios (5%, 10%, 15%, 20%, 25%, 30%, respectively).
Figure 8.
Average speed outcomes for Segment D with an AV-exclusive lane: (a–f) simulated average speeds across varying AV penetration rates and traffic volumes, under different ramp inflow ratios (5%, 10%, 15%, 20%, 25%, 30%, respectively).
Figure 9.
Lane-change conflict outcomes for the AV-exclusive lane segment (Segment D): (a–f) simulated lane-change conflict frequencies across varying AV penetration rates and traffic volumes, under different ramp merging ratios (5%, 10%, 15%, 20%, 25%, 30%, respectively).
Figure 9.
Lane-change conflict outcomes for the AV-exclusive lane segment (Segment D): (a–f) simulated lane-change conflict frequencies across varying AV penetration rates and traffic volumes, under different ramp merging ratios (5%, 10%, 15%, 20%, 25%, 30%, respectively).
Table 1.
Description of simulated freeway segment types.
Table 2.
Description of AV behavior parameters.
Table 2.
Description of AV behavior parameters.
Behavior
Category | Parameters | AV
Cautious | AV
Normal | AV
Aggressive |
|---|
| Car Following | Model | Wiedemann
99 | Wiedemann
99 | Wiedemann
99 |
| CC0 (Standstill distance) | 1.5 m | 1.5 m | 1 m |
| CC1 (Gap time distribution) | 1.5 s | 0.9 s | 0.6 s |
| CC2 (‘Following’ distance oscillation) | 0 m | 0 m | 0 m |
| CC3 (Threshold for entering ‘Following’) | −10 | −8 | −6 |
| CC4 (Negative speed difference) | −0.1 | −0.1 | −0.1 |
| CC5 (Positive speed difference) | 0.1 | 0.1 | 0.1 |
| CC6 (Distance dependency of oscillation) | 0 | 0 | 0 |
| CC7 (Oscillation acceleration) | | | |
| CC8 (Acceleration from standstill) | | | |
| CC9 (Acceleration at 80km/h) | | | |
| Lane Change | Necessary lane change:
Maximum deceleration (Own) | | | |
Necessary lane change:
Maximum deceleration (Trailing vehicle) | | | |
Necessary lane change:
per distance (Own) | 80 m | 100 m | 100 m |
Necessary lane change:
per distance (Trailing vehicle) | 80 m | 100 m | 100 m |
Necessary lane change:
Accepted deceleration (Own) | | | |
Necessary lane change:
Accepted deceleration
(Trailing vehicle) | | | |
| Waiting time before diffusion | 60 s | 60 s | 60 s |
| Min. clearance (front/rear) | 0.5 m | 0.5 m | 0.5 m |
| To slower lane if collision time is above | Free lane
selection | Free lane
selection | Free lane
selection |
| Safety distance reduction factor | 1.00 | 0.60 | 0.75 |
Maximum deceleration
for cooperative braking | | | |
Cooperative lane change:
Maximum speed difference | No | 10.8 km/h | 10.8 km/h |
Cooperative lane change:
Maximum collision time | 10 s | 10 s |
Table 3.
Simulation configuration.
Table 3.
Simulation configuration.
| Parameters | Value |
|---|
| Simulation seconds | 3600 s |
| Warm-up seconds | 600 s |
| Total simulation seconds | 4200 s |
| Time step(s)/simulation second | 10 |
| Random seed | 42 |
| Random seed increment | 1 |
| Number of runs | 5 times |
| Simulation speed (factor) | 10.0 |
| Disclaimer/Publisher’s Note: The statements, opinions and data contained in all publications are solely those of the individual author(s) and contributor(s) and not of MDPI and/or the editor(s). MDPI and/or the editor(s) disclaim responsibility for any injury to people or property resulting from any ideas, methods, instructions or products referred to in the content. |
© 2025 by the authors. Licensee MDPI, Basel, Switzerland. This article is an open access article distributed under the terms and conditions of the Creative Commons Attribution (CC BY) license (https://creativecommons.org/licenses/by/4.0/).


