
Landslide Risk Assessment Along Railway Lines Using Multi-Source Data: A GameTheory-Based Integrated Weighting Approach for Sustainable Infrastructure Planning


Abstract
1. Introduction
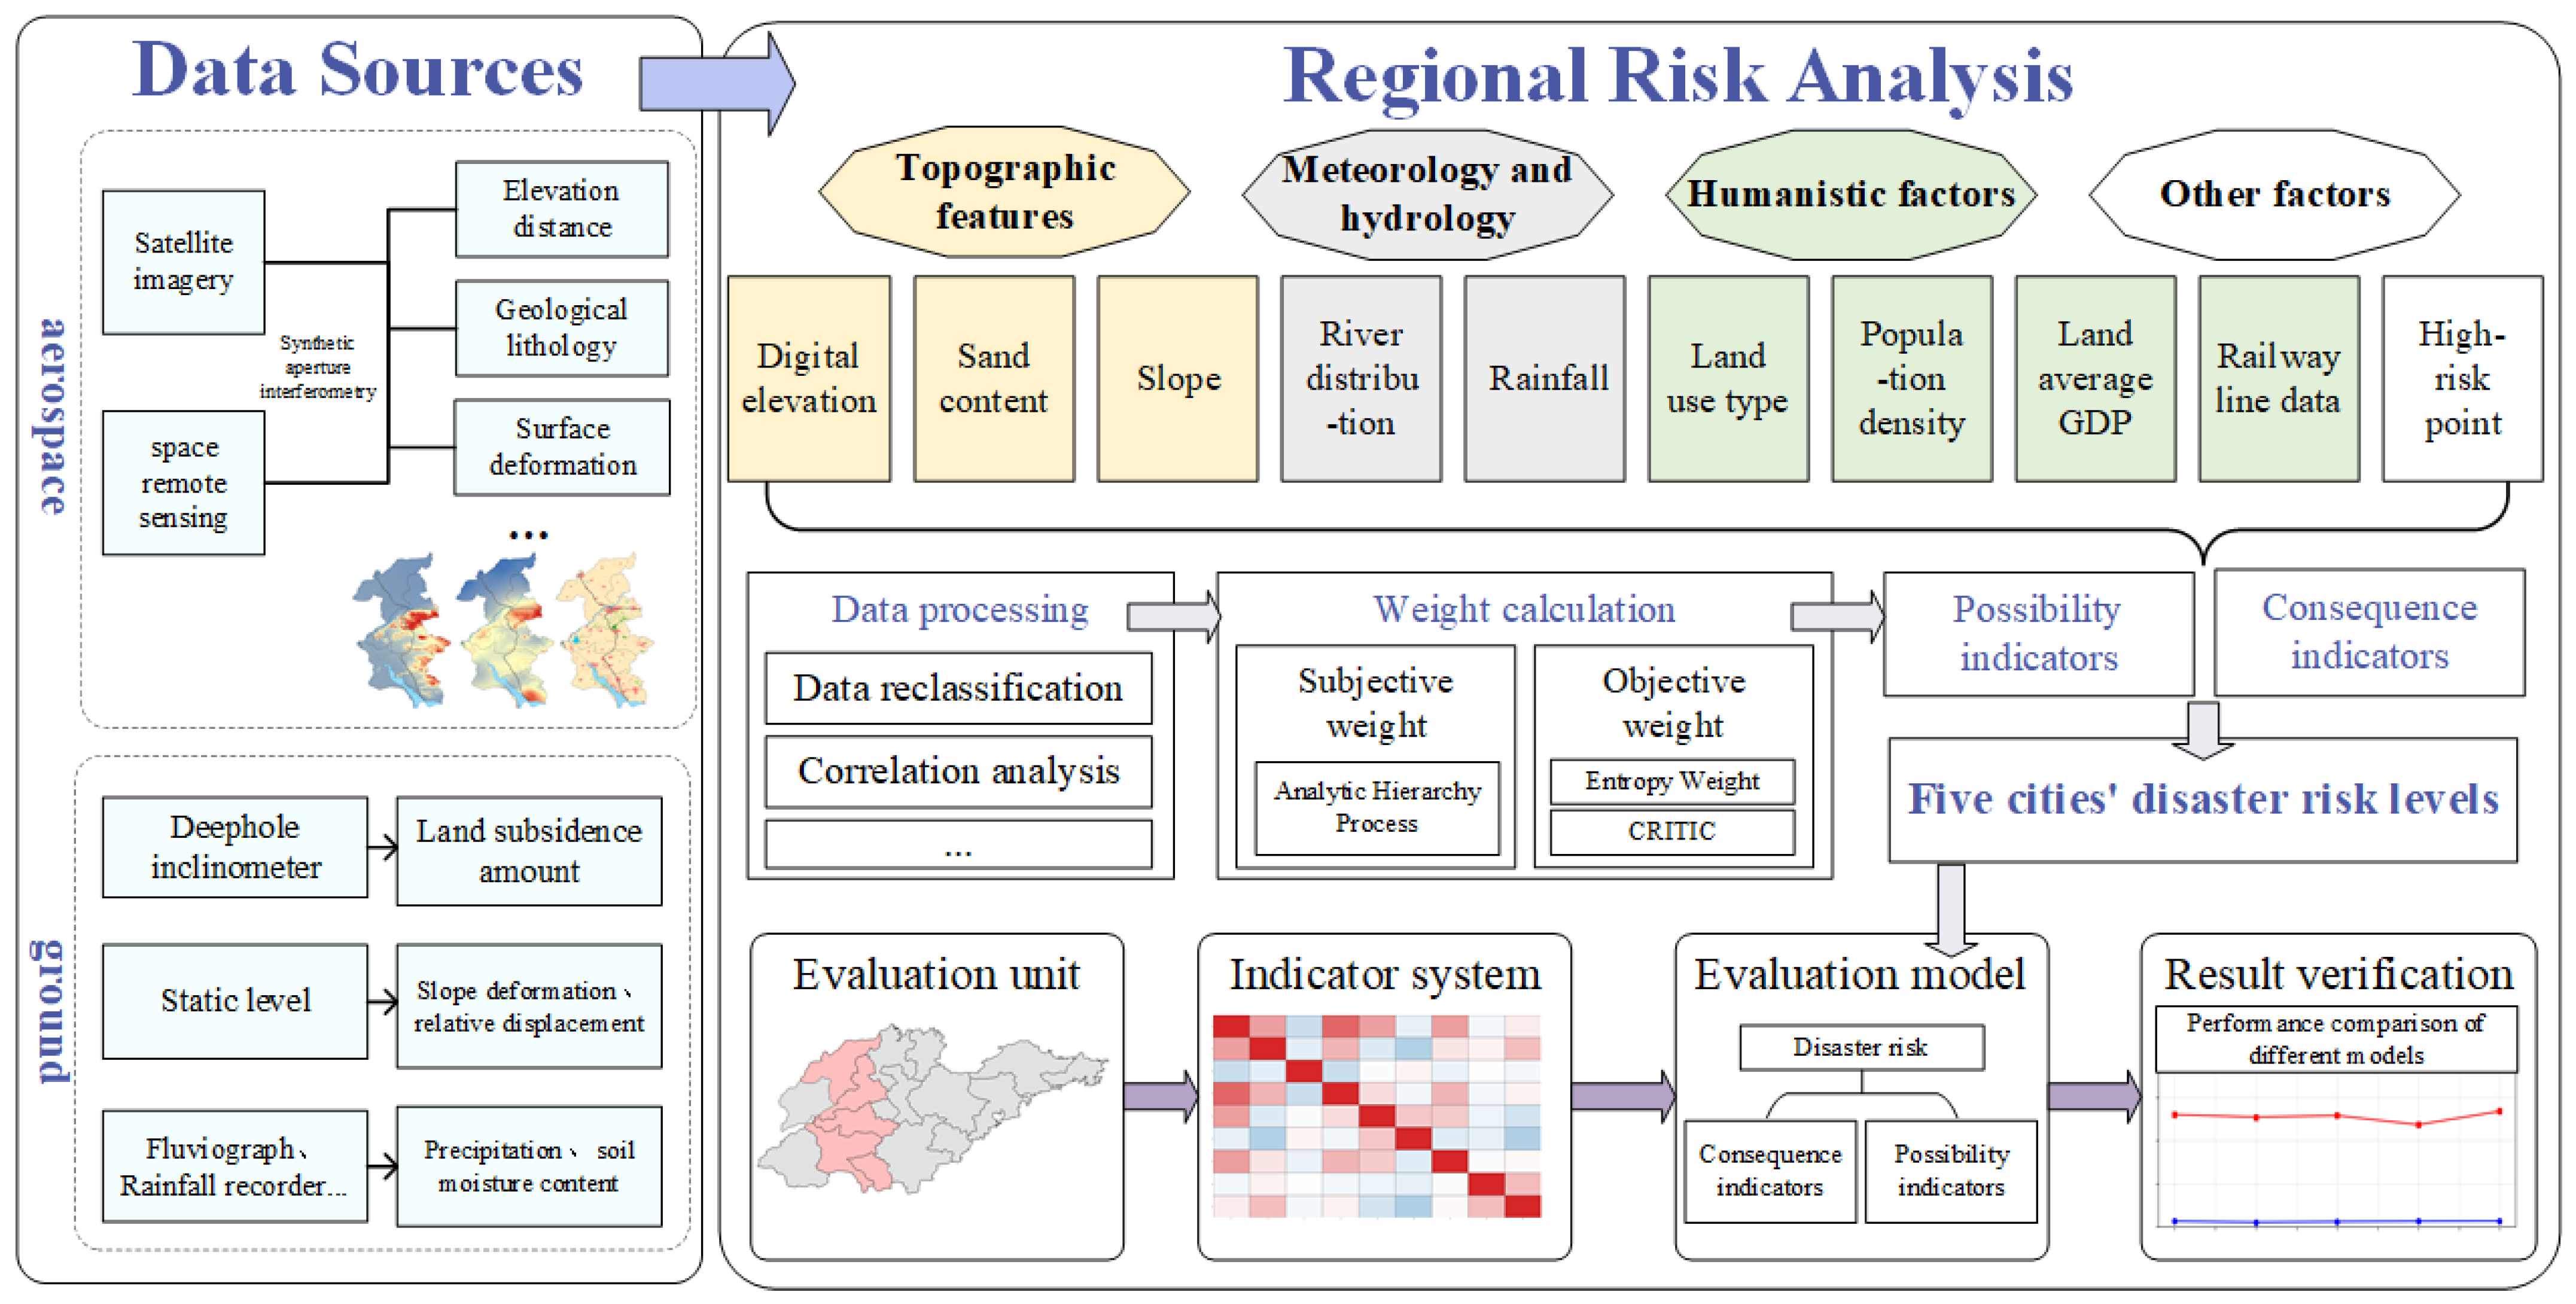
2. Research Framework and Methodology
2.1. Subjective Weight: Analytic Hierarchy Process
2.2. Objective Weight
2.2.1. Entropy Weight
- Normalize sample data to scale the raw data of each indicator to the 0–1 range and eliminate the influence of dimensionality. For n samples with m indicators, the value of the j-th indicator of the i-th sample is normalized by to represent the sample data. For samples with m indicators, the value of the j-th indicator of the i-th sample is represented by . Among them, represents the indicator of the corresponding order; represents the indicator value corresponding to the sample with the highest indicator value under this indicator, while represents the indicator value with the lowest corresponding indicator value:
- Calculate the weight of each sample relative to the total sample under the indicator:
- Calculate entropy value of the calculation indicators to obtain the degree of difference between the different indicators:
- The indicator information entropy reduction is calculated using the index entropy value:
- The final weights are calculated based on the redundancy of the information entropy of the indicators. The information value scores of each indicator are converted into percentage weights:
2.2.2. CRITIC
- Sample data regulation. The calculation process is consistent with Formulas (1) and (2).
- Quantification of the degree of dispersion of sample values within the indicator using standard deviation. If there is a significant difference in the data of a certain indicator, then the indicator has strong discriminative ability.
- The degree of contradiction, obtained by the calculation below, reveals the correlation between different evaluation indicators. is used to indicate the degree of contradiction between the indicator and other indicators. represents the Pearson correlation coefficient between indicators.
- Calculation of the information bearer capacity , obtained by the standard deviation of the indicator and the product of the degree of conflict calculation. For to be a valid metric, the underlying data must exhibit significant variance while simultaneously conveying independent information:
- Calculation of the CRITIC weight of each indicator:
2.3. Calculation of Combination Weight in Game Theory
- The weight vector group is computed according to , where is the weight combination calculated by the corresponding method, is the number of weighted methods, m is the number of indicators, and is a linear combination coefficient to be optimized.
- Game theory is used to achieve consistency and compromise of different weight vectors. The goal is to minimize the deviation of c and by optimizing the linear combination coefficient .
- 3.
- The linear combination coefficient is returned.
- 4.
- The results of the combination of game theory are calculated to ensure that the final weights are neither biased towards one-sidedness of human judgment nor trapped in the mechanical nature of pure data calculation, thus obtaining a more scientific and comprehensive weight result.
3. Research Area and Data Source
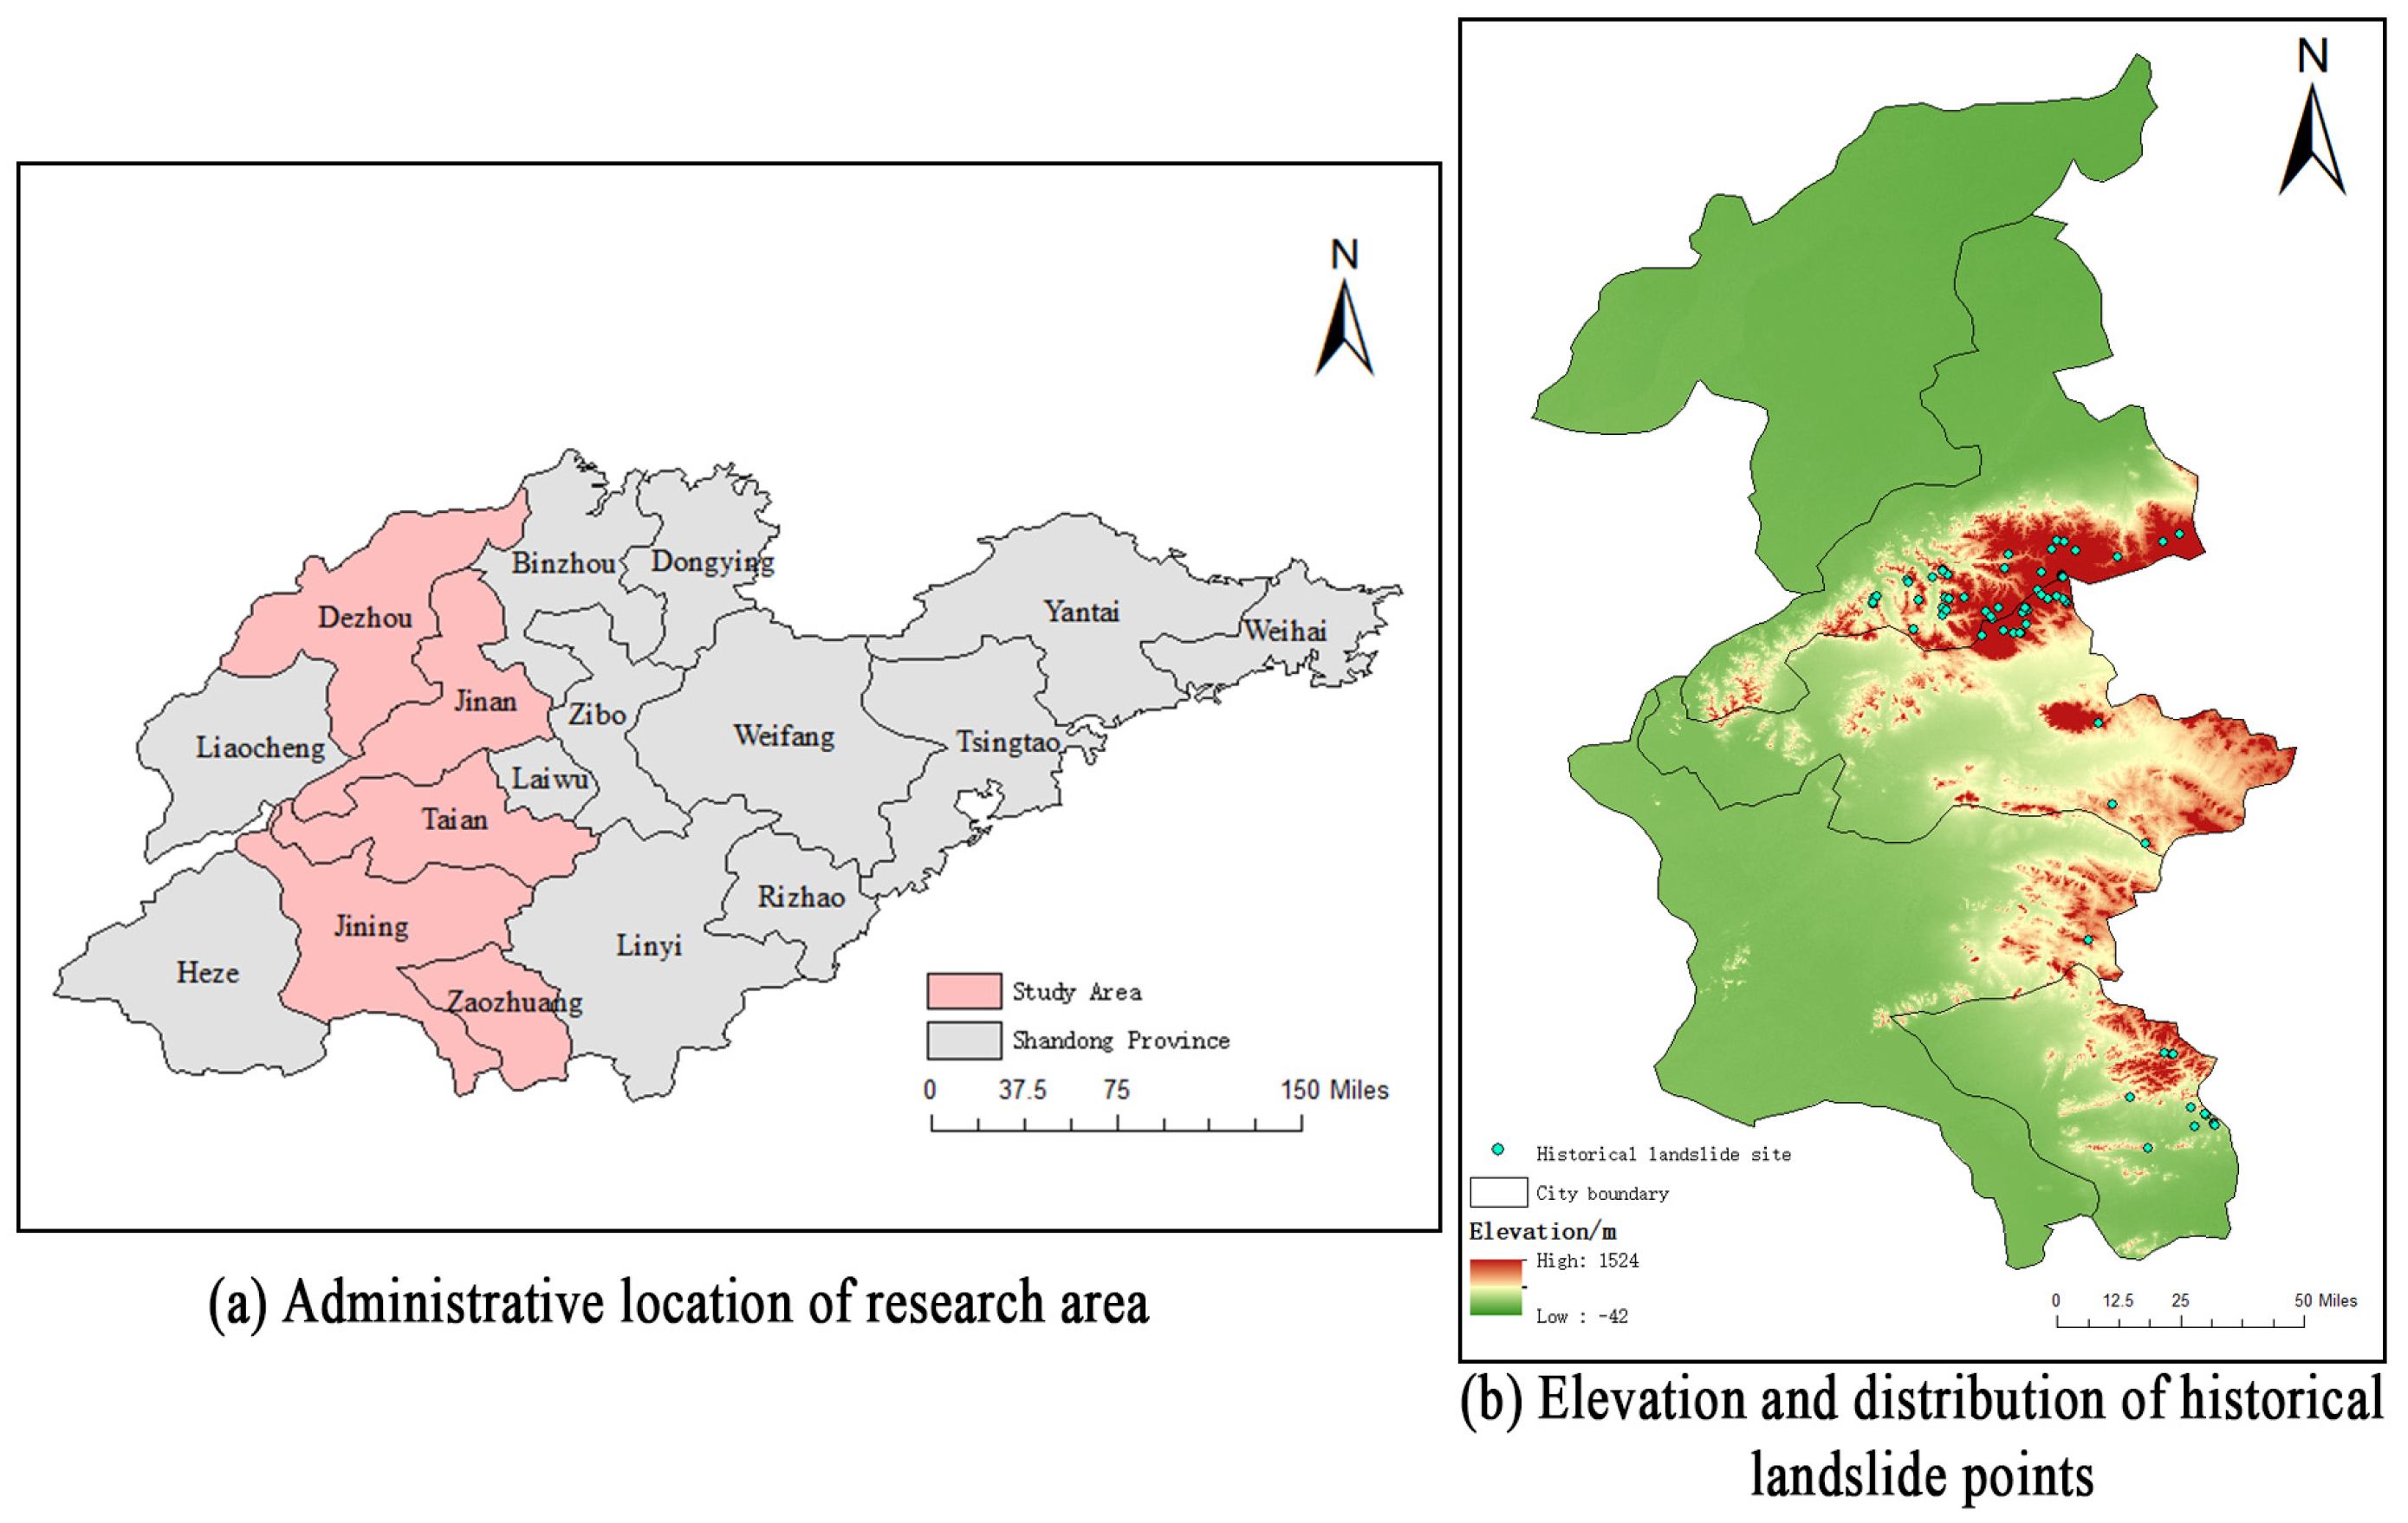
3.1. Research Area Scene Characteristics
- High safety requirements for the railway, which handles substantial passenger and freight traffic and serves as a vital north–south corridor. Its operational stability directly impacts socioeconomic health.
- Diverse disaster exposure along its geographically varied route, including landslides, floods, earthquakes, debris flows, avalanches, windstorms, fires, and explosions.
- Reduced slope stability due to the coastal location and summer rainfall. Precipitation moistens surface soil; subsequent infiltration increases soil water content, accelerates erosion, and promotes loosening.
- Complex disaster-influencing factors spanning geology, topography, climate, and human activities. Factor combinations and intensities vary regionally, creating significant spatial differences in disaster likelihood and impact severity.
- Challenging landslide rescue operations owing to sudden onset, large-scale destruction, and complex post-disaster terrain. In addition, unstable geological conditions after a landslide may also pose a threat to the safety of rescuers, increasing the difficulty and risk of rescue work.
3.2. Data Source and Processing
4. Experiment and Discussion
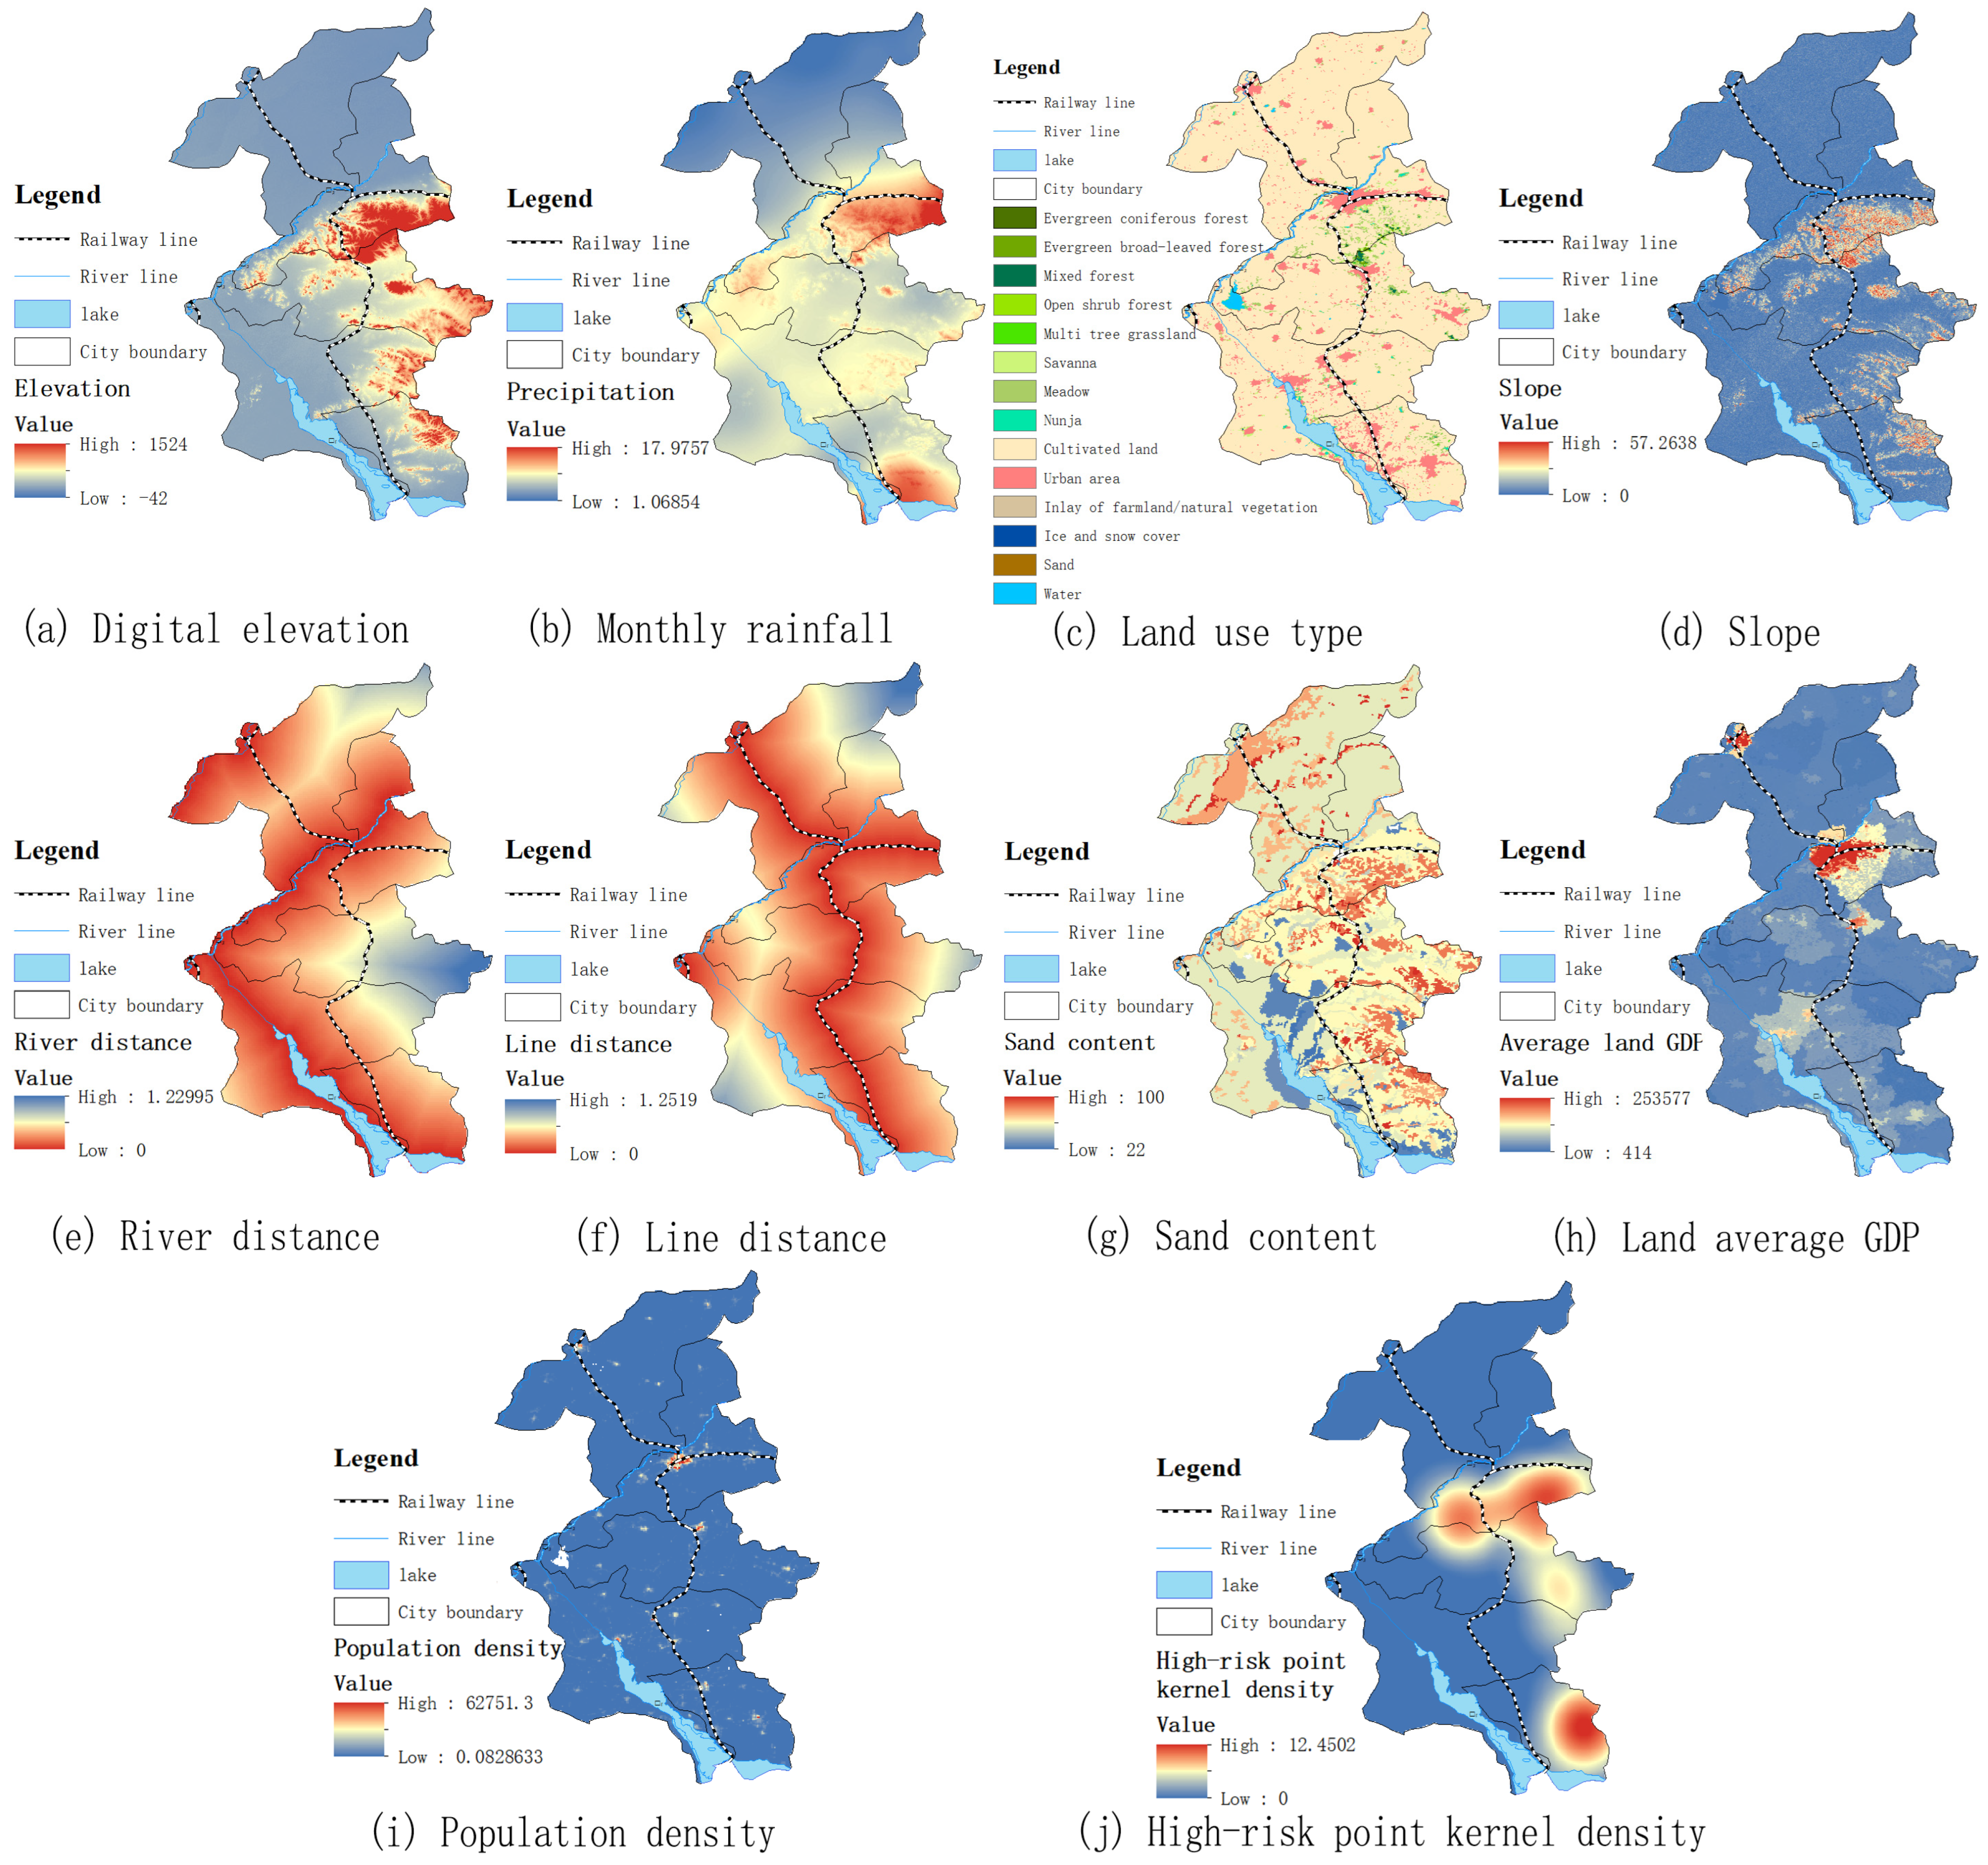
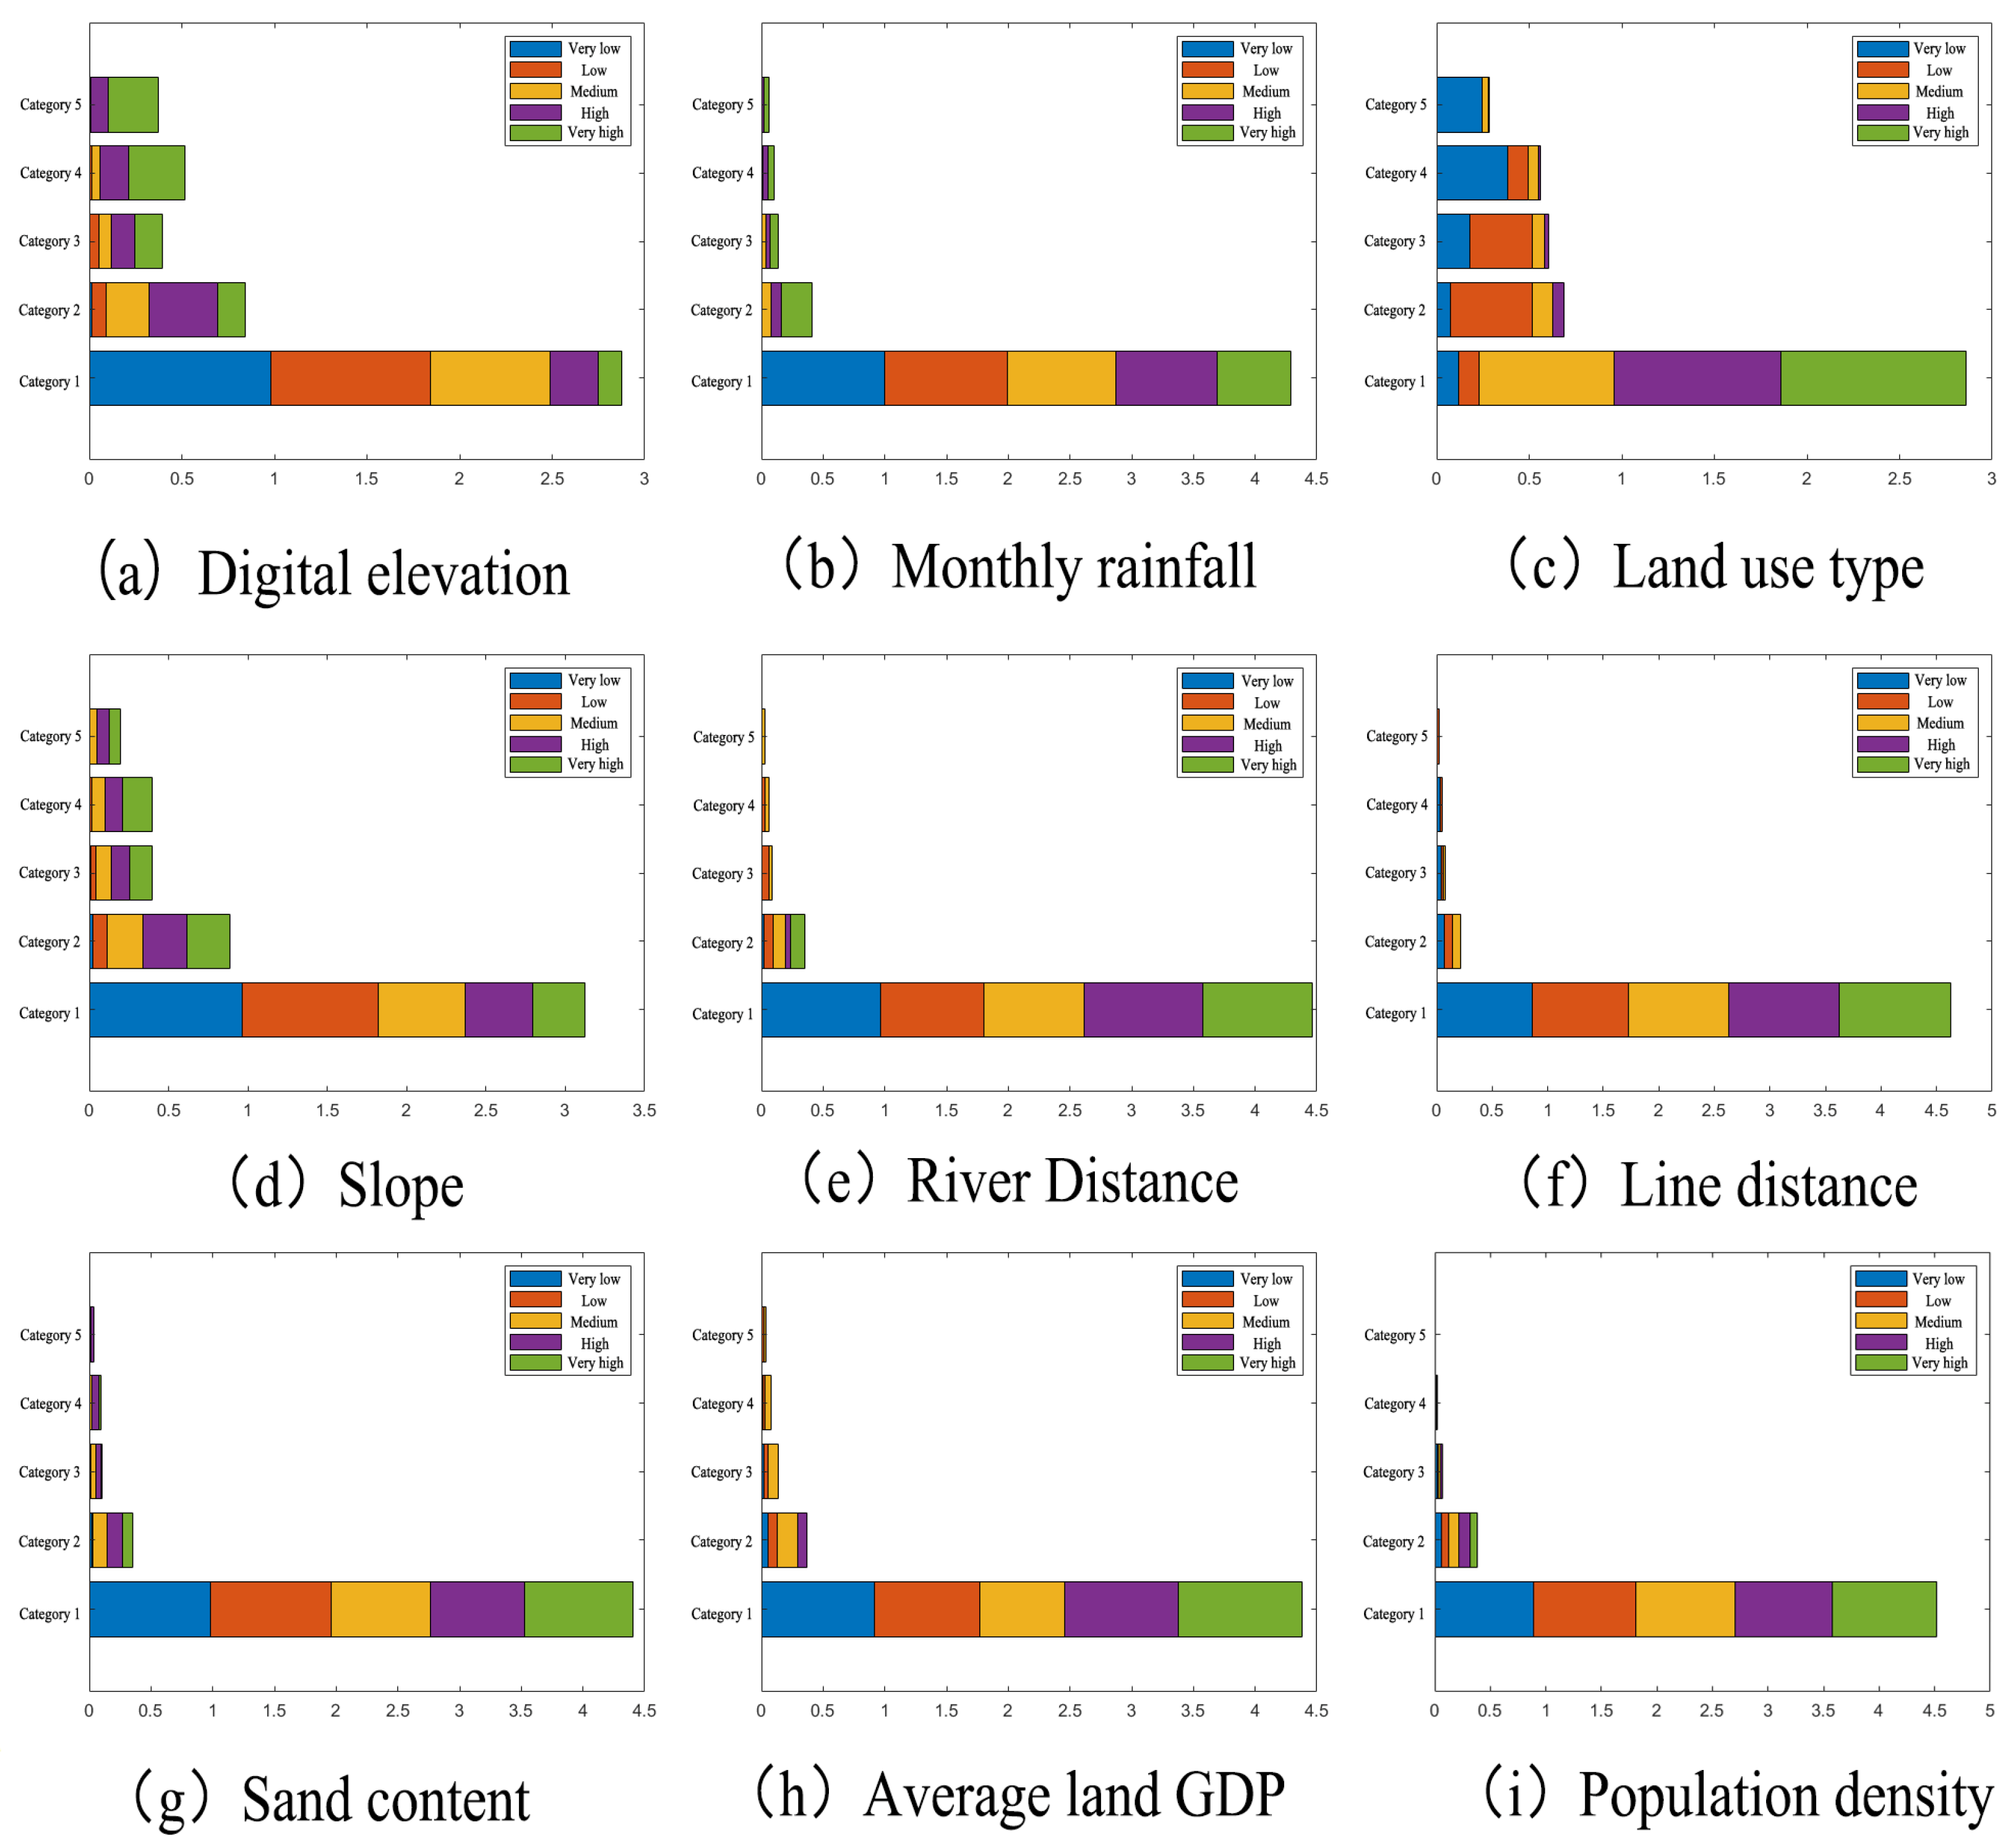
4.1. Data Processing of Regional Influencing Factors
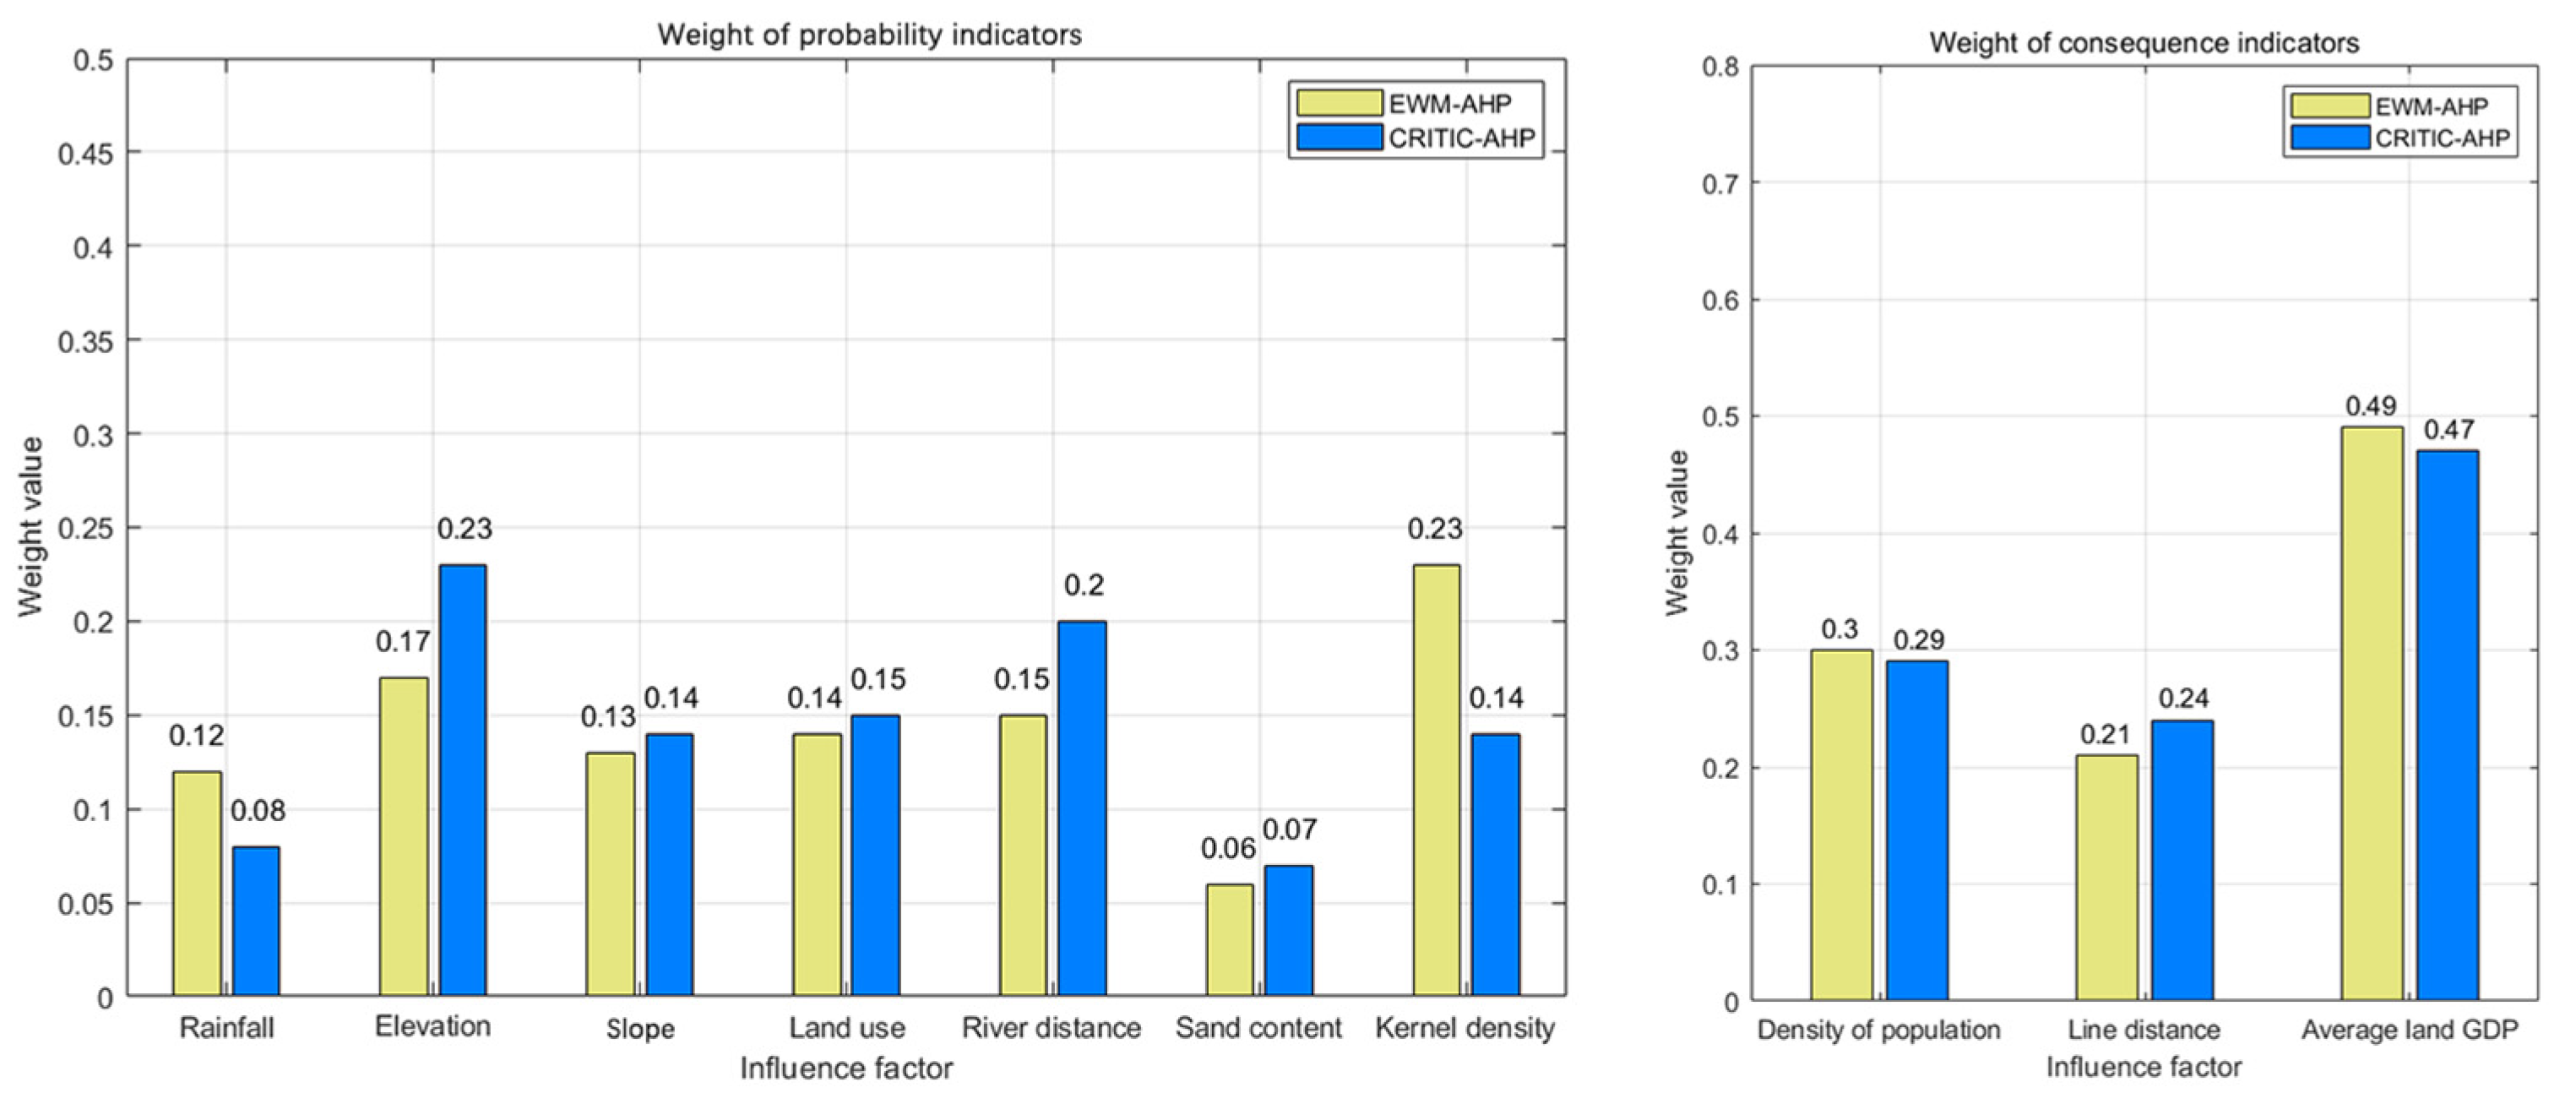
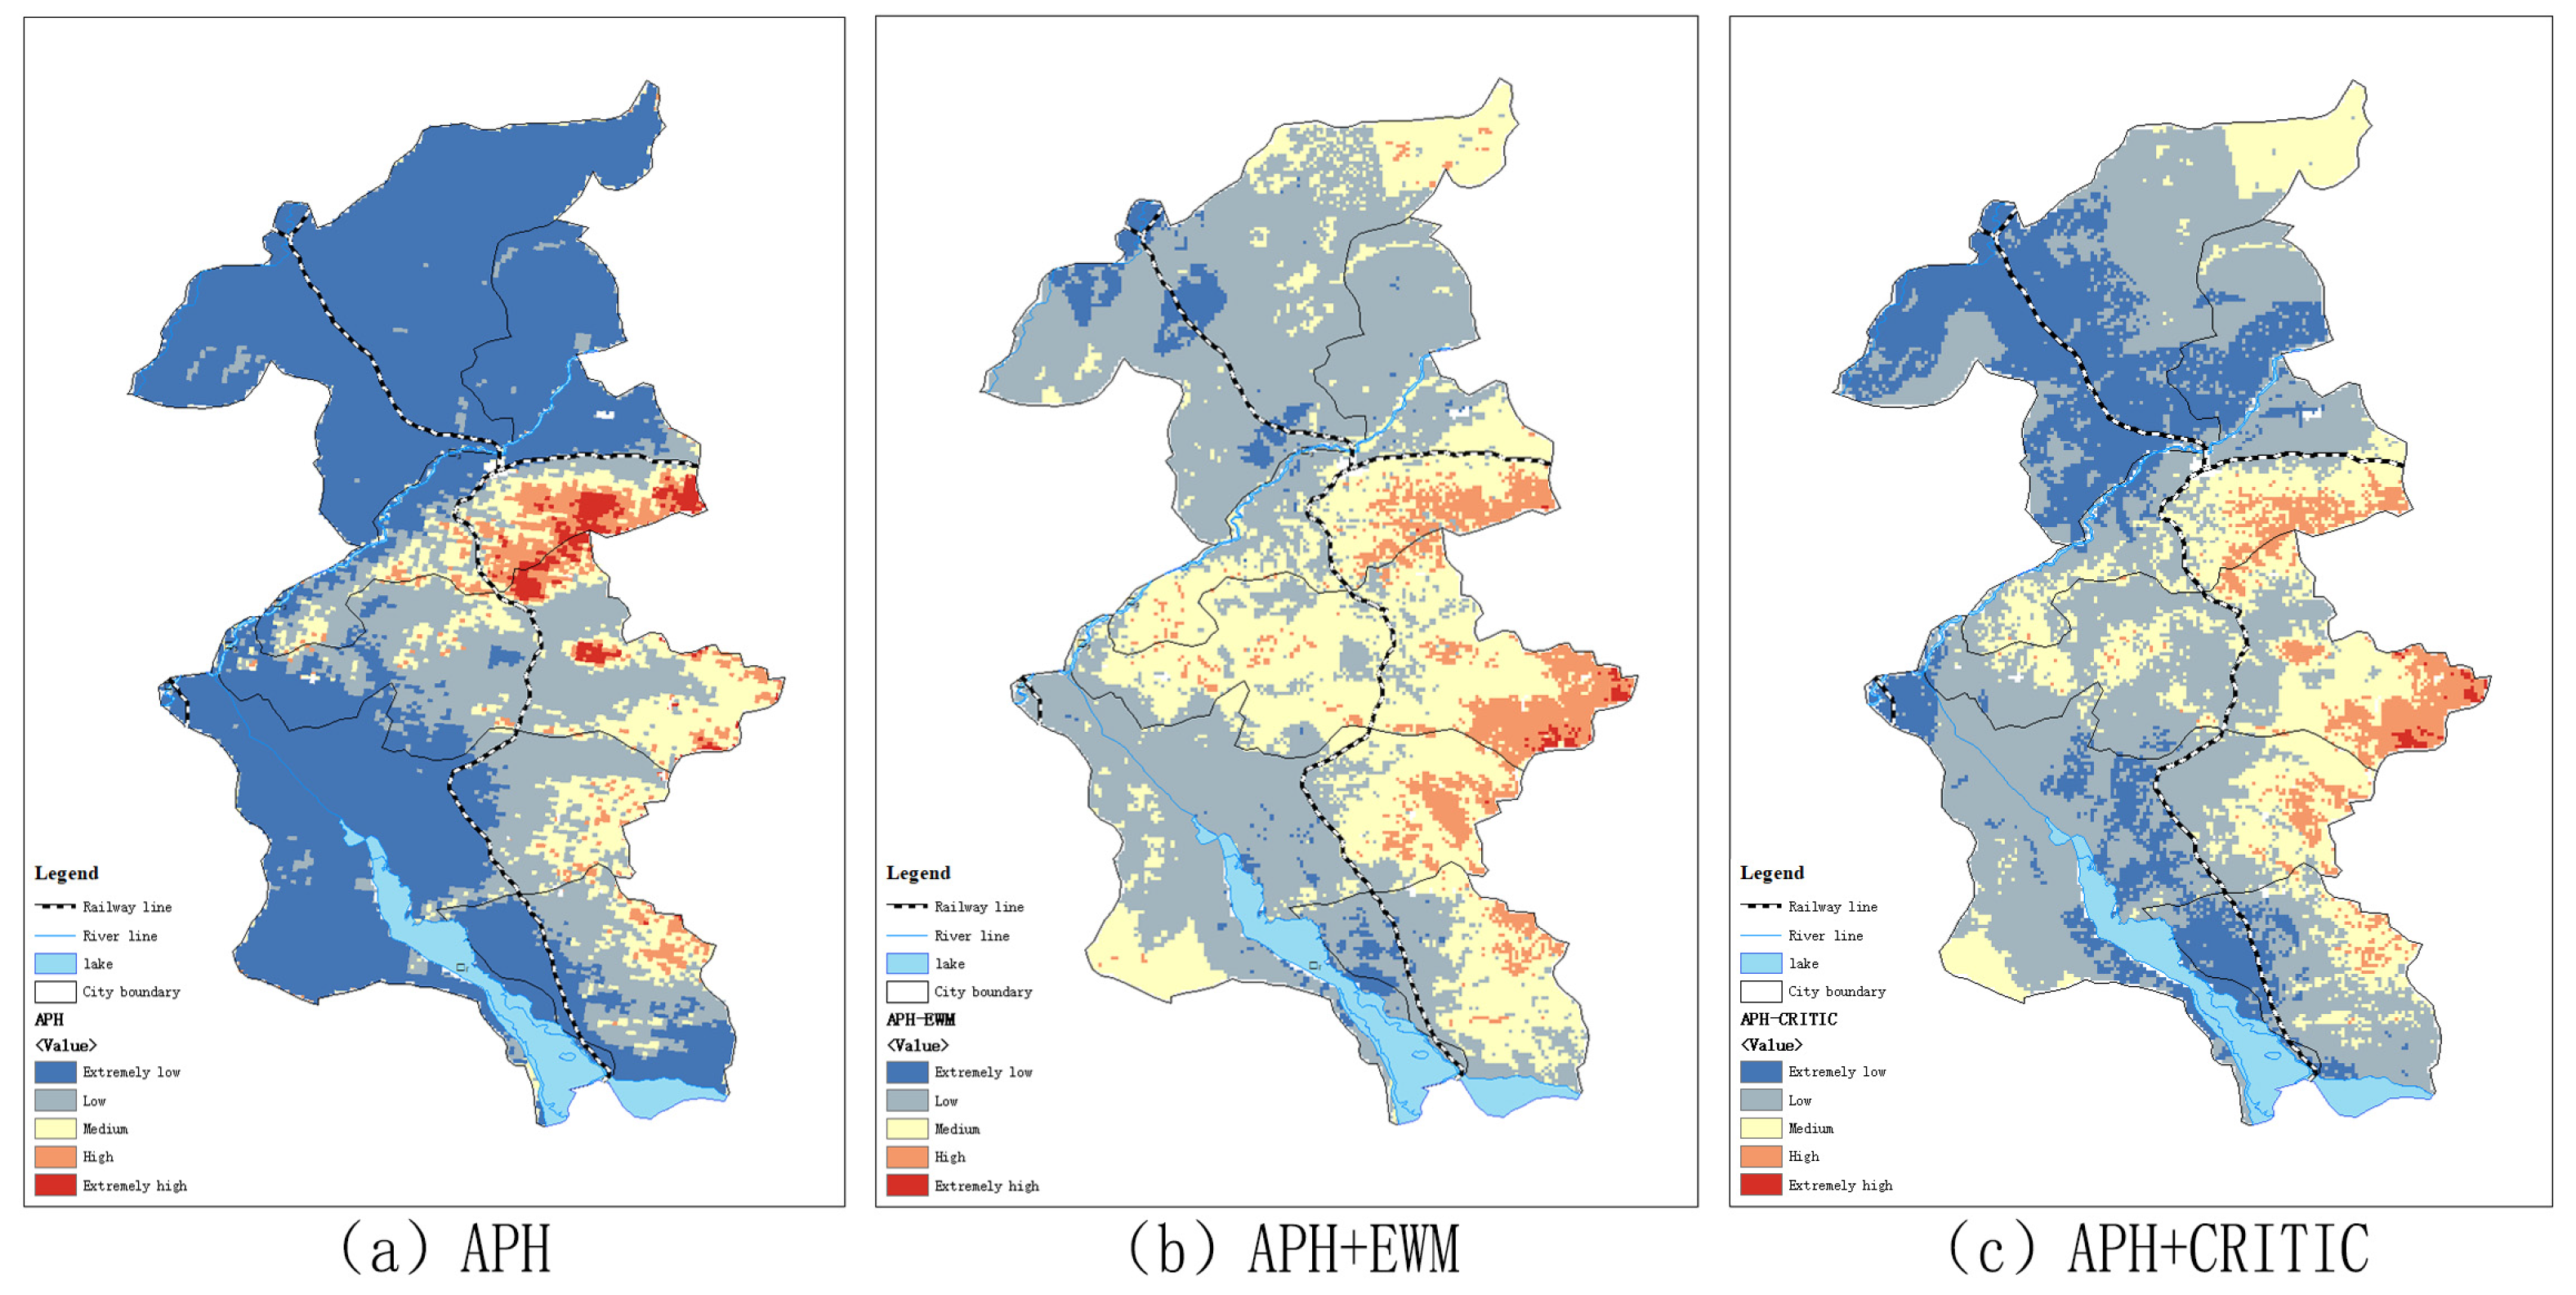
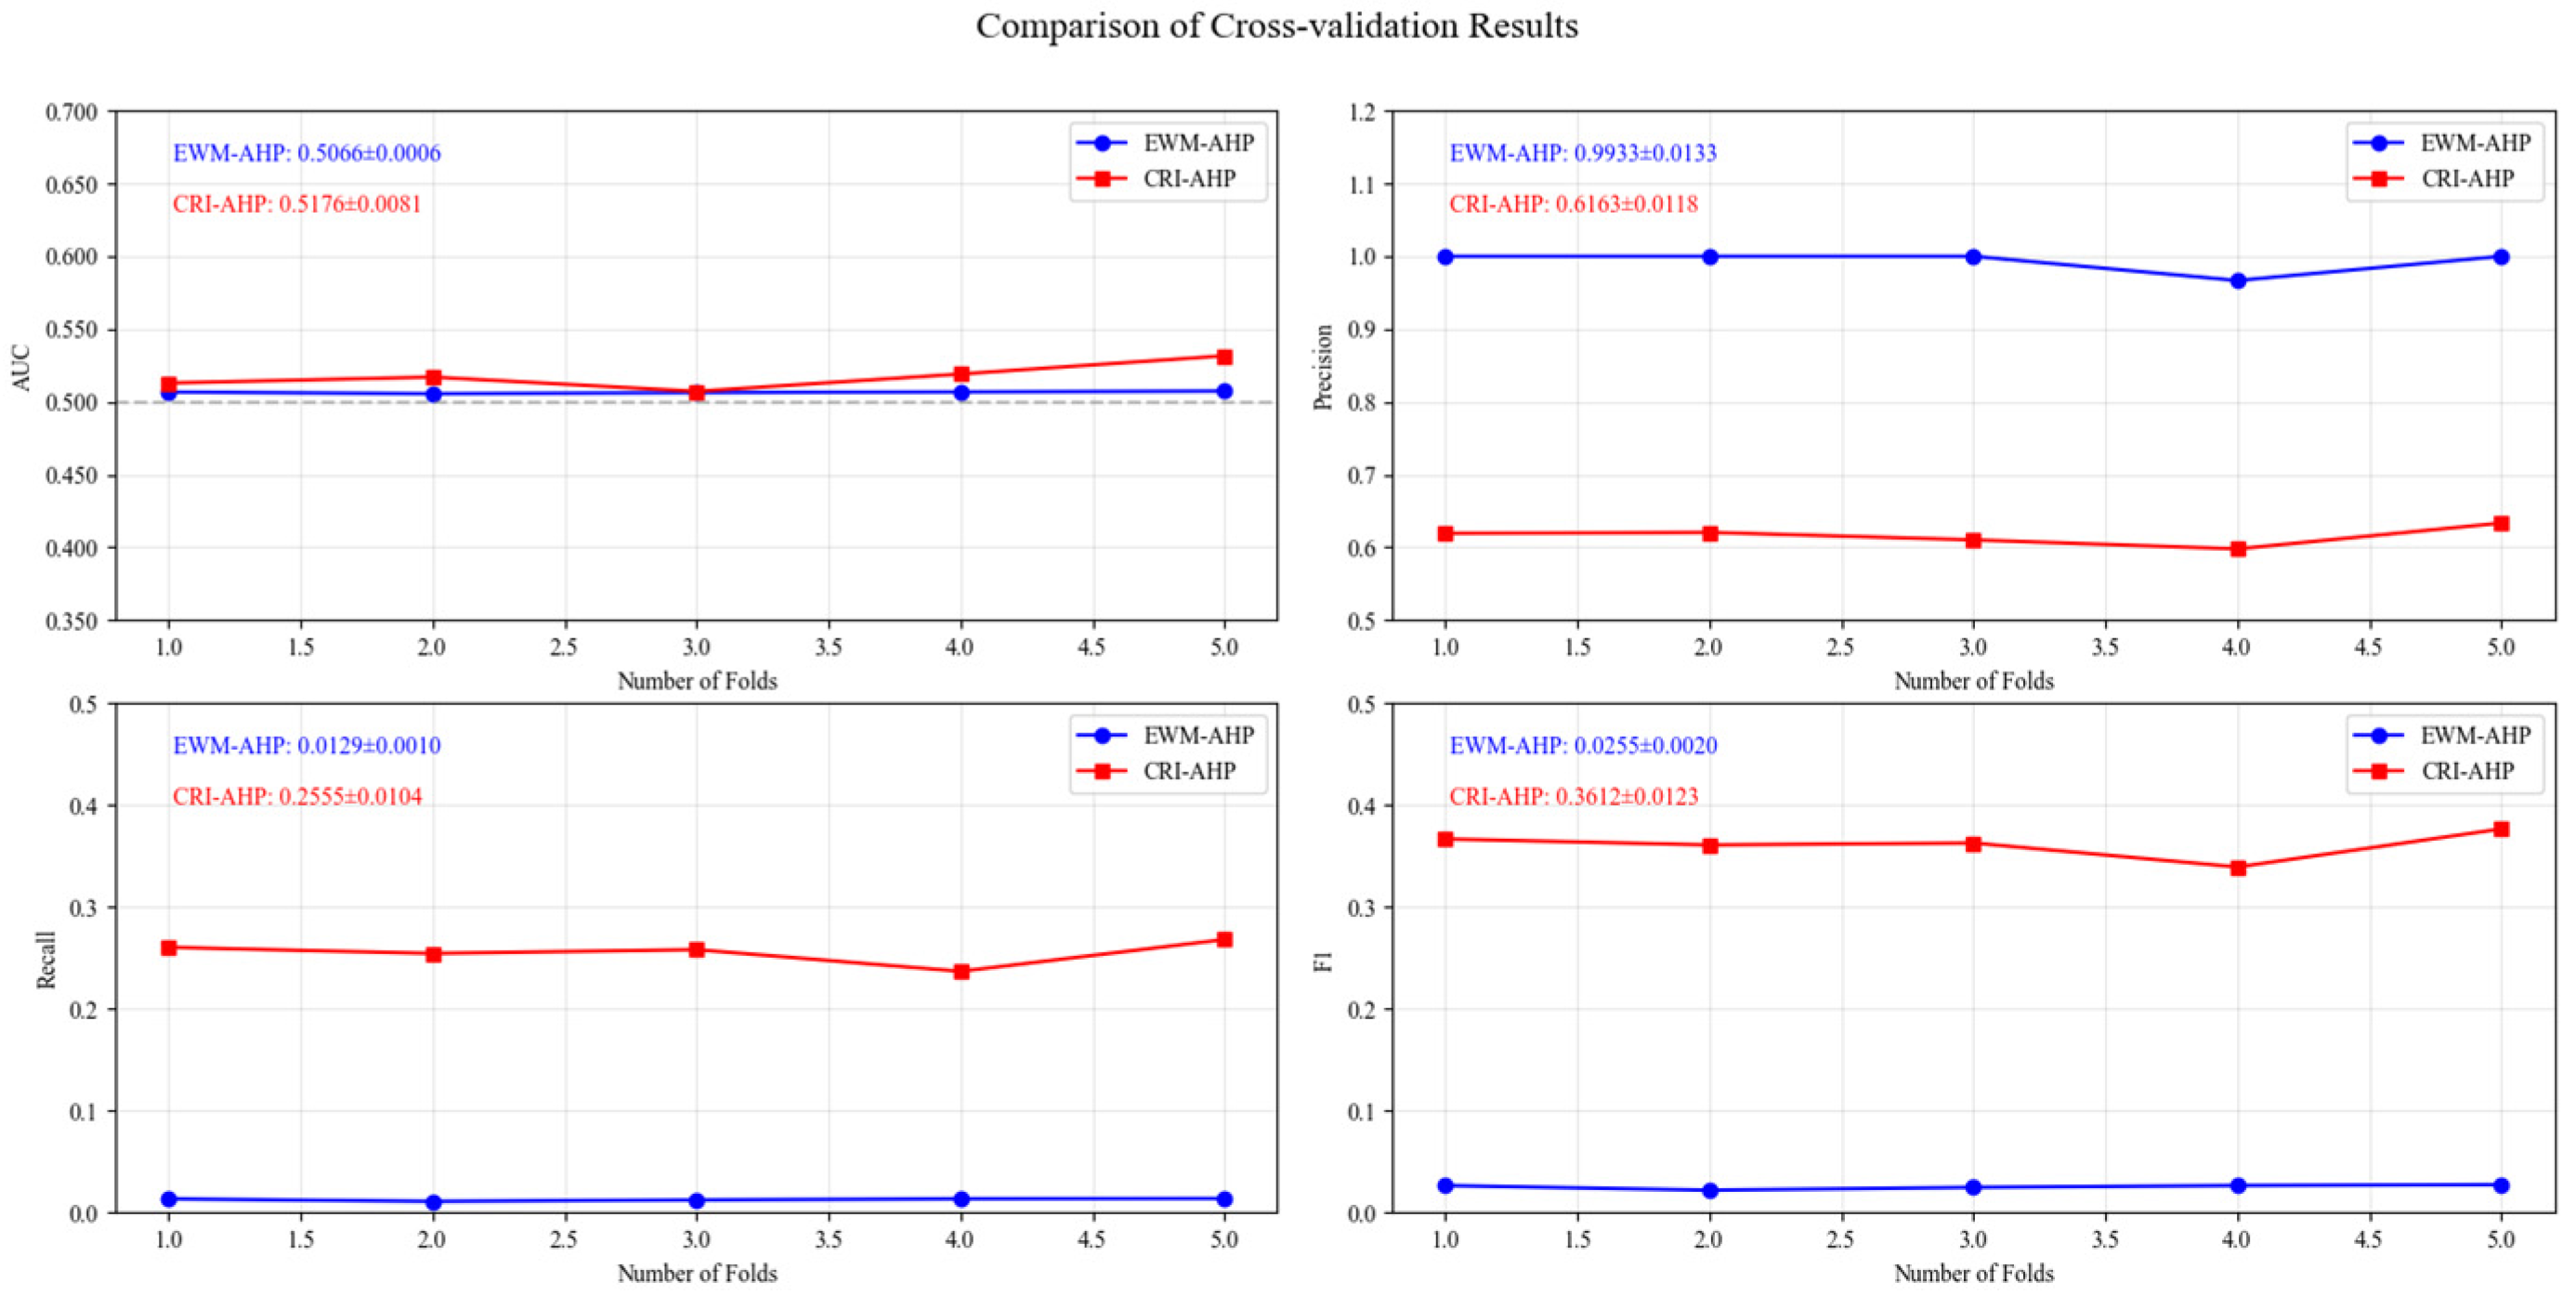
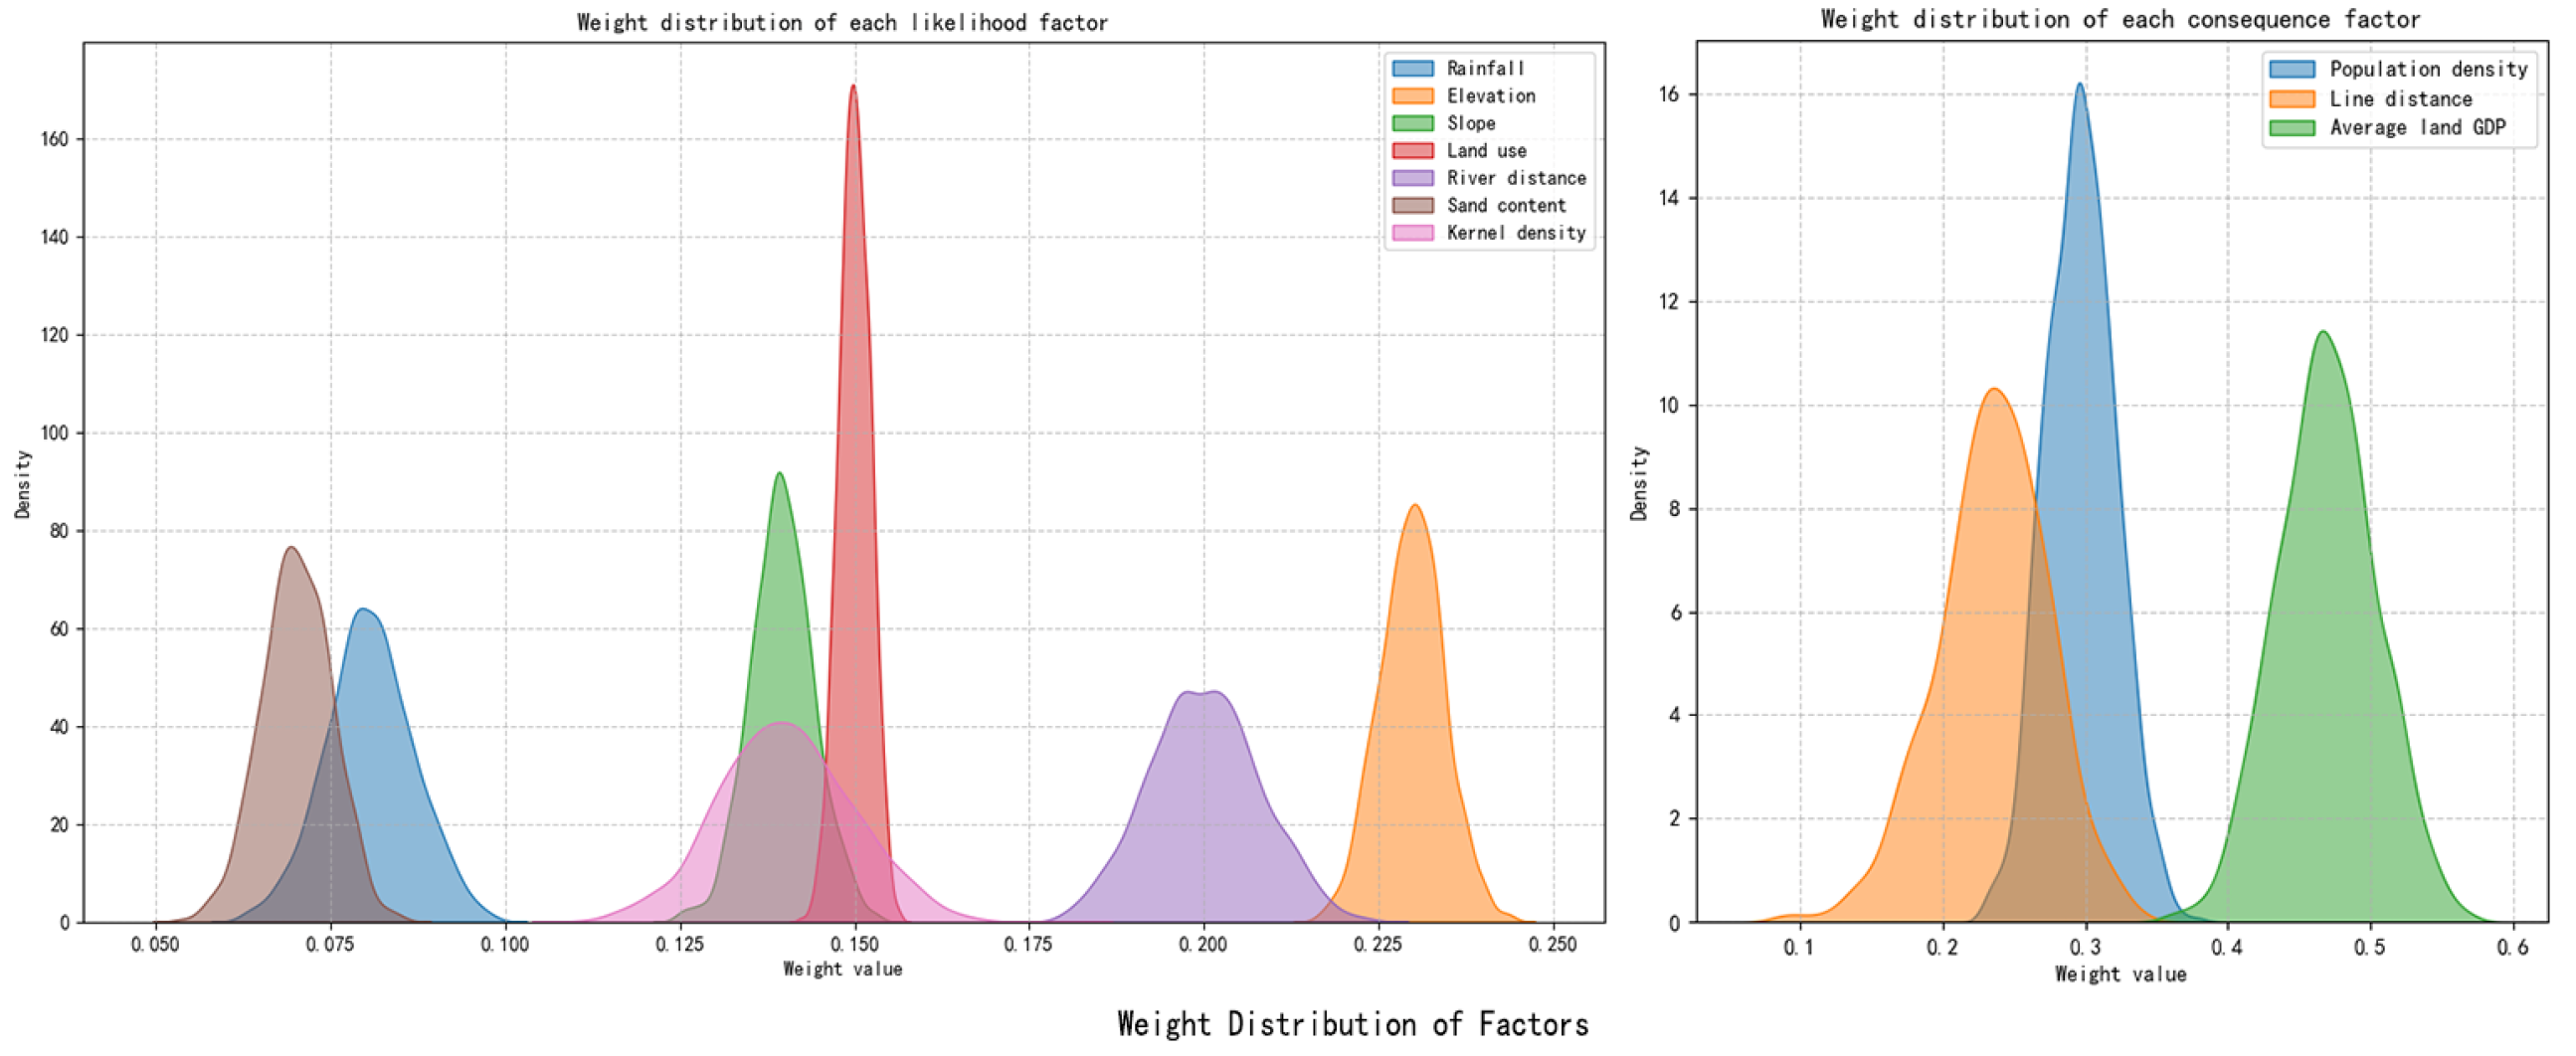
4.2. Weight Combination Risk Analysis
5. Conclusions
Author Contributions
Funding
Institutional Review Board Statement
Informed Consent Statement
Data Availability Statement
Acknowledgments
Conflicts of Interest
References
- Lan, Q.; Mei, X.; Xu, Q.; Tang, J.; Yang, X.; Liu, Q. Hazard Assessment of Rainfall–Induced Landslide Considering the Synergistic Effect of Natural Factors and Human Activities. Sustainability 2023, 15, 7699. [Google Scholar] [CrossRef]
- Bešinović, N. Resilience in railway transport systems: A literature review and research agenda. Transp. Rev. 2020, 40, 457–478. [Google Scholar] [CrossRef]
- Zhao, C.; Zhang, X.; Zhang, N.; Yu, H.; Deng, X. Identification of Influencing Variables on Improving Resilience of High-Speed Railway System. J. Adv. Transp. 2022, 2022, 3013243. [Google Scholar]
- Jiang, W.; Zhao, X.; Cai, C.; Chang, K.; Liu, K.; Liu, Y. Study on resilience evaluation for construction management of major railway projects. Buildings 2024, 14, 732. [Google Scholar] [CrossRef]
- Murino, T.; Madonna, M.; Clericuzio, M.; Di Nardo, M. An adaptive resilience approach for a high capacity railway. Int. Rev. Civ. Eng. 2020, 10, 98. [Google Scholar]
- Miao, F.; Zhao, F.; Li, L.; Wu, Y.; Török, Á. Landslide susceptibility mapping in Three Gorges Reservoir area based on GIS and boosting decision tree model. Stoch. Environ. Res. Risk Assess. 2023, 37, 2283–2303. [Google Scholar] [CrossRef]
- Huang, Y.; Zhao, L. Review on landslide susceptibility mapping using support vector machines. Catena 2018, 165, 520–529. [Google Scholar] [CrossRef]
- Van Nguyen, T.H.; Nguyen, K.Q.; Nguyen, L.T.; Luu, B.T.; Le, T.H.T.; Nguyen, D.H.; Van Tran, T.; Trinh, T. A comparative analysis of weight-based machine learning methods for landslide susceptibility mapping in Ha Giang area. Big Earth Data 2023, 7, 1005–1034. [Google Scholar]
- Tang, X.; An, B.-W.; Xiao, Y.; Huang, H.; Li, Y. Social vulnerability assessment of landslide disaster based on improved TOPSIS method: Case study of eleven small towns in China. Ecol. Indic. 2022, 143, 109316. [Google Scholar]
- Niu, C.; Yin, W.; Bai, Y.; Zhang, L.; Ma, D.; Zhou, X.; Xue, Y.; Zhang, S. An Adaptive Identification Method for Potential Landslide Hazards Based on Multisource Data. Remote Sens. 2023, 15, 1865. [Google Scholar]
- Zhang, Y.; Cheng, Y.; Guo, F.; Yin, X.; Tang, J.; Li, N.; Huang, L. Prediction of landslide displacement with dynamic features using intelligent approaches. Int. J. Min. Sci. Technol. 2022, 32, 539–549. [Google Scholar] [CrossRef]
- Lee, D.-H.; Wu, J.-H.; Lin, Y.-H.; Liu, P.-H. Detecting landslide vulnerability using anisotropic microtremors and vulnerability index. Eng. Geol. 2023, 323, 107240. [Google Scholar]
- Alvioli, M.; Lombardo, L.; Marchesini, I.; Loche, M.; Bakka, H. Landslide susceptibility maps of Italy: Lesson learnt from dealing with multiple landslide types and the uneven spatial distribution of the national inventory. Earth-Sci. Rev. 2022, 232, 104125. [Google Scholar]
- Azarafza, M.; Azarafza, M.; Akgün, H.; Atkinson, P.M.; Derakhshani, R. Deep learning-based landslide susceptibility mapping. Sci. Rep. 2021, 11, 24112. [Google Scholar] [CrossRef] [PubMed]
- Drukpa, D.; Acharya, S.; Saha, S.; Hembram, T.K.; Roy, J.; Thapa, G.; Sarkar, R. Measuring landslide vulnerability status of Chukha, Bhutan using deep learning algorithms. Sci. Rep. 2021, 11, 16374. [Google Scholar]
- Merghadi, A.; Yunus, A.P.; Dou, J.; Whiteley, J.; ThaiPham, B.; Bui, D.T.; Avtar, R.; Abderrahmane, B. Machine learning methods for landslide susceptibility studies: A comparative overview of algorithm performance. Earth-Sci. Rev. 2020, 207, 103225. [Google Scholar] [CrossRef]
- Mehrabi, M.; Pradhan, B.; Moayedi, H.; Alamri, A. Optimizing an Adaptive Neuro-Fuzzy Inference System for Spatial Prediction of Landslide Susceptibility Using Four State-of-the-art Metaheuristic Techniques. Sensors 2020, 20, 1723. [Google Scholar] [CrossRef]
- Zhang, J.; Ma, X.; Zhang, J.; Sun, D.; Zhou, X.; Mi, C.; Wen, H. Insights into geospatial heterogeneity of landslide susceptibility based on the SHAP-XGBoost model. J. Environ. Manag. 2023, 332, 117357. [Google Scholar] [CrossRef]
- Wu, C. Valuation of Geological Hazard Risk Based on Geological Information System in Nyingchi Section of Sichuan-Tibet Railway; Tibet University: Lhasa, China, 2021. [Google Scholar] [CrossRef]
- Zhou, S.; Ouyang, C.; Huang, Y. An InSAR and depth-integrated coupled model for potential landslide hazard assessment. Acta Geotech. 2022, 17, 3613–3632. [Google Scholar] [CrossRef]
- Gupta, K.; Satyam, N.; Gupta, V. Probabilistic physical modelling and prediction of regional seismic landslid hazard in Uttarakhand state (India). Landslides 2023, 20, 901–912. [Google Scholar] [CrossRef]
- Panchal, S.; Shrivastava, A.K. Landslide hazard assessment using analytic hierarchy process (AHP): A case study of National Highway 5 in India. Ain Shams Eng. J. 2022, 13, 101626. [Google Scholar] [CrossRef]
- Shano, L.; Raghuvanshi, T.K.; Meten, M. Landslide susceptibility evaluation and hazard zonation techniques—A review. Geoenviron Disasters 2020, 7, 18. [Google Scholar] [CrossRef]
- Liao, M.; Ahmad, I.; Li, X.; Song, Y.; Ahmad, M.N.; Aslam, R.W.; Shao, Z. Landslide hazard, susceptibility and risk assessment (HSRA) based on remote sensing and GIS data models: A case study of Muzaffarabad Pakistan. Stoch. Environ. Res. Risk Assess. 2022, 36, 4041–4056. [Google Scholar]
- Cemiloglu, A.; Zhu, L.; Mohammednour, A.B.; Azarafza, M.; Nanehkaran, Y.A. Landslide susceptibility assessment for Maragheh County, Iran, using the logistic regression algorithm. Land 2023, 12, 1397. [Google Scholar] [CrossRef]
- Deng, M.; Yang, X.; Liu, H.; Gui, R.; Ding, Q.; Liu, Q. A Knowledge-Guided Approach for Landslide Susceptibility Mapping Using Convolutional Neural Network and Graph Contrastive Learning. Sustainability 2024, 16, 4547. [Google Scholar] [CrossRef]
- Liu, L.-L.; Wang, X.-M.; Huang, F.; Huang, L.; Yang, C. Machine learning-based landslide susceptibility assessment with optimized ratio of landslide to non-landslide samples. Gondwana Res. 2023, 123, 198–216. [Google Scholar]
- Kanu, M.; Sunil, S.; Sujit, M. Applying deep learning and benchmark machine learning algorithms for landslide susceptibility modelling in Rorachu river basin of Sikkim Himalaya, India. Geosci. Front. 2021, 12, 270–286. [Google Scholar]
- Tang, H.; Zhao, B.; Xiong, C.; Ge, Y.; Liu, G. Comparative analysis of five convolutional neural networks for landslide susceptibility assessment. Bull. Eng. Geol. Environ. 2023, 82, 377. [Google Scholar]
- Xie, W.; Nie, W.; Saffari, P.; Robledo, L.F.; Descote, P.Y.; Jian, W. Landslide hazard assessment based on Bayesian optimization–support vector machine in Nanping City, China. Nat. Hazards 2021, 109, 931–948. [Google Scholar] [CrossRef]
- Chen, W.W.; Zhang, S. GIS-based comparative study of Bayes network, Hoeffding tree and logistic model tree for landslide susceptibility modeling. Catena 2021, 203, 105344. [Google Scholar] [CrossRef]
- Liu, G.; Tang, H.; Wang, H.; Chen, Q.; Ge, Y. Automated Identification of Rock Discontinuities from 3D Point Clouds Using a Convolutional Neural Network. Rock Mech. Rock Eng. 2025, 58, 3683–3700. [Google Scholar]
- Malafaia, G.; Ramana, G.; Rihan, M.; Talukdar, S.; Ahmed, I.A.; Islam, A.R.M.T.; Rahman, A.; Bera, S. Contribution and behavioral assessment of physical and anthropogenic factors for soil erosion using integrated deep learning and game theory. J. Clean. Prod. 2023, 416, 137689. [Google Scholar]
- Wang, L.; Yang, J.; Luo, J.; Chen, J.; Guo, Q. Seismic landslide susceptibility assessment based on game theory combination weighting and information volume model: A case study of Luding earthquake high-intensity area. Sādhanā 2025, 50, 6. [Google Scholar]
- Chen, Y.; Wu, C.; Duan, C.; Zhang, Y.; Qi, J.; Cheng, Z.; Pan, Z.; Zhang, J. Research on the evaluation of geological environment carrying capacity based on the AHP-CRITIC empowerment method. Land 2022, 11, 1196. [Google Scholar] [CrossRef]
- Zhang, J.; Li, M.; Zhu, J.; Ma, M.; Wang, Y.; Zhang, Y. Assessment of urban seismic social vulnerability based on game theory combination and TOPSIS model: A case study of Changchun City. Sci. Rep. 2025, 15, 8189. [Google Scholar]
- Yang, X.; Liu, K.; Shi, G.; Hao, Z.; Tao, Z. An improved unascertained measure-set pair analysis model based on fuzzy AHP and entropy for landslide susceptibility zonation mapping. Sustainability 2023, 15, 6205. [Google Scholar] [CrossRef]
- Shahabi, H.; Hashim, M.; Ahmad, B.B. Remote sensing and GIS-based landslide susceptibility mapping using frequency ratio, logistic regression, and fuzzy logic methods at the central Zab basin, Iran. Environ. Earth Sci. 2015, 73, 8647–8668. [Google Scholar] [CrossRef]
- Yao, L.; Zhu, Y.; Yao, C.; Yao, X. Detection and characterization of active landslides with multisource SAR data and remote sensing in western Guizhou, China. Nat. Hazards 2022, 111, 973–994. [Google Scholar]
- Shan, B.; Song, S.; Xu, P.; Cao, C.; Zhu, K.; Yang, G. Refined landslide susceptibility analysis based on InSAR technology and UAV multi-source data. J. Clean. Prod. 2022, 368, 133146. [Google Scholar]
- Zhran, M.; Ghanem, K.; Tariq, A.; Alshehri, F.; Jin, S.; Das, J.; Pande, C.B.; Pramanik, M.; Hasher, F.F.B.; Mousa, A. Exploring a GIS-based analytic hierarchy process for spatial flood risk assessment in Egypt: A case study of the Damietta branch. Environ. Sci. Eur. 2024, 36, 1–25. [Google Scholar] [CrossRef]
- Chen, P. Effects of the entropy weight on TOPSIS. Expert Syst. Appl. 2021, 168, 114186. [Google Scholar] [CrossRef]
- Sharkasi, N.; Rezakhah, S. A modified CRITIC with a reference point based on fuzzy logic and hamming distance. Knowl.-Based Syst. 2022, 255, 109768. [Google Scholar] [CrossRef]
- Yang, X.; Chen, Y.; Sun, B.; Li, M.; Xiang, W.; Babuna, P.; Bian, D.; Yuan, Z. A new model to evaluate water resource spatial equilibrium based on the game theory coupling weight method and the coupling coordination degree. J. Clean. Prod. 2022, 366, 132907. [Google Scholar]

| Data Name | Data Source |
|---|---|
| Digital elevation | Geographical Space Data Cloud Official Website |
| Sand content | Resource and environmental science data platform |
| Land use type | Resource and environmental science data platform |
| River distribution | Resource and environmental science data platform |
| Annual rainfall | National Meteorological Science Data Center; WorldClim |
| Average land GDP | Resource and environmental science data platform |
| Population density | National Earth System Science Data Center |
| Railway line data | Railway planning, railway live data, and field survey data |
| Monthly displacement monitoring data | National Glacier Frozen Earth Desert Science Data Center |
| Daily rainfall and reservoir water level | National Glacier Frozen Earth Desert Science Data Center |
| Evaluation Indicator | Extremely Low | Low | Medium | High | Extremely High |
|---|---|---|---|---|---|
| Elevation (m) | <77 | 77–174 | 174–309 | 309–522 | >522 |
| Precipitation (mm/mon) | <4.46 | 4.46–7.84 | 7.84–11.23 | 11.23–14.61 | >14.61 |
| Land use | Water body, sandy land, ice and snow coverage | Farmland, urban area, arable land | Wetland, grassland, rare tree grassland | Multi-tree grassland, open shrub forest | Mixed forests, evergreen broad-leaved forests, evergreen needle-leaf forests |
| Slope (°) | <2.66 | 2.66–7.02 | 7.02–14.01 | 14.01–22.59 | >22.59 |
| River distance (km) | >0.74 | 0.51–0.74 | 0.32–0.51 | 0.15–0.32 | <0.15 |
| Line distance (km) | >0.76 | 0.51–0.76 | 0.32–0.51 | 0.15–0.32 | <0.15 |
| Sand content (%) | <37 | 37–48 | 48–53 | 53–62 | >62 |
| Population density (persons/km2) | <931.64 | 931.64–3566.73 | 3566.73–9582.43 | 9582.43–22,146.51 | >22,146.51 |
| Average land GDP (10,000 yuan/km2) | <4511 | 4511–14,098 | 14,098–39,943 | 39,943–10,9221 | >109,221 |
| Digital Elevation | Rainfall | Land Use Type | Slope | River Distance | Line Distance | Sand Content | Population Density | Average Land GDP | |
|---|---|---|---|---|---|---|---|---|---|
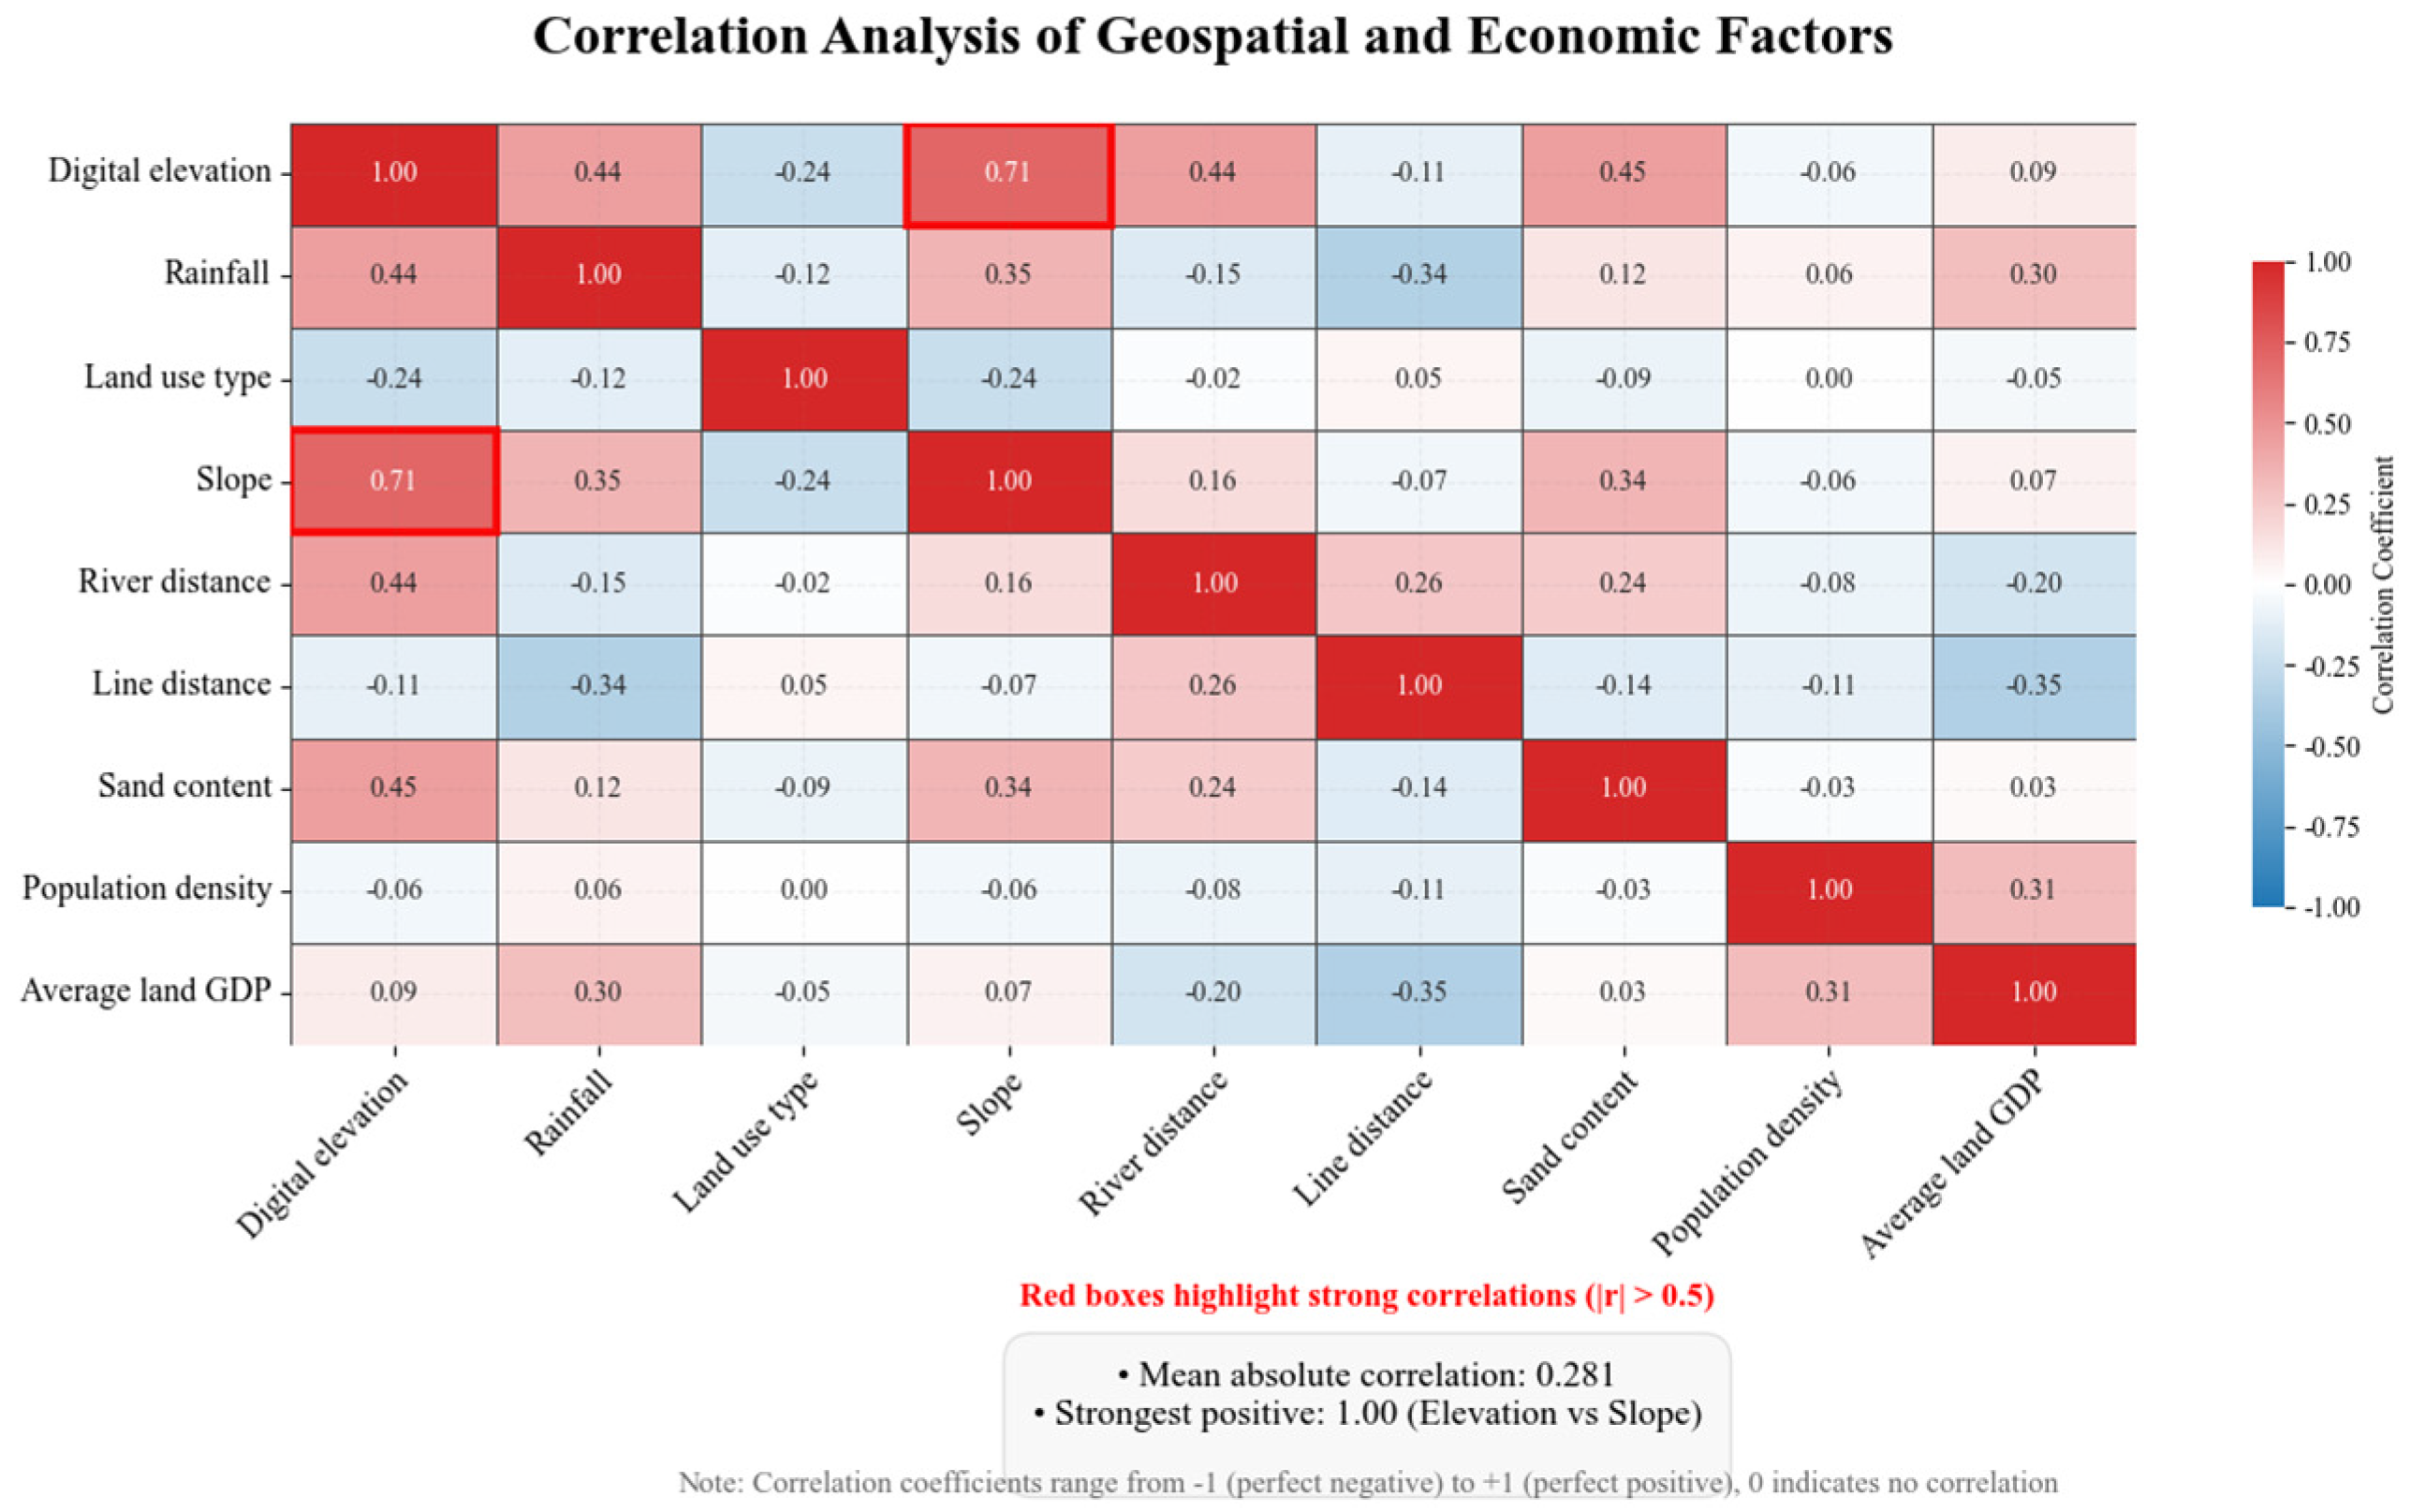
| Digital elevation | 1.00 | 0.44 | −0.24 | 0.71 | 0.44 | −0.11 | 0.45 | −0.06 | 0.09 |
| Rainfall | 0.44 | 1.00 | −0.12 | 0.35 | −0.15 | −0.34 | 0.12 | 0.06 | 0.30 |
| Land use type | −0.24 | −0.12 | 1.00 | −0.24 | −0.02 | 0.05 | −0.09 | 0.00 | −0.05 |
| Slope | 0.71 | 0.35 | −0.24 | 1.00 | 0.16 | −0.07 | 0.34 | −0.06 | 0.07 |
| River distance | 0.44 | −0.15 | −0.02 | 0.16 | 1.00 | 0.26 | 0.24 | −0.08 | −0.20 |
| Line distance | −0.11 | −0.34 | 0.05 | −0.07 | 0.26 | 1.00 | −0.14 | −0.11 | −0.35 |
| Sand content | 0.45 | 0.12 | −0.09 | 0.34 | 0.24 | −0.14 | 1.00 | −0.03 | 0.03 |
| Population density | −0.06 | 0.06 | 0.00 | −0.06 | −0.08 | −0.11 | −0.03 | 1.00 | 0.31 |
| Average land GDP | 0.09 | 0.30 | −0.05 | 0.07 | −0.20 | −0.35 | 0.03 | 0.31 | 1.00 |
| Risk Level Score and Risk Level | Severity Level and Score | ||||||
|---|---|---|---|---|---|---|---|
| Very Serious | Serious | More Serious | Lighter | Light | |||
| 5 | 4 | 3 | 2 | 1 | |||
| Possibility level and score | Extremely high | 5 | 25 (extremely high) | 20 (extremely high) | 15 (high) | 10 (high) | 5 (middle) |
| High | 4 | 20 (extremely high) | 16 (high) | 12 (high) | 8 (middle) | 4 (low) | |
| Middle | 3 | 15 (high) | 12 (high) | 9 (middle) | 6 (low) | 3 (low) | |
| Low | 2 | 10 (middle) | 8 (middle) | 6 (low) | 4 (low) | 2 (extremely low) | |
| Extremely low | 1 | 5 (low) | 4 (low) | 3 (low) | 2 (extremely low) | 1 (extremely low) | |
Disclaimer/Publisher’s Note: The statements, opinions and data contained in all publications are solely those of the individual author(s) and contributor(s) and not of MDPI and/or the editor(s). MDPI and/or the editor(s) disclaim responsibility for any injury to people or property resulting from any ideas, methods, instructions or products referred to in the content. |
© 2025 by the authors. Licensee MDPI, Basel, Switzerland. This article is an open access article distributed under the terms and conditions of the Creative Commons Attribution (CC BY) license (https://creativecommons.org/licenses/by/4.0/).
Share and Cite
He, Y.; Bin, Z.; Xu, X.; Yu, H.; Zhang, Y.; Li, N.; Li, M. Landslide Risk Assessment Along Railway Lines Using Multi-Source Data: A GameTheory-Based Integrated Weighting Approach for Sustainable Infrastructure Planning. Sustainability 2025, 17, 5522. https://doi.org/10.3390/su17125522
He Y, Bin Z, Xu X, Yu H, Zhang Y, Li N, Li M. Landslide Risk Assessment Along Railway Lines Using Multi-Source Data: A GameTheory-Based Integrated Weighting Approach for Sustainable Infrastructure Planning. Sustainability. 2025; 17(12):5522. https://doi.org/10.3390/su17125522
Chicago/Turabian StyleHe, Yuqiang, Ziyan Bin, Xiaolei Xu, Hongsheng Yu, Yan Zhang, Na Li, and Man Li. 2025. "Landslide Risk Assessment Along Railway Lines Using Multi-Source Data: A GameTheory-Based Integrated Weighting Approach for Sustainable Infrastructure Planning" Sustainability 17, no. 12: 5522. https://doi.org/10.3390/su17125522
APA StyleHe, Y., Bin, Z., Xu, X., Yu, H., Zhang, Y., Li, N., & Li, M. (2025). Landslide Risk Assessment Along Railway Lines Using Multi-Source Data: A GameTheory-Based Integrated Weighting Approach for Sustainable Infrastructure Planning. Sustainability, 17(12), 5522. https://doi.org/10.3390/su17125522