Article

Digital Technologies for Sustainable Supply Chain Performance: Source-Push and Value Chain-Pull Mechanisms

1
School of Economics, Ocean University of China, Qingdao 266100, China
2
College of Mathematics and Systems Science, Shandong University of Science and Technology, Qingdao 266590, China
3
Marine Development Studies Institute of OUC, Key Research Institute of Humanities and Social Sciences at Universities, Ministry of Education, Qingdao 266100, China
*
Author to whom correspondence should be addressed.
Sustainability 2025, 17(12), 5524; https://doi.org/10.3390/su17125524
Submission received: 11 April 2025 / Revised: 10 June 2025 / Accepted: 12 June 2025 / Published: 16 June 2025

Abstract

:
In addressing the complexities of sustainable development, the integration of digital technologies (DTs) with supply chain collaboration offers firms diverse strategic solutions. While prior studies have examined how DT shapes internal decision-making and stakeholder engagement, limited attention has been paid to how DT influences the dynamic collaborative capabilities of distinct supply chain stakeholders in advancing corporate sustainability. Grounded in the dynamic resource-based view (Dynamic RBV), this study conceptualizes sustainable dynamic capabilities (SDCs) as comprising sustainable information capability (SIC) and sustainable relationship capability (SRC)—the abilities to share sustainability-related information and to adapt and leverage external sustainable partnerships, respectively. Using panel data from manufacturing firms listed on China’s Shanghai and Shenzhen A-share markets between 2010 and 2023, sourced from CSMAR and iFinD databases, this study employs fixed-effects and system GMM models to test the proposed relationships. Results show that DT enhances SIC, which in turn facilitates SRC, ultimately improving corporate sustainability performance (CSP). Moreover, firms at different supply chain positions exhibit distinct sustainability priorities as upstream suppliers focus on resource efficiency, while downstream customers emphasize environmental compliance and product-level sustainability. These upstream and downstream actors influence CSP through two mechanisms—resource-driven “source-push” and demand-driven “value chain-pull”. This study deepens the understanding of stakeholder heterogeneity in sustainable collaboration and offers practical insights for managers to tailor sustainability strategies that reinforce supply chain-wide dynamic capabilities.

1. Introduction

Sustainability transitions refer to profound, multi-faceted, and extended transformation processes within socio-technical systems, involving long-term structural changes across various dimensions. Manufacturing firms are increasingly embedding sustainability considerations throughout their supply chain operations, integrating them into conventional processes ranging from raw material sourcing to final product delivery [1], which makes decision-making and operations more complex. Manufacturing firms are increasingly embedding sustainability considerations throughout their supply chain operations, integrating them into conventional processes ranging from raw material sourcing to final product delivery. These innovations support the alignment of intelligent systems with sustainability objectives, promoting the co-evolution of digital transformation and sustainable development [2,3].
Implementing DTs must evolve into capabilities that efficiently and effectively utilize resources [4]. While much of the existing literature emphasizes the role of technological innovation in enhancing supply chain resilience and responsiveness, it often overlooks a more foundational element—dynamic capabilities [5]. Within the framework of the dynamic resource-based view (RBV), two critical capabilities that underpin long-term competitive advantage are the ability to build strategic relationships and the capacity to process and utilize information effectively [
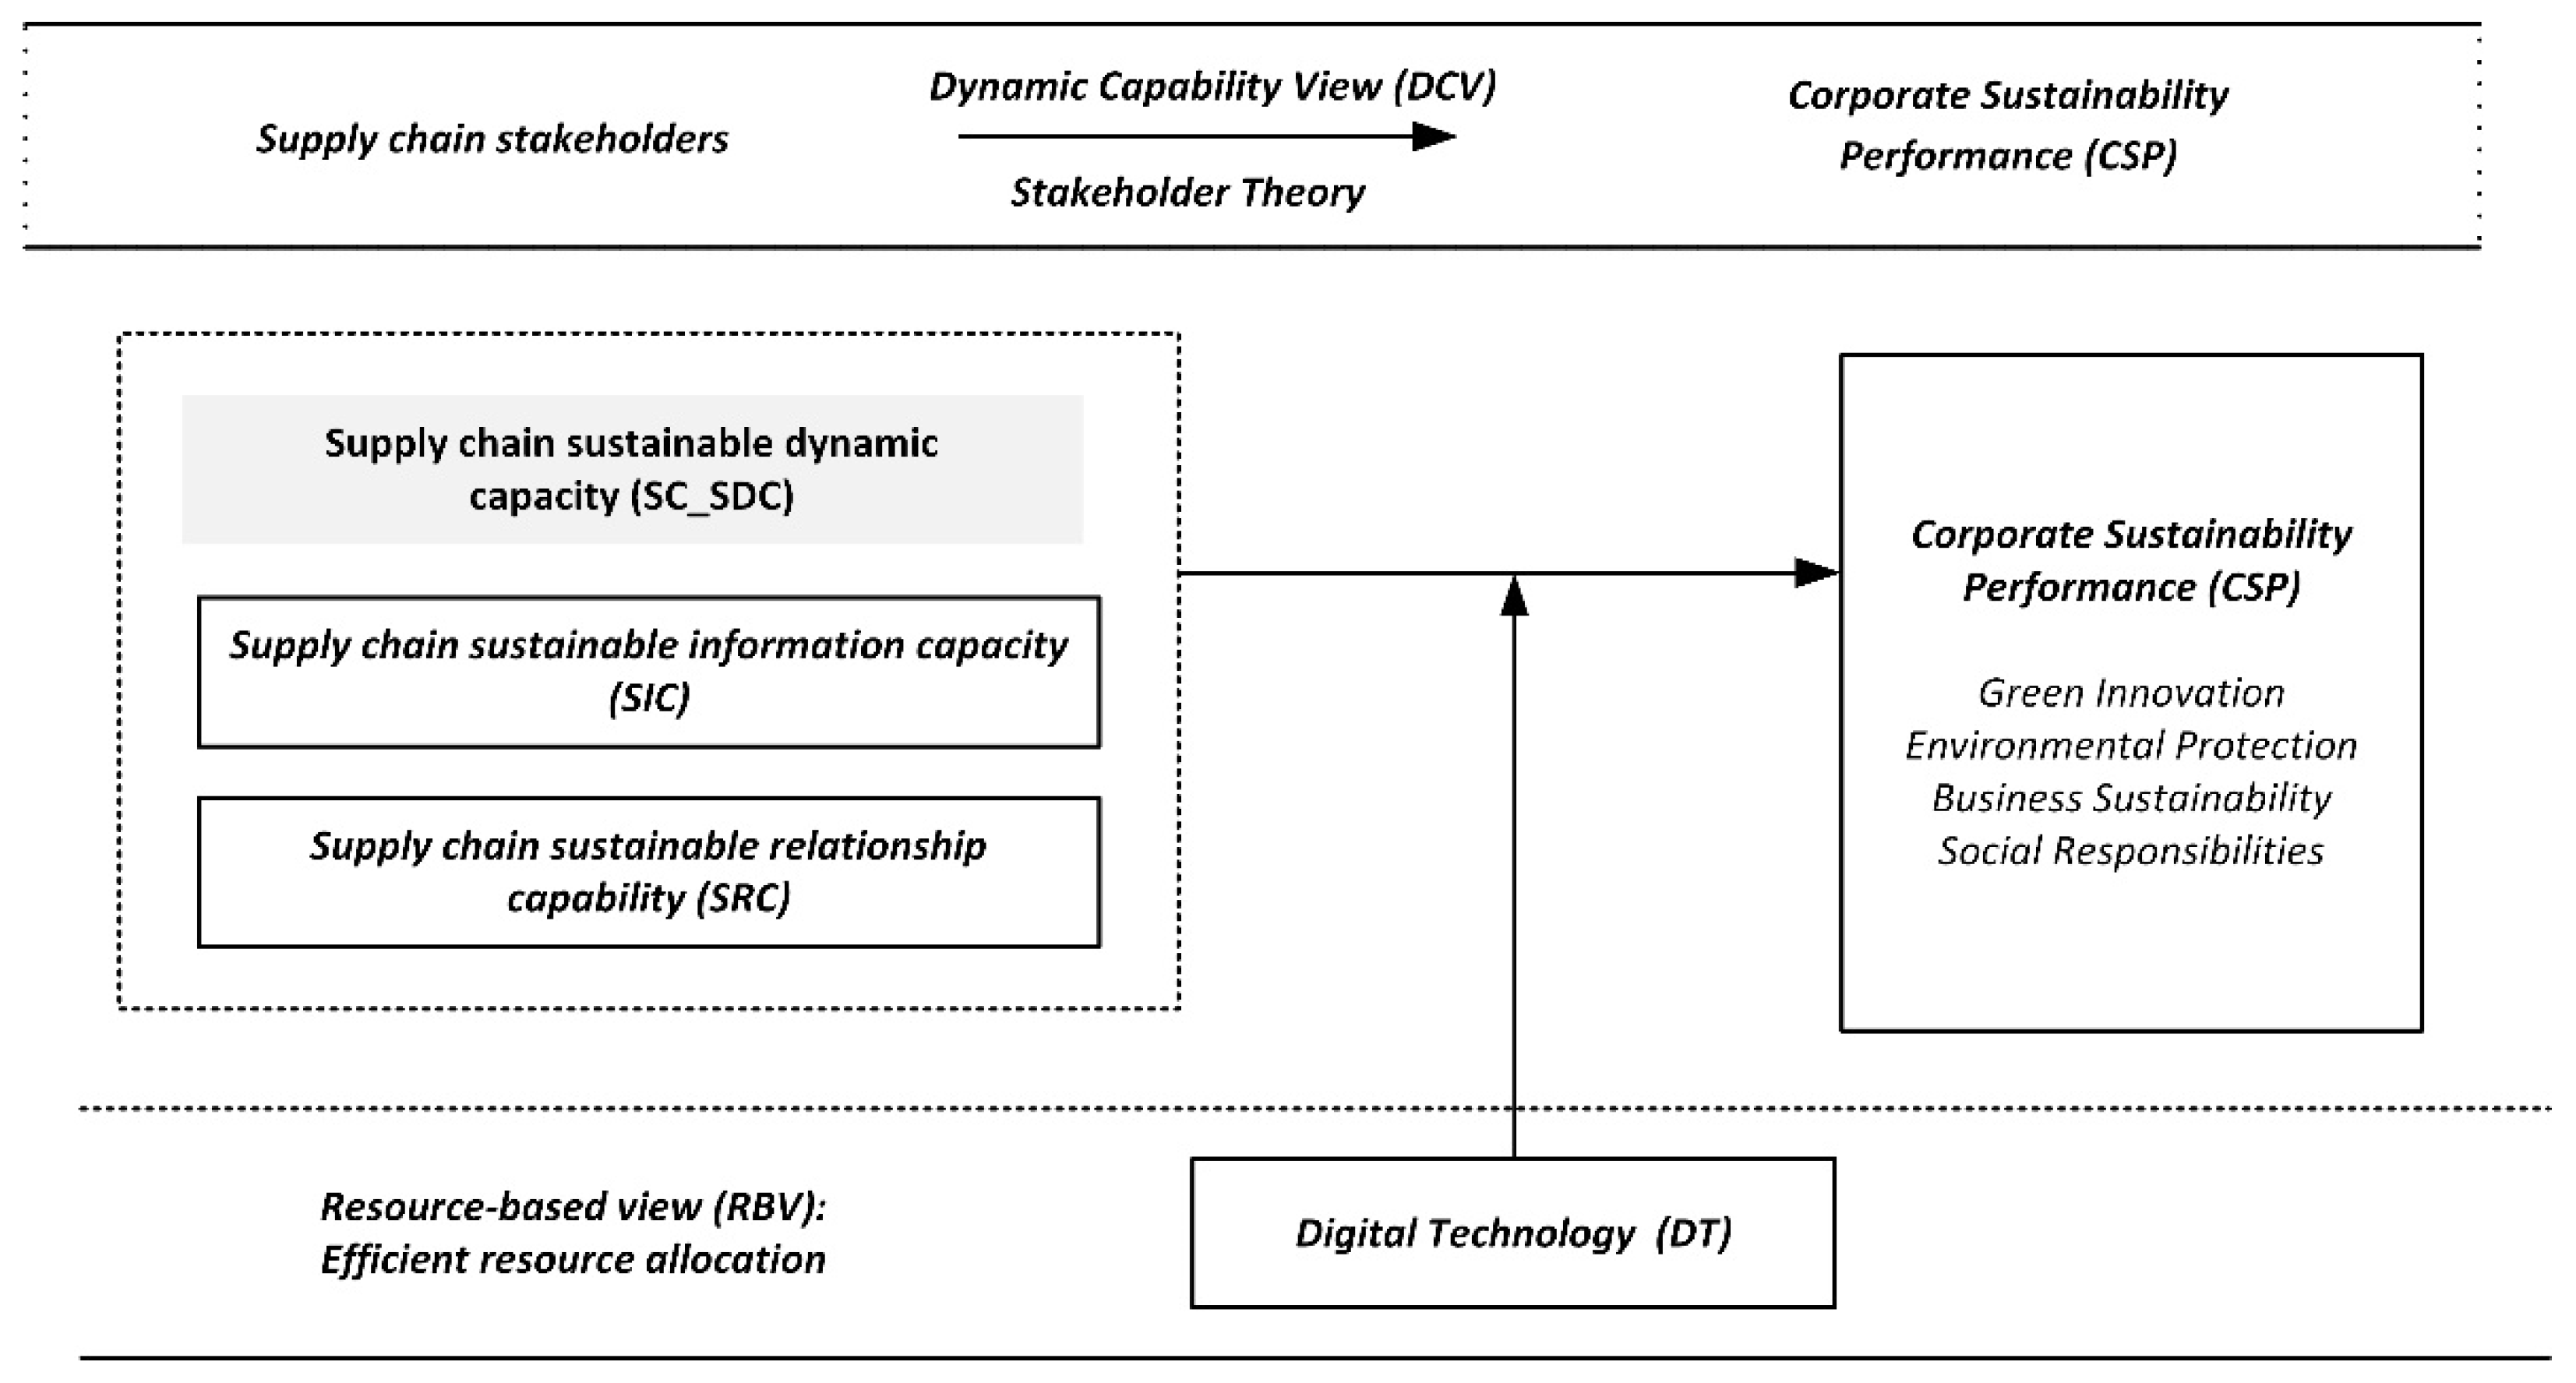
6]. This study defines and examines the following two supply chain sustainable dynamic capabilities (SC_SDCs): sustainable information capability (SIC), which denotes a firm’s capacity to effectively exchange meaningful sustainability-related data with its partners while minimizing the distortion of information both within and beyond organizational boundaries, and sustainable relationship capability (SRC), which concerns engaging in mutual adjustment activities and developing or utilizing inter-firm sustainable resources. This research centers on Chinese manufacturing enterprises, whose resource-intensive processes and complex supply chain interactions underscore the critical importance of examining how DT facilitates dynamic sustainable collaboration within the supply chain, making it a highly pertinent and valuable area of inquiry.
Numerous studies have examined the micro-level role of DTs, particularly in shaping internal decision-making and external stakeholder collaboration [7]. However, limited research has explored how DTs influence the sustainable dynamic capabilities of different types of supply chain stakeholders. Specifically, few studies have systematically investigated the heterogeneous impacts of upstream resource-driven and downstream demand-driven mechanisms on firms sustainability performance. Shifts in inter-firm collaboration, coupled with the varied demands of enterprises at different supply chain positions adopting digital transformation to achieve sustainability goals, underscore the need to reinterpret inter-organizational relationships [8]. Upstream supply chain firms leverage DTs to trace and manage raw materials, thereby increasing supply chain transparency and ensuring the traceability and sustainability of acquired resources [9]. Closer to the production end, manufacturers must align long-term social and environmental objectives with product innovation and market demands [10]. Hence, firms at various points in the supply chain exhibit distinct focal areas and pathways when realizing sustainability goals. This study aims to investigate: (1) how DTs influence sustainable collaboration capabilities in supply chains; (2) how these effects differ between suppliers and customers; and (3) what implications these findings have for managerial strategies.
This study leverages data from publicly listed manufacturing firms spanning 2010 to 2023 to explore how DTs effectively enhance two key dynamic capabilities, thereby driving improvements in CSP. The sample begins in 2010, when CSR scores became consistently available and new accounting standards were widely adopted, ensuring reliable sustainability measurement. Grounded in the resource-based view (RBV), the study incorporates the dynamic capability view (DCV) to address the RBV’s limitations in explaining adaptation in dynamic environments. While the RBV emphasizes the acquisition of valuable, rare, inimitable, and non-substitutable resources to build competitive advantage, its static orientation limits its ability to capture the evolution of such advantages under change. The DCV advances this framework by highlighting firms abilities to sense changes, seize opportunities, and reconfigure resources—emphasizing the continuous renewal of capabilities as essential for sustained competitiveness. Within this framework, SIC is defined as a data-driven sensing capability, while SRC reflects the relationship-oriented capacity for resource integration and adaptation. Additionally, stakeholder theory introduces an external perspective, stressing that firms must respond to the environmental and social expectations of upstream and downstream partners to achieve joint value creation. Integrating these theoretical perspectives, this study identifies and differentiates how various stakeholders influence corporate sustainability performance through resource-push and value chain–pull mechanisms.
This paper makes several contributions. First, it establishes an innovative theoretical framework linking SC_SDC with CSP. From a dynamic resource perspective, the study uncovers how DT indirectly enhances CSP by strengthening SIC and SRC, offering new theoretical support for developing dynamic capability, optimizing external collaboration, and improving sustainability performance. Secondly, this study innovatively introduces framework defining SC_SDCs through information and relationship capacities, advancing existing research on enhancing CSPs via external collaboration. Notably, it details the specific pathways through which DT exerts a positive impact on CSP by reinforcing these two dynamic capabilities, providing a more refined theoretical foundation for empirical studies on SC_SDC. Third, the study further elucidates the distinct mechanisms by which suppliers and customers drive CSP. By proposing and validating two driving mechanisms—“source-driven” (resource input) and “value chain-driven” (demand output)—this work offers a fresh academic viewpoint on the division of roles and collaboration pathways within SC_SDC for sustainable development, thereby deepening the understanding of supply chain sustainability.
The structure of this paper is as follows: Section 2 outlines the theoretical background, reviews related literature, and presents the hypotheses. Section 3 details the research design, including data sources and methodology. Section 4 present and interpret the empirical findings. Section 5 discusses the study’s contributions, limitations, and directions for future research. Section 6 is a conclusion.

2. Theoretical Foundation and Hypothesis Development

2.1. Theoretical Foundations

Prior research has demonstrated that corporate green innovation is shaped by a range of external influences [11,12]. Meanwhile, dynamic capability view (DCV), resource-based view (RBV), and stakeholder theory provide critical theoretical frameworks for understanding the focal firm–supply chain relationships. Drawing on these three theories, this study explores how DTs, dynamic capabilities, and key stakeholders influence CSP.
Existing studies regard dynamic capabilities as key drivers of sustained competitive advantage. Dynamic capabilities refer to a firm’s ability to sense market changes, respond to challenges, and reconfigure internal and external resources to maintain core competitiveness [13]. The process of enhancing interconnectivity and mutual influence among firms through digital transformation is a continuously evolving dynamic trajectory. The dynamic capabilities framework provides a critical foundation for analyzing the positive outcomes of digital transformation. While digital transformation alone may not generate additional returns, when effectively integrated into business processes to activate dynamic capability development it can support firm growth and yield extra value [14].
Stakeholder theory posits that trust-based collaboration with diverse stakeholders is crucial for corporate strategy and organizational decision-making in social and environmental management [15]. Stakeholders refer to individuals or groups whose actions can influence, or who may be influenced by, an organization’s ability to achieve its goals [16]. Unlike other theories that view the “environment” as a holistic entity, stakeholder theory emphasizes the relationships between organizations and their specific stakeholders. It suggests that firms must consider the interests and expectations of key supply chain stakeholders to achieve long-term success.
Although research in supply chain management has made significant progress, studies exploring how resources and capabilities are bundled to create competitive advantage remain limited [17,18]. The RBV posits that firms achieve sustainable competitive advantage by acquiring valuable, rare, inimitable, and non-substitutable resources and converting them into organizational capabilities [19]. However, the RBV emphasizes static attributes of resources and capabilities and falls short in explaining how competitive advantage evolves in dynamic environments. To address these limitations, the DCV extends the RBV by incorporating temporal evolution and environmental uncertainty, highlighting firms abilities to sense, integrate, and reconfigure resources in response to change [20]. Research further suggests that sustained accumulation, adaptation, and recombination of resources and capabilities enable firms to build inimitable advantages in turbulent contexts.
Thus, the DCV complements the RBV by emphasizing the continuous renewal of operational capabilities to ensure strategic flexibility in rapidly changing environments. This study extends the RBV framework by incorporating an evolutionary and dynamic perspective, addressing the dynamic influence of upstream and downstream sustainable collaboration capabilities on firms. While the RBV explains competitive advantage through resource allocation, prior research suggests that it must be complemented by dynamic adaptation mechanisms to capture sustained competitiveness [21]. This research offers a novel perspective on how DTs interact with sustainable relationships and information capabilities within supply chains to drive long-term competitive advantage. Drawing from the dynamic resource-based view, this study establishes a robust conceptual basis to explain how firms harness digital transformation to strengthen sustainability across supply chain operations.

2.2. Hypothesis Development

2.2.1. Digital Technology

As intelligent technologies become increasingly embedded in manufacturing, digital transformation is reshaping conventional production and operational processes. These emerging tools facilitate more effective resource utilization, thereby enhancing the realization of environmental sustainability goals.
The Internet of Things (IoT) refers to a system of interconnected physical devices equipped with embedded sensors, software, and technologies that enable real-time data exchange and monitoring [2]. In remote settings, IoT devices typically depend on battery power, and improvements in battery efficiency are pursued to lessen ecological footprints [22]. Cloud computing supports remote access and management of data, allowing flexible, efficient distribution and real-time application of information, thereby promoting environmentally conscious computing practices. Big data analytics plays a pivotal role in facilitating sustainable manufacturing and supply chain practices in the automotive sector, and can further aid in reducing carbon emissions by supporting the scale-up of low-emission vehicle technologies [23]. To enhance transparency and accountability in material sourcing and battery usage, blockchain-integrated IoT platforms have been employed to trace battery material lifecycles, monitor battery health, and ensure ethical sourcing throughout the supply chain. Meanwhile, artificial intelligence (AI), with its capabilities in adaptive learning and decision-making, is being applied in environmental contexts through advanced algorithms that model and anticipate ecological changes [24].

2.2.2. Corporate Sustainability Performance

The foundational understanding of dynamic capabilities highlights the integrated nature of sustainability across social, environmental, and economic domains. Achieving social sustainability involves harmonizing the interests of employees, suppliers, consumers, and broader society. Environmental sustainability, on the other hand, reflects a company’s commitment to eco-friendly operations and practices. A forward-looking sustainability strategy is characterized by voluntary and consistent corporate efforts aimed at achieving balanced growth across economic, environmental, and societal fronts [25,26]. Green innovation serves as a key mechanism for companies to build competitive advantage, relying on the continuous exchange of knowledge and the interaction of environmental, social, and economic factors. This serves as an endogenous driving force for businesses to adopt SD [27].
When formulating strategic decisions companies increasingly consider the sustainable practices of their supply chain partners, particularly regarding their contributions to environmental preservation [28]. This shift is evident in the growing body of literature emphasizing sustainability-oriented criteria in supplier evaluation and selection [29,30]. Collaborative monitoring across supply chain actors plays a critical role in ensuring adherence to both stakeholder-driven environmental expectations and formal environmental regulations [31]. Moreover, macro-level regulatory interventions from governments are shown to significantly reinforce the effectiveness of sustainability within collaborative innovation networks. Additionally, prior studies have recognized that firm-level differences and contextual external conditions can substantially shape the direction and intensity of technological innovation [32]. Thus, the external macro policy environment for businesses and the tendency for cooperation among micro-level supply chain companies confirms the need for SD measures. This paper investigates the external collaborative effects arising from stakeholders in the supply chain implementing sustainable development strategies across various dimensions.
Researchers have adopted a wide range of indicators to evaluate sustainability performance. On the financial and economic fronts, typical metrics include revenue growth, profit margins, return on investment, and market share [33]. From a macro-environmental perspective, broader macro-level assessments have considered factors such as improvements in ecological performance [33], progress in industrial green transformation [34], as well as levels of pollutant and carbon emissions. Nevertheless, the most critical sustainability concerns are often rooted in environmental degradation and social equity issues [35]. In this context, firms voluntary engagement in socially responsible initiatives plays a pivotal role in advancing sustainable practices throughout the supply chain. We innovatively expand the concept of CSP by encompassing green innovation, environmental protection, sustainable strategy, and social responsibility. Diverging from prior research, this study enhances the existing literature by incorporating the perspective of corporate governance into the analysis of sustainable development strategy formulation and social responsibility, complementing the focus on economic performance and macro-environmental changes. Therefore, we propose the following hypothesis:
H1: 
The adoption of DT has a positive effect on CSP.

2.2.3. Supply Chain Sustainable Dynamic Capabilities

Supply chain sustainability is increasingly conceptualized as the development of enduring and mutually beneficial partnerships that foster value creation and competitive advantage. Such collaboration is driven by ongoing information exchange and interaction, which enable the emergence of shared innovation and the co-creation of sustainable systems [36]. While prior research has highlighted the role of collaborative platforms in facilitating innovation alignment across supply chain partners [37,38], these relationships are inherently interdependent—where the success and continuity of each firm often rely on the collective performance of the entire network [39]. The application of DTs is rapidly changing the implementation and usage of supply chains. Digitalization unlocks untapped internal resources within firms and gradually reshapes sustainable collaboration within supply chain organizations. It facilitates the transfer of green and sustainable value across broader network relationships, enabling co-creation and value delivery. With the dynamic changes and uncertainties in the business landscape, customers and supply chain partners are placing new demands on the SDCs of enterprises. While existing research extensively explores supply chain relationships and sustainability, the role of DTs in enhancing firms dynamic capabilities for knowledge acquisition, absorption, transformation, and application remains underexplored [10]. This study addresses this gap by examining the mechanisms through which DTs strengthen dynamic capabilities to drive CSP, offering new insights into the intersection of digital transformation and sustainable performance.
The basic proposition of the RBV emphasizes integrating complementary capabilities to achieve competitive advantage and enhanced performance. SRC is a vital asset, increasingly leveraged through DTs that facilitate the monitoring of firms sustainability practices. In supply chains, upstream manufacturers must cultivate strong relational ties and reinforce them through continuous supplier performance assessments. Prior research has thoroughly explored how firms identify and harness the value embedded in inter-organizational partnerships.
Realizing the full potential of DT requires the development of complementary capabilities. The core premise of the dynamic RBV emphasizes the integration of various complementary capabilities to achieve competitive advantage. SC_SRC has emerged as a critical resource, further accelerated by the ability of DTs to track the sustainable activities of focal firms. Extensive research has explored the discovery and utilization of inter-organizational relationship value [40,41,42]. Upstream manufacturing firms in the supply chain must establish strong relationships to better coordinate activities and enhance customer SRCs through continuous supplier performance evaluations [43]. While existing literature provides limited insights into how SRCs drive CSP, this study advances the understanding of SRC as a dynamic capability that fosters trust, resource reciprocity, and strategic alignment within supply chains. By facilitating value co-creation and risk mitigation in green technology innovation, information transparency, and environmental responsibility, SRCs enhance firms long-term competitive advantage and social legitimacy. Moreover, through information sharing and collaborative innovation, SRCs drive broader sustainable transformations and performance improvements across industrial ecosystems, highlighting their critical role in achieving sustainable supply chain management. Therefore, we propose the following hypothesis:
H2: 
Digital technologies enhance CPS by improving firms SC_SDC.
Synthesizing H1 and H2, we propose a sequential mediation model that positions sustainable information and relationship capabilities as critical dynamic mechanisms linking DTs to CSP. This reflects a dynamic RBV perspective in which firms sense environmental and stakeholder expectations through SICs, seize collaborative opportunities via SRCs, and transform operations to generate sustainable performance. Prior literature has suggested that DTs can strengthen transparency and knowledge flows [44], enabling firms to build trust-based relationships. These relationships, in turn, drive innovations in green product design, emissions reduction, and social responsibility. Thus, we theorize the following coherent, three-stage pathway:
H3: 
SIC and SRC jointly mediate the relationship between DTs and CSP.
Based on the above hypotheses, the theoretical model of this paper is depicted in Figure 1.

3. Research Design

3.1. Variable Selection

This study draws on panel data from manufacturing firms listed on the Shanghai and Shenzhen Stock Exchanges from 2010 to 2023, covering 19 sectors such as general equipment, automotive, and electronic information manufacturing. The starting point of 2010 was chosen to align with the widespread adoption of new accounting standards and the availability of consistent CSR scores from Hexun, both of which are crucial for measuring corporate sustainability performance. After excluding firms designated as ST or *ST and those lacking sufficient data on digitalization and supply chain indicators, a final sample of 1233 firms was retained.
Data were collected from the China Stock Market & Accounting Research (CSMAR) and IFinD databases, with DT and supply chain variables sourced from CSMAR and control variables from IFinD. Given the longitudinal nature of the dataset, some missing values persisted despite prior filtering. To mitigate potential bias due to missing values in the panel dataset, we employed the MICE forest algorithm, which is based on a random forest-based chained equation method [45]. This approach is particularly effective for large-scale panel datasets with mixed data types and non-linear relationships. We chose MICE forest over other imputation techniques due to its robustness and ability to preserve complex interactions between variables. The average missing rate across all variables is below 5%, and all imputed values were evaluated for consistency and plausibility.
(1) Digital technology
This study evaluates corporate digitalization through the following five key technological dimensions: big data, blockchain, artificial intelligence, digital applications, and cloud computing. The data obtained from the CSMAR database reflect the extent of digital transformation among listed firms. Building on existing research [46], the study quantifies the adoption levels of these technologies by analyzing the frequency with which they are referenced in the publicly available reports of firms. These individual measures are then integrated to form a composite index representing the overall digital transformation of each firm.
To construct composite indicators for DT and CSP, we employed the entropy weighting method. This technique assigns objective weights based on the dispersion degree of each component indicator, thereby reducing subjectivity. Specifically, the entropy method follows the subsequent steps: (1) normalization of indicators; (2) calculation of entropy values to capture the information content of each indicator; (3) determination of divergence coefficients; and (4) generation of weighted composite scores. This method allows us to effectively synthesize multi-dimensional indicators into single indexes, improving interpretability and comparability.
(2) Sustainability development performance
Corporate sustainability performance data were sourced from corporate sustainability research reports in the CSMAR database, encompassing the following seven tertiary indicators: environmental emissions disclosure, environmental management costs, sustainability reporting guidelines, environmental sustainability disclosure, public relations and social service, system construction, and social donations. These indicators were categorized into three secondary indicators, environmental protection, commercial sustainability, and social responsibility, as detailed in Table 1.
Based on existing research that uses green patents to measure industrial innovation [47], the study further calculates green innovation performance using the super-efficiency SBM-based DEA method. Inputs included R&D expenses and R&D personnel, while outputs comprised green patent grants and operating revenue. Sustainability performance was determined by calculating indicator weights using the entropy method, resulting in the final composite index values.
(3) Supply chain sustainable dynamic capability
Supply chain data were obtained from each firm’s publicly disclosed top five suppliers and top five customers. We first compiled supplier and customer information for each firm and collected data on the DT adoption and sustainability performance of these supply chain partners. A firm whose supply chain partners exhibit high levels of digitalization is considered to possess high sustainable information management capabilities (SICs), as such partners are more efficient and accurate in acquiring, processing, and integrating sustainable information. Similarly, a firm whose supply chain partners demonstrate superior sustainability performance is deemed to have strong external sustainable relationship capabilities (SRCs), as effective sharing of green technologies and innovative ideas fosters deeper collaborative synergies with supply chain partners.
Additionally, six firm-level fundamentals were included as control variables to account for the potential influences of firm size, operational capacity, and other factors on the estimation results. Table 1 provides a detailed description of all variables.
Source: digital technical, corporate sustainability performance from publicly available databases collated by CSMAR (China Stock Market & Accounting Research Database), URL: https://data.csmar.com/ (accessed on 15 February 2024); Control variables from IFinD; Green patent data from Patent Star, URL: https://www.patentstar.com.cn/ (accessed on 15 February 2024).
Table 2 presents the correlation matrix for all variables. As shown in Panel A, DT is positively correlated with CSP. To assess potential multicollinearity among the independent variables, diagnostic tests were conducted. The results confirm that multicollinearity is not a concern, as all variance inflation factor (VIF) values are below 10 and the tolerance levels exceed 0.1. Detailed results are provided in Panel B of Table 2.

3.2. Measures

(1) Basic Regression Model
We used the following panel regression model to investigate the relationship between DT and CSP:
C S P i t = φ 0 + φ 1 X i t + φ 2 Z + γ i + ϑ s + μ t + ε i t
C S P i t = φ 0 + φ 1 S C _ S D C i t + φ 2 D T i t + φ 3 S C _ D T D T + φ 4 Z + γ i + ϑ s + μ t + ε i t
where X represents the four variables of DT, SC_SDC, SIC, and SRC, respectively. i is the firm and t is the year. μ t is the unobservable firm-specific effect and ε i t is the error term. IC is a proxy variable for the innovation capability while γ i denotes firm fixed effects, ϑ s denotes industry fixed effects, μ t is the year fixed effect, and Z is the control variable.
(2) GMM Regression Model
Considering that the firm innovation capability may be characterized by continuity and dynamism, the lagged terms of the explanatory variables were included in the econometric model to avoid possible errors caused by omitted variables and to address the estimation bias caused by endogeneity issues [48]. The model is as follows:
C S P i t = φ 0 + φ 1 S C _ S D C i 1 , t + φ 2 X i t + φ 3 X i 1 , t + φ 4 Z + ϑ i + μ t + ε i t
The regression model used both differential GMM and systematic GMM, where the lagged term of the explanatory φ 1 C S P i 1 , t is set as the endogenous variable, the exogenous variable is X, and the rest of the control variables are predetermined. X representing the variables of DT and supply chain-related variables, respectively. The estimation results need to be tested after use, and usually the differences in the random error term are tested for the existence of first-order and second-order autocorrelation to ensure the consistent estimation of GMM [49]. The estimation results are judged by the significance of AR (1) and AR (2). In addition, a Hansen test is required to determine whether the instrumental variables used are valid.

4. Empirical Analysis

4.1. Basic Regression Results

(1) Digital Technology Enhances Corporate Sustainability Performance
Table 3 reports the impact of digitalization on CSP, and when the relationship between a firm’s overall digitalization and their CSP is positive and significant then H1 is confirmed. Digitization enables access to integrated networks of previously underutilized big data, offering substantial opportunities for environmental and societal advancements. In the automotive sector, the adoption of DTs has facilitated the integration of green technologies aimed at reducing aspects highlighted by the authors of [50,51]. The development of DTs, including cloud computing and mobile technologies, significantly improves the efficiency of knowledge exchange, thereby accelerating innovation processes. Specifically, tools such as cloud-based design platforms and big data analytics enhance information flow, supporting eco-design practices and the development of sustainable products [52,53]. These technological innovations, driven by DT, promote environmentally responsible practices within the automotive supply chain by facilitating green knowledge transfer and cleaner production methods.
Table 3 indicates that DT significantly enhances SC_SDC, with a more pronounced effect on information capability than on relationship capability. This likely stems from DT’s direct role in enhancing data sharing, operational transparency, and real-time visibility, whereas its influence on relational capacity is more indirect and contingent on organizational and cultural adaptation. Figure 2 illustrates the baseline regression outcomes, reflecting these direct impacts.
(2) Sustainable Dynamic Capabilities of the Supply Chain as a Moderating Factor
Table 4 illustrates the impact of SC_SDC on CSP, as well as the moderating effect of DT. The empirical results demonstrate that SC_SDC significantly enhance CSP, and this effect becomes more pronounced as a firm’s DT level increases. Stakeholder commitment to collaboration plays a critical role in cultivating sustainable resources. This study advances existing research by confirming the pivotal role of SDCs in driving CSP. While previous research emphasizes the necessity of reconfiguration and adaptation in resource sharing, our findings extend this view by demonstrating that firms with stronger digital programming capabilities can further amplify CSP through the development of adaptive and collaborative supply chain capabilities. These results underscore the strategic value of digitalization in reinforcing dynamic capabilities that support sustainable supply chain management [54]. This underscores the strategic importance of leveraging digitalization to strengthen adaptive and collaborative capacities within the supply chain.
Specifically, when analyzing SIC and SRC, we find that high DT levels more strongly moderate the impact of SRC on CSP compared to SIC. As suppliers are the primary sources of raw materials and components, their information capabilities critically shape firms’ insights and control over supply chain sustainability. Enhancing SICs, such as enabling the visualization of production materials and access to sustainable production technology information, makes a more substantial contribution to improving CSP. In contrast, SRC exerts a greater influence on CSP, primarily driven by market demand and downstream value chain collaboration. Customers, as the ultimate drivers of demand, directly influence firms’ product design, technological development, and market strategies. SRC promotes CSP by fostering co-development of market-aligned sustainable products and services (e.g., low-carbon products or recyclable packaging), thereby enhancing firms’ innovation capabilities and social responsibility practices.
(3) Pathways of Digital Technology’s Impact on Sustainable Development Performance
Table 5 provides novel insights into the indirect impact of DT on CSP by uncovering a sequential mediation pathway. While DT significantly enhances CSP through SIC (β = 0.021), its direct effect via SRC is not significant. Instead, DT strengthens SRC by first improving SIC, which subsequently enhances CSP. These findings reveal a structured mechanism in which DT fosters SIC, enabling the development of SRC, which ultimately drives CSP. This integrated perspective advances the understanding of how DTs shape CSP through SC_SDCs. To assess the significance of the indirect effects between the two dynamic capabilities, a bootstrap analysis with 1000 resamples was performed. The resulting confidence interval excluded zero, confirming the existence of a statistically significant mediating effect.

4.2. Robustness Check

This study employs various methods to address potential endogeneity and sample selection bias, confirming the robustness of the findings. Using two-stage least squares (2SLS) with company size as an instrumental variable, weak instrument tests and validity checks affirm the appropriateness of the instrument, with the core explanatory variable remaining significantly positive. Propensity score matching (PSM) with caliper nearest neighbor and kernel matching further verifies that matched samples do not alter conclusions, reaffirming the positive impact of DT on CSP. Dynamic system GMM and differential GMM results also indicate no second-order autocorrelation or instrument bias, with significant time continuity in CSP changes. Detailed results are available in the Supplementary Materials.

4.3. Further Research: Based on the Heterogeneity of Sustainable Collaboration Subjects

In the preceding analysis we have demonstrated that DT enhances CSP by strengthening SC_SDCs, partially supporting the notion that coordination and integration among supply chain stakeholders foster a conducive environment for sustainable development [55]. Building on this foundation, we further explore the heterogeneity of sustainability strategy implementation entities, an area where existing literature remains limited. Within sustainable supply chain collaboration, it is crucial to investigate how DT triggers sustainability behaviors at different levels. This study extends the discussion by offering a more nuanced perspective, exploring how digitalization shapes the dynamic interactions between firms and their sustainable collaboration networks.
Upstream suppliers’ dual transformation toward digitalization and sustainability contributes to conserving raw materials and energy [56] while also reducing emissions and waste at the point of origin within the supply chain. In contrast, downstream partners tend to prioritize the sustainability of final products, emphasizing attributes like fuel efficiency, emissions reduction, and recyclability. To our knowledge, there is a lack of research that separately examines how upstream suppliers and downstream customers—each with unique resource capacities and sustainability priorities—shape the focal firm’s capacity to build sustainable external collaborations.
(1)
The Impact of SRC on Corporate Sustainability through the Green Innovation Path
Table 6 presents the impact of supply chain green innovation and environmental protection relational capabilities on CSP. GI relational capability (SRC_GI) has a significant positive effect on CSP, and this relationship is strengthened as firms’ digitalization levels increase. This indicates that DTs facilitate the transfer of green knowledge and technologies among supply chain entities, thereby enhancing CSP. A more intuitive representation is shown in Figure 3, comparing the impact coefficients of firms SRCs with suppliers and customers on CSP.
Subsequently, we examined the green innovation relational capabilities of suppliers and customers separately. The empirical results reveal that both have a positive impact on CSP, but the effect of customer green innovation on relational capability is stronger (0.142 > 0.129). The interaction coefficient (0.007 > 0.001) further indicates that higher digitalization levels amplify the positive impact of customer SRC_GI on CSP. This is consistent with the findings of Zhang, et al. [57], who argue that manufacturers tend to prioritize green innovation initiatives. Moreover, market-driven pressures are widely recognized as a primary catalyst for advancing corporate GI [58]. Customers committed to green development exert high demand for environmentally friendly technologies and production processes, emphasizing green product design, waste reduction, and efficiency improvements. These demands create spillover effects or downward pressure on upstream firms, encouraging collaboration with suppliers to develop sustainable solutions. We summarize this influence as customer-driven: a demand-oriented “value chain-pull” mechanism.
(2)
The Impact of SRC on Corporate Sustainability through the Environmental Protection Path
The environmental protection relational capability (SRC_EP) of the supply chain has a significant impact on enhancing corporate environmental measures, with DT serving as a positive moderator. However, the influence of supplier environmental protection relational capability on CSP is more prominent. The results indicate that upstream suppliers prioritize waste regulation compliance and efficient resource use, whereas downstream customers focus on recyclability, reflecting circular economy principles. The environmental protection capabilities of suppliers (SRC_EPs) significantly improve CSP by mitigating carbon emissions and minimizing resource waste at the source [59]. In contrast, customers’ SRC_EPs mainly influence corporate behavior indirectly through demand guidance. This indicates that establishing partnerships with “cleaner” suppliers significantly enhances a firm’s environmental image and recognition among external stakeholders. We summarize this impact as supplier-driven: a resource-oriented “source-push” mechanism. Figure 3 illustrates the directional influence of suppliers and customers on CSP.
(3)
The Impact of SRC on Corporate Sustainability through the Commercial Sustainability Path
Table 7 demonstrates the impact of supply chain commercial sustainability and social responsibility relational capabilities on CSP. Customer supply chain commercial sustainability relationships capabilities (SRC_CSs) significantly and positively influence CSP, with higher levels of corporate digitalization amplifying this effect. As end-demand stakeholders, customers place greater emphasis on adherence to ESG standards and transparency within the supply chain, driving firms to optimize sustainability strategies to meet disclosure requirements. Customers focus on product carbon footprints, energy efficiency, and recyclability, demanding transparent environmental management practices. This demand-driven pressure compels firms to improve environmental practices, thereby significantly enhancing CSP. Consequently, customer sustainability relational capability exerts a stronger influence on CSP through direct external pressure. We summarize this mechanism as the “value chain-pull” effect.
(4)
The Impact of SRC on Corporate Sustainability through the Social Responsibility Path
Stakeholders’ social responsibility capacity within the supply chain (SRC_SR) significantly shapes a company’s SR actions. Incorporating DT as an interaction term enhances the impact of SRC_SR on a company’s sustainability. Firms that demonstrate consistent social responsibility tend to foster greater stakeholder trust by meeting societal expectations and achieving tangible outcomes [60,61]. Analyzing the supplier and customer social responsibility relationships’ effects on a company’s commitment, downstream customers (0.156 > 0.145) notably drive a company’s SR willingness and capability. Their emphasis on SR, consumer expectations, and brand image influences this outcome. When a company enjoys a positive reputation, well-aligned corporate SR initiatives elicit more favorable consumer responses [62]. Therefore, the influence mechanism of SRC_SR is understood as a “value chain-pull” effect. Figure 4 illustrates two distinct impact patterns on CSP across different dimensions of sustainability.

5. Discussion

5.1. Theoretical Significance

Firstly, this study establishes a research framework at the intersection of the dynamic resource perspective and corporate sustainability theory, providing a theoretical basis for the impact of DT on shaping external collaboration within the supply chain to achieve sustainable development paths for enterprises. While prior research has confirmed that leveraging internal relational capabilities accelerates exploratory innovation [63,64], the role of external SC_SDCs in measuring and constructing effective supply chain collaborations for sustainability remains underexplored. Dynamic capability theory provides insight into the foundations of competitive advantage [13]. However, the mere possession of such capabilities does not guarantee improved performance as outcomes are contingent upon their adaptability and the effectiveness of their evolution. While prior research has predominantly focused on DTs as enablers of supply chain agility and resilience [65], this study emphasizes their role in cultivating sustainable relational capabilities to facilitate efficient resource reconfiguration.
Secondly, this study advances the understanding of how DT drives external dynamic collaboration within the supply chain to foster sustainable development. While previous research highlights the importance of upstream and downstream collaborations in sustainability efforts [43], our study further delineates the mechanisms through which DT facilitates sustainable behaviors across different dimensions and levels. By examining the differential roles of supply chain stakeholders in supporting sustainable development strategies, we not only confirm the direct impact of DT on CSP but also innovatively identify an indirect pathway wherein DT enhances SIC, which subsequently strengthens SRC, ultimately improving CSP. Grounded in the dynamic resource-based perspective, this study unveils distinct capability-building pathways through which DT drives corporate sustainability performance.
Thirdly, this study uncovers the distinct influence mechanisms of supply chain sustainable dynamic capabilities (SC_SDCs) on CSP, shaped by the heterogeneity of external SRCs and sustainable development demands across the supply chain. Specifically, we innovatively identify the following two differentiated pathways: a supplier-driven, resource-input-based “source-push” mechanism and a customer-driven, demand-output-based “value chain-pull” mechanism. Upstream suppliers, leveraging digitalization and green transformation [56], primarily enhance environmental protection by optimizing resource utilization and minimizing emissions and waste at the supply chain source. Consequently, digitalization among suppliers more strongly influences a firm’s environmental performance by enhancing upstream resource efficiency. Conversely, downstream partners emphasize product-level sustainability—focusing on material utilization, emissions reduction, and recyclability—as a means to meet societal expectations and strengthen brand image [66]. Driven by DTs, customer engagement increasingly facilitates green innovation, business sustainability, and corporate social responsibility through a demand-oriented pull mechanism [67]. This differentiation stems from the direct impact of resource inputs versus the indirect influence of market demand within the supply chain. By identifying these distinct pathways, this study not only enriches academic discourse on supply chain sustainability but also provides a theoretical foundation for firms to implement sustainable development strategies across different supply chain stages.

5.2. Realistic Significance

From the perspective of the RBV, DTs play a critical role in supporting firms’ sustainable development strategies, particularly by enhancing their ability to build sustainable relationships within the supply chain and improve SICs. Existing research, primarily focused on technological characteristics, has confirmed that additive manufacturing (AM), as an advanced digital production method, contributes positively to corporate sustainability performance by enabling localized, on-demand production and material efficiency, thereby reducing carbon emissions and resource waste [68]. Building on this foundation, this study further reveals how DTs strengthen firms’ SICs and SRCs, which in turn facilitate the development of collaborative sustainability mechanisms and improve the overall green responsiveness of the supply chain. These findings not only extend the theoretical understanding of AM in the context of sustainability but also provide a clear conceptual and practical roadmap for manufacturing firms to develop complementary digital collaboration capabilities when adopting emerging technologies such as AM to achieve sustainability goals.
Based on our findings, enterprises should develop differentiated sustainability collaboration strategies aligned with their positions in the supply chain and the types of stakeholders they engage with so as to enhance resource utilization efficiency and promote circular economy practices. Specifically, managers must fully recognize the complementarity between the “source-push” mechanism (resource-driven) and the “value chain-pull” mechanism (demand-driven) within supply chains and adopt coordinated strategies to achieve end-to-end sustainability goals. The upstream-push mechanism emphasizes production efficiency and environmental compliance, enabling firms to optimize costs and maintain operational stability [69]. For firms in upstream segments—typically responsible for raw material supply or basic component manufacturing—their sustainability strategies should focus on improving resource efficiency and compliance capabilities. As critical links at the origin of green manufacturing, these firms can enhance environmental performance and strengthen their strategic position in green supply chains by advancing energy-saving technologies, obtaining green certifications, and optimizing production processes in line with the proposed source-push mechanism. Conversely, the downstream-pull mechanism responds to evolving market demands by aligning with consumer preferences for green products, enhancing brand value, and improving competitiveness. For downstream firms—especially those facing end markets such as automakers and brand owners—sustainability strategies should prioritize green demand responsiveness and market value creation. These firms are more exposed to consumer preferences, regulatory pressures, and public scrutiny, and thus should reinforce green product design, implement environmental responsibility management, and establish transparent disclosure mechanisms. In performing in this way they not only meet sustainability obligations but also shape brand reputation and drive the supply chain’s green transformation through the value chain-pull effect.
This study reveals the differentiated pathways through which upstream “resource-driven source-push mechanisms” and downstream “demand-driven value chain-pull mechanisms” influence corporate sustainability, emphasizing that the development of relational capabilities is highly dependent on continuous interactions with different types of supply chain partners. The upstream mechanism addresses whether sustainability is rooted in resource capabilities, while the downstream mechanism responds to whether sustainability holds market value. Together, these mechanisms form a complementary system across the supply chain, shaping a comprehensive and dynamic sustainable supply chain development framework. These findings offer important practical implications for firms seeking to formulate context-specific sustainability strategies. Moreover, the study enriches the application of the dynamic RBV in the field of sustainable supply chain management and provides both theoretical support and actionable guidance for enhancing inter-organization collaboration during green transformation initiatives. By clarifying how firms can align sustainability strategies with their supply chain roles and stakeholder relationships, this study not only informs corporate practice but also contributes to broader societal goals. Specifically, it supports the development of low-carbon, inclusive, and resource-efficient industrial ecosystems—helping to mitigate environmental degradation, improve public well-being, and promote long-term socio-economic resilience. These contributions resonate with China’s “Dual Carbon” targets and the sustainability priorities of the 14th Five-Year Plan, while reinforcing global commitments to the United Nations Sustainable Development Goals.

5.3. Future Research

This study has several limitations that suggest avenues for future investigation. First, incorporating a wider range of industries and firms would allow researchers to explore patterns and distinctions across different contexts. Given the current focus on Chinese listed companies, the geographic and institutional scope may restrict the broader applicability of the findings. A more heterogeneous sample would enhance the generalizability and robustness of the results. Second, future research could extend the conceptualization of ‘sustainability’ to include dimensions such as organizational culture and employee well-being initiatives. Third, methodological diversification—such as leveraging surveys or stakeholder interviews—could offer deeper insights into firms’ internal digital maturity, the dynamics of supply chain collaboration, and their influence on corporate sustainability performance. Given that China’s institutional environment emphasizes state-led GI and digital infrastructure investment, the generalizability of our findings to markets with different regulatory settings warrants further empirical exploration.

6. Conclusions

This study uses data from Chinese listed manufacturing firms from 2010 to 2023 to examine how DT reshapes supply chain collaboration actors and pathways, thereby influencing CSP through the development of sustainable dynamic capabilities. First, DT positively enhances CSP while strengthening firms’ dynamic collaboration capabilities with external stakeholders.
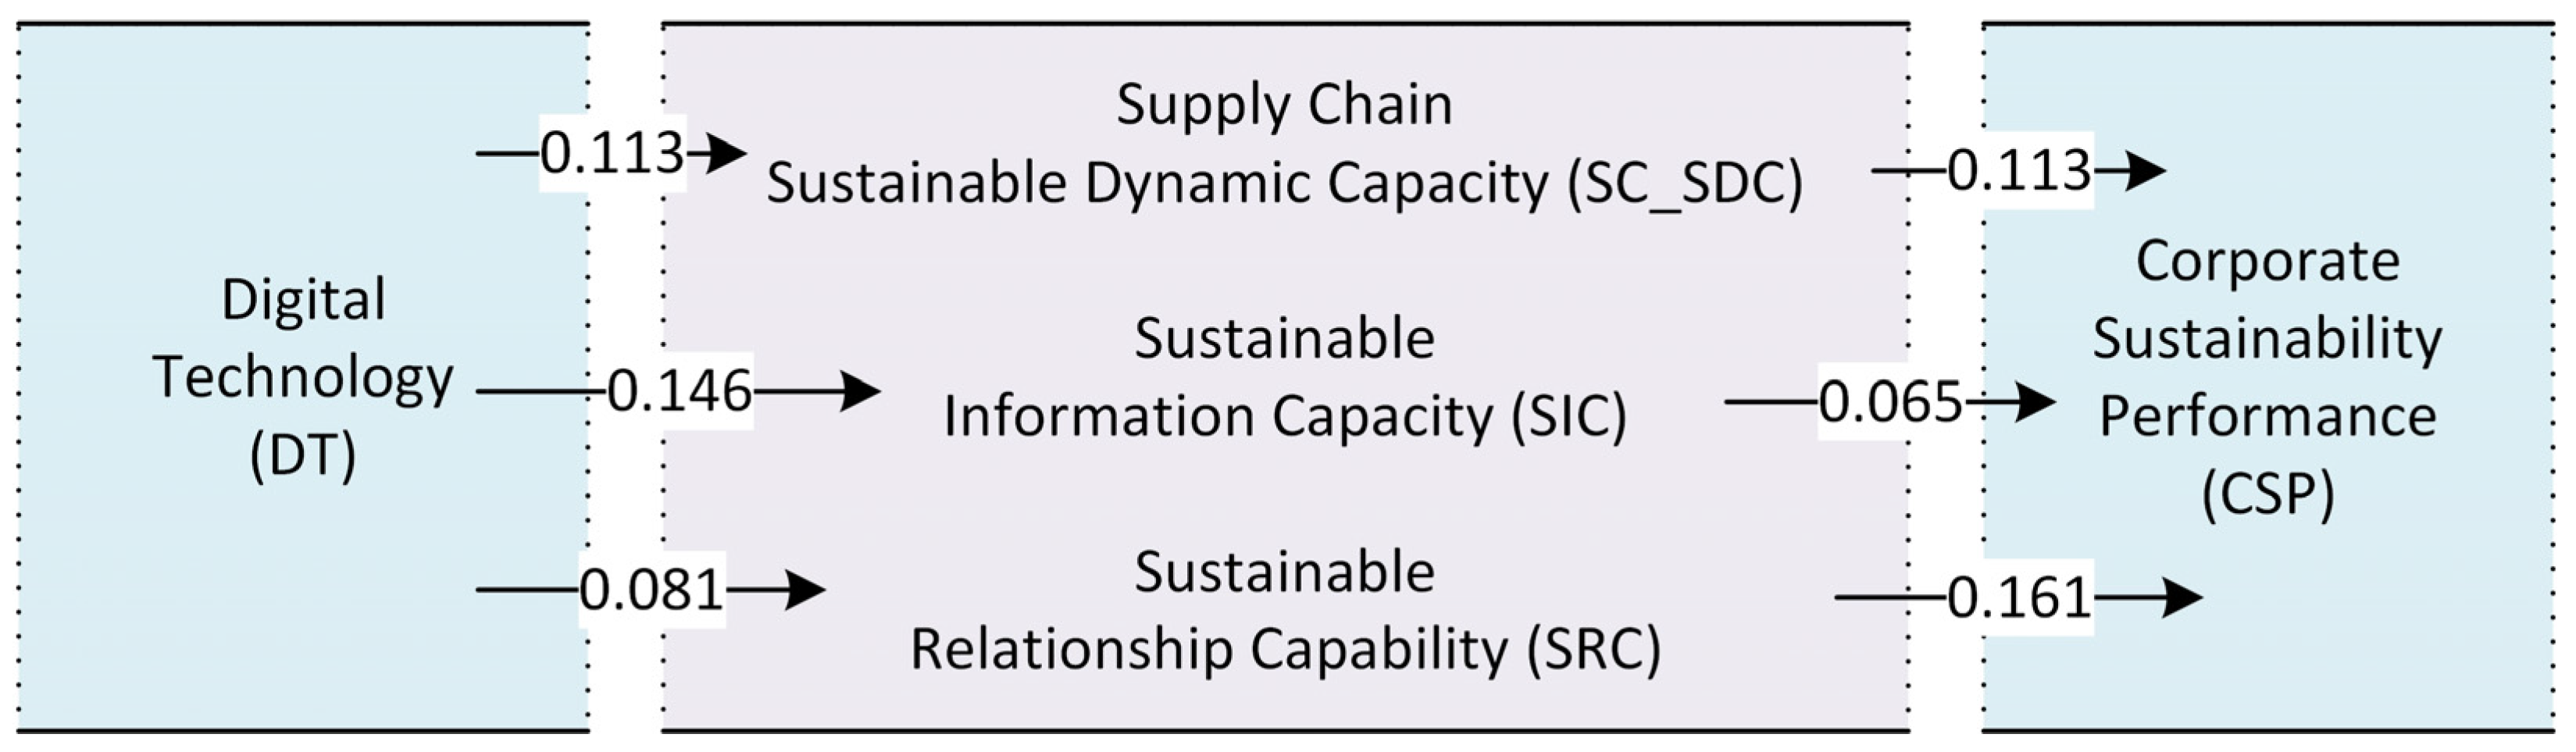
Based on the dynamic resource-based view, this study defines sustainable dynamic capabilities as either SRCs or SICs. The findings indicate that higher levels of DT amplify the impact of these two dynamic capabilities on CSP. Moreover, both capabilities exhibit mediating effects, as DT improves SIC, which subsequently enhances SRC, ultimately influencing CSP. This reveals a complete indirect pathway of DT’s impact on CSP. This reveals a full-chain mediation mechanism through which DT affects strategy, aligning closely with Teece’s (2007) three-stage logic of dynamic capabilities—sensing, seizing, and reconfiguring [70]. Specifically, SIC reflects the firm’s sensing and information integration capacity in response to external forces (e.g., ESG policies, green demand), while SRC captures the ability to reconfigure stakeholder relationships and resource coordination, enabling sustainable performance improvements.
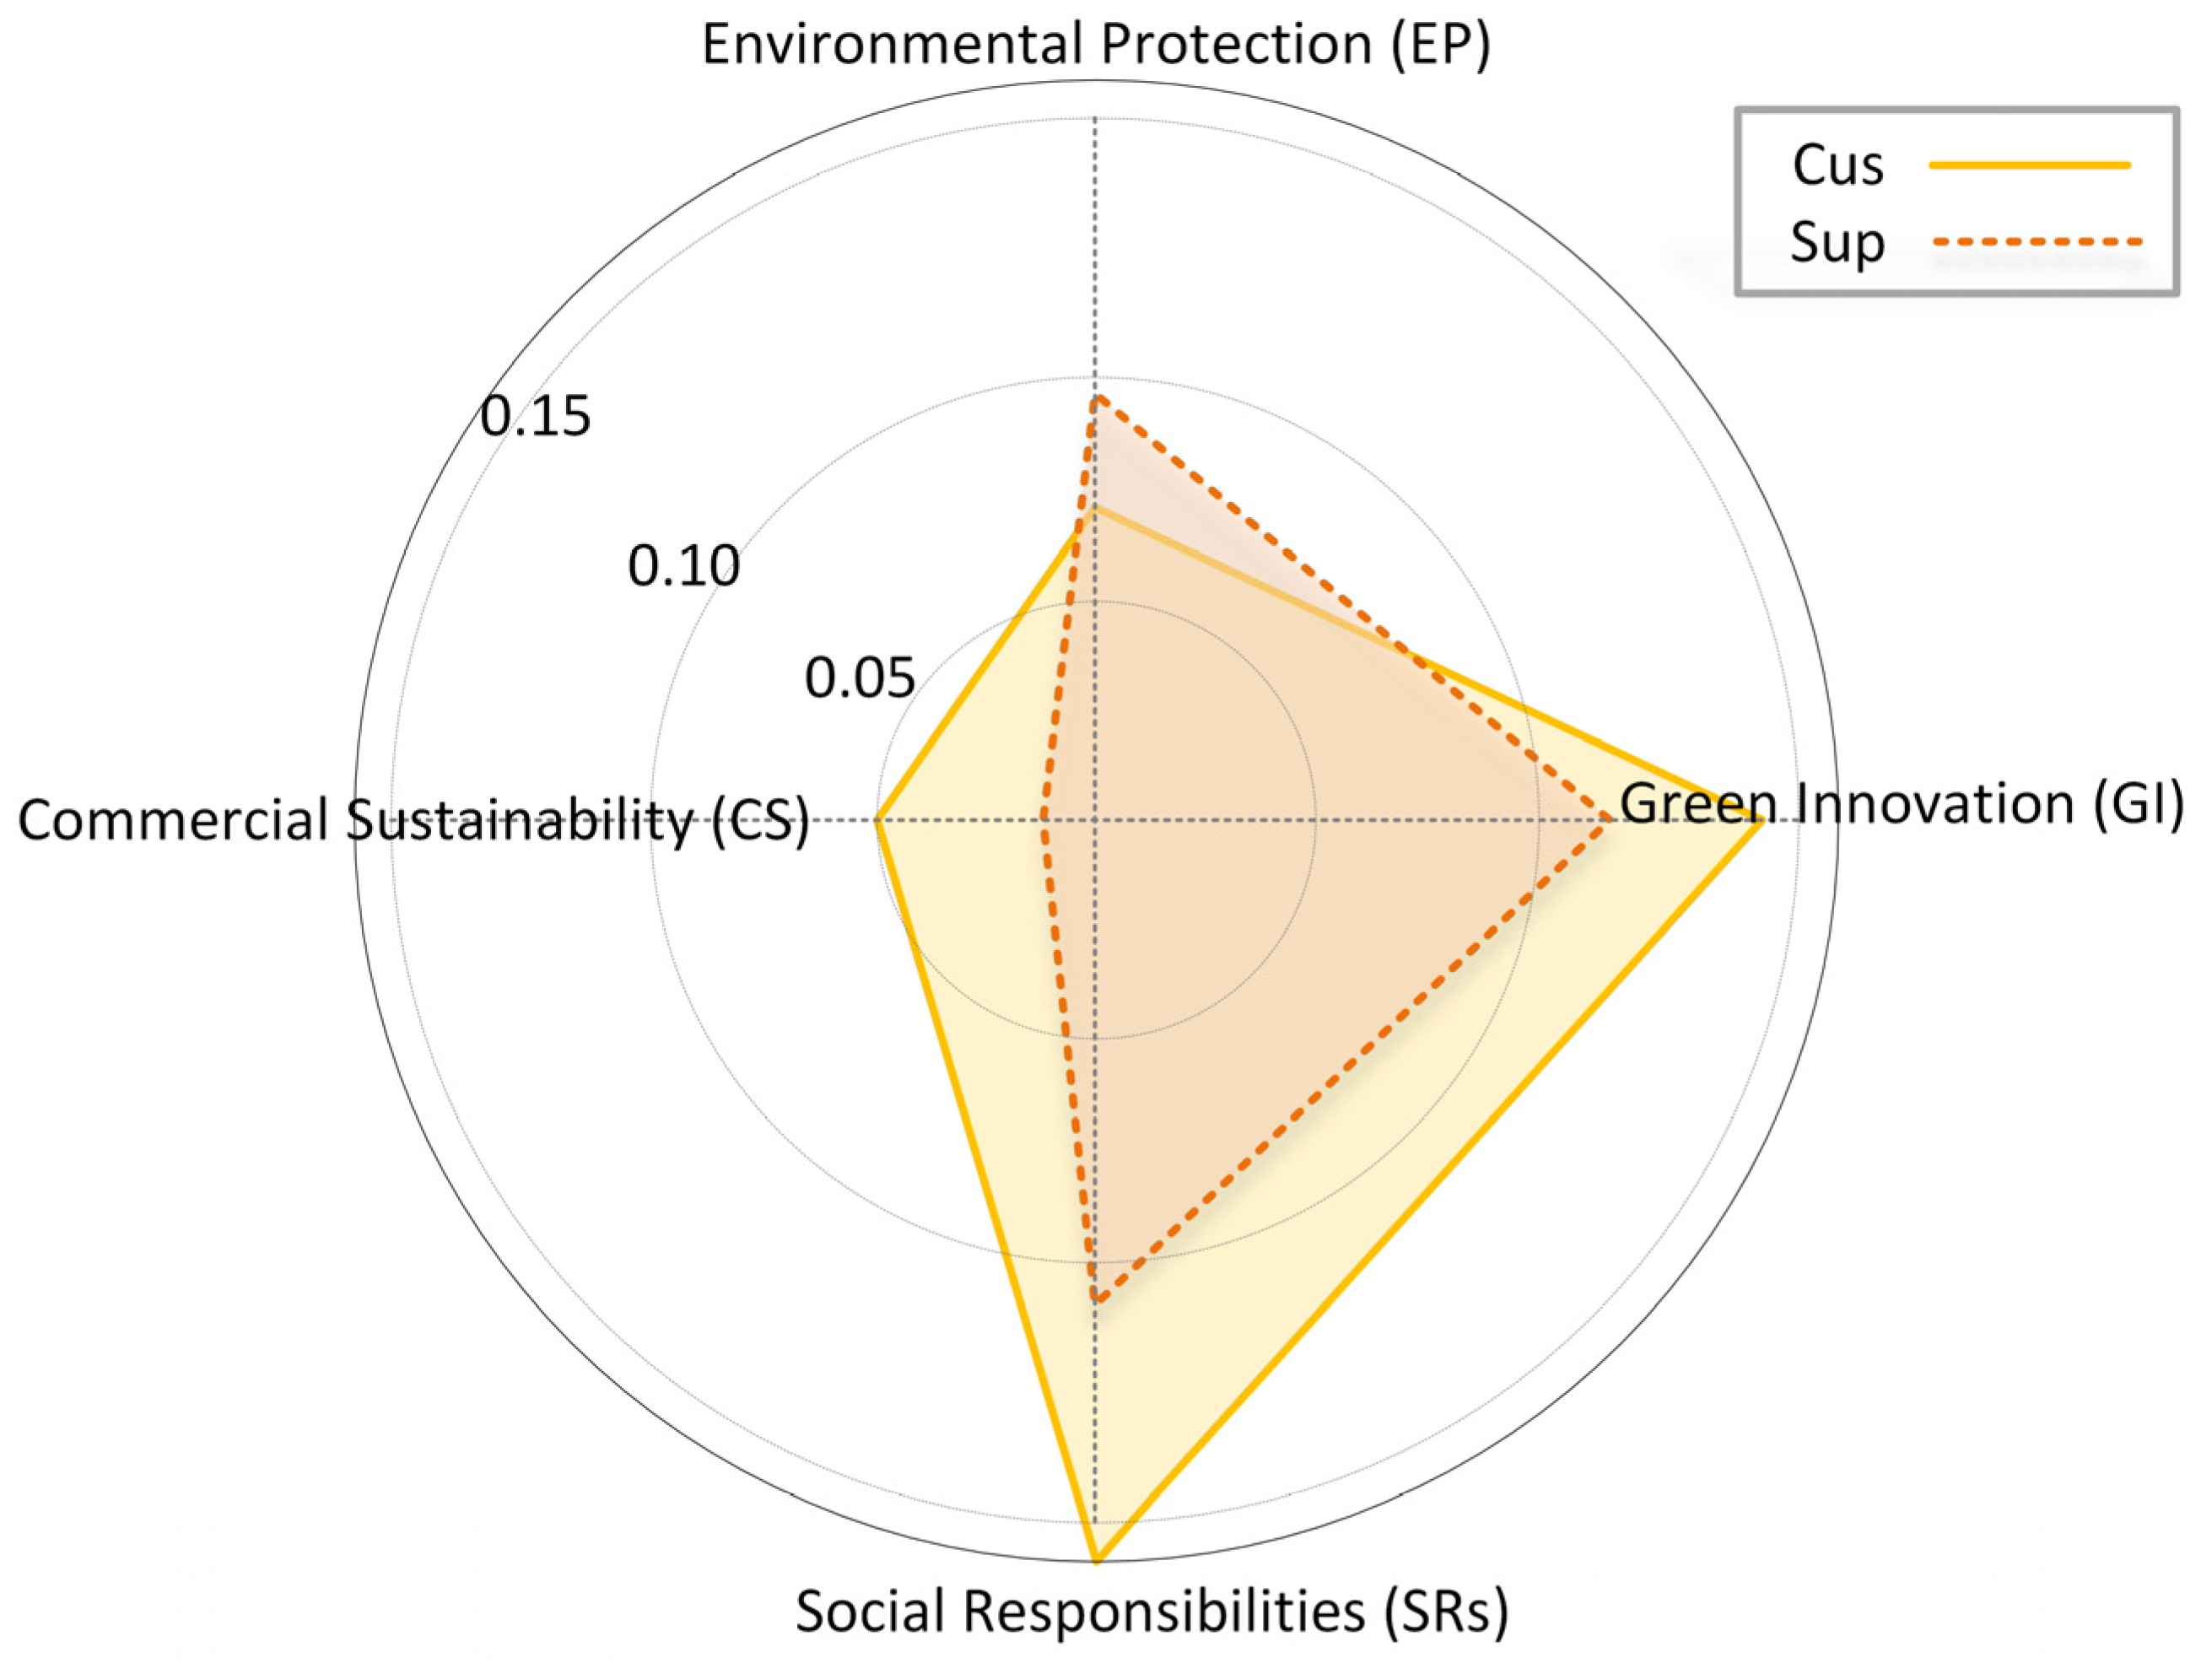
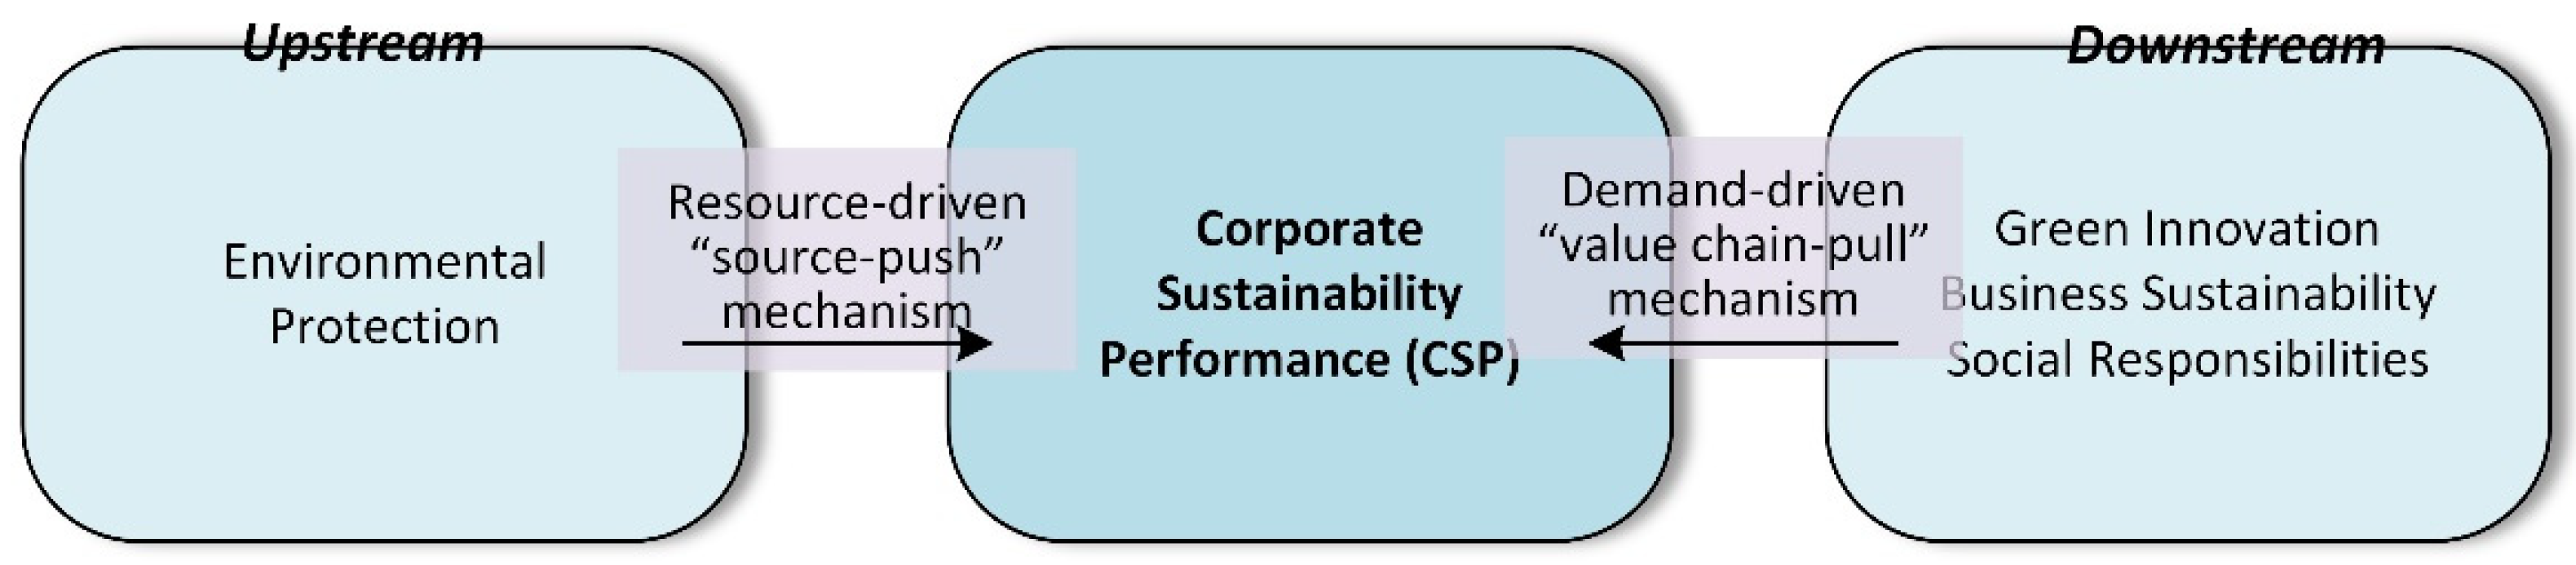
Building on this, the study explores the heterogeneity of actors implementing sustainable strategies. Across four dimensions—green innovation, environmental protection, commercial sustainability, and social responsibility—SC_SDCs exhibit distinct characteristics: resource-driven “source-push” mechanisms and demand-driven “value chain-pull” mechanisms. By examining both upstream inputs and downstream market demands, this study uncovers heterogeneous pathways through which firms develop sustainability-oriented dynamic capabilities across different supply chain stages. This not only extends RBV discussions on resource bundling but also contributes a dynamic perspective to how firms derive competitive advantage from value chain collaboration. It highlights that the transformation of resources into capabilities depends on the evolving dynamics of external networks. The differing focus and practices of firms at various supply chain positions intertwine and complement one another, creating a robust foundation for ensuring sustainability and efficiency across the entire supply chain.
Finally, consistent with stakeholder theory, this study underscores the importance of embedding sustainability strategies within trust-based collaboration with key stakeholders. By constructing a coordination pathway centered on SIC and SRC, the findings demonstrate that firms must recognize and respond to the interests of diverse actors to achieve multidimensional improvements in sustainability performance. This research addresses gaps in the literature by elucidating how different supply chain actors affect focal firms across various sustainability dimensions. It provides valuable insights for firms to tailor and implement targeted, efficient sustainability strategies based on their supply chain position and stakeholder dynamics.

Supplementary Materials

The following supporting information can be downloaded at: https://www.mdpi.com/article/10.3390/su17125524/s1, Table S1: Endogeneity Test; Table S2: Endogeneity test results. Ref. [71] is cited in Supplementary Materials.

Author Contributions

Conceptualization, D.F. and L.Z.; Methodology, D.F.; Software, D.F.; Formal analysis, D.F., H.W. and L.Z.; Writing—original draft, D.F.; Writing—review & editing, H.W. and L.Z.; Supervision, L.Z.; Funding acquisition, H.W. and L.Z. All authors have read and agreed to the published version of the manuscript.

Funding

This research was funded by the National Natural Science Foundation of China, grant number 71974176, and the Shandong Provincial Natural Science Foundation, grant number ZR2022MG061.

Institutional Review Board Statement

Not applicable.

Informed Consent Statement

Not applicable.

Data Availability Statement

Since this dataset is still related to other unpublished work by the authors, it is not currently available for public access online. However, if required during the review process, the authors are willing to provide the dataset upon request.

Conflicts of Interest

The authors declare no conflict of interest.

References

  1. Yang, Z.; Lin, Y. The effects of supply chain collaboration on green innovation performance: An interpretive structural modeling analysis. Sustain. Prod. Consum. 2020, 23, 1–10. [Google Scholar] [CrossRef]
  2. Mondejar, M.E.; Avtar, R.; Diaz, H.L.B.; Dubey, R.K.; Esteban, J.; Gómez-Morales, A.; Hallam, B.; Mbungu, N.T.; Okolo, C.C.; Prasad, K.A.; et al. Digitalization to achieve sustainable development goals: Steps towards a Smart Green Planet. Sci. Total Environ. 2021, 794, 148539. [Google Scholar] [CrossRef] [PubMed]
  3. Ivanov, D.; Dolgui, A.; Sokolov, B. The impact of digital technology and Industry 4.0 on the ripple effect and supply chain risk analytics. Int. J. Prod. Res. 2019, 57, 829–846. [Google Scholar] [CrossRef]
  4. Maqsood, U.S.; Li, Q.; Zahid, R.M.A. Adoption of digital transformation from a firm’s creation to decline: The role of China’s mass entrepreneur and innovation campaign. Financ. Innov. 2025, 11, 66. [Google Scholar] [CrossRef]
  5. Ardolino, M.; Bacchetti, A.; Dolgui, A.; Franchini, G.; Ivanov, D.; Nair, A. The Impacts of digital technologies on coping with the COVID-19 pandemic in the manufacturing industry: A systematic literature review. Int. J. Prod. Res. 2022, 62, 1953–1976. [Google Scholar] [CrossRef]
  6. Salisu, Y.; Abu Bakar, L.J. Technological capability, innovativeness and the performance of manufacturing small and medium enterprises (SMEs) in developing economies of Africa. J. Bus. Manag. 2019, 21, 58. [Google Scholar]
  7. Ahmed, W.; Ashraf, M.S.; Khan, S.A.; Kusi-Sarpong, S.; Arhin, F.K.; Kusi-Sarpong, H.; Najmi, A. Analyzing the impact of environmental collaboration among supply chain stakeholders on a firm’s sustainable performance. Oper. Manag. Res. 2020, 13, 4–21. [Google Scholar] [CrossRef]
  8. Sudusinghe, J.I.; Seuring, S. Supply chain collaboration and sustainability performance in circular economy: A systematic literature review. Int. J. Prod. Econ. 2022, 245, 108402. [Google Scholar] [CrossRef]
  9. Wei, X.; Wei, Q.; Yang, L. Induced green innovation of suppliers: The “green power” from major customers. Energy Econ. 2023, 124, 106775. [Google Scholar] [CrossRef]
  10. Jamalnia, A.; Gong, Y.; Govindan, K. Sub-supplier’s sustainability management in multi-tier supply chains: A systematic literature review on the contingency variables, and a conceptual framework. Int. J. Prod. Econ. 2023, 255, 108671. [Google Scholar] [CrossRef]
  11. Jiang, W.; Wang, K.; Zhou, K.Z. How Political Ties and Green Innovation Co-evolve in China: Alignment with Institutional Development and Environmental Pollution. J. Bus. Ethics 2023, 186, 739–760. [Google Scholar] [CrossRef]
  12. Cheng, P.; Zhang, J.; Chen, J.; Zheng, Y.; Li, Z. Stakeholder attention and ambidextrous green innovation: Evidence from China. Bus. Strategy Environ. 2025, 34, 1007–1026. [Google Scholar] [CrossRef]
  13. Teece, D.J.; Pisano, G.; Shuen, A. Dynamic capabilities and strategic management. Strateg. Manag. J. 1997, 18, 509–533. [Google Scholar] [CrossRef]
  14. Mikalef, P.; Pappas, I.O.; Krogstie, J.; Giannakos, M. Big data analytics capabilities: A systematic literature review and research agenda. Inf. Syst. e-Bus. Manag. 2018, 16, 547–578. [Google Scholar] [CrossRef]
  15. Dalenogare, L.S.; Le Dain, M.-A.; Ayala, N.F.; Pezzotta, G.; Frank, A.G. Building digital servitization ecosystems: An analysis of inter-firm collaboration types and social exchange mechanisms among actors. Technovation 2023, 124, 102756. [Google Scholar] [CrossRef]
  16. Freeman, R.E. Divergent Stakeholder Theory. Acad. Manag. Rev. 1999, 24, 233–236. [Google Scholar] [CrossRef]
  17. Sharma, H.B.; Vanapalli, K.R.; Cheela, V.S.; Ranjan, V.P.; Jaglan, A.K.; Dubey, B.; Goel, S.; Bhattacharya, J. Challenges, opportunities, and innovations for effective solid waste management during and post COVID-19 pandemic. Resour. Conserv. Recycl. 2020, 162, 105052. [Google Scholar] [CrossRef]
  18. Brandon-Jones, E.; Squire, B.; Autry, C.W.; Petersen, K.J. A contingent resource-based perspective of supply chain resilience and robustness. J. Supply Chain Manag. 2014, 50, 55–73. [Google Scholar] [CrossRef]
  19. Barney, J.B. Resource-based theories of competitive advantage: A ten-year retrospective on the resource-based view. J. Manag. 2001, 27, 643–650. [Google Scholar] [CrossRef]
  20. Liao, S.-H.; Hu, D.-C.; Shih, Y.-S. Supply chain collaboration and innovation capability: The moderated mediating role of quality management. Total Qual. Manag. Bus. Excell. 2021, 32, 298–316. [Google Scholar] [CrossRef]
  21. Helfat, C.E.; Peteraf, M.A. The dynamic resource-based view: Capability lifecycles. Strateg. Manag. J. 2003, 24, 997–1010. [Google Scholar] [CrossRef]
  22. Gebhardt, M.; Beck, J.; Kopyto, M.; Spieske, A. Determining requirements and challenges for a sustainable and circular electric vehicle battery supply chain: A mixed-methods approach. Sustain. Prod. Consum. 2022, 33, 203–217. [Google Scholar] [CrossRef]
  23. Sharma, G.D.; Yadav, A.; Chopra, R. Artificial intelligence and effective governance: A review, critique and research agenda. Sustain. Futur. 2020, 2, 100004. [Google Scholar] [CrossRef]
  24. Akhshik, M.; Bilton, A.; Tjong, J.; Singh, C.V.; Faruk, O.; Sain, M. Prediction of greenhouse gas emissions reductions via machine learning algorithms: Toward an artificial intelligence-based life cycle assessment for automotive lightweighting. Sustain. Mater. Technol. 2022, 31, e00370. [Google Scholar] [CrossRef]
  25. Ditillo, A.; Lisi, I.E. Exploring Sustainability Control Systems’ Integration: The Relevance of Sustainability Orientation. J. Manag. Account. Res. 2016, 28, 125–148. [Google Scholar] [CrossRef]
  26. Sharma, S.; Vredenburg, H. Proactive corporate environmental strategy and the development of competitively valuable organizational capabilities. Strateg. Manag. J. 1998, 19, 729–753. [Google Scholar] [CrossRef]
  27. Li, Q.; Maqsood, U.S.; Zahid, R.M.A. Nexus between government surveillance on executive compensation and green innovation: Evidence from the type of state-owned enterprises. Bus. Ethics Environ. Responsib. 2024, 33, 94–112. [Google Scholar] [CrossRef]
  28. Algarni, M.A.; Ali, M.; Albort-Morant, G.; Leal-Rodríguez, A.L.; Latan, H.; Ali, I.; Ullah, S. Make green, live clean! Linking adaptive capability and environmental behavior with financial performance through corporate sustainability performance. J. Clean. Prod. 2022, 346, 131156. [Google Scholar] [CrossRef]
  29. Hebisch, B.; Wild, A.; Herbst, U. The power of alternative suppliers in the automotive industry—A matter of innovation? Ind. Mark. Manag. 2022, 102, 1–11. [Google Scholar] [CrossRef]
  30. Haeri, S.A.S.; Rezaei, J. A grey-based green supplier selection model for uncertain environments. J. Clean. Prod. 2019, 221, 768–784. [Google Scholar] [CrossRef]
  31. Boiral, O.; Raineri, N.; Talbot, D. Managers’ Citizenship Behaviors for the Environment: A Developmental Perspective. J. Bus. Ethics 2018, 149, 395–409. [Google Scholar] [CrossRef]
  32. Feng, D.; Hu, M.; Zhao, L.; Liu, S. The Impact of Firm Heterogeneity and External Factor Change on Innovation: Evidence from the Vehicle Industry Sector. Sustainability 2022, 14, 6507. [Google Scholar] [CrossRef]
  33. Le, T.T.; Vo, X.V.; Venkatesh, V.G. Role of green innovation and supply chain management in driving sustainable corporate performance. J. Clean. Prod. 2022, 374, 133875. [Google Scholar] [CrossRef]
  34. Li, Y.; Hu, M.; Zhao, L. Study on the impact of industrial green development and technological innovation on employment structure. Front. Earth Sci. 2023, 11, 1115476. [Google Scholar] [CrossRef]
  35. Holden, E.; Linnerud, K.; Banister, D. Sustainable development: Our Common Future revisited. Glob. Environ. Change 2014, 26, 130–139. [Google Scholar] [CrossRef]
  36. Jimenez-Jimenez, D.; Martínez-Costa, M.; Sanchez Rodriguez, C. The mediating role of supply chain collaboration on the relationship between information technology and innovation. J. Knowl. Manag. 2019, 23, 548–567. [Google Scholar] [CrossRef]
  37. Li, C.; Zuo, X.; Mohammed, A.S. A new fuzzy-based method for energy-aware resource allocation in vehicular cloud computing using a nature-inspired algorithm. Sustain. Comput. Inform. Syst. 2022, 36, 100806. [Google Scholar] [CrossRef]
  38. Loonam, J.; O’Regan, N. Global value chains and digital platforms: Implications for strategy. Strateg. Change 2022, 31, 161–177. [Google Scholar] [CrossRef]
  39. Ding, L.; Ye, R.M.; Wu, J.-X. Platform strategies for innovation ecosystem: Double-case study of Chinese automobile manufactures. J. Clean. Prod. 2019, 209, 1564–1577. [Google Scholar] [CrossRef]
  40. Whipple, J.M.; Wiedmer, R.; Boyer, K.K. A dyadic investigation of collaborative competence, social capital, and performance in buyer–supplier relationships. J. Supply Chain Manag. 2015, 51, 3–21. [Google Scholar] [CrossRef]
  41. Wiklund, J.; Shepherd, D.A. Practice, The effectiveness of alliances and acquisitions: The role of resource combination activities. Entrep. Theory Pract. 2009, 33, 193–212. [Google Scholar] [CrossRef]
  42. Alvarez, S.A.; Barney, J.B. Discovery and creation: Alternative theories of entrepreneurial action. Strateg. Entrep. J. 2007, 1, 11–26. [Google Scholar] [CrossRef]
  43. Shahzad, M.; Qu, Y.; Rehman, S.U.; Zafar, A.U. Adoption of green innovation technology to accelerate sustainable development among manufacturing industry. J. Innov. Knowl. 2022, 7, 100231. [Google Scholar] [CrossRef]
  44. Wamba, S.F.; Dubey, R.; Gunasekaran, A.; Akter, S. The performance effects of big data analytics and supply chain ambidexterity: The moderating effect of environmental dynamism. Int. J. Product. Econ. 2020, 222, 107498. [Google Scholar] [CrossRef]
  45. Sui, X.; Hu, M.; Wang, H.; Zhao, L. Measurement of Coastal Marine Disaster Resilience and Key Factors with a Random Forest Model: The Perspective of China’s Global Maritime Capital. Water 2022, 14, 3265. [Google Scholar] [CrossRef]
  46. Maqsood, U.S.; Wang, S.; Zahid, R.M.A. Digital age imperatives and firm internal control quality: Evidence from CEOs personal trait and type of state-owned enterprises. Manag. Audit. J. 2024, 39, 700–727. [Google Scholar] [CrossRef]
  47. Maqsood, U.S.; Wang, S.; Li, Q.; Ammar Zahid, R.M. Protect your green line: Foreign residency rights and green innovation. Econ. Lett. 2024, 234, 111442. [Google Scholar] [CrossRef]
  48. Jing, Y.; Hu, M.; Zhao, L. The effect of heterogeneous environmental regulations on the employment skill structure: The system-GMM approach and mediation model. PLoS ONE 2023, 18, e0290276. [Google Scholar] [CrossRef]
  49. Wang, H.; Zhao, L.; Hu, M. The Morbidity of Multivariable Grey Model MGM. Int. J. Differ. Equ. 2017, 2017, 2495686. [Google Scholar] [CrossRef]
  50. Colombari, R.; Geuna, A.; Helper, S.; Martins, R.; Paolucci, E.; Ricci, R.; Seamans, R. The interplay between data-driven decision-making and digitalization: A firm-level survey of the Italian and U.S. automotive industries. Int. J. Prod. Econ. 2023, 255, 108718. [Google Scholar] [CrossRef]
  51. Ha, L.T.; Huong, T.T.L.; Thanh, T.T. Is digitalization a driver to enhance environmental performance? An empirical investigation of European countries. Sustain. Prod. Consum. 2022, 32, 230–247. [Google Scholar] [CrossRef]
  52. Wu, D.; Rosen, D.W.; Wang, L.; Schaefer, D. Cloud-based design and manufacturing: A new paradigm in digital manufacturing and design innovation. Comput.-Aided Des. 2015, 59, 1–14. [Google Scholar] [CrossRef]
  53. Dubey, R.; Gunasekaran, A.; Childe, S.J.; Papadopoulos, T.; Luo, Z.; Wamba, S.F.; Roubaud, D. Can big data and predictive analytics improve social and environmental sustainability? Technol. Forecast. Soc. Change 2019, 144, 534–545. [Google Scholar] [CrossRef]
  54. Kumar, G.; Subramanian, N.; Maria Arputham, R. Missing link between sustainability collaborative strategy and supply chain performance: Role of dynamic capability. Int. J. Prod. Econ. 2018, 203, 96–109. [Google Scholar] [CrossRef]
  55. Scholten, K.; Schilder, S. The role of collaboration in supply chain resilience. Supply Chain Manag. Int. J. 2015, 20, 471–484. [Google Scholar] [CrossRef]
  56. Spieske, A.; Birkel, H.J.C.; Engineering, I. Improving supply chain resilience through industry 4.0: A systematic literature review under the impressions of the COVID-19 pandemic. Comput. Ind. Eng. 2021, 158, 107452. [Google Scholar] [CrossRef]
  57. Zhang, F.; Chen, J.; Zhu, L. How does environmental dynamism impact green process innovation? A supply chain cooperation perspective. IEEE Trans. Eng. Manag. 2021, 70, 509–522. [Google Scholar] [CrossRef]
  58. Krieger, B.; Zipperer, V. Does green public procurement trigger environmental innovations? Res. Policy 2022, 51, 104516. [Google Scholar] [CrossRef]
  59. Kuo, T.-C.; Chen, K.J.; Shiang, W.-J.; Huang, P.B.; Otieno, W.; Chiu, M.-C. A collaborative data-driven analytics of material resource management in smart supply chain by using a hybrid Industry 3.5 strategy. Resour. Conserv. Recycl. 2021, 164, 105160. [Google Scholar] [CrossRef]
  60. Aaker, D.A. Measuring brand equity across products and markets. Calif. Manag. Rev. 1996, 38, 102–120. [Google Scholar] [CrossRef]
  61. Maignan, I.; Ferrell, O.C.; Hult, G.T.M. Corporate citizenship: Cultural antecedents and business benefits. J. Acad. Mark. Sci. 1999, 27, 455–469. [Google Scholar] [CrossRef]
  62. Ferguson, K.T.; Evans, G.W. Social ecological theory: Family systems and family psychology in bioecological and bioecocultural perspective. In Apa Handbook of Contemporary Family Psychology: Foundations, Methods, and Contemporary Issues Across The Lifespan; American Psychological Association: Washington, DC, USA, 2019. [Google Scholar]
  63. Ullah, S.; Nasim, A. Do firm-level sustainability targets drive environmental innovation? Insights from BRICS Economies. J. Environ. Manag. 2021, 294, 112754. [Google Scholar] [CrossRef] [PubMed]
  64. Melander, L. Customer and Supplier Collaboration in Green Product Innovation: External and Internal Capabilities. Bus. Strategy Environ. 2018, 27, 677–693. [Google Scholar] [CrossRef]
  65. Metwally, A.B.; Ali, H.A.; Aly, S.A.; Ali, M.A. The Interplay Between Digital Technologies, Supply Chain Resilience, Robustness and Sustainable Environmental Performance: Does Supply Chain Complexity Matter? Sustainability 2024, 16, 6175. [Google Scholar] [CrossRef]
  66. Chuah, S.H.-W.; El-Manstrly, D.; Tseng, M.-L.; Ramayah, T. Sustaining customer engagement behavior through corporate social responsibility: The roles of environmental concern and green trust. J. Clean. Prod. 2020, 262, 121348. [Google Scholar] [CrossRef]
  67. Wang, J.; Zhu, L.; Feng, L.; Feng, J. A meta-analysis of sustainable supply chain management and firm performance: Some new findings on sustainable supply chain management. Sustain. Prod. Consum. 2023, 38, 312–330. [Google Scholar] [CrossRef]
  68. Peron, M.; Panza, L.; Demiralay, E.; Talluri, S. Additive Manufacturing for Spare Parts Management: Is Decentralized Production Always Environmentally Preferable? IEEE Trans. Eng. Manag. 2025, 72, 634–650. [Google Scholar] [CrossRef]
  69. Kähkönen, A.-K.; Marttinen, K.; Kontio, A.; Lintukangas, K. Practices and strategies for sustainability-related risk management in multi-tier supply chains. J. Purch. Supply Manag. 2023, 29, 100848. [Google Scholar] [CrossRef]
  70. Teece, D.J. Explicating dynamic capabilities: The nature and microfoundations of (sustainable) enterprise performance. Strateg. Manag. J. 2007, 28, 1319–1350. [Google Scholar] [CrossRef]
  71. Li, Y.; Dai, J.; Cui, L. 'The impact of digital technologies on economic and environmental performance in the context of industry 4.0: A moderated mediation model. Int. J. Prod. Econ. 2020, 229, 107777. [Google Scholar] [CrossRef]
Figure 1. The proposed theoretical model.
Sustainability 17 05524 g001
Figure 2. The baseline regression results.
Sustainability 17 05524 g002
Figure 3. The impact of sustainable relationship capabilities with suppliers and customers on CSP.
Sustainability 17 05524 g003
Figure 4. The impact pathway of SRC on CSP.
Sustainability 17 05524 g004
Table 1. Description of variables.
Corporate Sustainability Performance (CSP)
DimensionCategoriesVariable Item
Green InnovationGreen innovation.GI
Environmental ProtectionEnvironmental emissions disclosure.EP
Environmental management costs.
Commercial SustainabilitySustainability reporting guidelines.CS
Environmental sustainability disclosure.
Social ResponsibilitiesPublic relations and social service.SR
System construction.
Social donations.
Digital technology The data structure of digital technology includes the following five dimensions: big data technology, block chain, artificial intelligence, digital technology applications, and cloud computing.DT
Supply chain sustainable dynamic capability (SC_SDC)
Supply chain sustainable information capacityAverage digitization level of the top five ranked supply chain and customer relationships.SIC
Supply chain sustainable relationship capabilityAverage sustainable development performance of the top five ranked supply chain and customer relationships.SRC
Control variables
Return on net assetsThe ratio of net income to the total assets.ROE
Cash FlowNet cash flow.CF
Earnings per shareBusiness profitability.EPS
Assets and liabilitiesAssets and Liabilities.AL
Operating Income Sales revenue/total shares. OIP
TaxesCorporate income tax.TAX
Table 2. Correlation coefficients and multicollinearity test.
Panel A Correlation Coefficients
CSPDTROECFEPSALEMOIP
CSP 0.020.13 ***0.010.06 ***0.30 ***0.30 ***0.04 **
DT0.03 * 0.04 **0.020.010.020.020.07 ***
ROE0.09 ***0.04 ** 0.28 ***0.76 ***0.09 ***0.09 ***0.15 ***
CF0.020.010.20 *** 0.23 ***0.22 ***0.22 ***0.05 **
EPS0.04 **0.000.65 ***0.24 *** 0.21 ***0.21 ***0.09 ***
AL0.20 ***−0.04 **0.12 ***−0.16 ***−0.20 *** 1.00 ***0.07 ***
EM0.18 ***−0.020.21 ***−0.14 ***−0.23 ***0.85 *** 0.07 ***
OIP0.02−0.07 ***0.17 ***0.05 ***0.14 ***0.04 *0.02
Panel B Multicollinearity Test
CSPDTROECFEPSALOIPTAX
Variance inflation factor1.161.011.841.011.923.753.761.12
Tolerance0.86900.98950.54260.98950.52110.26640.26590.8914
Note: *, ** and *** denote significance at the 10%, 5%, and 1% levels, respectively.
Table 3. Digital technology and corporate sustainability performance.
(1)(2)(3)(4)
CSPSC_SDCSICSRC
DT0.078 ***0.113 ***0.146 ***0.081 **
(0.012)(0.005)(0.022)(0.043)
ROE0.317 ***0.318 ***0.341 **0.339 ***
(0.095)(0.111)(0.163)(0.127)
CF0.1310.1310.1280.124
(0.081)(0.073)(0.084)(0.083)
EPS0.056 *0.0780.0710.066
(0.032)(0.061)(0.080)(0.052)
AI0.114 ***0.240 ***0.232 ***0.221 ***
(0.003)(0.025)(0.066)(0.079)
OIP−0.060−0.053−0.049−0.062
(0.005)(0.100)(0.100)(0.100)
TAX−0.012−0.027−0.042−0.038
(0.034)(0.063)(0.064)(0.064)
_cons0.2390.3430.4550.341
(0.215)(0.709)(0.731)(0.754)
Firm/Industry/YearYESYESYESYES
N27,66027,66027,66027,660
r20.0260.0230.0280.022
Note: *, ** and *** denote significance at the 10%, 5%, and 1% levels.
Table 4. The impact of digital technology on supply chain sustainable dynamic capabilities.
(1)(2)(3)(4)(5)(6)
CSPCSPCSPCSPCSPCSP
SC_SDC0.113 ***0.067 ***
(0.014)(0.009)
DT 0.053 *** 0.059 *** 0.025 ***
(0.007) (0.017) (0.009)
SC_SDC × DT 0.017 ***
(0.003)
SIC 0.065 ***0.036 **
(0.022)(0.018)
SIC × DT 0.019 ***
(0.003)
SRC 0.161 ***0.141 ***
(0.028)(0.009)
SRC × DT 0.019 ***
(0.002)
ROE−0.214 ***−0.087 ***−0.3120.024−0.460 ***−0.324 ***
(0.063)(0.008)(0.262)(0.043)(0.056)(0.075)
EPS−0.034 ***−0.021 ***−0.023−0.025−0.035 **−0.038 **
(0.012)(0.026)(0.021)(0.020)(0.015)(0.015)
OIP0.0240.028 *0.0060.0080.0340.035
(0.020)(0.014)(0.023)(0.022)(0.037)(0.038)
TAX−0.015−0.005−0.0200.018−0.005−0.004
(0.038)(0.029)(0.044)(0.043)(0.062)(0.060)
CF−0.146 **−0.185−0.163 **−0.173 **−0.117−0.137
(0.069)(0.163)(0.068)(0.067)(0.137)(0.140)
AL−0.161 ***−0.082−0.052−0.048−0.276 ***−0.271 ***
(0.036)(0.121)(0.033)(0.031)(0.071)(0.072)
_cons3.579 ***−3.173 **2.710 ***2.312 ***4.591 ***4.513 ***
(0.490)(0.067)(0.448)(0.427)(0.913)(0.919)
Firm/Industry/Year YESYESYESYESYESYES
N27,66027,66027,66027,66027,66027,660
r20.0770.0870.0410.0360.1330.151
Note: *, ** and *** denote significance at the 10%, 5%, and 1% levels.
Table 5. Intermediation effect.
Indirect Effects β[LLCI|ULCI]Significance
DTSC_SDCCSP0.013[0.0011|0.019]Yes
DTSICCSP0.021[0.028|0.031]Yes
DTSRCCSP−0.005[−0.008|−0.003]Yes
DTSICSRC0.007[0.003|0.008]Yes
SICSRCCSP0.138[0.104|0.180]Yes
DTSICSRCCSP
Table 6. The impact of supply chain green innovation and environmental protection relationship capability on corporate sustainable development performance, moderated by digital technology.
(1)(2)(3)(4)(5)(6) (7)(8)(9)(10)(11)(12)
GIGIGIGIGIGI EPEPEPEPEPEP
SRC_GI0.132 ***0.135 *** SRC_EP0.064 ***0.042 ***
(0.033)(0.019) (0.015)(0.014)
SRC_GI × DT 0.002 *** SRC_EP × DT 0.201 ***
(0.000) (0.020)
DT 0.003 0.015 * 0.001DT 0.004 *** 0.004 *** 0.003 ***
(0.009) (0.007) (0.003) (0.000) (0.000) (0.000)
CUS_SRC_GI 0.138 ***0.157 *** CUS_SRC_EP 0.058 ***0.051 ***
(0.013)(0.034) (0.018)(0.007)
CUS_SRC_GI × DT 0.006 * CUS_SRC_EP × DT 0.193 ***
(0.003) (0.033)
SUP_SRC_GI 0.118 ***0.112 ***SUP_SRC_EP 0.074 ***0.048 ***
(0.038)(0.039) (0.025)(0.021)
SUP_SRC_GI × DT 0.001 ***SUP_SRC_EP × DT 0.180 ***
(0.000) (0.023)
ROE0.068 ***0.069 ***0.055 ***0.058 ***0.081 ***0.080 ***ROE−0.007 **−0.006 **−0.007 *−0.006 *−0.006−0.006
(0.010)(0.010)(0.015)(0.015)(0.015)(0.007) (0.003)(0.003)(0.004)(0.004)(0.006)(0.004)
EPS0.005 **0.005 **0.007 *0.007 *0.004 *0.001EPS−0.001−0.000−0.001−0.000−0.000−0.000
(0.002)(0.002)(0.004)(0.004)(0.002)(0.007) (0.001)(0.000)(0.001)(0.001)(0.001)(0.000)
OIP0.013 ***0.013 ***0.014 ***0.013 ***0.013 ***0.020 **OIP0.0010.0010.0010.0020.0010.001
(0.002)(0.002)(0.003)(0.003)(0.003)(0.008) (0.001)(0.001)(0.001)(0.001)(0.001)(0.001)
TAX0.034 ***0.035 ***0.025 *0.026 *0.047 ***0.007TAX−0.002−0.003 *−0.004−0.003−0.000−0.002
(0.010)(0.011)(0.013)(0.014)(0.016)(0.005) (0.002)(0.002)(0.002)(0.002)(0.003)(0.002)
CF0.033 ***0.033 ***0.021 *0.020 *0.048 ***0.027CF0.0050.0040.0050.0040.0050.005
(0.009)(0.009)(0.011)(0.011)(0.013)(0.118) (0.003)(0.003)(0.005)(0.005)(0.004)(0.003)
AL−0.001−0.000−0.001−0.0000.0000.001AL0.005 ***0.003 ***0.007 ***0.005 ***0.003 *0.001
(0.004)(0.004)(0.005)(0.005)(0.005)(0.005) (0.001)(0.001)(0.002)(0.002)(0.002)(0.001)
_cons−0.065−0.0740.0830.060−0.241 **−0.239 **_cons−0.0000.015−0.0040.0090.0020.020
(0.077)(0.077)(0.096)(0.097)(0.109)(0.110) (0.020)(0.017)(0.026)(0.025)(0.031)(0.023)
Firm/Industry/YearYesYesYesYesYesYesFirm/Industry/YearYesYesYesYesYesYes
N27,66027,66022,32022,32022,32022,320N27,66027,66022,32022,32022,32022,320
r20.1510.1440.1360.1560.1970.192r20.0420.2870.0650.1510.0870.401
Note: *, ** and *** denote significance at the 10%, 5%, and 1% levels.
Table 7. The influence of supply chain business sustainability and social responsibility relationship capability on corporate sustainable development performance, moderated by digital technology.
(13)(14)(15)(16)(17)(18) (19)(20)(21)(22)(23)(24)
BSBSBSBSBSBS SRSRSRSRSRSR
SRC_BS0.0310.031 SRC_SR0.152 **0.124 **
(0.023)(0.020) (0.691)(0.056)
SRC_BS × DT 0.134 *** SRC_SR × DT 0.126 ***
(0.009) (0.008)
DT 0.036 *** 0.053 *** 0.022 ***DT 0.083 *** 0.241 *** 0.076 ***
(0.011) (0.010) (0.003) (0.010) (0.081) (0.011)
CUS_SRC_BS 0.038 **0.036 * CUS_SRC_SR 0.148 ***0.109 **
(0.018)(0.021) (0.013)(0.047)
CUS_SRC_BS × DT 0.149 *** CUS_SRC_SR × DT 0.129 ***
(0.029) (0.008)
SUP_SRC_BS 0.0060.004SUP_SRC_SR 0.103 ***0.004
(0.013)(0.028) (0.009)(0.113)
SUP_SRC_BS × DT 0.125 ***SUP_SRC_SR × DT 0.195 ***
(0.008) (0.021)
ROE−0.063 ***−0.035 ***−0.014−0.012−0.123 ***−0.075 ***ROE−0.182 ***−0.091 **−0.006−0.011−0.397 ***−0.240 ***
(0.014)(0.011)(0.015)(0.014)(0.022)(0.014) (0.050)(0.037)(0.050)(0.051)(0.078)(0.046)
EPS−0.004−0.0030.001−0.001−0.006−0.004EPS−0.036 ***−0.026 ***−0.020−0.017−0.043 ***−0.031 ***
(0.003)(0.003)(0.005)(0.005)(0.004)(0.004) (0.009)(0.009)(0.016)(0.016)(0.012)(0.010)
OIP0.0070.0020.0040.0020.0090.002OIP0.027 *0.0130.0080.0080.0410.020
(0.006)(0.005)(0.006)(0.006)(0.011)(0.008) (0.015)(0.013)(0.017)(0.017)(0.030)(0.023)
TAX0.0020.0030.0080.014−0.005−0.017TAX−0.044−0.030−0.0130.005−0.085 *−0.095 **
(0.011)(0.010)(0.012)(0.011)(0.020)(0.015) (0.030)(0.028)(0.032)(0.033)(0.051)(0.042)
CF−0.040 **−0.036 **−0.040 **−0.036 **−0.042−0.037CF−0.125 **−0.114 **−0.140 **−0.116 **−0.102−0.101
(0.018)(0.015)(0.016)(0.015)(0.035)(0.029) (0.055)(0.047)(0.055)(0.051)(0.107)(0.087)
AL−0.050 ***−0.032 ***−0.022 ***−0.021 ***−0.078 ***−0.044 ***AL−0.148 ***−0.087 ***−0.049 *−0.037−0.254 ***−0.142 ***
(0.010)(0.007)(0.008)(0.007)(0.019)(0.014) (0.029)(0.022)(0.025)(0.024)(0.057)(0.040)
_cons0.941 ***0.719 ***0.636 ***0.577 ***1.311 ***0.980 ***_cons3.021 ***2.322 ***1.984 ***1.584 ***4.226 ***3.329 ***
(0.128)(0.102)(0.122)(0.114)(0.233)(0.169) (0.401)(0.356)(0.381)(0.364)(0.728)(0.601)
Firm/Industry/YearYesYesYesYesYesYesFirm/Industry/YearYesYesYesYesYesYes
N27,66027,66022,32022,32022,32022,320N27,66027,66022,32022,32022,32022,320
r20.0390.1960.0190.0610.0720.314r20.0360.2210.0130.0760.0750.329
Note: *, ** and *** denote significance at the 10%, 5%, and 1% levels.
Disclaimer/Publisher’s Note: The statements, opinions and data contained in all publications are solely those of the individual author(s) and contributor(s) and not of MDPI and/or the editor(s). MDPI and/or the editor(s) disclaim responsibility for any injury to people or property resulting from any ideas, methods, instructions or products referred to in the content.

