Article

Level of Service Criteria for Urban Arterials with Heterogeneous and Undisciplined Traffic Streams

1
Institute for Transport Studies, University of Leeds, Leeds LS2 9JT, UK
2
Department of Civil, Construction and Environmental Engineering, Iowa State University, Ames, IA 50011, USA
3
Department of Transportation Engineering and Mobility, University of Naples Federico II, 80125 Naples, Italy
4
College of Technological Innovation, Zayed University, Dubai 144534, United Arab Emirates
5
Transportation Research Institute (IMOB), Hasselt University, 3500 Hasselt, Belgium
*
Authors to whom correspondence should be addressed.
Sustainability 2025, 17(11), 5126; https://doi.org/10.3390/su17115126
Submission received: 2 April 2025 / Revised: 27 May 2025 / Accepted: 27 May 2025 / Published: 3 June 2025

Abstract

:
Accurate evaluation of the prevailing traffic operations plays an important part in developing sustainable transport systems. This research examines the suitability of the level of service (LOS) criteria developed by the Indian and United States (US) Highway Capacity Manuals (HCM) for heterogeneous and undisciplined traffic streams and proposes new criteria using a data-driven approach. Traffic data were collected from a selected major arterial in Karachi, and fundamental diagrams were developed using these data. These fundamental diagrams and field-collected data were analyzed using the K-mean clustering approach to examine the actual traffic states at various LOS bands used in practice. Associating the field-measured volume-to-capacity ratio with the speed bands used for LOS analysis gives insights into actual traffic conditions at various LOS categories. The research shows that the volume-to-capacity ratio corresponding to the speed range for LOS A is about 0.45, which implies that the heterogeneous traffic moves with comparatively higher speeds despite an increase in traffic volume. The criteria for LOS were developed using the K-mean cluster analysis technique. The proposed values of LOS criteria for speed percentages are significantly higher than those reported in both the HCMs. This research highlights the need to develop separate LOS criteria for heterogeneous and undisciplined traffic for all transportation facilities. The development of such new criteria can provide researchers and engineers with a schematic for the effective and realistic evaluation of local traffic regimes.

1. Introduction

1.1. Background

The level of service (LOS) is the most significant evaluation parameter for measuring the operational characteristics and conditions of any transportation facility [1,2]. The higher travel demand on transportation facilities necessitates a proper evaluation of the system’s performance based on the level of satisfaction among transport users and the service provided [3,4]. LOS is widely used in practice to evaluate existing performance, prioritize facilities for improvement, measure improvement, and establish criteria for traffic impact studies of new infrastructure projects [5]. The level of service has been considered the best parameter for measuring the serviceability of a transportation facility based on its existing capacity, operating conditions, and user experience. It helps engineers and planners select appropriate improvement strategies from a set of available alternatives [6,7].
The Highway Capacity Manual (HCM) offers methods and techniques for evaluating the operations of various road types, including freeways, highways, and urban arterials. The HCM has been updated periodically to incorporate changes in the transportation system and advances in research and evaluation methodologies. HCM 1965 introduced the term level of service based on travel time and traffic flow vs. capacity ratio with six categories from LOS A to LOS F for highways. Other parameters, such as speed and density for different road types, were incorporated into the subsequent version, i.e., HCM 1985 [8]. In HCM 2000, the level of service is described as quality of service, encompassing not only quantitative but also qualitative measures, such as comfort and convenience. For HCM 2010, the inclination has been drawn toward the qualitative measures based on the user’s assessment rather than just describing the level of service based on the speed or flow of the roadway [9]. The percentage of free-flow speed for estimating travel speed and determining the level of service for urban arterials has been updated in the most recent HCM 2022 [10].
The LOS for road transportation facilities is measured using different traffic flow parameters. Some of the most commonly used service measures include speed, travel time, freedom to maneuver, traffic interruptions, comfort, and convenience experienced by passengers and drivers [11,12]. For instance, the LOS of multilane highways and freeways is measured through traffic density, which depends on the free flow speed and geometric features of the road. The LOS of urban arterials depends on various factors, including the travel speed and the functional category of urban arterials. Similarly, the delay is taken as the parameter to estimate LOS for signalized intersections and roundabouts. HCM describes the methodologies to determine the level of service for all types of roads and intersections [5,13].
Urban arterials are designed to accommodate a diverse range of vehicle types and users, including cars, motorcycles, heavy vehicles, transit, and pedestrians [14]. Furthermore, the traffic flow on urban arterials is modeled as an interrupted flow because of the presence of signalized intersections [15]. Due to their complex design features and characteristics, the level of service of these roads depends not only on traffic flow parameters but also on the geometric and functional classification of the urban street [5,16]. The well-defined classification of urban arterials in HCM 2000 and subsequent versions describes the LOS estimation procedures for standard traffic streams, which consist mainly of cars that follow lane discipline [17]. The higher number of traffic signals, poor signal timings, and increased traffic demand on arterials significantly affect the prevailing level of service [18].
In many developing countries, traffic flow dynamics differ significantly from standard traffic streams due to heterogeneous traffic with weak lane discipline [19,20]. Various studies have highlighted the need to model heterogeneous and undisciplined traffic differently and have developed traffic flow models to accommodate this type of traffic [21,22,23,24]. The complexity of measuring the level of service also increases for such traffic conditions [25]. The factors and methodologies described in the HCM are based on the traffic flow dynamics and geometric road features observed for standard traffic streams in the developed world. The significantly different nature of traffic in developing countries demands establishing the LOS using criteria that account for the dynamics of heterogeneous and undisciplined traffic streams.

1.2. LOS Standards and Heterogeneous Traffic Realities

The literature reports that variations in traffic flow dynamics affect the LOS estimation criteria and, therefore, warrant modification of this approach to incorporate local traffic flow dynamics. Akçelik [26] studied and compared the roundabout capacity and level of service provided by the US HCM with those of roundabouts in Australia and the United Kingdom using the Signalized and Unsignalized Intersection Design and Research Aid (SIDRA Intersection) software. It concluded that using the driver behavior model is critical in evaluating capacity and level of service for roundabouts, as roundabouts in the United States hold significantly less capacity than those in Australia and the United Kingdom. Due to this issue, the thresholds provided by the US HCM are not adequate. Similarly, another study highlighted differences in the intersections in Australia that are not incorporated by the US HCM [27]. Othayoth and Rao [28] developed thresholds for the level of service of signalized intersections, considering heterogeneous traffic conditions in India. Marisamynathan and Vedagiri [29] observed and formulated a model for pedestrians’ level of service at signalized intersections using real-time data and statistical models.
Some countries have developed their local highway capacity manuals, tailored to local traffic conditions and characteristics. For example, the Indian HCM describes the level of service for urban streets based on threshold values of volume-to-capacity ratios and the percentage of free-flow speed [30,31,32]. In contrast, the US HCM defines the travel speed for evaluating LOS for urban streets as shown in Table 1. Manzoor and Dar [33] calculated the level of service for three urban roads in India using the volume-to-capacity ratio during different periods, specifically for peak and non-peak periods. Patnaik [34] observed that the speed ranges for Indian urban streets vary significantly compared to those in the United States. Therefore, the speed ranges and level of service criteria for each urban street class for HCM 2000 were recalculated based on the local scenario in India. Maitra, Sikdar, and Dhingra [35] observed and evaluated congestion levels of three different roads in India and proposed ten classes for the level of service. The calibrated models were prepared to determine congestion and service levels at various traffic and service volumes, respectively. Marwah and Singh [36] considered multiple parameters, including journey speed, density, and road occupancy, to suggest four classes of service levels. Rahimi, Vala, and Patel [37] found that the width of the roadway affects the level of service.
In addition to India, China and some other countries have also introduced their local HCM versions. Ping, John [38] concluded that the US Highway Capacity Manual does not adequately address the extreme geometric and driving conditions of roads in China and should be adjusted based on local scenarios. The Chinese manual is limited to evaluating highways and freeways. It used the proportion of volume and capacity as the primary indicator of the level of service, along with a second indicator: the driving speed relative to the free-flow speed of passenger cars [39]. To evaluate the performance of urban roads in Indonesia, the environmental conditions, along with geometric and traffic stream conditions, are also considered. The adjustment factors for base capacity, carriageway width, shoulder, median, directional split, side friction, city size, capacity, degree of saturation, travel speed, and journey time were considered as the parameters that affect the performance of arterials [40]. The traffic density is considered a performance measure for major urban street segments in Germany. According to the German Highway Capacity Manual, the level of service is influenced by both signalized and non-signalized intersections, as well as transit facilities, in Germany [41].

1.3. Objectives and Contributions

Our review of the literature reveals that quantitative parameters for standard traffic streams differ significantly from those used in heterogeneous traffic conditions. Recognizing this, countries like India and China have developed localized manuals to address their unique traffic dynamics. This study makes three key contributions to the literature:
  • Critical Evaluation and Gap Identification (diagnostic rigor): We systematically examine existing level of service (LOS) criteria for heterogeneous traffic, identifying critical deficiencies in current methodologies (e.g., overreliance on homogeneous traffic assumptions). Our analysis demonstrates that volume-to-capacity ratio threshold values are (more than 40%) higher for LOS A and B
  • Data-Driven LOS Framework (methodological innovation): We propose novel, empirically grounded criteria using modeling and statistical techniques, validated through field-collected data. Our approach leverages fundamental diagrams to derive accurate free-flow speeds and capacity values, ensuring LOS categories reflect real-world heterogeneous traffic behavior. Our validation shows a 30% higher accuracy for capacity estimation in comparison to HCM’s lane-based metrics (Section 3.2)
  • Cross-Standard Synthesis & Proposal (Practical synthesis): We evaluate the suitability of U.S. (HCM) and Indian (Indo-HCM) standards for undisciplined traffic streams and introduce a revised LOS criterion that correlates volume-to-capacity ratios with speed bands, offering actionable insights for infrastructure planning. Fundamental diagram-derived thresholds enable cities to calibrate LOS standards using local traffic data, avoiding costly HCM modifications.
To our knowledge, this is the first study to integrate fundamental diagrams with LOS analysis for heterogeneous traffic, bridging the gap between theoretical standards and empirical observations. Our findings aim to inform policy updates and adaptive traffic management in similar contexts.
The rest of the article is arranged as follows: Section 2 presents the detailed methodology of the research. Section 3 describes the study’s results and findings, which are briefly discussed in Section 4. Section 5 concludes and makes recommendations for future research.

2. Methodology

This research utilizes a fundamental diagram-based approach to evaluate and develop the criteria for LOS estimation. The free-flow speed and capacity flow rates are determined from fundamental diagrams. The field data collected from a selected major arterial road are used in this study. The volume-to-capacity ratio and speed percentiles were estimated using the data collected from the field. The first subsection explains the methodology of data collection and the extraction process, focusing on traffic flow parameters required for LOS analysis. Section 2.2 explains the determination of LOS criteria by developing fundamental diagrams (FD). Section 2.3 explains the application of the K-means clustering technique for clustering the traffic data in different bands for LOS.

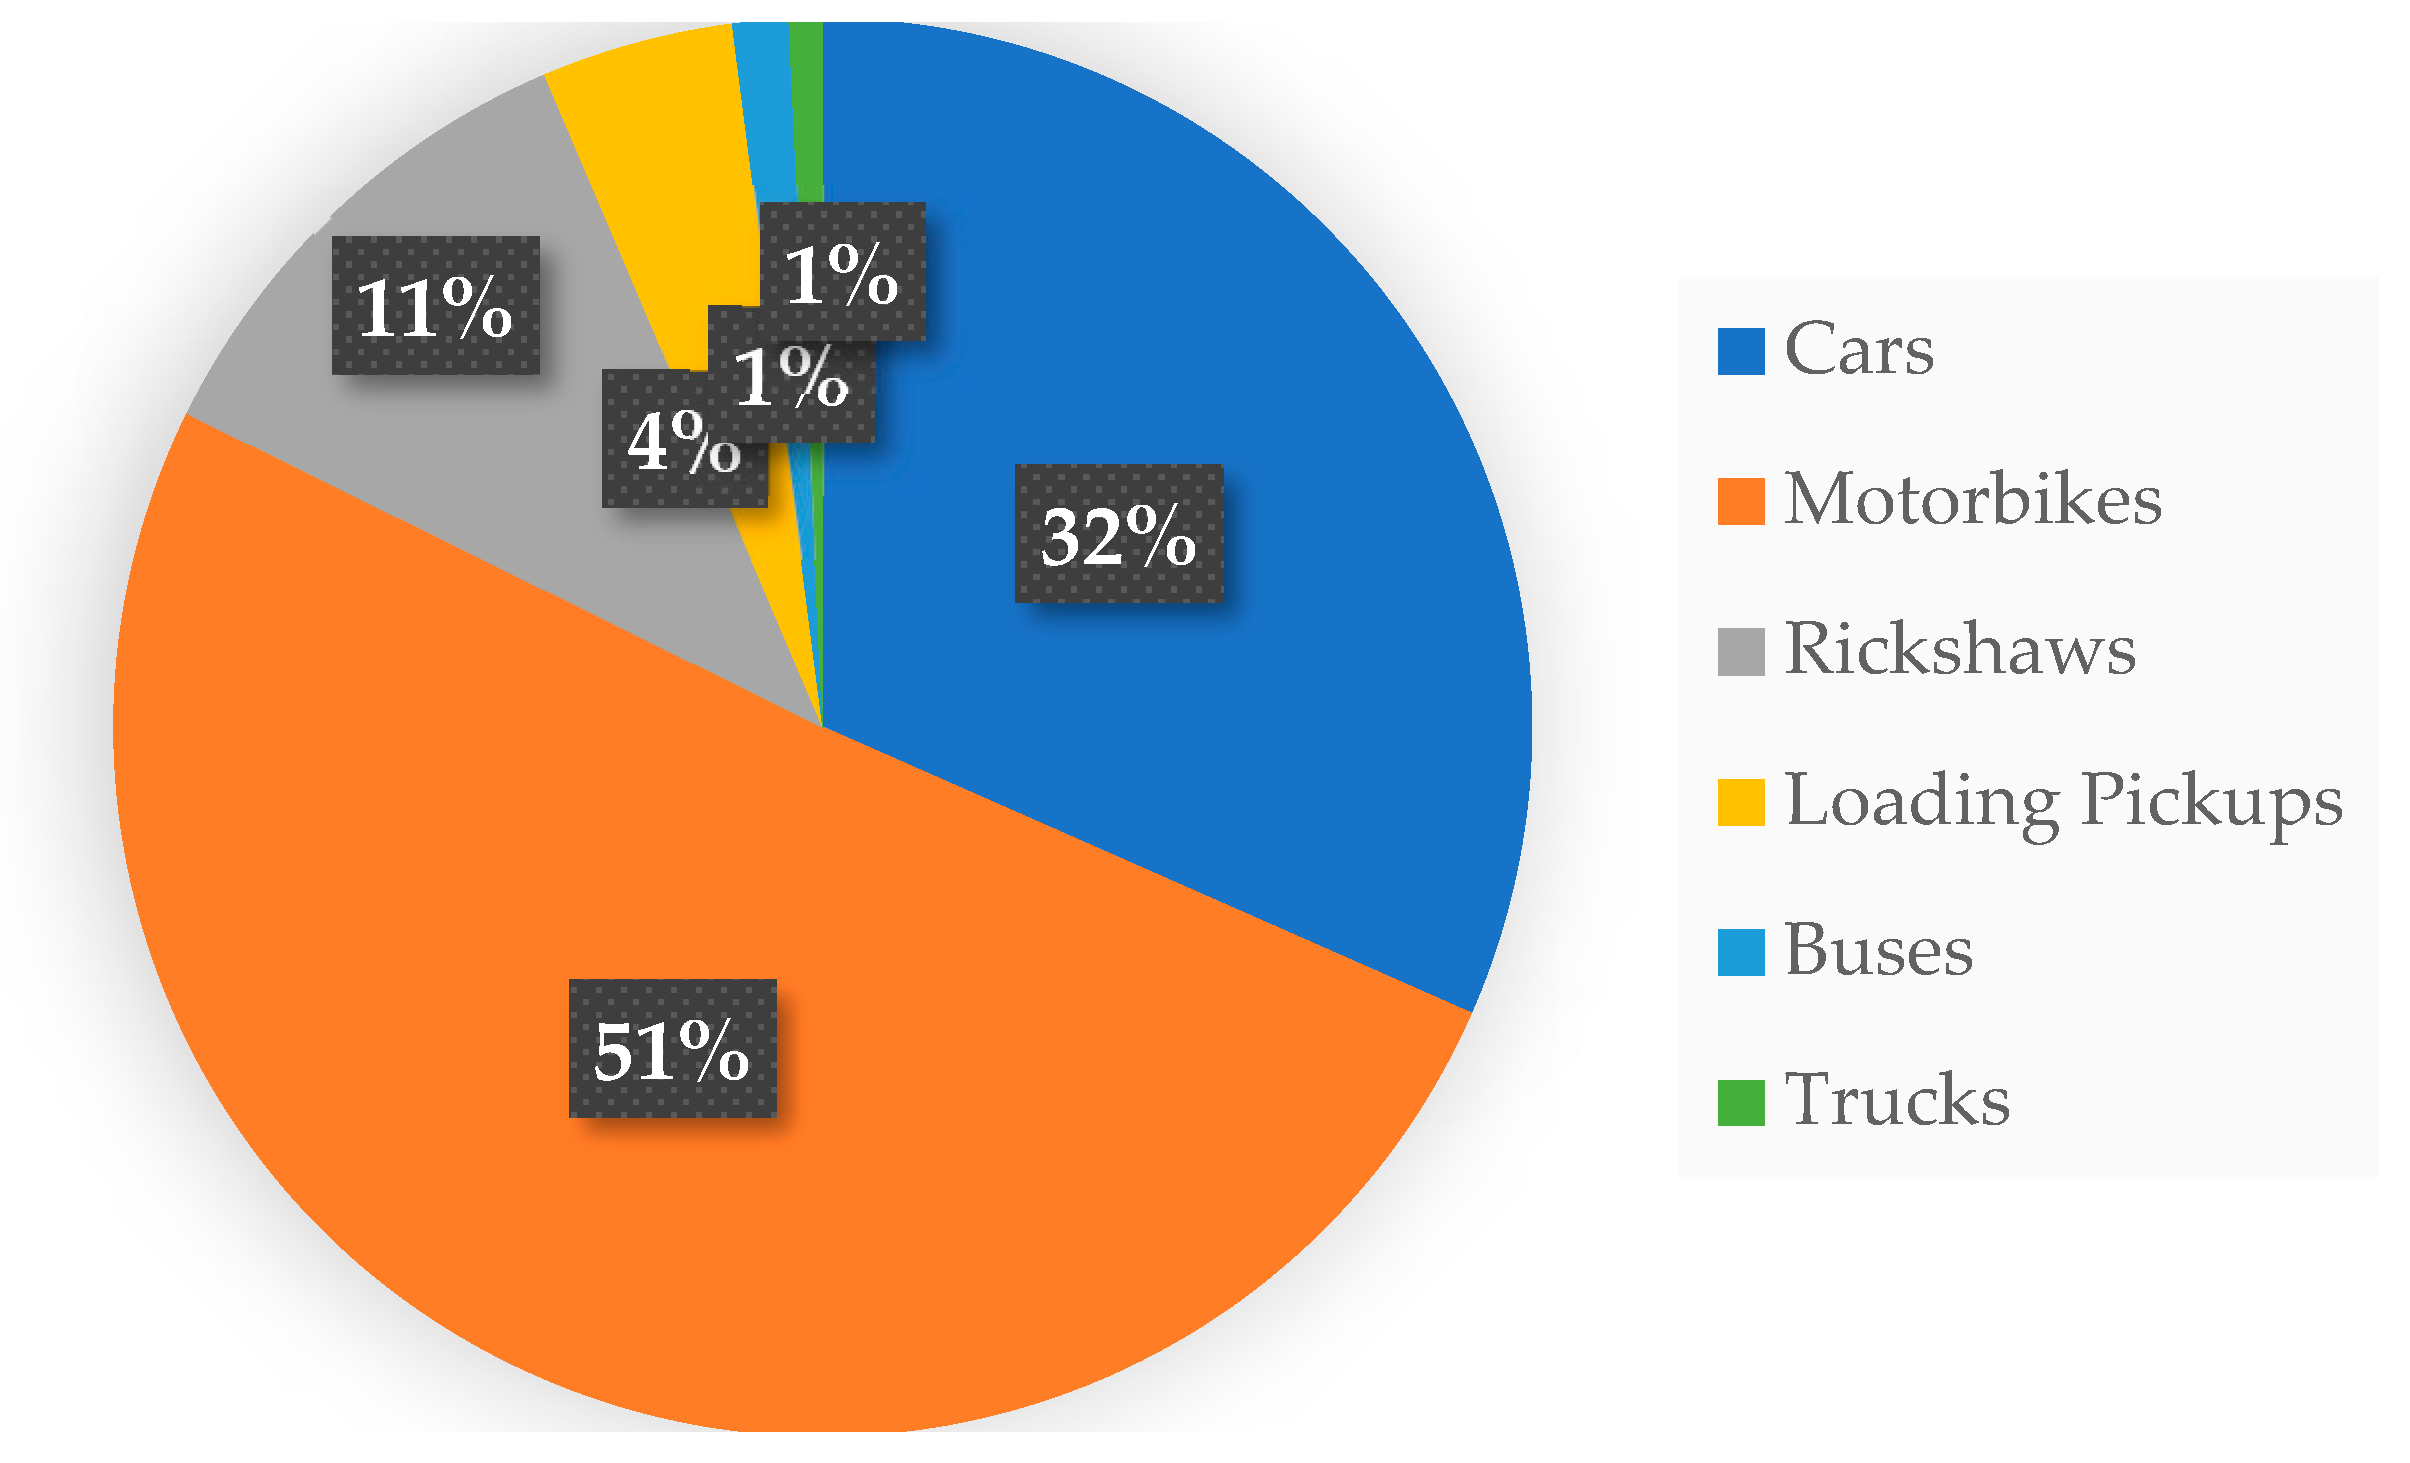
2.1. Data Collection and Extraction

University Road, one of the major urban arterials in Karachi, is selected for detailed LOS criteria evaluation for this study. The selected road is representative of the arterial roads observed in Karachi and other cities of Pakistan. Furthermore, the traffic mix and pattern of traffic observed on this road make it a suitable road to perform the intended analysis. Due to its high traffic volume and connectivity to major zones in Karachi, this arterial road was chosen for data collection in this research study. The high volume of traffic provides ideal data for constructing fundamental diagrams and determining suitable traffic parameters, such as traffic density, speed, and capacity. Furthermore, it also holds significance due to its varied land use, including residential, commercial, recreational, educational, and connectivity to the Central Business District. It consists of a divided carriageway with four lanes in each direction, having a lane width of approximately 11 ft. The effective width of the arterial is reduced due to illegally parked vehicles in the outermost lane; therefore, for this study, we have used three lanes to estimate the traffic flow parameters. Figure 1 shows an aerial photograph of the section used in this research. Some of the data in this study have been used in other studies, which were extracted from traffic stream videos recorded between 23 and 27 October 2017. The videos were recorded from 7 AM to 7 PM, ensuring that all possible traffic states, including free-flow, capacity flow, and congested traffic states, have been captured. More data related to free-flow and congested conditions were collected on Wednesday, 27 April 2022, to cover all traffic conditions in the fundamental diagram [21,42]. The integration of data from 2017 and 2022 is essential for developing a comprehensive and representative fundamental diagram. The initial 2017 dataset provided a reliable baseline for moderate traffic conditions, as demonstrated in prior studies, but lacked sufficient observations of free-flow and congested regimes. To address this limitation, additional data were collected on 27 April 2022, specifically targeting peak and off-peak periods to ensure full coverage of traffic states. Importantly, both datasets were collected using identical methodologies to maintain consistency. While potential temporal influences (e.g., seasonal or infrastructural changes) cannot be entirely ruled out, both campaigns were conducted under similar dry-season conditions, and the study segment’s geometric design remained unchanged. By merging these datasets, this study achieves a more complete and empirically validated representation of traffic flow dynamics across all operational conditions.
For the traffic count, the video of the traffic stream was recorded to manually extract traffic data from the video. The recorded video is used to extract the data for speed, traffic flow, and density. The KeyCounter software, which records the hits of specific keys on the keyboard assigned to different transport modes, was used for classified traffic counts. The data were counted per minute, and the vehicles observed from the video were categorized into six classes: cars, motorcycles, rickshaws, pickups, buses, and trucks. Figure 2 illustrates the composition of traffic in terms of vehicle types. The largest share is occupied by motorbikes, which constitute 51% of the total traffic, indicating their dominance in the overall traffic stream. Cars account for 32% of the traffic, forming the second largest category. The remaining traffic composition includes rickshaws (11%), loading pickups (4%), buses (1%), and trucks (1%). The passenger car equivalent (PCE) factors were used to combine all the vehicles into single passenger car units (PCU). The PCE factors estimated in another study specifically for Karachi were used, with values of 0.25 for motorbikes, 0.5 for rickshaws, 1.0 for cars, 3.0 for trucks, and 2.5 for buses [43]. Standard PCE values (e.g., HCM 2022) were deemed inappropriate because (1) Karachi’s traffic mix contains 58% motorcycles (vs. <10% in HCM base conditions), (2) heterogeneous lane discipline increases interaction effects between vehicle types, and (3) average speeds are 25–30% lower than HCM reference conditions.
Table 2 presents the traffic volume observed during the morning off-peak and evening peak periods. The selected road segment leads the traffic away from the city center. Therefore, less traffic is observed during the morning period, while peak traffic is observed during the evening period. In the morning period, traffic volume increased from 2834 PCU/h between 7:00 and 8:00 AM to 3233 PCU/h between 8:00 and 9:00 AM. In the evening peak, the volume was 5447 PCU/h from 5:00–6:00 PM and rose slightly to 5698 PCU/h between 6:00 and 7:00 PM.
In addition to traffic flows, traffic density and average speed are also needed to develop fundamental diagrams and perform the required analysis. A 200-foot homogeneous segment of the roadway was selected to estimate traffic density, ensuring minimal entry/exit points and consistent lane geometry. The segment length was chosen to balance spatial resolution (capturing localized congestion) with measurement stability (avoiding excessive noise from very short segments). Density was calculated by counting all vehicles within the segment at three time-staggered snapshots per minute, sampled at 0, 20, and 40 s intervals. This approach accounts for temporal fluctuations while maintaining consistency with prior studies [21,42,43]. Vehicle speeds were derived by tracking the time taken for individual vehicles to traverse the 200-foot segment. To ensure representativeness, a stratified sampling strategy was employed: each minute, speeds were measured for three motorcycles, two cars, one rickshaw, and one truck—proportions reflecting their observed share in the traffic mix (e.g., motorcycles comprised ~40% of the fleet). Vehicles were selected randomly within each category to minimize bias. Speed data were aggregated into minute-level averages for analysis. Density (vehicles/segment) and speed (feet/second) were synchronized to construct the fundamental diagram. The 200-foot segment length aligns with both metrics, ensuring spatial consistency. The sampling rates (3 density snapshots/minute; 7 speed measurements/minute) were empirically validated to capture traffic dynamics without oversampling.

2.2. Level of Service Criteria and Fundamental Diagrams

The data acquired from University Road were further analyzed to evaluate the existing level of service criteria described in the US HCM and Indian HCM and to develop the criteria for local traffic conditions. The fundamental diagrams were developed to obtain the traffic flow parameters necessary for assessing and developing LOS criteria. The traffic flow parameters, including speed, density, and flow rates, were used to create density-speed and flow–density fundamental diagrams (FDs). FDs are considered one of the essential tools to observe the relationships among macroscopic traffic parameters. These FDs were used to extract the values of free-flow speed, capacity flow, critical density, and jam density for University Road. The speed–density diagram was used to determine the free-flow speed and jam density, while the flow–density diagram helped estimate the capacity flow. According to the US and Indian HCM, travel speed is the primary criterion for characterizing the LOS for urban arterials. The volume-to-capacity ratio is another strategy adopted for estimating LOS criteria for heterogeneous traffic. Therefore, the volumes corresponding to the upper and lower bounds for each LOS category were determined to estimate the volume-to-capacity ratio for LOS categories.

2.3. Alternative Clustering Algorithms for Determining LOS Threshold

Numerous researchers have employed the K-means technique to classify data into distinct clusters [44]. Xia and Chen [45] utilized a clustering approach (k-means) to analyze freeway data. They established flow phases and constructed five cluster models based on density and speed. Subsequently, they investigated the fundamental connections between traffic parameters by defining flow phases. Sun and Zhou [46] classified speed–density data into two and three clusters to identify breakpoints in the multi-regime traffic model. Oh, Tok, and Ritchie [47] applied clustering methodology, K-means, and a fuzzy technique to re-identify median section speed to derive LOS criteria. Azimi and Zhang [48] employed three clustering algorithms to segment traffic flow data: K-means, fuzzy C-means, and CLARA (Clustering Large Applications).
The comparison of various clustering techniques shows that the K-means clustering algorithm outperforms others and demonstrates greater consistency with the HCM-defined level of service (LOS). Bhuyan and Nayak [9] proposed strategies to evaluate the level of service criteria for urban arterials, incorporating fuzzy set theory, cluster analysis, artificial neural networks, uncertainty, and reliability analysis. Cluster analysis is one of the most suitable methods for segmenting data into ranges; therefore, this technique was applied using the K-means enhanced algorithm with k-means++ initialization to reduce sensitivity to random seeding using Python 3.10 libraries. As demonstrated by Xia and Chen [45], Sun and Zhou [46], and Azimi and Zhang [48], K-means have proven particularly effective for traffic parameter classification. The speed data were used as input for analysis with the aim of dividing the data into six clusters. The choice of six clusters is based on the fact that LOS is usually represented in six bands, designated as A to F, and is usually represented in six bands, designated as A to F, as defined in the HCM. Speed has been selected as a primary variable for making clusters for LOS, as this is the primary criterion for determining the LOS for urban arterials.

3. Case Study and Results

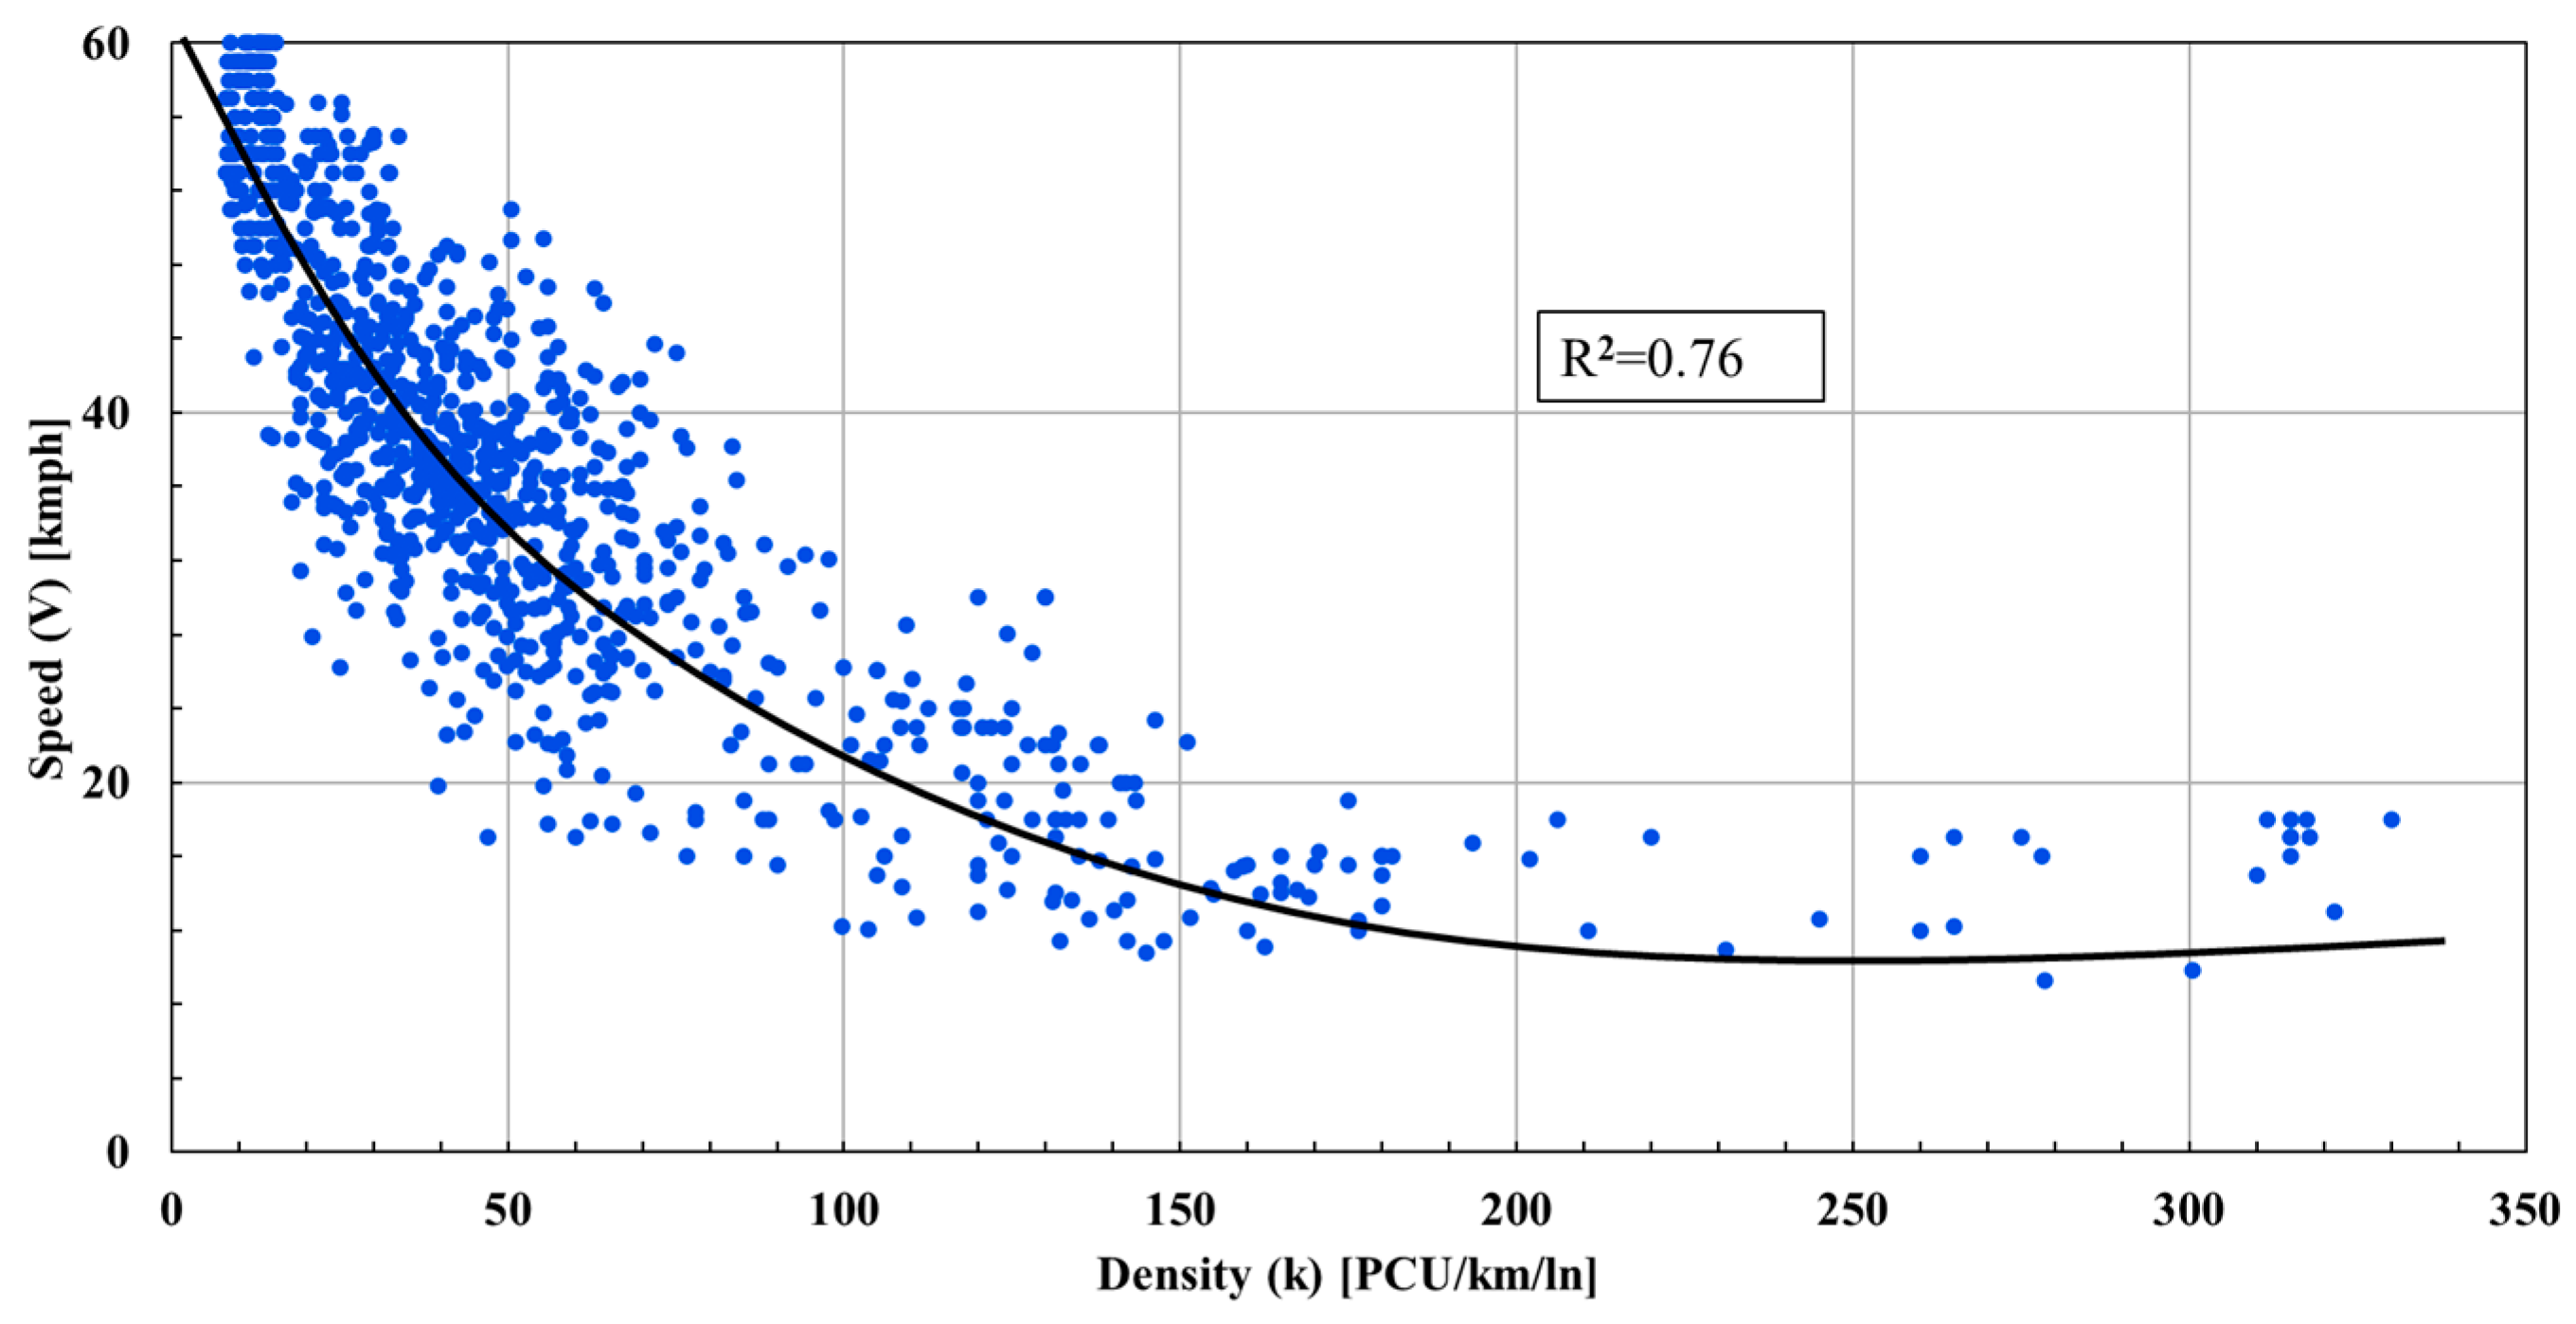
3.1. Speed–Density Fundamental Diagram

The data collected from the University Road were plotted to develop fundamental traffic flow diagrams, which were used as a primary input to evaluate the LOS criteria. The speed–density fundamental diagram (FD) exhibits a clear negative association between the two parameters, as illustrated in Figure 3. To develop a speed–density model for the traffic data collected in Karachi, various models were tested to find the best fit for the speed–density data. Table 3 summarizes speed–density models developed to demonstrate the association between speed and density for heterogeneous traffic.
Among the possible relationships between speed and density, the polynomial relationship (second order) is best suited to represent the data, with an R-squared value of 0.76. Sensitivity analyses confirmed this relationship’s robustness:
  • Parameter variations: coefficients remained stable (±5%) when excluding outliers or resampling data.
  • Edge cases: the polynomial fit outperformed linear/exponential models (ΔR2 > 0.12) under extreme densities (e.g., >150 veh/km).
Due to the significant proportion of motorcycles in the city’s traffic stream and their ability to maneuver in congested conditions, no jam density is observed. Instead, vehicles can maintain a speed within a range of 10–20 kmph at traffic densities much higher than the reported values of jam density for the standard traffic stream. Comparative analysis with Surat city in Gujrat state (similar motorcycle dominance) revealed consistent behavior (R2 = 0.71 for their polynomial fit), underscoring regional applicability [52]. The maximum and minimum speeds obtained from the data points are 63 km/h and 9.25 km/h, respectively. Based on the data presented in Figure 3, the free-flow speed for University Road is estimated from the graph to be 60 km/h for further evaluation and analysis of LOS.

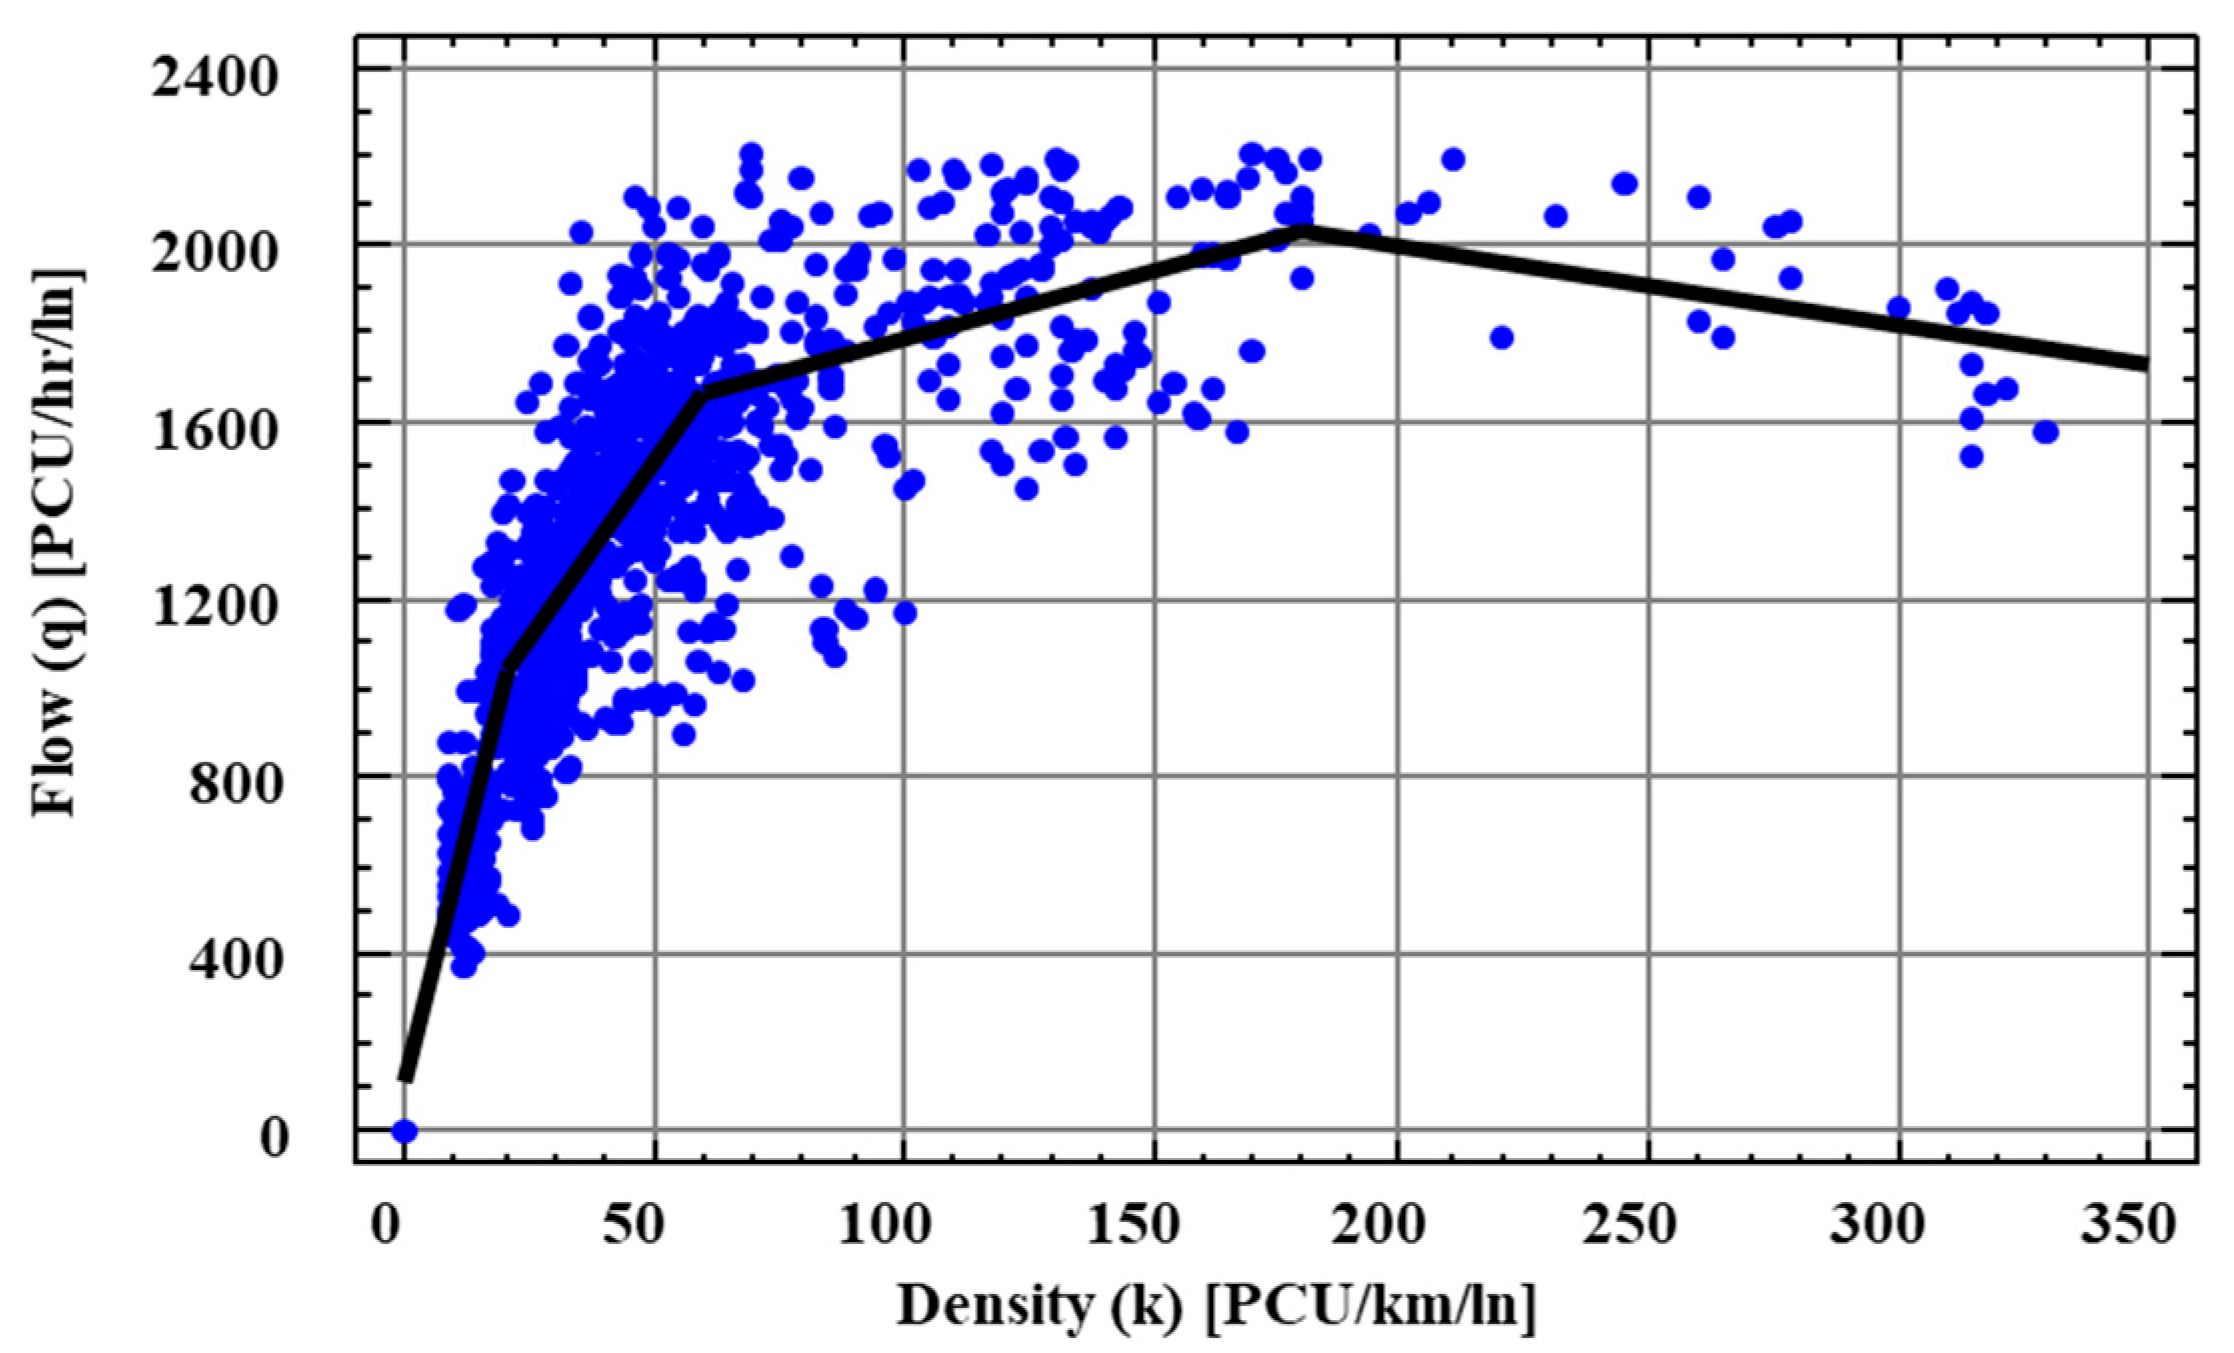
3.2. Flow–Density Fundamental Diagram

A flow–density fundamental diagram is developed to determine the capacity flow rate for the selected arterial, which is then used to estimate the volume-to-capacity ratio for LOS analysis. The heterogeneous nature of traffic is evident in Figure 4, as it does not represent any jam density, and most of the high-density points lie between flow rates of 1500 and 2000 PCU/h/ln. Among the possible mathematical functions to represent the flow–density data, the piecewise function was the most suitable, with an R-squared value of 0.74. Motorcycle-dominant arterials in Jakarta [53] showed comparable flow–density dispersion (R2 = 0.69). The piecewise function was validated through:
  • Leave-one-out cross-validation (R2 stability: 0.71–0.76).
  • Parameter sensitivity tests (e.g., ±10% density bin adjustments altered capacity estimates by <3%).
  • Simulated extreme flows (e.g., 2500+ PCU/h/ln) confirmed the model’s piecewise logic over polynomial alternatives (ΔR2 > 0.08).
According to the flow–density model, the capacity for University Road was observed to be approximately 2000 PCU/h/ln. The values of free-flow speed, capacity flow rate, and collected data of speed, flow, and density are used for further analysis.

3.3. Clustering Analysis

We employed speed data to generate six clusters that directly map to the standard HCM LOS classifications (A–F). This approach was selected because (1) speed represents the principal LOS determinant for urban arterials in HCM 2022 and (2) six-cluster partitioning preserves the conventional LOS banding structure while enabling data-driven classification. The highest speed cluster initiated from 58.53 kmph, which was capped at the estimated free-flow speed (60 kmph) obtained from the fundamental diagram, as shown in Figure 3. The upper and lower bound speeds for all the clusters were rounded to their nearest integer values to estimate the speed ranges for various LOS categories, as shown in Table 4. Our comparative analysis of alternative methods (including hierarchical clustering and Density-Based Spatial Clustering of Applications with Noise—(DBSCAN)) confirmed that K-means++:
  • Achieved superior cluster separation (average silhouette width = 0.51).
  • Maintained computational efficiency for our dataset.
  • Showed the strongest alignment with HCM LOS classifications.
In addition, an ANOVA was performed to examine the statistical significance of clustering, which yielded a significance value of p < 0.001 and η2 = 0.83, indicating a high F-score, and 83% of the variance was explained by cluster membership. The large partial eta-squared (η2 = 0.83) exceeds the benchmark for ‘large’ effects (η2 > 0.14) in behavioral sciences. Pairwise post hoc tests (Tukey’s Honestly Significant Difference (HSD)) were also performed to validate the differences between cluster values. This test validated all pairwise cluster distinctions (p < 0.01). Several assumptions were also checked, e.g., homogeneity of variance (Levene’s test: p = 0.12), normality of residuals (Shapiro–Wilk: p = 0.08, Quantile–Quantile (Q-Q) plot verification), and sample size adequacy (≥200 cases per cluster). These results robustly support both the statistical and practical significance of the six-cluster solution for LOS classification. The LOS values for speed, as per US-HCM 2022 and Indian HCM, were used to compare the developed criteria for local traffic.

3.4. Comparison and Development of Level of Service Criteria

The data collected from University Road and the fundamental diagrams presented are used to compare the LOS criteria described in the US and Indian HCMs. The speed ranges and volume-to-capacity ratios estimated by the Indian HCM were compared with those estimated for Karachi for similar speed ranges. This provides insight into the detailed modeling of heterogeneous traffic and how the volume-to-capacity ratio differs for the selected speed ranges.
Table 5 compares the values of LOS criteria used by the US HCM and Indian HCM with the values of volume-to-capacity ratios estimated for traffic in Karachi. The US HCM suggests that traffic operates at LOS A when the average travel speed is more than 80% of the free-flow speed, whereas the Indian HCM indicates a value of 84% for LOS A. As reported in the Indian HCM, this average speed value corresponds to a volume-to-capacity ratio of less than 0.15. However, the volume-to-capacity ratio for University Road, within the same speed range as described in the Indian HCM, was estimated to be 0.45, which is three times higher than its corresponding value in the Indian HCM. This indicates that, due to heterogeneity and a lack of lane discipline, the traffic maintains a high travel speed despite the volume reaching approximately 45% of capacity. The speed ranges of the Indian HCM are higher in all LOS categories than those described in the US HCM, except for the jam conditions, where vehicular movement is still observed. In heterogeneous traffic streams, motorcyclists can still maintain the speed required to maneuver through traffic in jam conditions. Similar to LOS A, the values of the volume-to-capacity ratio estimated for Karachi are significantly different from the criteria developed by the Indian HCM for LOS B and C; however, the values for LOS D to E show a good resemblance to the Indian HCM.
The data presented in Table 5 show a significant difference in the volume-to-capacity ratio for the values in Karachi compared to those for the same LOS reported in the Indian HCM. This highlights the need to develop the criteria for local traffic using the collected data. For this purpose, the K-means clustering technique was used to divide the data into six groups, ranging from free flow to congested traffic. Each cluster represents the data belonging to one category of LOS. The clusters of speeds obtained using the K-means cluster analysis were used to determine the corresponding values of other parameters, such as volumes, to determine the corresponding volume-to-capacity ratios. Figure 5 shows the clusters developed using the speeds and volumes classified for LOS A to F.
Table 6 presents the criteria developed for LOS estimation in Karachi, Pakistan, and compares them with the values of the Indian and US HCM. As the volume-to-capacity ratios estimated for traffic in Karachi using the speed ranges described in the Indian HCM resulted in significantly different values, the cluster analysis-based values are used as the criteria for the LOS estimation. LOS A corresponds to an average travel speed greater than 87% of the free-flow speed and a volume-to-capacity ratio of 0.41. Similarly, the cluster for LOS B shows that the speed ranges from 73% to 87%, and the volume-to-capacity ratio, which ranges from 0.41 to 0.66, is also higher than the criteria reported for Indian and US traffic. The lower band of the volume-to-capacity ratio of LOS C for Indian HCM is significantly lower than the value estimated for Karachi. However, the upper band of LOS C and the volume-to-capacity ratio of other LOS categories for Indian HCM show a significant resemblance in values with the volume-to-capacity ratio estimated for Karachi. The upper band of percentage speed ranges estimated for LOS in Karachi is higher than the corresponding Indian HCM values for all LOS categories except LOS C. The comparison of the estimated percentage speed ranges for Karachi with those from the US HCM shows that the lower and upper band values for all LOS categories in Karachi are higher than their corresponding values in the US HCM.
The higher speed range estimated for LOS A is due to the fact that drivers in developing countries, such as India and Pakistan, tend to drive at higher speeds even when traffic volume increases. A similar trend is reported in another study from Karachi, which shows how lateral and longitudinal gaps shrink with an increase in traffic volume [42]. Weak or no lane-following tendencies result in higher speeds at higher volumes, as depicted by the fundamental diagrams in this paper.

4. Discussion and Policy Implications

The results demonstrate that the volume-to-capacity (v/c) ratio corresponding to LOS A is 0.41—significantly higher than the Indian HCM’s benchmark of 0.15 [30]. This discrepancy stems from three key characteristics of heterogeneous traffic: (1) the dominance of motorcycles (58% of traffic flow), which occupy 60% smaller spatial footprints than passenger cars [42] and exhibit greater maneuverability, effectively increasing practical capacity; (2) non-lane-based movement patterns that allow 15–20% better utilization of available roadway width [21]; and (3) adaptive driving behaviors that maintain higher speeds (87% of free-flow speed at 41% capacity) through flexible headways [42]. These findings challenge conventional HCM assumptions about speed–flow relationships in homogeneous traffic and underscore the need for revised LOS criteria in mixed-traffic contexts, as previously identified for Indian conditions [54]. Specifically, the results suggest that urban arterials in developing cities may operate at higher v/c ratio thresholds without degrading to lower LOS—a phenomenon also observed in Bangkok’s motorcycle-dominated traffic [55]. However, this apparent efficiency comes with tradeoffs: while speeds remain stable, safety risks (e.g., conflict points) increase significantly. Future studies should investigate the optimal balance between capacity utilization and safety performance when redefining LOS standards for heterogeneous traffic conditions, particularly for signal timing optimization and geometric design adaptations. A similar clustering approach has been applied to selected Indian roads, which exhibit similar classes of LOS bands based on observed speed [56,57,58].
The perception of road users is another important parameter that should be integrated into redefining and establishing the LOS for transportation facilities, which may significantly vary for users from developing countries [59,60,61,62,63]. In heterogeneous traffic, the perception may also be influenced by the users of different modes [58]. The increased proportion of connected and autonomous vehicles also affects the operational characteristics of traffic streams and requires extensive research to reevaluate their impact on the evaluation of operational and safety characteristics, including LOS [64].
While this study provides valuable insights into LOS criteria for heterogeneous traffic, several limitations must be acknowledged. First, the focus on a single arterial in Karachi, despite its representative traffic mix (58% motorcycles, 22% cars), may limit generalizability to other urban geometries (e.g., grid networks) or regions with differing vehicle composition (e.g., higher truck shares). The findings are most applicable to South Asian cities with comparable roadside friction and non-lane-based discipline, as demonstrated by similar studies with comparable v/c ratios. Second, potential biases in manual video data collection, such as time-of-day variations (peak vs. off-peak) and observer subjectivity in vehicle classification, were mitigated through interrater reliability checks (κ = 0.92) and cross-validation with automated counts at 10% of locations. Future work should expand to multiple corridors with controlled variations in width, gradient, and control type to develop a more universal framework. These limitations do not invalidate the core findings but highlight context-specific applications when adopting the proposed LOS thresholds.

5. Conclusions and Recommendations

This research study examines the need and suitability of developing indigenous LOS analysis criteria for heterogeneous traffic streams. In developing countries such as Pakistan, the use of United-States-based criteria is not suitable for local traffic regimes because of the significantly different driving behavior dynamics. The accurate estimation of LOS enables the examination of existing operational characteristics and contributes to making the transport system more sustainable. This research performed a detailed evaluation of the criteria for LOS estimation of urban arterials by collecting data on traffic flow parameters from one of the major arterials in Karachi. Fundamental traffic flow diagrams were developed to understand traffic behavior and estimate free-flow speed and capacity flow rates. Furthermore, the data were used to estimate the volume-to-capacity ratio for comparison with the Indian HCM.
The results showed a clear and distinct difference between the criteria for the US, India, and Pakistan. Both the speed ranges and volume-to-capacity ratios obtained for arterial networks in Karachi have higher values than those in the US and Indian HCMs. The travel speed for LOS A of the arterial in Karachi is approximately 87% of the free flow speed, which is slightly higher than the values defined in the US and Indian HCMs. This is only 7% higher than the speed threshold for the LOS A criterion defined by the US HCM and 3% higher than the criterion defined by the Indian HCM. However, the volume-to-capacity ratio corresponding to this band is 0.41, as estimated by this research, in comparison with 0.15, which was proposed by the Indian HCM. Similarly, the speed bands proposed by this research are not drastically different from other LOS bands used by the other two HCMs. The volume-to-capacity ratios for LOS B and C are also significantly different from the values proposed by the Indian HCM. The volume-to-capacity ratios for LOS D to F do not show a massive difference in the proposed criteria value. This research demonstrates that speed alone is insufficient to comprehend the behavior of the traffic stream, and the volume-to-capacity ratio offers additional insight into and understanding the speed bands corresponding to LOS categories. However, once the criteria have been developed with a good understanding of the dynamics of a traffic stream, speed is a simpler and more straightforward parameter to measure and evaluate LOS. The proposed criteria for LOS A (87% free-flow speed) correspond to a 41% volume-to-capacity ratio, indicating that despite higher traffic volumes, vehicles maintain a higher travel speed. This can be attributed to a higher proportion of motorbikes in the traffic stream and the tendency to utilize all available road space by traveling in more lanes than the marked lanes. This heterogeneity and defiance of lane discipline result in more space to accommodate vehicles, leading to higher-than-expected speeds at a given traffic volume. These differences in speed ranges and volume-to-capacity ratios highlight the need to redefine the criteria for LOS estimation to be more suitable for local traffic conditions. The K-means clustering analysis technique was used to redefine the criteria of different LOS categories for heterogeneous and undisciplined traffic streams.
This study only examined the criteria for urban arterials, and no other transportation facilities were included in the scope of this study. The speed bands estimated in this research for LOS analysis can be used to define the speeds corresponding to various LOS categories for different types of arterial roads. Further investigations are needed to include more arterials of different types to strengthen the results presented in this study further. Future research could be extended to evaluate other transportation facilities and develop comprehensive LOS estimation criteria that are more representative of local traffic conditions. Future research may be directed to develop HCM for heterogeneous and laneless traffic conditions.

Author Contributions

The authors confirm their contribution to the paper as follows: study conception and design: A.A.; data collection: S.F.A.R. and M.F.A.; analysis and interpretation of results: A.A., M.A., F.K., F.O. and S.F.A.R.; draft manuscript preparation: A.A. and F.K. All authors reviewed the results and approved the final manuscript version.

Funding

This paper is based on a project that received funding from the European Union’s Horizon 2020 research and innovation program under Grant Agreement No 101037193. Partial funding for this research is also arranged from Zayed University, UAE, under research grant No. R23081.

Institutional Review Board Statement

Not applicable.

Informed Consent Statement

Not applicable.

Data Availability Statement

The data presented in this study are available on request from the corresponding author.

Conflicts of Interest

The authors declare that they have no known competing financial interests or personal relationships that could have appeared to influence the work reported in this paper.

References

  1. Roess, R.P.; Vandehey, M.A.; Kittelson, W. Level of service: 2010 and beyond. Transp. Res. Rec. 2010, 2173, 20–27. [Google Scholar] [CrossRef]
  2. Navandar, Y.V.; Dhamaniya, A.; Patel, D. Empirical analysis of level of service based on users perception at manual tollbooth operation in India. Transp. Res. Procedia 2019, 37, 314–321. [Google Scholar] [CrossRef]
  3. Wang, M.; Mao, B.; Yang, Y.; Shi, R.; Huang, J. Determining the Level of Service Scale of Public Transport System considering the Distribution of Service Quality. J. Adv. Transp. 2022, 2022. [Google Scholar] [CrossRef]
  4. Yeramwar, C.; Kaley, A.; Bambode, K. Evaluation of capacity and level of service of roads. Int. J. Sci. Res. Sci. Eng. Technol. 2016, 2, 296–299. [Google Scholar]
  5. Manual, H.C. HCM2010; Transportation Research Board: Washington, DC, USA, 2010. [Google Scholar]
  6. Mathew, T.V.; Rao, K.K. Introduction to Transportation Engineering, NPTEL. Capacity and Level of Service. 2007. Available online: https://nptel.ac.in/courses/105101087 (accessed on 10 January 2025).
  7. Pandey, A.; Biswas, S. Assessment of Level of Service on urban roads: A revisit to past studies. Adv. Transp. Stud. 2022, 57. [Google Scholar]
  8. Roess, R.P. Level of service concepts: Development, philosophies, and implications. Transp. Res. Rec. 1984, 971, 1–6. [Google Scholar]
  9. Bhuyan, P.K.; Nayak, M.S. A review on level of service analysis of urban streets. Transp. Rev. 2013, 33, 219–238. [Google Scholar] [CrossRef]
  10. National Academies of Sciences, Engineering, and Medicine; Transportation Research Board. Highway Capacity Manual 7th Edition: A Guide for Multimodal Mobility Analysis; National Academies Press: New York, NY, USA, 2022. [Google Scholar]
  11. Kumar, P.G.; Samal, S.R.; Prasanthi, L.; Bhavitha, V.; Devi, J.M. Level of service of urban and rural roads-a case study in Bhimavaram. In IOP Conference Series: Materials Science and Engineering; IOP Publishing: Bristol, UK, 2020. [Google Scholar]
  12. Drew, D.R.; Keese, C.J. Freeway Level of Service as Influenced by Volume and Capacity Characteristics; Texas Transportation Institute: Bryan, TX, USA, 1965. [Google Scholar]
  13. Manual, H.C. Highway capacity manual. Transp. Res. Board 2000, 2, 5–7. [Google Scholar]
  14. McAndrews, C.; Pollack, K.M.; Berrigan, D.; Dannenberg, A.L.; Christopher, E.J. Understanding and improving arterial roads to support public health and transportation goals. Am. J. Public Health 2017, 107, 1278–1282. [Google Scholar] [CrossRef]
  15. Hu, X.; Qiao, L.; Hao, X.; Lin, C.; Liu, T. Research on the impact of entry points on urban arterial roads in the framework of Kerner’s three-phase traffic theory. Phys. A Stat. Mech. Appl. 2022, 605, 127962. [Google Scholar] [CrossRef]
  16. Deshpande, R.; Gartner, N.H.; Zarrillo, M.L. Urban street performance: Level of service and quality of progression analysis. Transp. Res. Rec. 2010, 2173, 57–63. [Google Scholar] [CrossRef]
  17. Tsela, D.; Duggal, E.A.K. Determination of Level of Service of Arterial Road in Kohima. Int. Res. J. Eng. Technol. 2021, 8, 1559–1564. [Google Scholar]
  18. Mohapatra, S.S. Level of Service Criteria of Urban Streets in Indian Context Using Advanced Classification Tools. Ph.D. Thesis, National Institute of Technology, Rourkela, India, 2012. [Google Scholar]
  19. Akbar, M.; Khan, R.; Khan, M.T.; Alam, B.; Elahi, M.; Wali, B.; Shah, A.A. Methodology for simulating heterogeneous traffic flow at intercity roads in developing countries: A case study of university road in Peshawar. Arab. J. Sci. Eng. 2018, 43, 2021–2036. [Google Scholar] [CrossRef]
  20. Srikanth, S.; Mehar, A. Development of MLR, ANN and ANFIS Models for estimation of PCUs at different levels of service. J. Soft Comput. Civ. Eng. 2018, 2, 18–35. [Google Scholar]
  21. Ahmed, A.; Ukkusuri, S.V.; Mirza, S.R.; Hassan, A. Width-based cell transmission model for heterogeneous and undisciplined traffic streams. Transp. Res. Rec. 2019, 2673, 682–692. [Google Scholar] [CrossRef]
  22. Ahmed, A.; Ali, M.S.; Ansari, T. Modelling Heterogeneous and Undisciplined Traffic Flow using Cell Transmission Model. Int. J. Traffic Transp. Manag. 2020, 2, 1–5. [Google Scholar] [CrossRef]
  23. Rao, A.M.; Rao, K.R. Measuring urban traffic congestion—A review. Int. J. Traffic Transp. Eng. 2012, 2, 286–305. [Google Scholar]
  24. Mallikarjuna, C.; Rao, K.R. Heterogeneous traffic flow modelling: A complete methodology. Transportmetrica 2011, 7, 321–345. [Google Scholar] [CrossRef]
  25. Patel, C.R.; Joshi, G. Capacity and LOS for urban arterial road in Indian mixed traffic condition. Procedia-Soc. Behav. Sci. 2012, 48, 527–534. [Google Scholar] [CrossRef]
  26. Akçelik, R. An assessment of the Highway Capacity Manual 2010 roundabout capacity model. In Proceedings of the TRB International Roundabout Conference, Carmel, IN, USA, 18–20 May 2011. [Google Scholar]
  27. Miller, A.J. On the Australian road capacity guide. Highw. Res. Rec. 1969, 289, 1–13. [Google Scholar]
  28. Othayoth, D.; Rao, K.K. Investigating the relation between Level of Service and volume-to-capacity ratio at signalized intersections under heterogeneous traffic condition. Transp. Res. Procedia 2020, 48, 2929–2944. [Google Scholar] [CrossRef]
  29. Marisamynathan, S.; Vedagiri, P. Pedestrian perception-based level-of-service model at signalized intersection crosswalks. J. Mod. Transp. 2019, 27, 266–281. [Google Scholar] [CrossRef]
  30. Chandra, S.; Gangopadhyay, S.; Velmurugan, S.; Ravinder, K. Indian Highway Capacity Manual (Indo-HCM); Council of Scientific and Industrial Research: New Delhi, India, 2017. [Google Scholar]
  31. Golakiya, H.D.; Dhamaniya, A. Evaluating LOS at urban midblock section under the influence of crossing pedestrians in mixed traffic conditions. Transp. Res. Procedia 2020, 48, 777–792. [Google Scholar] [CrossRef]
  32. Badveeti, A.; Mir, M.S.; Badweeti, K. The evaluation of traffic congestion analysis for the Srinagar City under mixed traffic conditions. In Recent Advances in Traffic Engineering; Springer: Berlin/Heidelberg, Germany, 2020; pp. 85–98. [Google Scholar]
  33. Manzoor, M.F.; Dar, M.N. Study on capacity and level of service for urban areas under mixed traffic conditions: A case study of srinagar city. Int. Res. J. Eng. Technol. 2020, 7, 3103–3115. [Google Scholar]
  34. Patnaik, A.K. Level of Service Criteria of Roads in Urban Indian Context. Ph.D. Thesis, National Institute of Technology, Rourkela, India, 2013. [Google Scholar]
  35. Maitra, B.; Sikdar, P.; Dhingra, S. Modeling congestion on urban roads and assessing level of service. Int. J. Transp. Eng. 1999, 125, 508–514. [Google Scholar] [CrossRef]
  36. Marwah, B.; Singh, B. Level of service classification for urban heterogeneous traffic: A case study of Kanpur metropolis. In Proceedings of the Fourth International Symposium on Highway Capacity, Maui, HI, USA, 27 June–1 July 2000. [Google Scholar]
  37. Rahimi, M.R.; Vala, M.; Patel, B.N. Evaluation of Capacity and Level of Service for Selected Urban Arterial Roads—A Case Study of Rajkot City; Springer: Singapore, 2020. [Google Scholar]
  38. Yi, P.; Lu, J.; Zhang, Y.; Lu, H. Safety-based capacity analysis for Chinese highways: A preliminary study. IATSS Res. 2004, 28, 47–55. [Google Scholar] [CrossRef]
  39. Zhou, R.; Zhong, L.; Zhao, N.; Fang, J.; Chai, H.; Zhou, J.; Li, W.; Li, B. The development and practice of China highway capacity research. Transp. Res. Procedia 2016, 15, 14–25. [Google Scholar] [CrossRef]
  40. Indonesian Highway Capacity Manual Part I-Urban Roads; Highways, D.G.O., Ed.; Directorate General of Highways: Jakarta, Indonesia, 1993.
  41. Wu, N. New Features in the 2015 German Highway Capacity Manual (HBS2015). Transp. Res. Procedia 2017, 1–16. [Google Scholar]
  42. Ahmed, A.; Ngoduy, D.; Adnan, M.; Baig, M.A.U. On the fundamental diagram and driving behavior modeling of heterogeneous traffic flow using UAV-based data. Transp. Res. Part A Policy Pract. 2021, 148, 100–115. [Google Scholar] [CrossRef]
  43. Ahmed, A.; Noman, S.M.; Baig, M.A.U.; Ngoduy, D.; Adnan, M.; Ismail, M.A.; Qadir, A. Estimating passenger car equivalent factors for heterogeneous traffic using occupancy-density linear regression model. Transp. Res. Rec. 2022, 2676, 209–220. [Google Scholar] [CrossRef]
  44. Hastie, T.; Tibshirani, R.; Friedman, J. The Elements of Statistical Learning: Data Mining, Inference, and Prediction; Springer: Berlin/Heidelberg, Germany, 2009; Volume 2. [Google Scholar]
  45. Xia, J.; Chen, M. Defining traffic flow phases using intelligent transportation systems-generated data. J. Intell. Transp. Syst. 2007, 11, 15–24. [Google Scholar] [CrossRef]
  46. Sun, L.; Zhou, J. Development of multiregime speed–density relationships by cluster analysis. Transp. Res. Rec. 2005, 1934, 64–71. [Google Scholar] [CrossRef]
  47. Oh, C.; Tok, A.; Ritchie, S.G. Real-time freeway level of service using inductive-signature-based vehicle reidentification system. IEEE Trans. Intell. Transp. Syst. 2005, 6, 138–146. [Google Scholar] [CrossRef]
  48. Azimi, M.; Zhang, Y. Categorizing freeway flow conditions by using clustering methods. Transp. Res. Rec. 2010, 2173, 105–114. [Google Scholar] [CrossRef]
  49. Greenshields, B.; Channing, W.; Miller, H. A study of traffic capacity. In Proceedings of the Annual Meeting of the Highway Research Board, Washington, DC, USA, 6–7 December 1934; National Research Council: Washington, DC, USA, 1935; Volume 14, pp. 448–477. [Google Scholar]
  50. Greenberg, H. An analysis of traffic flow. Oper. Res. 1959, 7, 79–85. [Google Scholar] [CrossRef]
  51. Drake, J.S. A statistical analysis of speed density hypothesis. HRR 1967, 154, 53–87. [Google Scholar]
  52. Joshi, G.; Sinha, V.; Patel, J. Heterogeneous traffic characterisation and flow behaviour modeling for metropolitan arterial in India. J. East. Asia Soc. Transp. Stud. 2011, 9, 1684–1699. [Google Scholar]
  53. Kurniati, T.; Purnawan, P.; Yosritzal, Y.; Putri, E.E.; Alfaroji, A. The study of speed-volume-density relationships with various motorcycles volume percentages. In AIP Conference Proceedings; AIP Publishing: Melville, NY, USA, 2024; Volume 2891. [Google Scholar]
  54. Saha, A.; Chandra, S.; Ghosh, I. Assessment of level of service for urban signalized intersections in India. Curr. Sci. 2019, 117, 1516–1521. [Google Scholar] [CrossRef]
  55. Minh, C.C.; Sano, K.; Matsumoto, S. The speed, flow and headway analyses of motorcycle traffic. J. East. Asia Soc. Transp. Stud. 2005, 6, 1496–1508. [Google Scholar]
  56. Das, A.K.; Bhuyan, P.K. Hardcl method for defining LOS criteria of urban streets. Int. J. Civ. Eng. 2017, 15, 1077–1086. [Google Scholar] [CrossRef]
  57. Bhat, C.R. A heteroscedastic extreme value model of intercity travel mode choice. Transp. Res. Part B Methodol. 1995, 29, 471–483. [Google Scholar] [CrossRef]
  58. Patnaik, A.K.; Bhuyan, P.K.; Rao, K.K. Divisive Analysis (DIANA) of hierarchical clustering and GPS data for level of service criteria of urban streets. Alex. Eng. J. 2016, 55, 407–418. [Google Scholar] [CrossRef]
  59. Vivek, A.K.; Mohapatra, S.S.; Jena, S. Evaluation of user perception to define level of service criteria of rail road grade crossing: An exploratory statistical approach. Transp. Policy 2022, 122, 64–76. [Google Scholar] [CrossRef]
  60. Choocharukul, K.; Sinha, K.C.; Mannering, F.L. User perceptions and engineering definitions of highway level of service: An exploratory statistical comparison. Transp. Res. Part A Policy Pract. 2004, 38, 677–689. [Google Scholar] [CrossRef]
  61. Arellana, J.; Fuentes, L.; Cantillo, J.; Alvarez, V. Multivariate analysis of user perceptions about the serviceability of urban roads: Case of Barranquilla. Int. J. Pavement Eng. 2021, 22, 54–63. [Google Scholar] [CrossRef]
  62. Rodriguez-Valencia, A.; Unda, R.; Paris, D.; Barrero, G.A.; Bocarejo, J.P. Comparing perception-based methods and traditional level of service for urban infrastructure evaluation: Bogotá’s road diet case study. Case Stud. Transp. Policy 2025, 19, 101354. [Google Scholar] [CrossRef]
  63. Othayoth, D.; Rao, K.K.; Bhavathrathan, B. Perceived level of service at signalized intersections under heterogeneous traffic conditions. Transp. A Transp. Sci. 2020, 16, 1294–1309. [Google Scholar] [CrossRef]
  64. Macioszek, E.; Tumminello, M.L. Simulating vehicle-to-vehicle communication at roundabouts. Transp. Probl. Int. Sci. J. 2024, 19, 45–57. [Google Scholar] [CrossRef]
Figure 1. The selected segment of University Road for traffic data collection.
Sustainability 17 05126 g001
Figure 2. Traffic composition on University Road.
Sustainability 17 05126 g002
Figure 3. Fundamental speed–density diagram for University Road. Each blue dot represents one data point, which is the speed corresponding to traffic density.
Sustainability 17 05126 g003
Figure 4. Fundamental diagram of flow–density for University Road.
Sustainability 17 05126 g004
Figure 5. Clusters for LOS criteria development.
Sustainability 17 05126 g005
Table 1. Indian and United States HCM criteria for LOS of urban streets [10,30].
Level of Service Indian HCM US-HCM
Volume/Capacity Ratio Travel Speed as Percentage of Free Flow Speed
LOS A<0.15>84>80
LOS B0.15–0.4583–76>67–80
LOS C0.46–0.7575–59>50–67
LOS D0.76–0.8558–41>40–50
LOS E0.86–1.0040–22>30–40
LOS F>1.00<22≤30
Table 2. Hourly traffic volume.
Time IntervalVolume (PCU/h)
7:00–8:002834
8:00–9:003233
17:00–18:005447
18:00–19:005698
Table 3. Summary of the speed–density model for heterogeneous traffic.
Model Free-Flow Speed
v f  (km/h)
Jam-Density  k j (PCU/km/ln)RMSE (km/h)R2
Greenshields [49] v = v f 1 k k j 643004.90.68
Greenberg [50] v = v m l n k j k -3405.00.66
Drake [51] v = v f e [ 1 2 k k m ] 57-5.30.72
Second-order v = v f + a k 2 + b k
a = 0.0001124
b = 0.1395
60-4.70.76
Table 4. Summary of statistics for cluster analysis of speed data.
Clusters NumberClusters Speed Ranges (kmph)Mean-Square for ClustersdfSignificance Value
158.6760–5227,016.08950.000
251.8952–44
344.1944–37
437.137–29
529.1129–17
617.6717
Table 5. Comparison of US HCM and Indian HCM with the local values.
Level of ServiceTravel Speed as a Percentage of Base Free Flow SpeedV/C (Indian HCM)V/C (Karachi)
US HCM-2022Indian HCM
LOS A>80>84<0.15<0.45
LOS B>67–80>76–840.15–0.450.45–0.63
LOS C>50–67>59–760.46–0.750.63–0.73
LOS D>40–50>41–590.76–0.850.73–0.83
LOS E>30–40>22–410.86–1.000.83–0.96
LOS F≤30≤22>1.00>0.96
Table 6. Comparison of Indian-HCM and US-HCM with the proposed HCM criteria.
Level of ServiceTravel Speed as Percentage of Base Free Flow SpeedVolume to Capacity Ratios
HCM-2022Indian HCMThis Research (University Road, Karachi)Indian HCMThis Research (University Road, Karachi)
LOS A>80> 84>87<0.15<0.41
LOS B>67–80>76–84>73–870.15–0.450.41–0.66
LOS C>50–67>59–76>62–730.46–0.750.66–0.72
LOS D>40–50>41–59>48–620.76–0.850.72–0.80
LOS E>30–40>22–41>28–480.86–1.000.80–0.92
LOS F≤30≤22≤28>1.00>0.92
Disclaimer/Publisher’s Note: The statements, opinions and data contained in all publications are solely those of the individual author(s) and contributor(s) and not of MDPI and/or the editor(s). MDPI and/or the editor(s) disclaim responsibility for any injury to people or property resulting from any ideas, methods, instructions or products referred to in the content.

