1. Introduction
The emergence of green financial markets has provided an effective mechanism for mobilizing environmentally friendly investments to combat climate change, rapidly evolving into a crucial tool for tackling ecological and environmental challenges. Specifically, they support low-carbon economic activities through various financial instruments, including green bonds, ESG investments, and carbon finance. These tools not only offer funding and incentives for the green transformation of traditional energy enterprises [
1], but also reinforce the broader shift towards sustainable development. Under China’s “dual carbon” goals, green finance plays an indispensable role in promoting clean energy investments and optimizing the national energy structure. As the world’s largest energy consumer and one of the fastest-growing green finance markets, China provides a compelling case for examining how financial mechanisms can facilitate energy transition under climate constraints [
2,
3].
However, the development of green finance currently faces several challenges stemming from its inherent characteristics. As a financial tool characterized by strong social benefits and public goods attributes, green finance generates significant positive externalities. Nevertheless, its long return cycles and high levels of uncertainty naturally conflict with the profit-driven logic of the financial industry, leading to low private capital participation and constraining the supply capacity of green finance. This issue not only increases the resistance to low-carbon transformation in traditional energy markets but also intensifies the tensions and frictions between traditional energy markets and green financial markets. The prolonged investment cycles and elevated uncertainty of green finance have intensified capital competition between traditional energy and green markets, thereby triggering risk spillovers. Yet, existing studies lack a systematic analysis of the cross-market risk transmission mechanisms between the two markets. Therefore, fostering positive interactions between traditional energy markets and green financial markets requires a clear understanding of the complex relationship between the two in China. Such understanding will not only help address key challenges in the ongoing energy transition but will also provide valuable insights for promoting synergistic market development between and safeguarding energy security.
In the process of promoting the transformation of traditional energy markets and the development of green financial markets, climate policies play a crucial role. As an essential tool for government regulation and market guidance, climate policies provide a policy framework for low-carbon technological innovation and green industry development through measures such as setting carbon reduction targets, offering fiscal support, and providing tax incentives. Since the successful signing of the Paris Agreement in 2016, an increasing number of countries have shifted their development strategies and actively formulated or adjusted various climate policies to facilitate energy transition and reduce carbon emissions, striving to achieve the shared vision of a “net-zero emissions” and “zero-carbon society” [
4]. These policies can lead to risk spillovers across energy, green finance, and related derivative markets by influencing market fundamentals and investor behavior, due to the hybrid nature of energy as a commodity, a geopolitical tool, and a financial asset [
5].
However, events such as the COVID-19 pandemic, the U.S. withdrawal from the Paris Agreement, and ongoing geopolitical conflicts have undermined the credibility of global climate commitments and have heightened policy uncertainty [
6]. This uncertainty disrupts supply–demand fundamentals, triggering substitution and demand effects that drive dynamic capital reallocation between traditional energy assets and green financial instruments, thereby intensifying cross-market interactions and risk transmission [
7].
Despite the gradual improvement of climate policies, unpredictable climate change, socio-economic pressures, and technological advancements, among other factors, have contributed to significant climate policy uncertainty [
8]. On the one hand, this high level of uncertainty makes it difficult for businesses and investors to predict market trends, potentially delaying investments in carbon-related projects and demanding higher risk premiums to compensate for potential policy-induced risks [
9,
10,
11]. On the other hand, it may trigger market panic, further amplifying irrational behaviors among businesses and investors, leading to significant price fluctuations in carbon-related markets. Ultimately, this complicates the risk transmission pathways between traditional energy markets and green financial markets [
12].
It is widely recognized that China’s economic and financial development is heavily influenced by policy. The increasing uncertainty surrounding climate policies is undoubtedly influencing the risk spillover dynamics between traditional energy markets and green financial markets. Against this backdrop, where addressing climate change and promoting green transition are critical for sustainable development, this study first employs the spillover index approach within the time-varying parameter vector autoregression (TVP-VAR) model to measure the risk spillovers and their dynamic evolution between traditional energy markets and green financial markets across different time and frequency domains. Furthermore, it constructs a Generalized Autoregressive Conditional Heteroskedasticity-Mixed Data Sampling (GARCH-MIDAS) model to reveal how climate policy uncertainty influences the dynamic risk spillover relationships between traditional energy markets and emerging green markets, which are closely tied to carbon emissions.
The findings of this study not only contribute to a deeper understanding of the impact of climate policy uncertainty on cross-market spillovers but also provide robust empirical evidence for climate policymakers. This research holds significant practical importance for maintaining market stability and effectively preventing and mitigating cross-market risk contagion.
The main contributions of this study are reflected in the following three aspects. First, this study is the first to incorporate climate policy uncertainty into the analysis of risk spillovers, addressing the gap in the existing literature, which primarily focuses on spillovers within either traditional energy markets or green financial markets independently. Recognizing the critical role of policy uncertainty in cross-market risk transmission, we explore the complex mechanisms through which it drives spillovers between these markets via a GARCH-MIDAS model that incorporates climate policy uncertainty. Our findings offer novel insights into the underlying drivers and structural complexities of extreme risk spillovers in highly interconnected financial systems.
Second, this paper employs the novel frequency-domain connectedness approach proposed by Baruník and Křehlík [
13] to simultaneously capture the time-varying and frequency-dependent risk spillovers between traditional energy markets and green financial markets. Taking into account the heterogeneity of market participants and the evolving nature of market conditions, the analysis reveals that spillover effects differ across frequencies. Specifically, it distinguishes between low-frequency components, which are of primary interest to regulators, and high-frequency components, which are more relevant to financial market participants.
Third, by integrating climate policy uncertainty into a unified framework for dynamic investment strategies, phased regulatory responses, and international policy coordination, this study provides actionable insights into how multi-frequency risk transmission and cross-border spillovers shape market behavior under evolving climate policy regimes. The findings offer valuable implications for both investment decision-making and regulatory strategies aimed at preventing and mitigating risk contagion between energy and green financial markets.
The rest of this paper is organized as follows. The Literature Review is in
Section 2. Theoretical Analysis is presented in
Section 3. The methodology and data are described in
Section 4 and
Section 5. Empirical results are presented and discussed in
Section 6. Finally, the conclusion is presented in
Section 7.
2. Literature Review
The excessive consumption of fossil fuels has led to resource depletion and environmental degradation, garnering widespread global attention [
14]. Pursuing sustainable, green, and low-carbon development has become a shared goal for countries worldwide [
15]. The increasing pressure for green transformation has stimulated the rapid growth of emerging green markets, as evidenced by the explosive growth in green bond issuance [
16], the gradual improvement and active trading in carbon emission markets, and the growing preference for green project investments [
17].
In the process of green transformation, although governments guide the strategic direction of green project development, the root of promoting green projects lies in achieving carbon reduction targets. The potential and long-term sustainability of green industries are closely linked to the traditional fossil fuel sector [
18]. Consequently, the development of green projects is often linked to traditional fossil energy [
19], resulting in a complex dynamic relationship between traditional energy markets and emerging green markets [
20].
In terms of dynamic correlations, the Copula model revealed a positive tail correlation between crude oil prices and green stock prices, indicating that both markets tend to rise and fall simultaneously due to information transmission [
21]. Further research using frequency-domain analysis showed that this correlation is weaker in the short term but strengthens over the long term [
22]. Additionally, a nonlinear autoregressive distributed lag (NARDL) model identified a positive short-term correlation and a negative long-term relationship between the two markets, highlighting their nonlinear dynamics over time [
23].
In terms of spillover effects, studies using the GARCH model show that green markets can serve as effective hedges for crude oil markets, allowing investors to combine crude oil futures and green stocks in portfolio strategies [
24]. Carbon assets, as green instruments, also offer risk-hedging benefits and portfolio diversification for energy commodity investors [
25]. Using the TVP-VAR-SV model and impulse response functions, research has found that risk spillovers between carbon and traditional energy markets are time-varying, typically lasting about three weeks and diminishing over time [
26]. However, under extreme events, the intensity of these spillovers increases significantly [
27]. For instance, during the COVID-19 pandemic, the green bond market exhibited strong spillover effects on energy markets, underscoring the critical role of extreme events in amplifying cross-market risk transmission [
28].
Compared to other types of shocks, climate change exhibits greater complexity and uncertainty [
29]. In recent years, the frequent occurrence of extreme weather events has drawn increasing attention from policymakers and stakeholders regarding the risks posed by climate change. Governments worldwide have introduced a series of climate policies in response to the commitments made under the Paris Agreement. However, due to the difficulty for market participants to fully anticipate the pilot programs and the intensity of these policies, the initiation and implementation pathways of climate policies remain highly uncertain. This uncertainty impacts the risks and returns of various related assets [
5,
30,
31]. Existing studies have partially revealed the impact of climate policy uncertainty on traditional energy markets [
12,
32,
33].
It was highlighted that climate policy shocks have significant time-varying effects on U.S. crude oil market prices [
34]. By examining impulse response graphs of crude oil prices to climate policy uncertainty (CPU) across different periods, the study found that the Bush administration’s declaration on the Kyoto Protocol in June 2001 and the failed vote on climate management in June 2005 reflected investors’ lack of attention to low-carbon environmental protection. Instead, these events reduced investor concerns about the prospects of traditional energy markets, leading to a positive effect of climate policy uncertainty on oil prices. However, from 2007 onward, following the U.S. EPA’s vehicle emissions legislation and subsequent climate policies, the push for green transformation reduced traditional energy demand, exacerbating the negative impact of climate policy uncertainty on crude oil markets. It was also noted that climate policy uncertainty has a greater influence on crude oil market volatility than other extreme shocks [
20]. Despite this, the effects of climate policies on oil markets unfold with a delay, with the most significant impact observed in the medium term due to the time lag in policy formulation and implementation.
At the same time, a small portion of the literature has focused on the impact of climate policy uncertainty on green markets, with scholars generally considering green markets as potential beneficiaries of such uncertainty. They have examined the differential effects of climate policy uncertainty (CPU) on green stock markets and green bond markets [
35]. Both green bond markets and green stock markets exhibit a positive correlation with the CPU index. However, green stock markets are more sensitive to fluctuations in the CPU index and provide a better hedge against climate policy risks compared to green bond markets.
Furthermore, climate policy uncertainty serves as a key driver of risk spillover effects within green financial markets [
9,
10]. It plays a significant role in shaping the interconnectedness and risk transmission dynamics across green financial markets.
Although existing studies have made notable progress in examining risk spillovers within either traditional energy or green financial markets, most have focused on intra-market dynamics and lack a systematic investigation into cross-market linkages under the influence of climate policy shocks. In particular, climate policy uncertainty (CPU)—as a potential source of systemic risk—has received insufficient attention in terms of its role in driving inter-market risk transmission, especially with regard to its time-varying and frequency-dependent characteristics. While prior research has explored the macroeconomic impacts of emission reduction scenarios and regional policy variations [
36,
37], few empirical studies have incorporated CPU as a structural determinant of market interconnectedness. To bridge this gap, this study is the first to integrate CPU into a combined GARCH-MIDAS and frequency-domain connectedness framework, enabling a comprehensive analysis of its dynamic influence on extreme risk spillovers between traditional energy and green financial markets across short-, medium-, and long-term horizons.
3. Theoretical Analysis
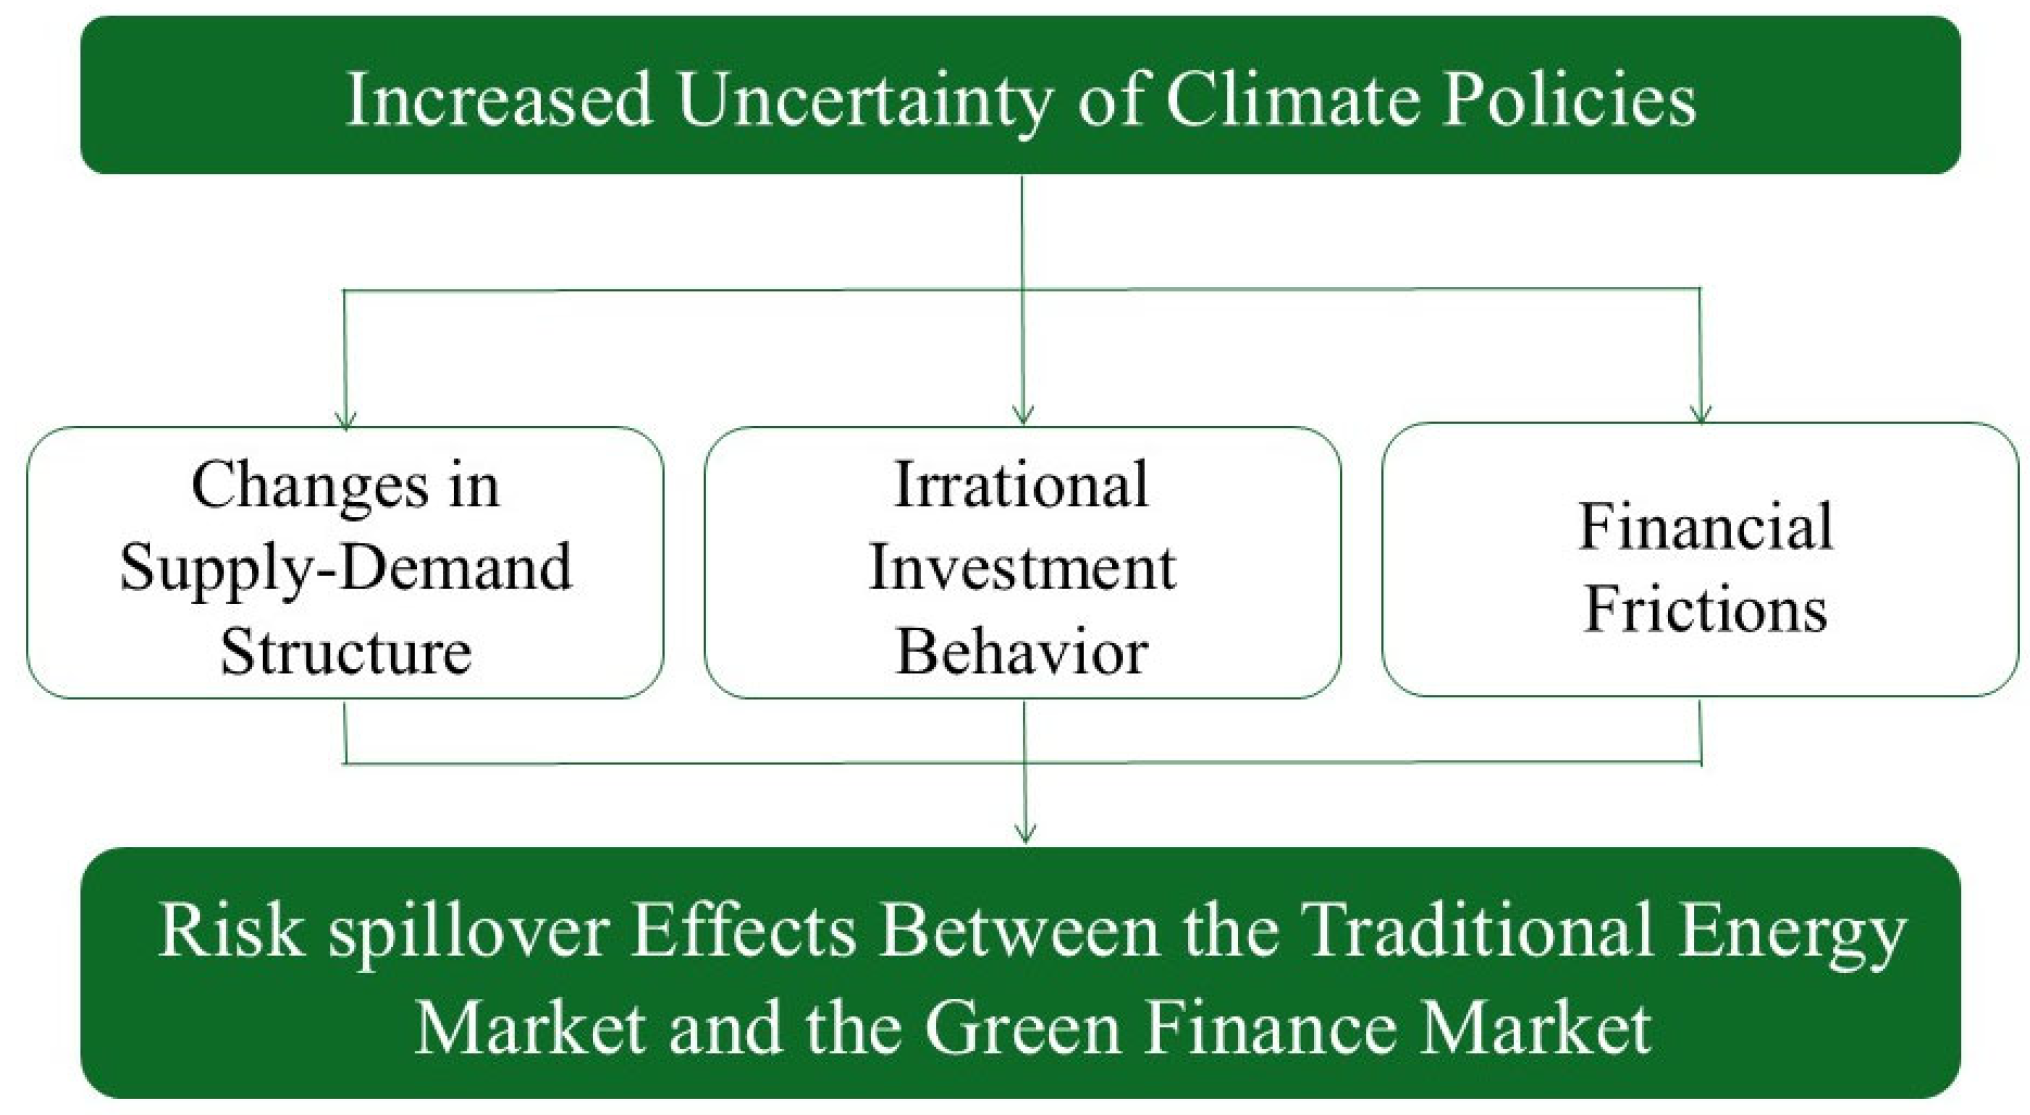
Climate change has become a core issue for governments worldwide. In response to this challenge, countries have implemented varying degrees of climate policies. However, the frequent adjustments and uncertainties surrounding these policies may trigger market volatility, significantly impacting both the energy and green finance markets [
31,
38]. The theoretical logic of the risk spillover relationship between climate policy uncertainty and both the energy and green finance markets is complex, which is explained through the following potential mechanisms (see
Figure 1).
First, the increased uncertainty of climate policies makes it difficult for market participants to predict future policy directions, resulting in significant changes in the supply–demand structure of the energy and green finance markets. This, in turn, heightens the risk interlinkages between markets [
39,
40,
41]. Energy-related enterprises typically base their investment decisions on anticipated demand. However, when climate policies are frequently adjusted, companies find it challenging to accurately predict future market demand, leading to delays or adjustments in investment decisions. Additionally, increased uncertainty in climate policies directly affects the flow of funds and investment decisions in the green finance market. Investors may divert funds toward green projects rather than traditional high-carbon projects, further exacerbating the capital shortage in traditional energy markets [
42].
Second, according to behavioral finance theory, investors are not rational individuals and are often influenced by the external environment when making investment decisions. When climate policies face high uncertainty, investors’ sensitivity to and aversion towards unknown risks also increase, leading to more pronounced irrational investment behaviors. When investors believe that the market fundamentals deviate from their expectations, they tend to over—or under—react to information, ultimately disrupting their investment decisions and influencing the level of risk spillover between markets [
43]. When governments implement strong climate policies to drive the transformation of traditional energy markets, investors, influenced by the herd effect, may mimic the strategies of other investors and enter the energy and green finance markets, triggering substantial market price volatility [
44,
45]. Simultaneously, increased speculative behavior in the market further intensifies irrational fluctuations in asset prices, making risk spillover effects across markets more pronounced.
Furthermore, it was also pointed out that climate policymakers fail to send clear signals to the market, which exacerbates the financial frictions between enterprises and the market [
46]. As a result, under the condition of climate policy uncertainty, the financing difficulties of enterprises increases, which undoubtedly poses certain obstacles to enterprises’ investment in energy and green projects and increases the non-diversifiable risks in the energy market and the green finance market. In view of this, this paper argues that the increasing uncertainty of climate policies has become the main factor leading to the intensification of risk spillover in environment-oriented markets.
4. Methodology
4.1. TVP-VAR-DY Model
Given the limitations of the rolling window VAR method, such as the loss of observations and sensitivity of parameters to outliers in the selection of rolling window periods, this study adopts the time-domain and frequency-domain TVP-VAR-DY model [
13,
47] to analyze the risk spillover effects between energy markets and green financial markets. The specific form of the constructed p-th order TVP-VAR model is as follows:
In Equations (1) and (2),
represents an
conditional vector,
is an
time-varying coefficient matrix,
denotes the lag order, and
and
are random error terms. When the TVP-VAR model satisfies the stationarity condition, the Wold representation theorem is applied to transform it into an infinite-order time-varying vector moving average (TVP-VMA) process, as shown in Equation (3):
Here,
represents the identity matrix, and the coefficients
in the TVP-VMA equation are crucial for calculating the generalized forecast error variance decomposition (GFEVD). These coefficients allow us to determine the proportion of the forecast error variance of one variable attributable to another variable. Subsequently, this study employs a Kalman filter method incorporating multiple forgetting factors to estimate the above equations, thereby computing the time-varying coefficient matrix and variance-covariance matrix of the error terms. This enables the derivation of the generalized forecast error variance decomposition formula for the time-domain TVP-VAR model over a forecast horizon H:
In Equation (4),
represents the contribution of the j-th variable to the forecast error variance of the i-th variable at the forecast horizon H.
is the
coefficient matrix corresponding to the h-th lag.
is the basis vector, where the i-th element is 1 and all other elements are 0.
is the covariance matrix of
, and
denotes the j-th diagonal element of
. By normalizing Equation (4), we obtain:
Here, and , can be interpreted as the normalized spillover from variable j to variable i.
Given that economic activities exhibit certain cyclical patterns and investors have varying risk preferences, this study introduces a frequency-domain TVP-VAR spillover method to quantify risk spillovers between markets across different frequency bands. First, the coefficient matrix
is subjected to a Fourier transform, and the frequency response function is defined as follows:
In Equation (6),
represents the frequency, and
. The spectral density of
at frequency
, denoted as
is given by
Furthermore, by applying the spectral density function, the generalized causal spectrum at frequency
can be obtained as follows:
Here,
represents the portion of the variation in variable i attributable to shocks from variable j at a given frequency
. To construct the weighting function, the frequency share of the variance of variable i, denoted as
, is introduced as follows:
Within a specific frequency band d, the generalized forecast error variance decomposition can be expressed as:
By normalizing Equation (10), we obtain:
Based on Equations (5) and (11), the total spillover index and the directional spillover indices can be derived. The definitions of the spillover indices are summarized in
Table 1 as follows:
This study defines different investment horizons as follows: 1–5 days as the short term, 5–30 days as the medium term, and more than 30 days as the long term. We follow the approach of [
48], the optimal lag order for the TVP-VAR model is selected as 1, and the forecast horizon HH is set to 100 days ahead.
4.2. GARCH-MIDAS-CCPU Model
The inconsistency between the data frequency of climate policy uncertainty and that of the spillover index, and the fact that the co-frequency method of reducing the frequency of high-frequency data may lead to the loss of the original high-frequency information of the market, may result in biased parameter estimation results. To overcome this problem, the GARCH-MIDAS model adopts a mixed-frequency approach to investigate whether the low-frequency climate policy uncertainty affects the risk spillover among high-frequency markets [
49]. This approach is highly suitable for handling multiple variables with different sampling frequencies, ensuring that no data or information is lost during the process [
50]. Specifically, this paper defines the GARCH-MIDAS-CCPU model as follows:
Among them,
represents the rate of change in the spillover index between the energy market and the green finance market on the i-th day of month t.
represents the conditional expectation of
. The conditional variance is divided into the long-term component
of the volatility of the inter-market spillover index and the short-term component
of the volatility of the inter-market spillover index.
denotes the number of days in month t.
, where
represents the set of historical information available up to the (i − 1)-th day of month t. For the short-term component
, it follows the GARCH(1,1) process, which is specifically as follows:
In Equation (13),
and
represent the ARCH term and the GARCH term, respectively, with the requirements that
and
. The long-term component
can be described based on the exogenous variable of climate policy uncertainty
as follows:
Among them, K represents the maximum lag order of the climate policy uncertainty
,
is the intercept term, and
is the MIDAS slope coefficient. If
is significantly different from 0, it indicates that
is affected by
.
is the weight equation constructed based on the Beta function, and its specific expression is as follows:
In order to ensure that the weights of the lag terms take a decaying form, this study follows the approach [
49] and simplifies the parameters. In model estimation, we set
, and the decay rate from the low-frequency variable to the long-term component is solely determined by
, so that
and
, where
represents the decay rate. At this time, the weight equation can be written as:
When estimating the model parameters, the method used is the maximum-likelihood estimation method. The obtained maximum-likelihood function is:
5. Data and Description
5.1. Data and Variable Selection
To examine the risk spillover effect between China’s energy market and green finance market, this paper selects representative market indices or prices and uses daily time—series data. Specifically, for the energy market (ENERGY), following the variable selection method [
51], the Shanghai Stock Exchange Energy Index is used as a proxy variable. This index includes companies engaged in traditional energy sectors such as oil, natural gas, coal, and related industries, which are key components of the energy market. The sample holdings of the index show the following industry breakdown: coal (45.06%), integrated oil and natural gas companies (25.75%), coke (9.48%), fuel refining (8.67%), oilfield services (4.82%), oil and gas circulation and others (4.00%), oil and gas extraction (1.12%), and natural gas processing (1.10%).
Regarding the green finance market, according to the definition of the G20 Green Finance Study Group, green finance refers to investment and financing activities that can generate environmental benefits to support sustainable development goals, rather than a single financial product or tool. Currently, most scholars use a single green bond market to represent the green finance market, which has certain limitations. Therefore, this paper follows the practices of previous studies [
52,
53,
54], and considering the data availability, divides the green finance market into the green bond market, the climate bond market, the ESG investment market, and the carbon trading market. Among them, the ChinaBond-China Green Bond Index is selected as the proxy variable for the green bond market; the ChinaBond-China Climate-related Bond Index is used as the representative of climate bonds in the climate bond market; and the CSI ECPI ESG Sustainable Development 40 Index is adopted as the proxy variable for the ESG investment market [
55].
Meanwhile, considering that trading data need to provide in-depth and useful information, this paper selects the Guangdong Carbon Emission Trading Market (GDEA), which has more trading records and higher liquidity, as the representative of China’s carbon trading market. Compared with other carbon trading markets in China, the GDEA ranks first in terms of transaction volume and turnover among all pilot regions. Its trading scale is gradually expanding, and the trading is active, objectively reflecting the supply–demand relationship in China’s carbon trading market [
12].
In addition, this paper uses the China Climate Policy Uncertainty Index (CCPU) [
56] to measure the uncertainty caused by climate policy changes. This index is based on the data from six authoritative newspapers, namely People’s Daily, GuangMing Daily, Economic Daily, Global Times, Science and Technology Daily, and China News Service. Through the MacBERT deep-learning algorithm model, the judgment phrases of news related to CCPU are screened out. After classifying the climate-policy news and counting the monthly quantity, the data are standardized. The CCPU index effectively reflects the uncertainty level of China’s climate policies and can be used to study the impacts and consequences of China’s climate policy uncertainty.
The price data of all markets are sourced from the WIND database. Considering the incomplete development of China’s carbon trading market in its early stage and taking into account the continuity and consistency of the sample data, this paper selects the research period from 14 March 2014 to 31 December 2023. After data pre-processing, a total of 2136 observations were obtained. Furthermore, this paper defines the daily logarithmic returns of the energy market and the green finance market as .
5.2. Descriptive Statistics
Table 2 summarizes the descriptive statistical characteristics of all return series during the research period. By comparing the standard deviations of each series, it is clear that the green bond market has the largest standard deviation of 8.721, indicating that its overall volatility level of returns is higher than that of other markets. The skewness of all return series is less than 0, indicating a left-skewed distribution and showing obvious asymmetric characteristics. The kurtosis of all series is greater than 3, indicating that the series has the characteristics of leptokurtosis and fat tails. The Jarque–Bera test rejects the null hypothesis at the 1% significance level, further confirming that the return series do not follow a normal distribution.
Meanwhile, the
p-values for both the ADF and PP tests are less than 0.0001, indicating that all series are stationary. The Ljung–Box Q statistic was used to test the autocorrelation of the series. The test results in
Table 2 show that all series have significant autocorrelation. Therefore, in the first part of this study, the TVP-VAR model is appropriate for testing the dynamic associations between markets.
6. Empirical Results and Discussion
6.1. Analysis of Static Risk Spillover Effects Between the Energy Market and the Green Finance Market
(1) Analysis of the time-domain risk spillover effects between the energy market and the green finance market
This paper estimates the risk spillover between the energy and green finance markets over the entire sample period using the TVP-VAR-DY model (
Table 3). The results show that approximately 37.14% of the risk prediction error variance between the two markets can be attributed to spillovers, indicating a strong correlation between the traditional energy market and the emerging green market [
59].
Further analysis reveals that the volatility spillovers from the energy market, green bond market, and ESG investment market exceed the spill-in effects, resulting in a net spillover. Notably, the green bond market accounts for 53.10% of the spillover to other markets, positioning it as a central node in risk contagion. Due to its significant capital inflows and close ties to energy and low-carbon industries, the green bond market can amplify systemic risks during extreme shocks. In contrast, the climate bond and carbon trading markets are net recipients of risk spillovers, with values of −0.58% and −4.01%, respectively. This suggests these markets, being relatively underdeveloped and structurally immature, are more susceptible to external shocks.
Directional spillover effects show that the green market spills over 37.84% of risk to the energy market, with the ESG market being the primary source of spillover, contributing 32.60%. The energy market also has the largest spillover effect on ESG investments, at 32.49%. These strong linkages reflect both market sentiment and global policy uncertainty [
60]. Moreover, the green and climate bond markets exhibit strong spillover effects, reflecting their close relationship. As both belong to the bond market and support similar investment projects, their risk fluctuations are highly interconnected.
(2) Analysis of Frequency—Domain Risk Spillover Effects between the Energy Market and the Green Finance Market
Table 4 shows the average directional connectivity between the energy and green markets at different time frequencies. Total connectivity declines from 26.05% at the short-term frequency to 2.57% at the long-term frequency, indicating that the interaction between the two markets is mainly driven by short-term dynamics. High-frequency spillovers reflect investors’ immediate responses to policy changes, while low-frequency spillovers capture long-term energy transition trends, as the market adjusts to sustained policy and structural shifts.
Regarding the net spillover index, the carbon market remains a net recipient of risks at both short- and medium-to-long-term frequencies, suggesting its role as an effective risk-hedging asset. As the market matures, its capacity to bear risk gradually improves. For the climate bond and ESG investment markets, risk spillover effects vary by frequency. In the short term, the ESG market is a net recipient, while the climate bond market is a net emitter. However, in the medium-to-long term, the climate bond market becomes a net recipient. These findings highlight the varying risk contagion characteristics across different time horizons.
Thus, regulatory authorities and investors must tailor decisions based on specific time frames. This analysis provides valuable insights into the dynamic risk relationships between markets, helping policymakers adopt appropriate measures to manage risk transmission during the energy transition.
6.2. Analysis of Dynamic Risk Spillover Effects Between the Energy Market and the Green Finance Market
The previous static spillover analysis reveals the direction and intensity of risk spillovers between the energy and green finance markets. However, it does not capture the temporal dynamics of these spillovers. Therefore, this paper further examines the time-varying nature of the spillover effects between these markets.
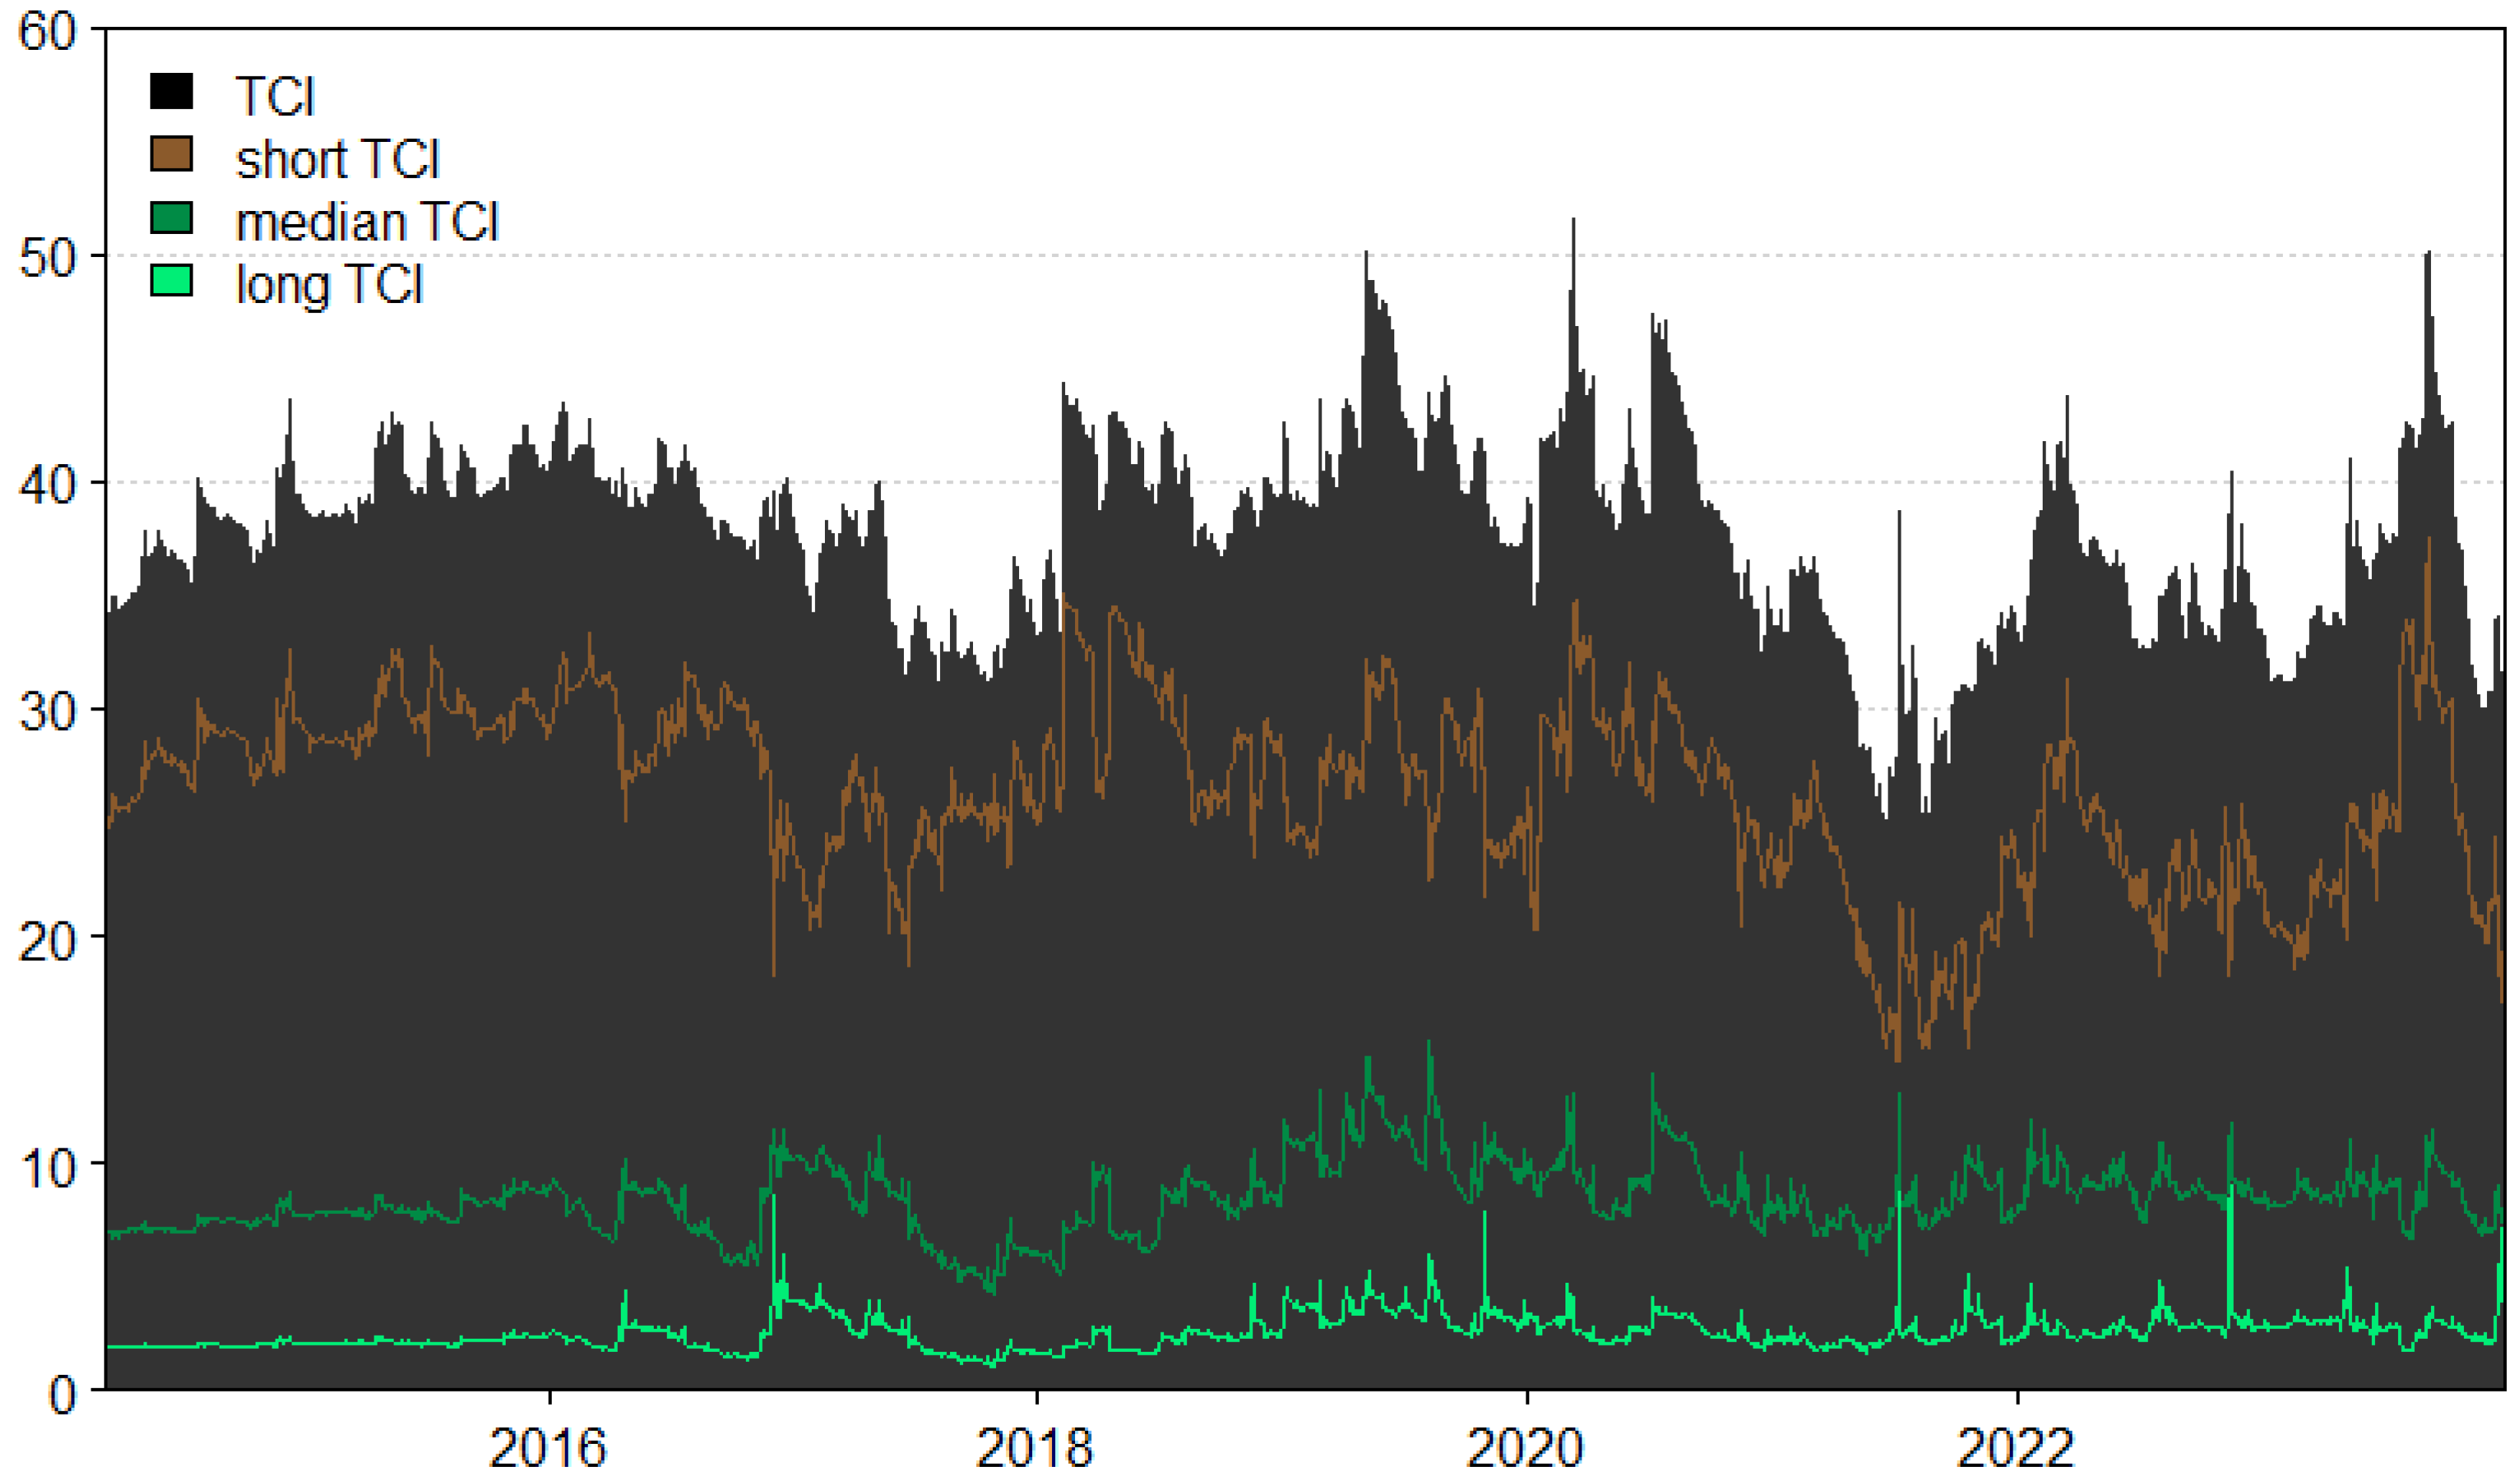
Figure 2 shows the evolving total spillover levels between the energy and green markets across different time horizons. While the overall patterns of spillover are similar across time frequencies, the degree of spillover is notably higher in the short-term, high-frequency range compared to the medium- and long-term, low-frequency range. This supports the notion that short-term shocks predominantly drive spillover effects. High-frequency spillovers reflect investors’ immediate responses to policy news, while low-frequency spillovers capture long-term energy transition trends. To ensure robustness, we tested the spillover models with a lag order of 2.
Figure A1 presents the results of this modification, which are consistent with those in
Figure 1.
The risk spillover effects between the energy and green finance markets exhibit notable time-varying characteristics, especially during key policy events and external shocks. Significant fluctuations in spillover levels are observed during events such as the Paris Agreement (2015), the US–China trade war (2018), China’s dual-carbon targets (2020), and the Russia–Ukraine conflict (2022). For instance, the Paris Agreement’s global temperature control goals shifted capital toward green markets, driving structural changes in market behavior and increasing spillover effects between the energy and green markets [
61]. Similarly, geopolitical events like the US–China trade war and the Russia–Ukraine conflict heightened market uncertainty, disrupted supply chains, and amplified risk spillovers between the two markets [
55,
62,
63]. In contrast, China’s dual-carbon targets clarified future carbon reduction goals, stabilizing investor sentiment and reducing spillover effects [
64,
65].
Investor behavior also plays a significant role in these spillovers. In the short term, high-frequency spillovers driven by policy changes or crises exhibit greater volatility. For example, the COVID-19 pandemic triggered an economic downturn and sharp declines in traditional energy prices, leading to adjustments in investor portfolios [
66,
67,
68]. In contrast, low-frequency spillovers reflect long-term market adjustments, driven by sustained policies and structural shifts. These spillovers are less volatile and more influenced by investor confidence in the long-term prospects of green finance, as seen with the launch of China’s carbon market and the clarification of long-term carbon reduction targets [
65].
In conclusion, risk spillovers between the energy and green financial markets are driven by both policy changes and investor behavior. Climate-related policies are central to these spillovers, and further research is needed to understand how climate policy risks impact the relationship between these markets, aiding policymakers and market participants in managing the effects of climate change.
6.3. Impact of Climate Policy Uncertainty on the Risk Spillover Effect Between the Energy Market and the Green Finance Market
In this section, the time-domain and frequency-domain GARCH-MIDAS-CCPU models are constructed to analyze the risk spillover effect between the energy market and the green finance market. According to
Table 5, both the ARCH term (
) and the GARCH term (
) in the GARCH component are statistically significant at the 1% level, and
< 1. This indicates that there is volatility clustering and volatility persistence between the energy market and the green finance market, and the GARCH process is stable, which verifies the stability of the constructed GARCH-MIDAS-CCPU model.
In addition, all estimated values of the adjusted beta weights are greater than 1 and statistically significant at the 1% level. This indicates that recent data have a greater impact on market risk spillovers. Recent observations carry higher weights in the weighting process, indicating that short-term shocks exert a stronger effect on the risk spillover between the energy market and the green finance market.
Through the statistical significance test of the slope coefficient, it is found that the θ parameters in all models reject the null hypothesis at the 1% significance level and are significantly positive. This indicates that climate policy uncertainty is an important factor affecting the risk spillover between the energy market and the green finance market, and an increase in climate policy uncertainty intensifies the risk of spillover between markets. This phenomenon may be due to changes in climate policies having an impact on investment decisions and corporate financing constraints, which in turn leads to changes in the risk spillover level between the energy market and the green finance market.
Furthermore, this paper compares the impact of climate policy uncertainty on the risk spillover between the energy market and the green finance market under different frequency domains. The results indicate that the impact of climate policy uncertainty on the spillover risk between markets varies across different time horizons. By comparing the magnitudes of the coefficients, it can be observed that this impact shows a distinct inverted U-shaped pattern from the short-term to the long-term, meaning the impact of climate policy uncertainty first increases and then weakens over time. A possible explanation for this phenomenon is that when climate-related policies are newly introduced or changed, the market requires time to digest and understand this information. Due to the lag in information transmission, reception, and transformation into value signals, the impact of short-term climate policy shocks is not fully reflected in market reactions. During this period, investors are more likely to be influenced by their own emotions, and at this time, the impact of climate policy uncertainty on the market is limited.
In the medium term, market participants have fully assimilated the changes in climate-related policies. Therefore, the coefficient reaches its maximum value of 37.362 and is significant at the 1% level. This indicates that the market reacts most strongly to climate policy uncertainty during this period, and the spillover risk effect is the greatest.
However, as time passes, the policy uncertainty is gradually absorbed by the market. Investors have a clearer expectation of the long-term impact of policies. The market reaction tends to be rational and stable, with irrational behavior in the long-term market gradually diminishing, and the impact of policy shocks is relatively mitigated compared to the medium-term.
Additionally, we re-examined the results using lag periods of K = 6 and K = 24, who set a lag period of 12 as the baseline [
69,
70]. The results for the robustness checks with lags of 6 and 24 are presented in
Table A1.
7. Conclusions
Addressing the complex and constantly evolving issue of climate change has now become a major and urgent global challenge. Economies around the world widely acknowledge that achieving low-carbon transformation is crucial for mitigating climate change, promoting environmental sustainability, and safeguarding global public well-being. However, there is still considerable uncertainty in the planning and implementation of climate policies.
Against this backdrop, this study first examines the risk spillover effect between the traditional energy market and the green finance market based on the TVP-VAR-DY method. It captures the dynamic evolution characteristics of the risk spillover between markets from both the time-domain and frequency-domain perspectives and identifies the events that cause extreme risk spillovers between markets. Second, a GARCH-MIDAS-CCPU model incorporating climate policy uncertainty shocks is developed to evaluate the impact of climate policy uncertainty on the risk spillover between the traditional energy market and the green finance market in both the time-domain and frequency-domain dimensions. The main research conclusions are as follows:
First, a strong risk connectivity network has been formed between the energy market and the green finance market, with an overall average spillover index of 37.14%. From a temporal perspective, the total spillover effect exhibits significant time-varying characteristics, especially intensifying in response to major national climate policy events, indicating heightened risk linkages across markets.
Second, from a frequency domain perspective, short-term high-frequency risk spillovers (26.05%) substantially exceed medium- to long-term low-frequency spillovers (2.57%), indicating stronger short-term volatility transmission between markets and marked significant heterogeneity in spillover effects across different frequencies.
Third, climate policy uncertainty significantly influences the risk of spillovers between energy and green financial markets, as evidenced by a statistically significant slope coefficient of 32.227 at the 1% level in the GARCH-MIDAS-CCPU model. Notably, this impact follows a pronounced inverted U-shaped pattern over time, rising from the short term ( = 12.815) to peak in the medium term ( = 37.362) before tapering off in the long term ( = 23.180).
Based on these findings, the following policy recommendations are proposed:
First, for investors, it is imperative to adopt more targeted, refined, and frequency-aware dynamic investment strategies. Climate policy uncertainty indicators should be incorporated into asset allocation decision frameworks, with portfolio adjustments flexibly aligned to the intensity and frequency response characteristics of policy shocks. Investors can leverage the heterogeneous risk linkages between energy and green markets across different frequency bands to construct multi-frequency portfolio strategies that balance short-term volatility management with long-term stable returns. Furthermore, proactive monitoring of international climate policy developments and their potential spillover effects is essential to identify structural risk shocks and formulate preemptive risk mitigation measures.
Second, regulators should implement a phased policy response framework. In the short term, initial climate policy announcements often trigger market panic; therefore, enhancing forward-looking communication and managing policy expectations—through measures such as draft releases and regular policy briefings—can help stabilize market sentiment and curb short-term high-frequency risk spillovers. In the medium term, when policy uncertainty peaks, clarifying a clear medium- to long-term climate policy roadmap is crucial to improve policy transparency and stability, thereby mitigating volatility during the policy digestion phase. In the long term, institutionalizing policy buffering mechanisms—such as strengthening coordination of green financial regulation and establishing climate risk stress-testing systems—will enhance market resilience and reduce potential systemic risks at the institutional level.
Third, given the global interconnectedness of climate policies, strengthening international policy coordination is paramount. The European Union’s Carbon Border Adjustment Mechanism (CBAM) offers a valuable paradigm for international policy synergy. It is recommended that China actively align its domestic green policy framework with international climate governance mechanisms to enhance policy coherence and cross-border transmission stability, thereby mitigating spillover risks arising from policy frictions and contributing to the development of an orderly and stable global green transition.
Admittedly, while this study provides valuable insights into the risk spillovers between China’s energy market and green finance market under climate policy uncertainty, it is important to acknowledge certain limitations. First, the focus of this study is primarily on the Chinese market, and the conclusions may be influenced by regional factors. Future comparative studies could expand to other countries or regions, such as BRICS or OECD member states, to enhance the generalizability of the findings. Second, this study does not take into account the interconnections of international energy prices. Future research could further explore the cross-border spillover effects of climate policy uncertainty. Finally, given that different regional carbon markets may play distinct roles in risk spillovers, future studies could delve into how the design of carbon markets in various regions affects inter-market risk spillovers.


