Article

Spatio-Temporal Variations in Grassland Carrying Capacity Derived from Remote Sensing NPP in Mongolia

1
National Ecosystem Science Data Center, Institute of Geographic Sciences and Natural Resources Research, Chinese Academy of Sciences, Beijing 100101, China
2
University of Chinese Academy of Sciences, Beijing 100190, China
3
Institute of Geography and Geoecology, Mongolian Academy of Sciences, Ulaanbaatar 15170, Mongolia
4
College of Resources and Environment, University of Chinese Academy of Sciences, Beijing 100190, China
5
National Ecosystem Science Data Center, Beijing 100101, China
6
State Key Laboratory of Plant Diversity and Specialty Crops, Institute of Botany, Chinese Academy of Sciences, Beijing 100093, China
7
Botanic Garden and Research Institute, Mongolian Academy of Sciences, Ulaanbaatar 13330, Mongolia
8
Agency of Land Administration and Management, Geodesy and Cartography, Government building XII, Barilgachidiin Square, Ulaanbaatar 57170, Mongolia
*
Authors to whom correspondence should be addressed.
Sustainability 2025, 17(12), 5498; https://doi.org/10.3390/su17125498
Submission received: 10 April 2025 / Revised: 29 May 2025 / Accepted: 5 June 2025 / Published: 14 June 2025
(This article belongs to the Special Issue Remote Sensing for Sustainable Environmental Ecology)

Abstract

The escalation in the population of livestock coupled with inadequate precipitation has caused a reduction in pasture biomass, thereby resulting in diminished grassland carrying capacity (GCC) and pasture degradation. In this research, net primary productivity (NPP) data, sourced from the Global Land Surface Satellite (GLASS) and Moderate Resolution Imaging Spectroradiometer (MODIS) datasets from 1982 to 2020, were initially transformed into aboveground biomass (AGB) estimates. These estimates were subsequently utilized to evaluate and assess the long-term trends of GCC across Mongolia. The MODIS data indicated an upward trend in AGB from 2000 to 2020, whereas the GLASS data reflected a downward trend from 1982 to 2018. Between 1982 and 2020, climatic analysis uncovered robust positive correlations between AGB and precipitation (R > 0.80) and negative correlations with temperature (R < −0.60). These climatic alterations have led to a reduction in AGB, further impairing the regenerative capacity of grasslands. Concurrently, livestock numbers have generally increased since 1982, with a decrease in certain years due to dzud and summer drought, leading to the increase in the GCC. GCC assessment found that 37.5% of grasslands experienced severe overgrazing and 31.9–40.7% was within sustainable limits. Spatially, the eastern region of Mongolia could sustainably support current livestock numbers; the western and southern regions, as well as parts of northern Mongolia, have exhibited moderate to critical levels of grassland utilization. A detailed analysis of GCC dynamics and its climatic impacts would offer scientific support for policymakers in managing grasslands in the Mongolian Plateau.

1. Introduction

Grassland ecosystems, covering nearly 50% of the global terrestrial surface, are naturally distributed across all continents except Antarctica [1,2,3,4]. Grasslands deliver essential ecosystem services, supporting rich biodiversity, and underpinning the livelihoods of millions globally [5,6,7]. However, ecological integrity in these systems is increasingly threatened by pressures such as overgrazing, anthropogenic land-use modifications, and the accelerating impacts of climate changes [8,9]. Since the middle of the 20th century, grassland ecosystems have been subject to major environmental pressures due to climate changes and intensive and extensive human activities [10]. Studying the balance between grassland productivity and livestock production is essential to the ecological safety of grassland [11,12]. Defined as the maximum livestock numbers that the grassland resources of a given area can support sustainably [13], grassland carrying capacity (GCC) assessment is important for ensuring the balance of forage and livestock. Estimating GCC at the administrative unit level and vegetation zones is essential for effective livestock number management, ensuring the sustainable livelihoods of herders, and developing strategies for sustainable development.
Forage biomass is a key indicator of grassland health and also serves as a fundamental parameter in calculating GCC [14,15,16]. Considering the labor-intensive ground-based observations to measure aboveground biomass, remote sensing (RS) data has significant advantages in estimating biomass for future applications. Remote sensing via satellites was initiated in the late 1950s and further advanced during the early 1960s, with the first satellites launched in the early 1970s to collect data on Earth’s surface and its resources [17,18]. Satellite-based vegetation data, such as net primary productivity (NPP) and normalized difference vegetation index (NDVI), are widely used in grassland studies because of their advantages of frequent temporal coverage, global-scale applicability, and cost-effectiveness [19,20]. For example, grassland biomass was estimated by NDVI from 2010 to 2021 in the border area of Mongolia and China [21]. A framework for estimating grassland AGB and GCC has been established based on the Google Earth Engine (GEE) environment since 2000 [12]. The RS data of MODIS and Landsat are widely used for grassland biomass estimation due to their high spatial resolution. However, the time span of these data is relatively short (2000–2020). In order to support grassland management, long-term RS data such as GLASS product (1982–2020) and comparisons among different data sources should also be taken into consideration. Additionally, we should also untangle the complicated factors affecting GCC. Lines of evidence have shown that human impacts, such as overgrazing, agricultural expansion, forest utilization, and land cover changes, may contribute to grassland degradation [12,22]. Additionally, recent studies have shown that climate change, including global warming and alterations in precipitation regimes, has a significant impact on plant growth in grasslands [23,24,25]. Nevertheless, it remains essential for evaluating spatio-temporal variability in GCC and its driving forces in Mongolia.
In this study, based on aboveground biomass (AGB) derived from the NPP of two data sources (data verification and quality assessment has been performed according to the field-observed AGB), we estimate the GCC of Mongolia at the vegetation zones and administrative unit level. The main objectives were to (1) explore the temporal and spatial variation in AGB and its relation to climate factors across Mongolia; (2) estimate the correlation between multi-year average AGB from GLASS NPP and MODIS NPP products and their comparison to field studies; (3) quantitatively determine whether current livestock grazing levels exceed the theoretical GCC.

2. Materials and Methods
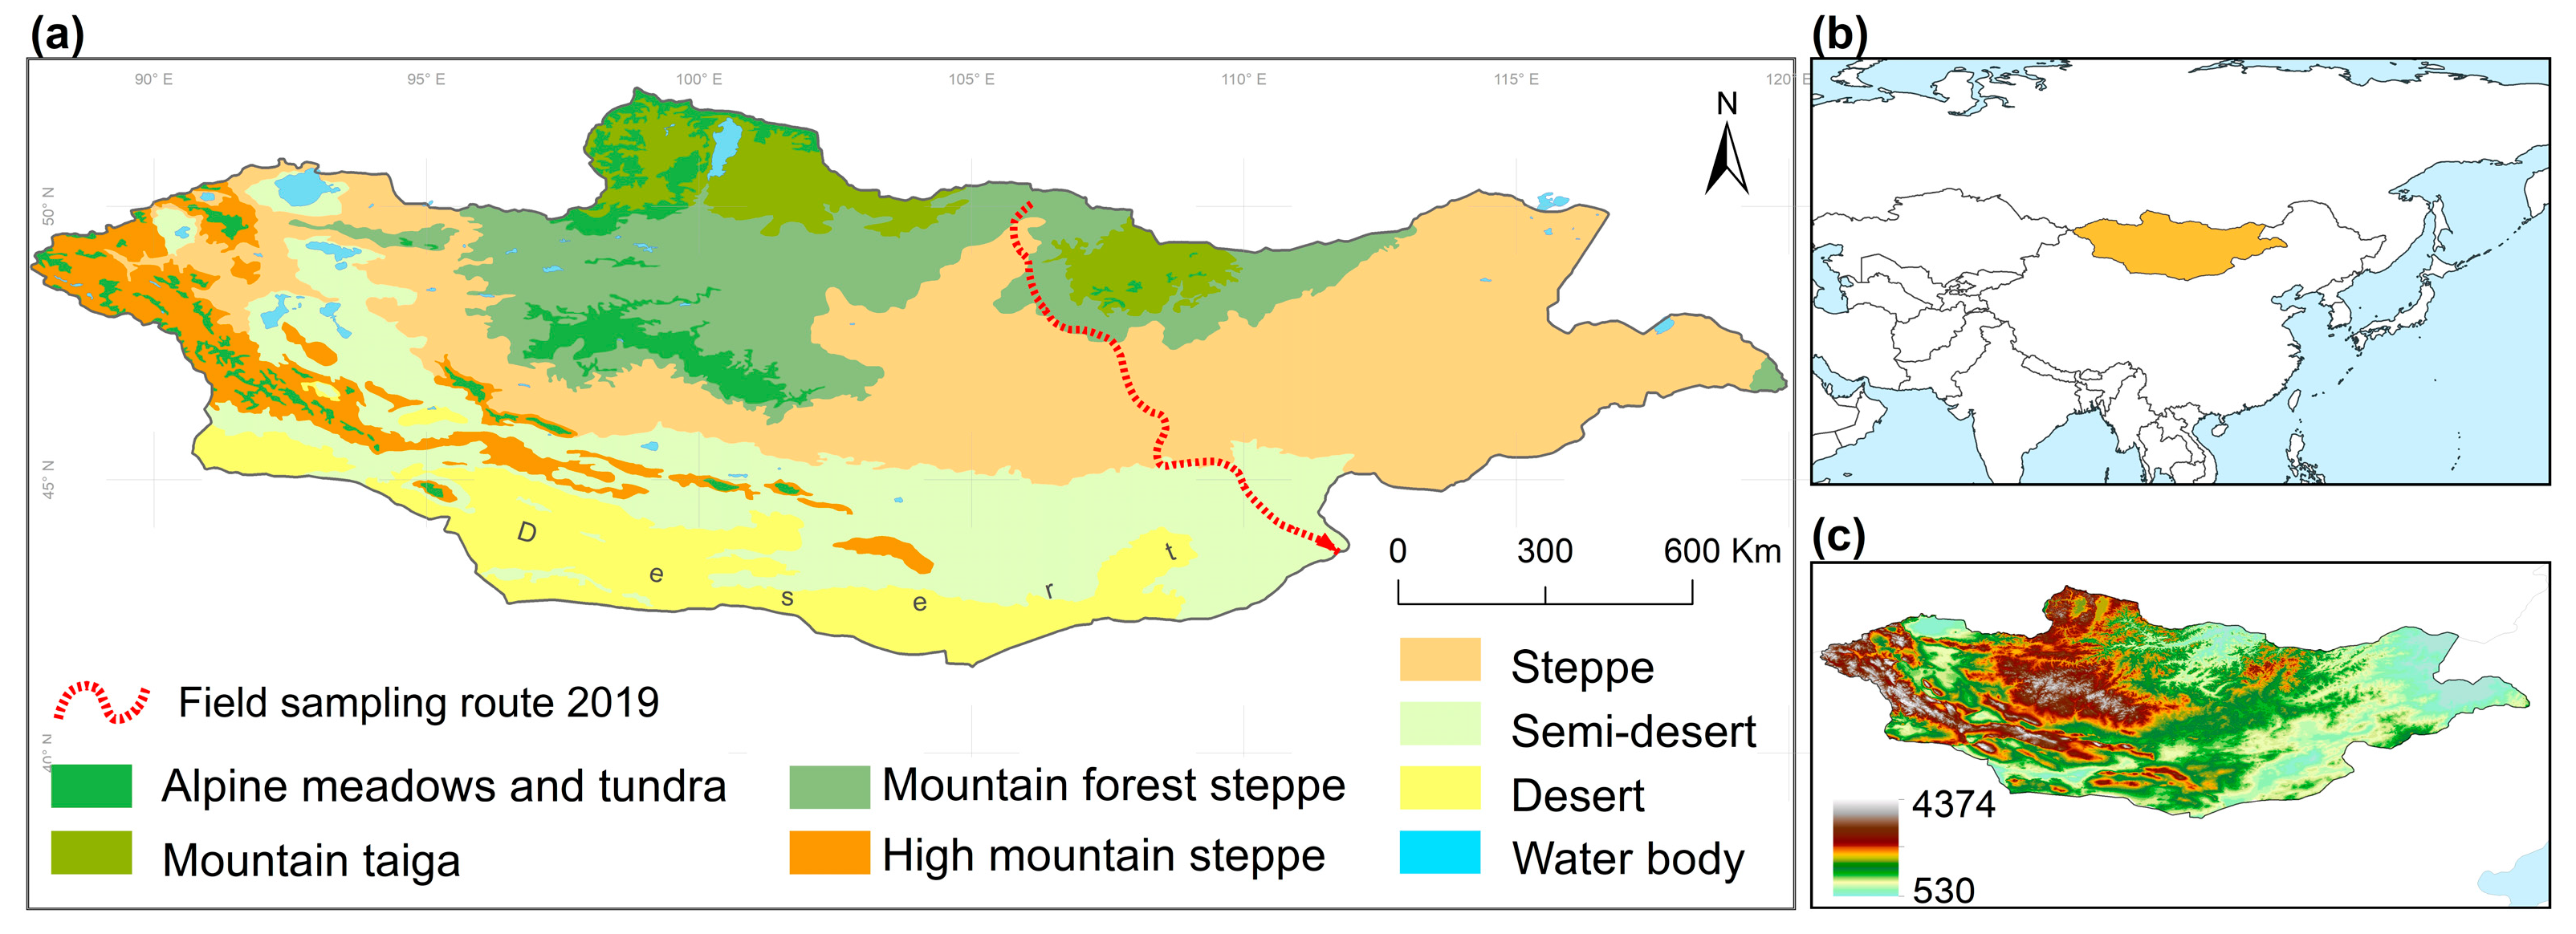
2.1. Study Area

Mongolia is a landlocked nation situated between China to the south and Russia to the north, with a land area of 1,564,000 km2 (40°30′–52°10′ N, 87°44′–119°58′ W). Most parts of Mongolia have a dry and cool continental monsoon climate. Mean annual precipitation is approximately 230 mm, of which 85–90% falls in summer [12]. The natural zones mainly include alpine meadows and tundra, mountain taiga, forest steppe, high mountain areas, steppe, semi-desert, desert and water bodies [26] (Figure 1). As of the end of 2020, grassland and forest, respectively, account for 73.4% and 9.2% of the total land area in Mongolia; the remaining 17.4% of land belongs to urban land (0.5%), roads and networks (0.3%), water bodies (0.4%), and other land cover [27]. The vast Mongolian steppes have preserved the tradition of nomadic pastoralism for a long time [28]. There is a population of 3.2 million, and 67.1 million head of livestock in 2020 (ca. 114.4 million sheep unit, SU).

2.2. Data Sources

Remote sensing products used in this study include the following: land surface temperature (LST), precipitation, and NPP from a Moderate Resolution Imaging Spectroradiometer (MODIS, MOD17) and Global LAnd Surface Satellite (GLASS.1982–2018). We obtained the statistics of all livestock numbers, grassland area and the classification of vegetation zones from the Agency of Land Administration and Management, Geodesy and Cartography and National Statistics Committee of Mongolia (https://1212.mn/en). The administrative unit is used as a soum border.

2.2.1. Climate Data

LST data are obtained from the National Aeronautics and Space Administration (NASA) (0.05°, MODIS/Terra LST Monthly L3 Version 041 (MOD11C3) https://lpdaac.usgs.gov/products/). Monthly average precipitation data from 1982 to 2020 were downloaded from cds.climate.copernicus.eu with a spatial resolution of 0.1° and they have been rescaled to 0.05°.

2.2.2. GLASS and MODIS Products
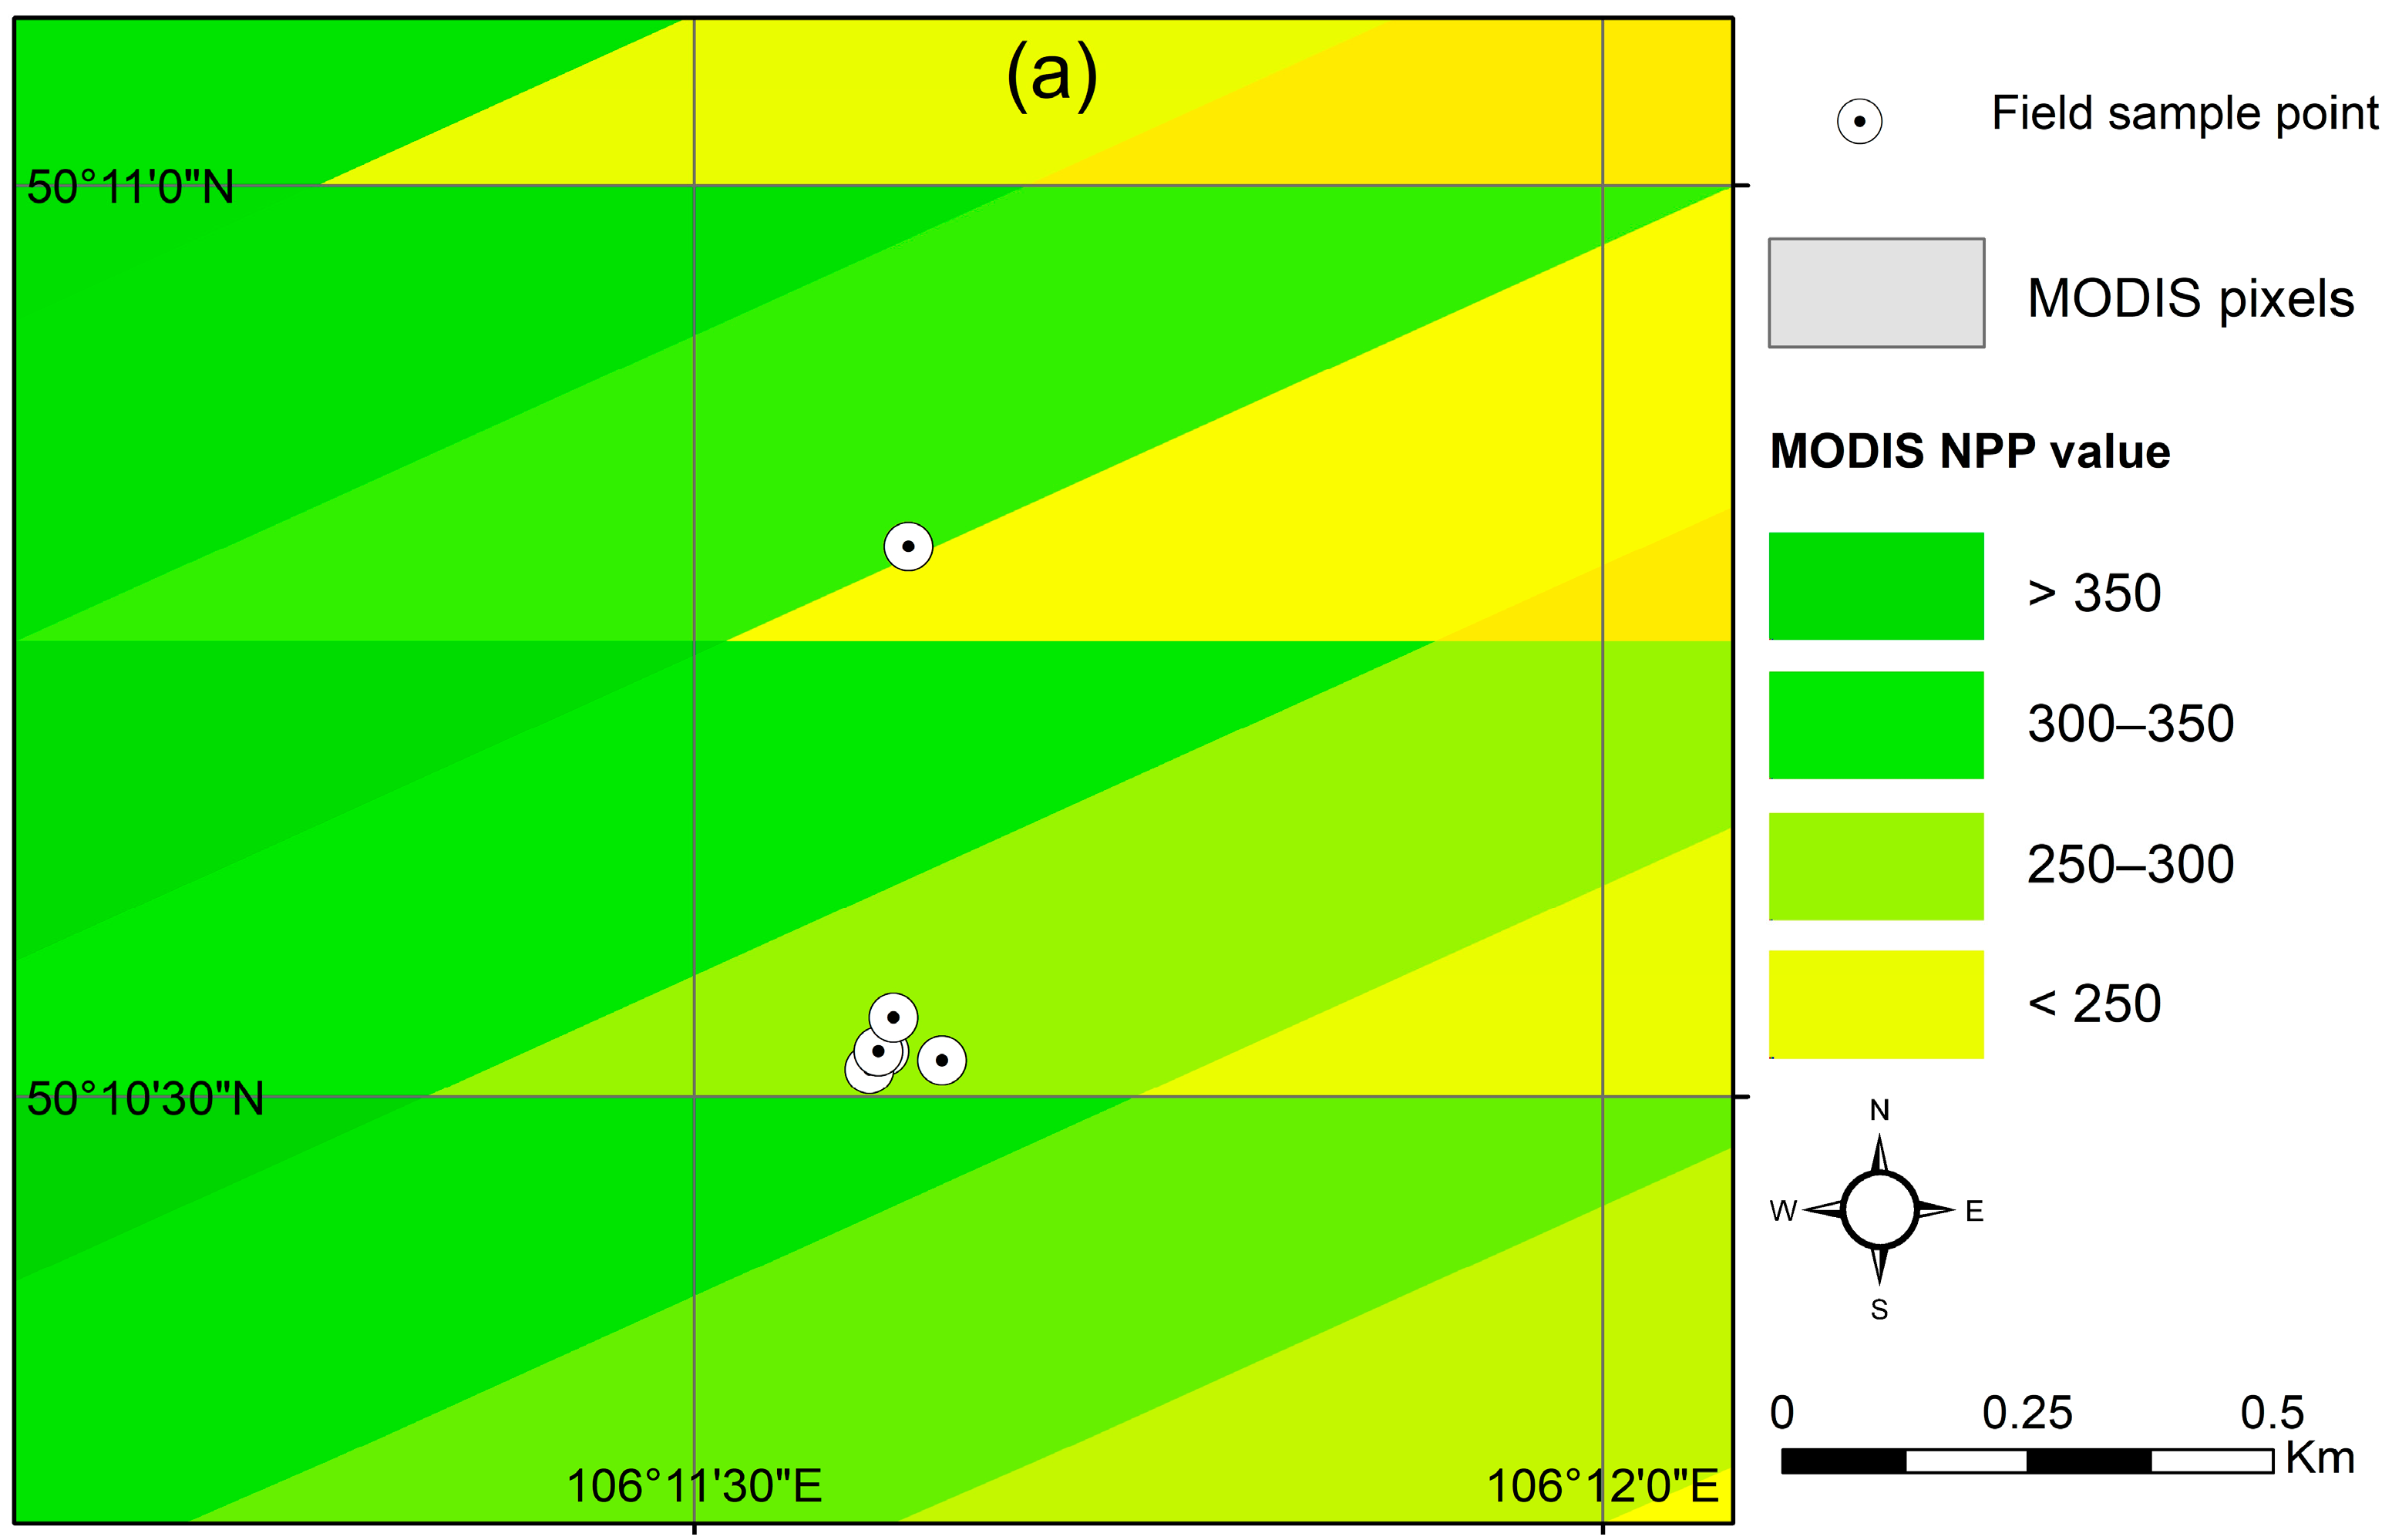
NPP is a useful product to accurately measure plant growth [29,30]. This study used the annual NPP products of GLASS. The GLASS NPP products were developed by [12], and these data are available online (http://www.glass.umd.edu/, 1982–2020). This study used the annual NPP products with a 0.05◦ spatial resolution. In order to improve the spatial resolution, we also used the MODIS NPP with a high spatial resolution (500 × 500 m, 2000–2020, http://www.glass.umd.edu/NPP/MODIS/500m/).

2.2.3. Field Data

In 2019, we collected 295 ground biomass samples along a 900 km stretch of railway in Mongolia (43–50° N). Samples were taken both inside the railway’s protective fence and from adjacent areas outside the fence. The sampling locations encompassed various grassland types, including forest steppe, steppe, semi-desert and desert regions (excluding the high mountain zone) (Figure 1). The above-ground biomass was harvested from 0.25 × 0.25 m2 areas, dried, and weighed. The geographic coordinates of each plot were recorded using a GPS device.

2.2.4. Vegetation Zone

The vegetation in the territory of Mongolia was first classified in 1950 by the Soviet scientist A.A. Yunatov and later in 1979 by Yunatov and Dashnyam, who made the 1:1,500,000 scale of the vegetation map of Mongolia. In this study, we used the vegetation categories of Mongolia [31], including high mountain, forest steppe, steppe, desert steppe and desert zones. The vegetation zone level is separated by the soum border. Within these zones, the annual vegetation biomass and daily grass biomass consumption per livestock are calculated differently.

2.3. Methodology

2.3.1. Estimation of Regional AGB

In order to estimate GCC, we firstly evaluated regional AGB from NPP products. Previous studies on AGB derived from GLASS data have demonstrated that this approach achieves reliable accuracy for analyzing plant growth trends and biomass fluctuations and evaluating carrying capacity across various spatial extents [32,33,34]. MODIS NPP data have also been validated and extensively applied in ecosystem productivity assessments and carbon flux analyses, and used in examining large-scale environmental transformations [34]. When directly converting NPP to biomass, some regions apply a straightforward conversion factor (fc) of 0.475, while in others, the conversion coefficient varies depending on geographic zone, plant species, climate, and environmental conditions [35,36,37,38,39] (Equation (1)). In this study, we applied an fc of 0.57 for forest and high mountain zones, 0.65 for steppe zones, and 0.67 for desert and desert steppe zones, based on the biomass estimation framework for each vegetation zone approved by the Government of Mongolia in 2019.
A G B = N P P / f c
In this study, propagation analysis was used to quantify the accuracy of NPP-evaluated AGB, accounting for spatial heterogeneity, sensor-specific biases, and regional productivity gradients. Based on the field observations of AGB (Section 2.2.3), we firstly obtained averaged AGB according to each corresponding MODIS pixel and then assessed the accuracy of the 2019 AGB predictions from NPP products. Error propagation analysis can be expressed as (Equation (2))
Δ N P f = P F F 2 + P S S 2 + P H H 2
where Δ P f is total error propagation, P represents the sensitivity to a given input variable, ∂F is the sensitivity coefficient for field measurement errors, ΔF is field measurement error, ∂S is the sensitivity coefficient for satellite sensor errors, ΔS is the sensor-specific errors, ∂H is the spatial heterogeneity sensitivity, and ΔH is heterogeneity error [40].

2.3.2. Estimation of GCC

GCC means the livestock number that can graze for a certain duration (e.g., one year) that does not negatively impact grassland vegetation increase, development and regeneration [41]. When current livestock numbers exceed theoretical grazing capacity, plant productivity declines, soil erosion increases, and ecosystem stability is compromised. To assess forage sufficiency, supply, and grazing capacity, livestock numbers are converted to sheep units. In consideration of the large variations in live weight and production among livestock members (camel, goat, horse, sheep and cattle), they were converted to the SU using conversion factors of 5.0 for camel (Ca), 0.9 for goat (G), 7.0 for horse (H), 1.0 for sheep (S), and 6.0 for cattle (Co), respectively [42]. Thus, the actual total livestock number (NSU) is calculated with (Equation (3)). SU was used to standardize grazing demand of biomass in dry weight among different herbivorous species. The daily forage intake per sheep unit varies according to vegetation zones, ecological regions, and seasons, in which it is 1.7 kg d−1 in forest steppe zones, 1.5 kg d−1 in high mountain zones, 1.6 kg d−1 in steppe zones, and 1.3 kg d−1 in desert steppe and desert zones.
N S U = H × 7 + ( C a × 6 ) + C o × 5 + S × 1 + G × 0.9
Subsequently, the GCC is calculated using (Equation (4)):
G C C = A G B A i n t D  
where AGB (kg ha−1 yr−1) is the annual aboveground biomass, A (m2) is the grassland area for each vegetation zone, and int is the daily biomass intake of one standard sheep unit (kg d−1). D is the number of grazing days (d) and is set to the whole year of grazing in Mongolia. AGB and GCC in each vegetation zone and in each soum were calculated.
The imbalance between the livestock numbers and GCC is termed as grassland carrying capacity excess (GCCe), which is defined as the ratio of the livestock numbers and GCC in each vegetation zone (Equation (5)) [43,44,45].
G C C e = L N G C C 100 %  
where GCCe is the grassland carrying capacity excess (%), and LN is the total livestock number in sheep units (SUs). The G C C e indicates the grazing conditions as follows: GCCe <0.5 (0–50%)—reserve of grassland, GCCe = 50–100%—light grazing, GCCe = 100–300%—moderate grazing, GCCe = 300–500%—overgrazing, and GCCe > 500%—extreme overgrazing [46].

2.3.3. Correlation Analysis of the AGB and Climate Variables

In this study, the Pearson correlation coefficient was computed at the pixel level to quantify the strength and direction of the linear relationship between AGB and climate variables across Mongolia during the study period (1982–2020), as defined in (Equation (6)). This statistical measure assesses the degree of association between two continuous variables.
r x , y = i = 1 n ( x i x ¯ ) ( y i y ¯ ) 1 i = 1 n x i x ¯ 2 i = 1 n y i y ¯ 2
where r x , y is the correlation coefficient, n = 38 represents the number of years (1982–2020),   x i and y i are the annual AGB and climate variable values in year i , and x ¯ and y ¯ denote their respective long-term means. A positive r x , y indicates a direct relationship, a negative value indicates an inverse relationship, and a value of zero denotes no linear association [47].

2.3.4. Mann–Kendall Trend Test

A Mann–Kendall trend test and Sen’s slope test were applied to each pixel in the time series to analyze RS data trends for significance and slope of change, respectively. This non-parametric method identifies monotonic trends, with values ranging from −1 (indicating a strong negative trend) to +1 (indicating a strong positive trend). The rate of change for each pixel was computed using Sen’s slope estimator, which quantifies the trend magnitude assuming a linear progression. Significance levels were set at 0.01 (strong), 0.05 (medium), and 0.1 (low) [47,48,49].

3. Results

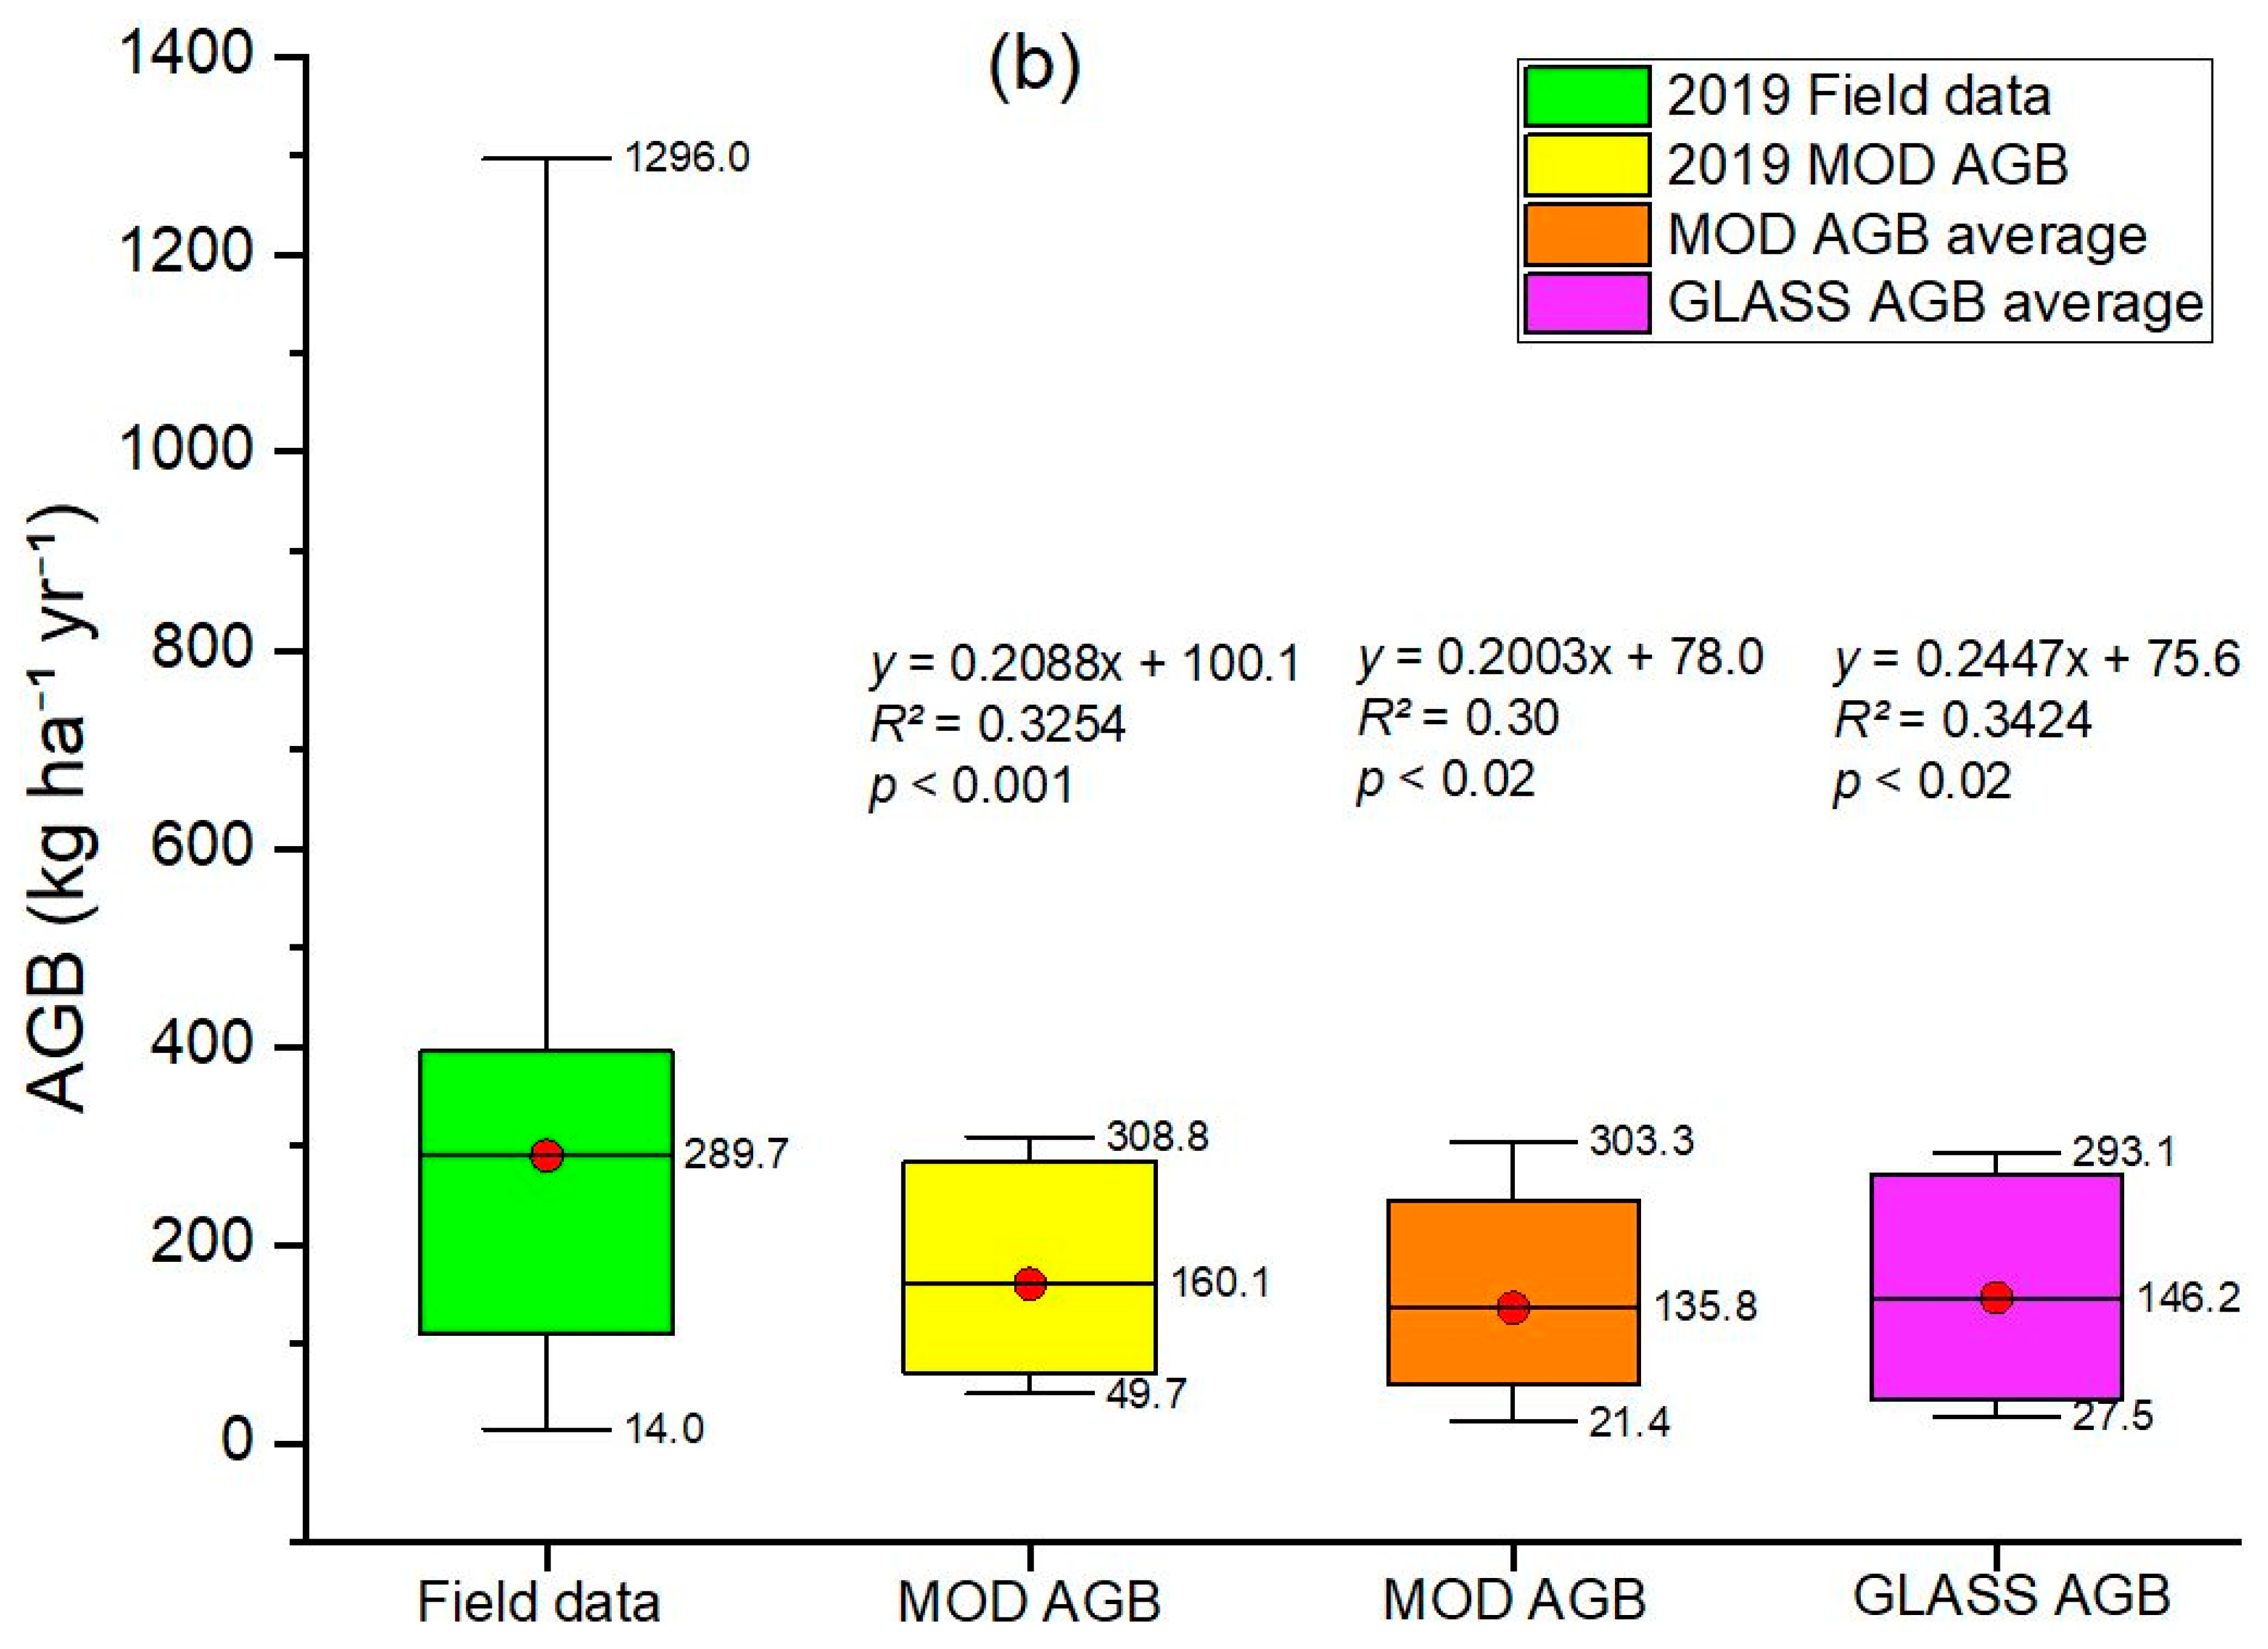
3.1. Validation of Aboveground Biomass

According to the AGB evaluated from GLASS and MODIS NPP products, the most productive grasslands, with AGB values of 651 kg ha−1 yr−1 (GLASS) and 682 kg ha−1 yr−1 (MODIS), are found in the northern and eastern parts of Mongolia. In contrast, the western and southern regions, which consist of dry mountains, deserts, and semi-desert steppes, exhibited lower productivity, with AGB values reaching as low as 0 kg ha−1 yr−1 in some areas. MODIS NPP data from 2019 indicated that average field biomass (289 kg ha−1 yr−1) was 53% and 49% higher than the multi-year average GLASS and MODIS AGB pixels, respectively (Figure 2). Nevertheless, the error propagation analysis demonstrates moderate reliability with significant field–satellite discrepancies, reflecting inherent limitations in scaling plot measurements to heterogeneous MODIS/GLASS pixels across Mongolia’s diverse grasslands. Thus, the 44% difference has an uncertainty of ±60%, reflecting combined field, sensor and scaling errors. The R2 = 0.32 further confirms that only 32% of the variance is explained by the satellite–field relationship.

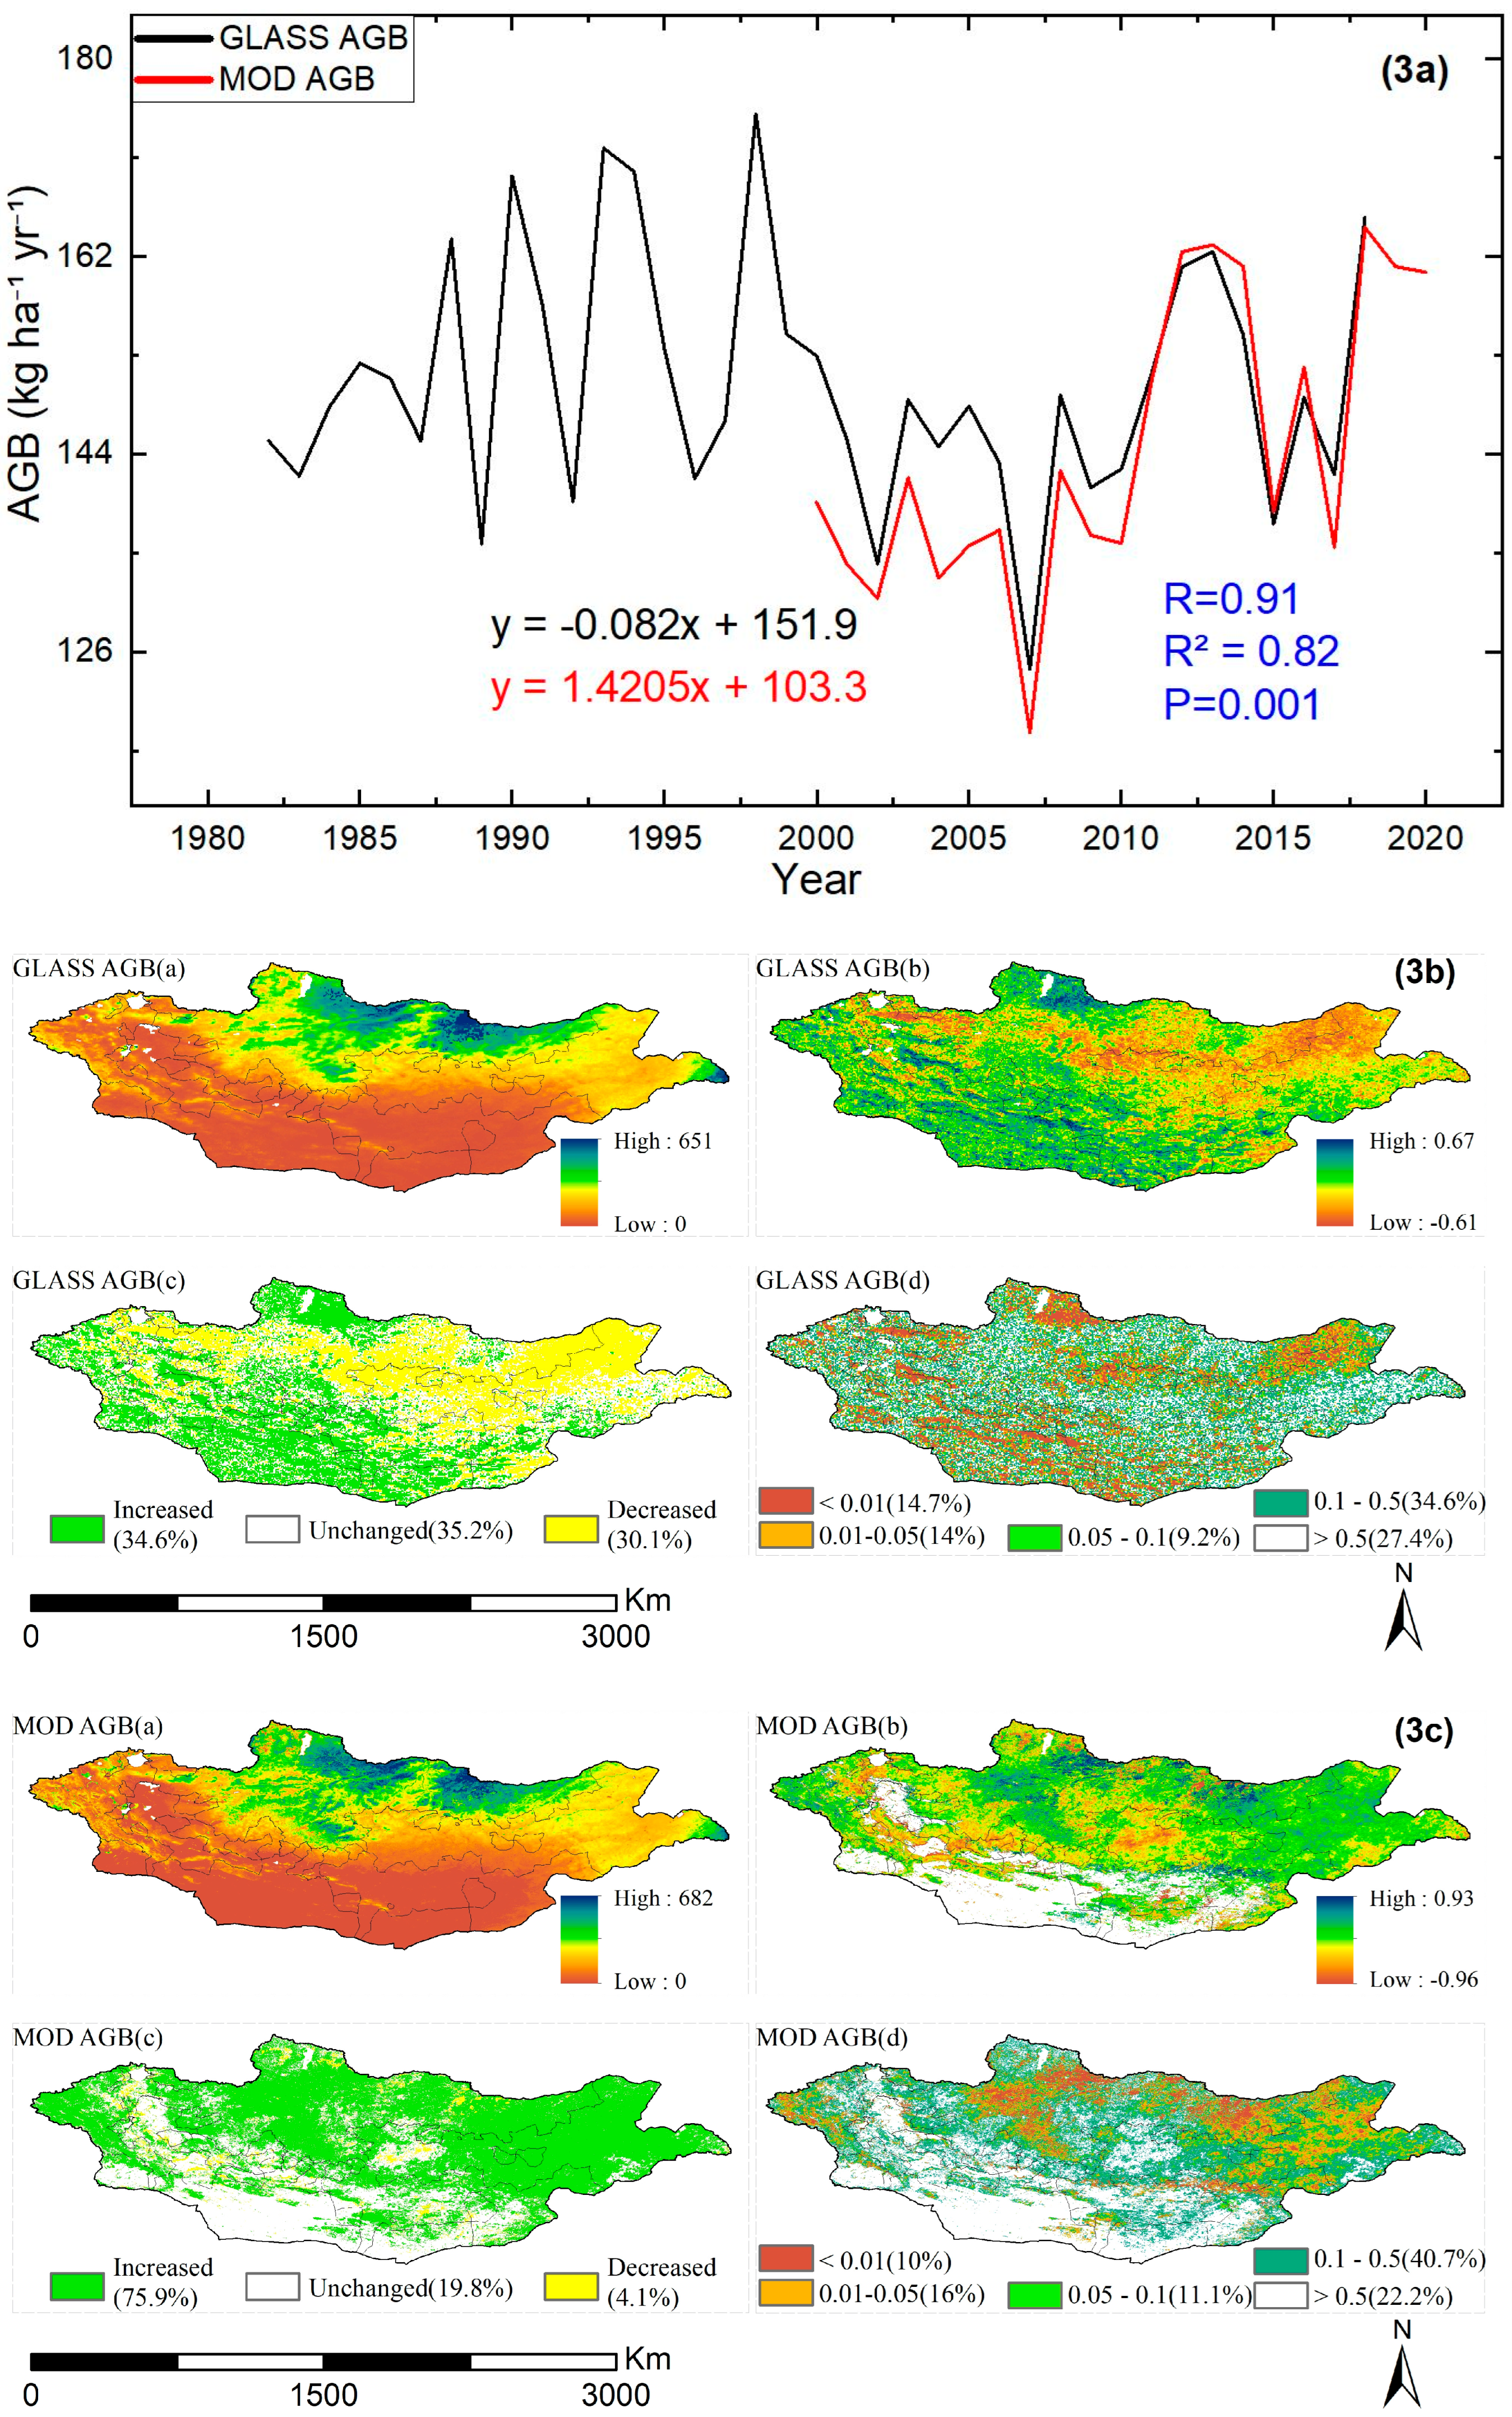
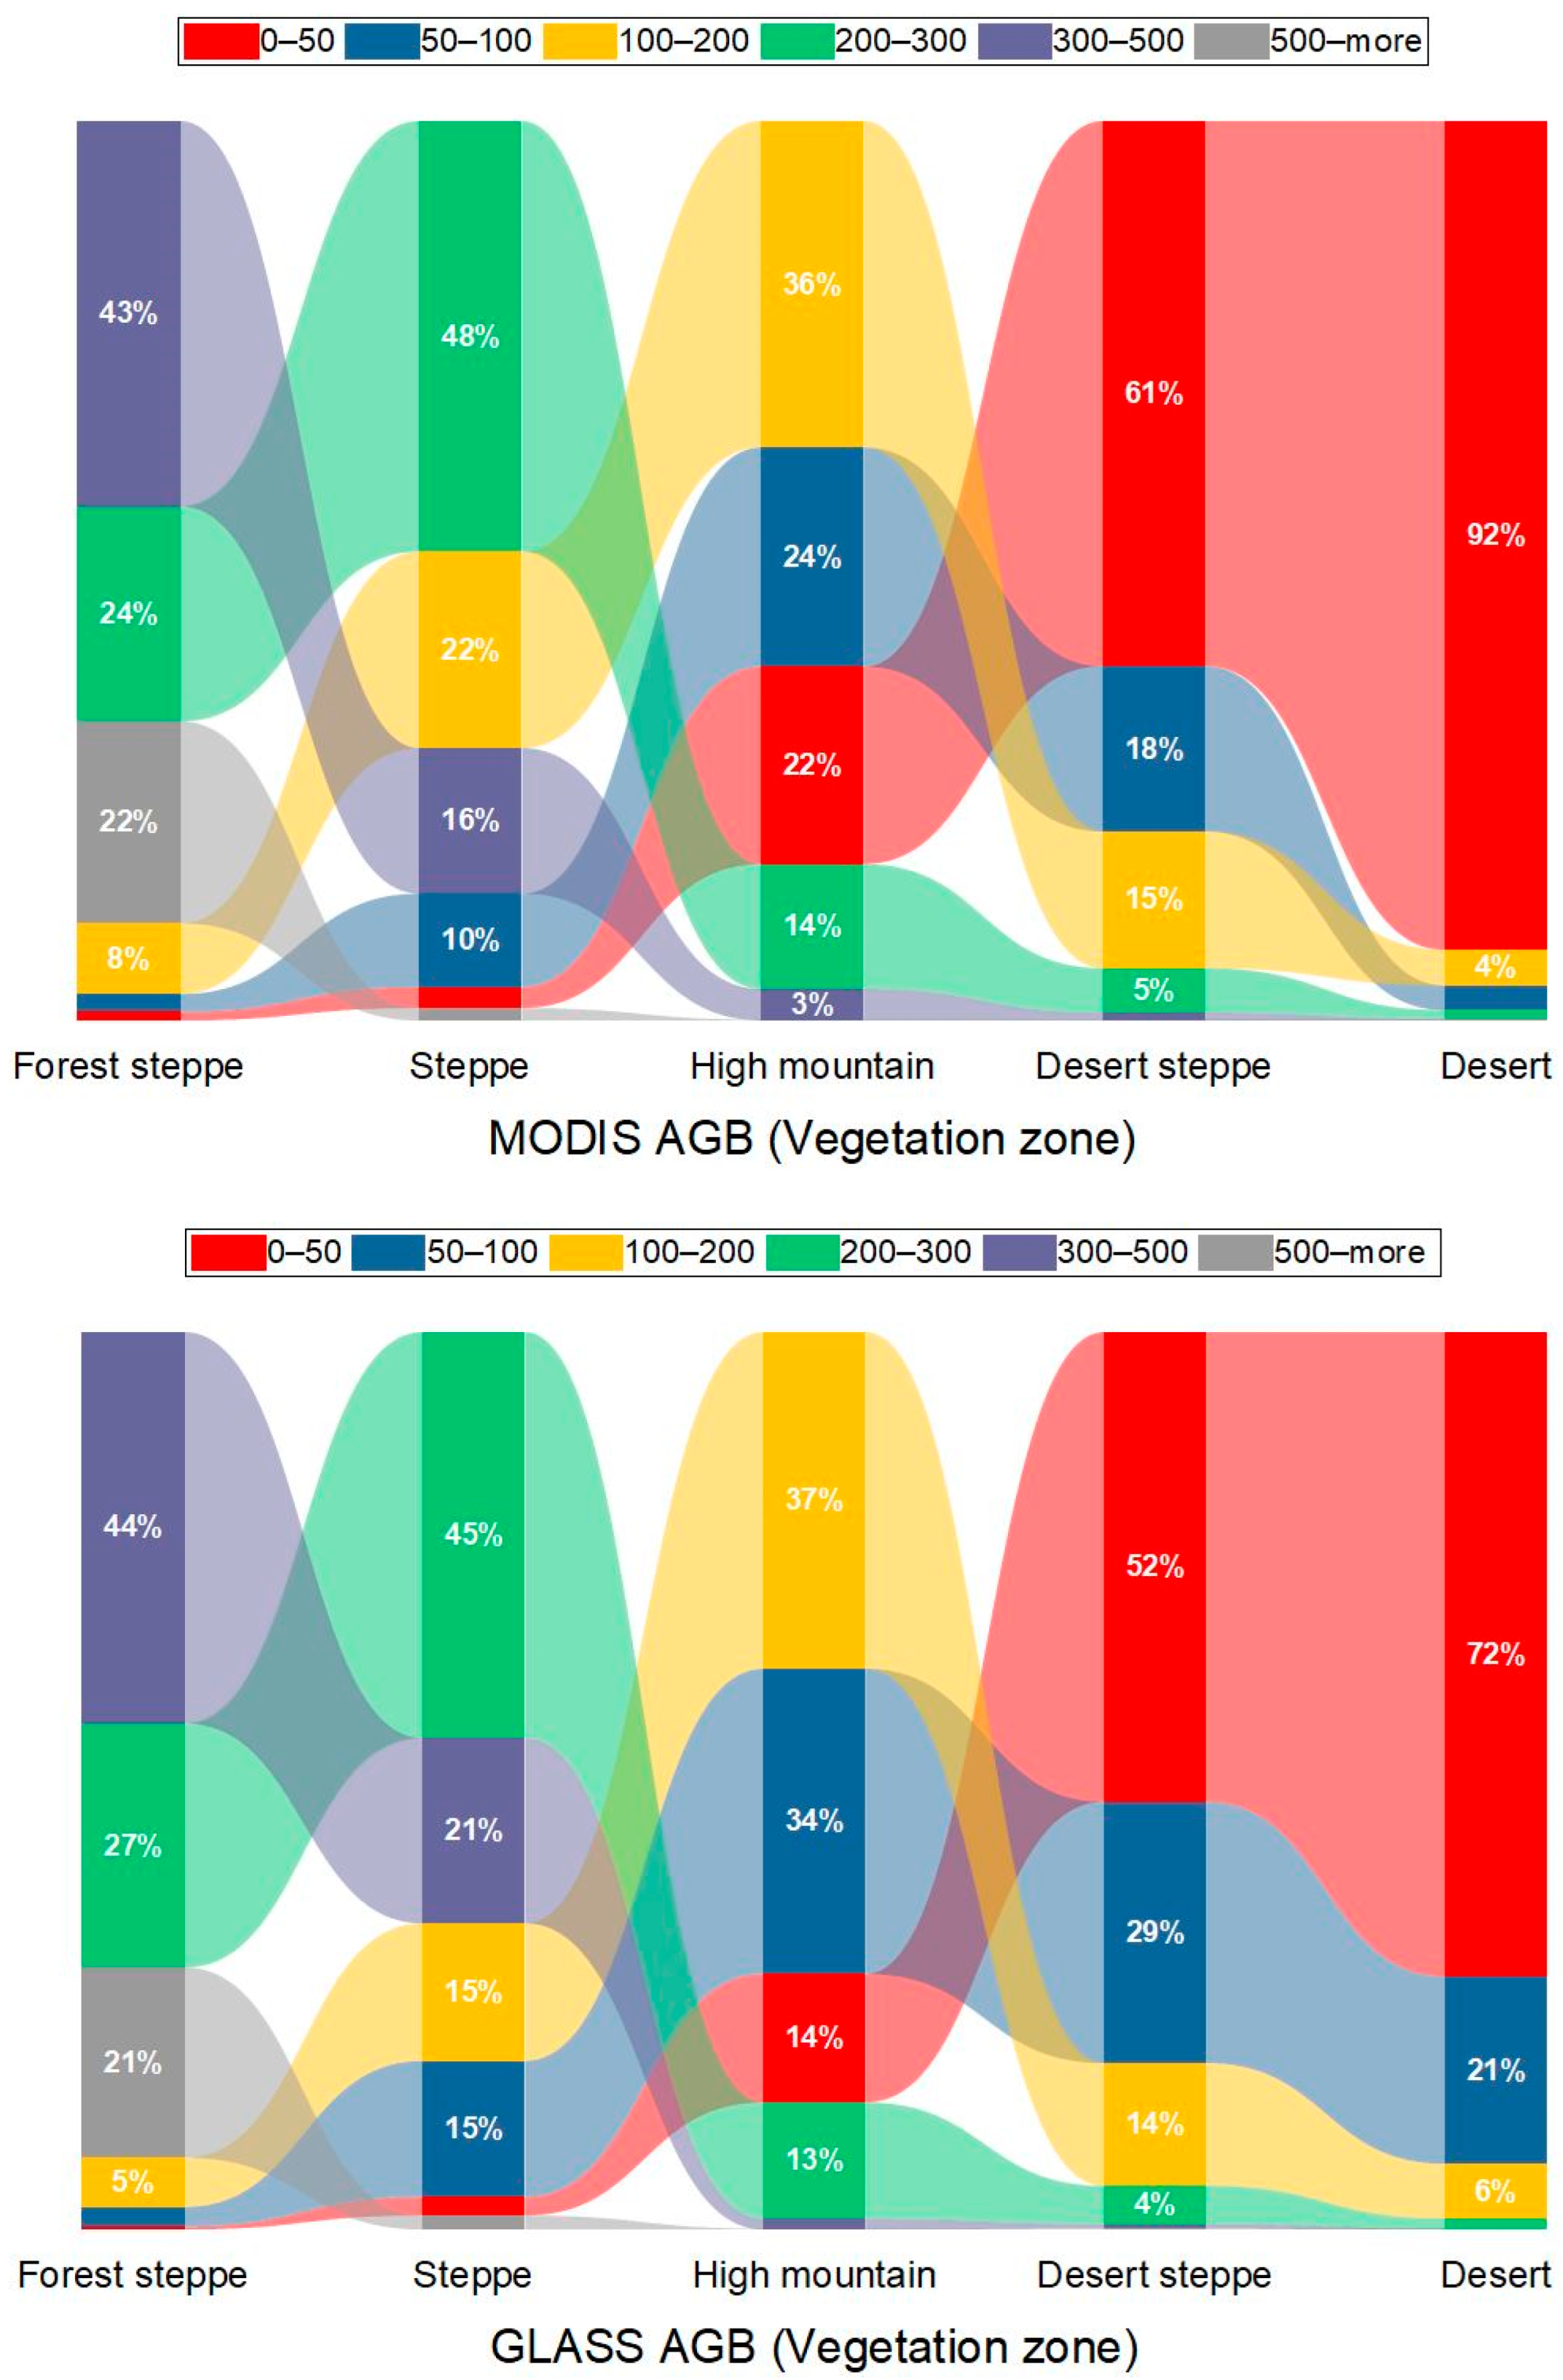
3.2. Comparison of the Spatiotemporal Variations in AGB from GLASS and MODIS Products

Overall, the multi-year averaged AGB from the NPP of MODIS (500 m resolution, 2000–2020) and GLASS (5 km resolution, 1982–2018) showed strong correlations and an increaing trend during their overlapping period (2000–2018) (Figure 3a) (R = 0.91, R2 = 0.82, p < 0.001). However, the trend in GLASS AGB was decreasing when taking the time period of 1982–2018 and there are discrepancies for specific pixels of Mongolian territory (Figure 3a–c). This may be due to the differences in the temporal and spatial resolution of these satellite products. The increased AGB rate of the multi-year average was higher in forest steppe regions and lower in desert and desert steppe regions (Table 1). During the study period, the increase rate of GLASS AGB was 0.56 kg ha−1 yr−1, while MODIS AGB increased annually on average by 1.0 kg ha−1 yr−1. These rates of AGB increase varied across different regions of Mongolia. For the GLASS product, notable significant decreases were observed primarily in the northern forest steppe zone, as well as a significant increase in the southern and southwestern regions of Mongolia, which include desert, desert steppe, and high mountain vegetation zones. For the MODIS product, a significant increase in vegetation growth was observed in most parts of Mongolia, particularly in the northern and eastern regions.
The long-term AGB generally decreased from north to south. The northern forest steppe region had the highest AGB of 682 kg ha−1 yr−1, while the southern desert and semi-desert steppe regions had the lowest AGB of 0.0 kg ha−1 yr−1, with more than 70% of the total area yielding 0–50 kg ha−1 yr−1 of biomass (Figure 4).

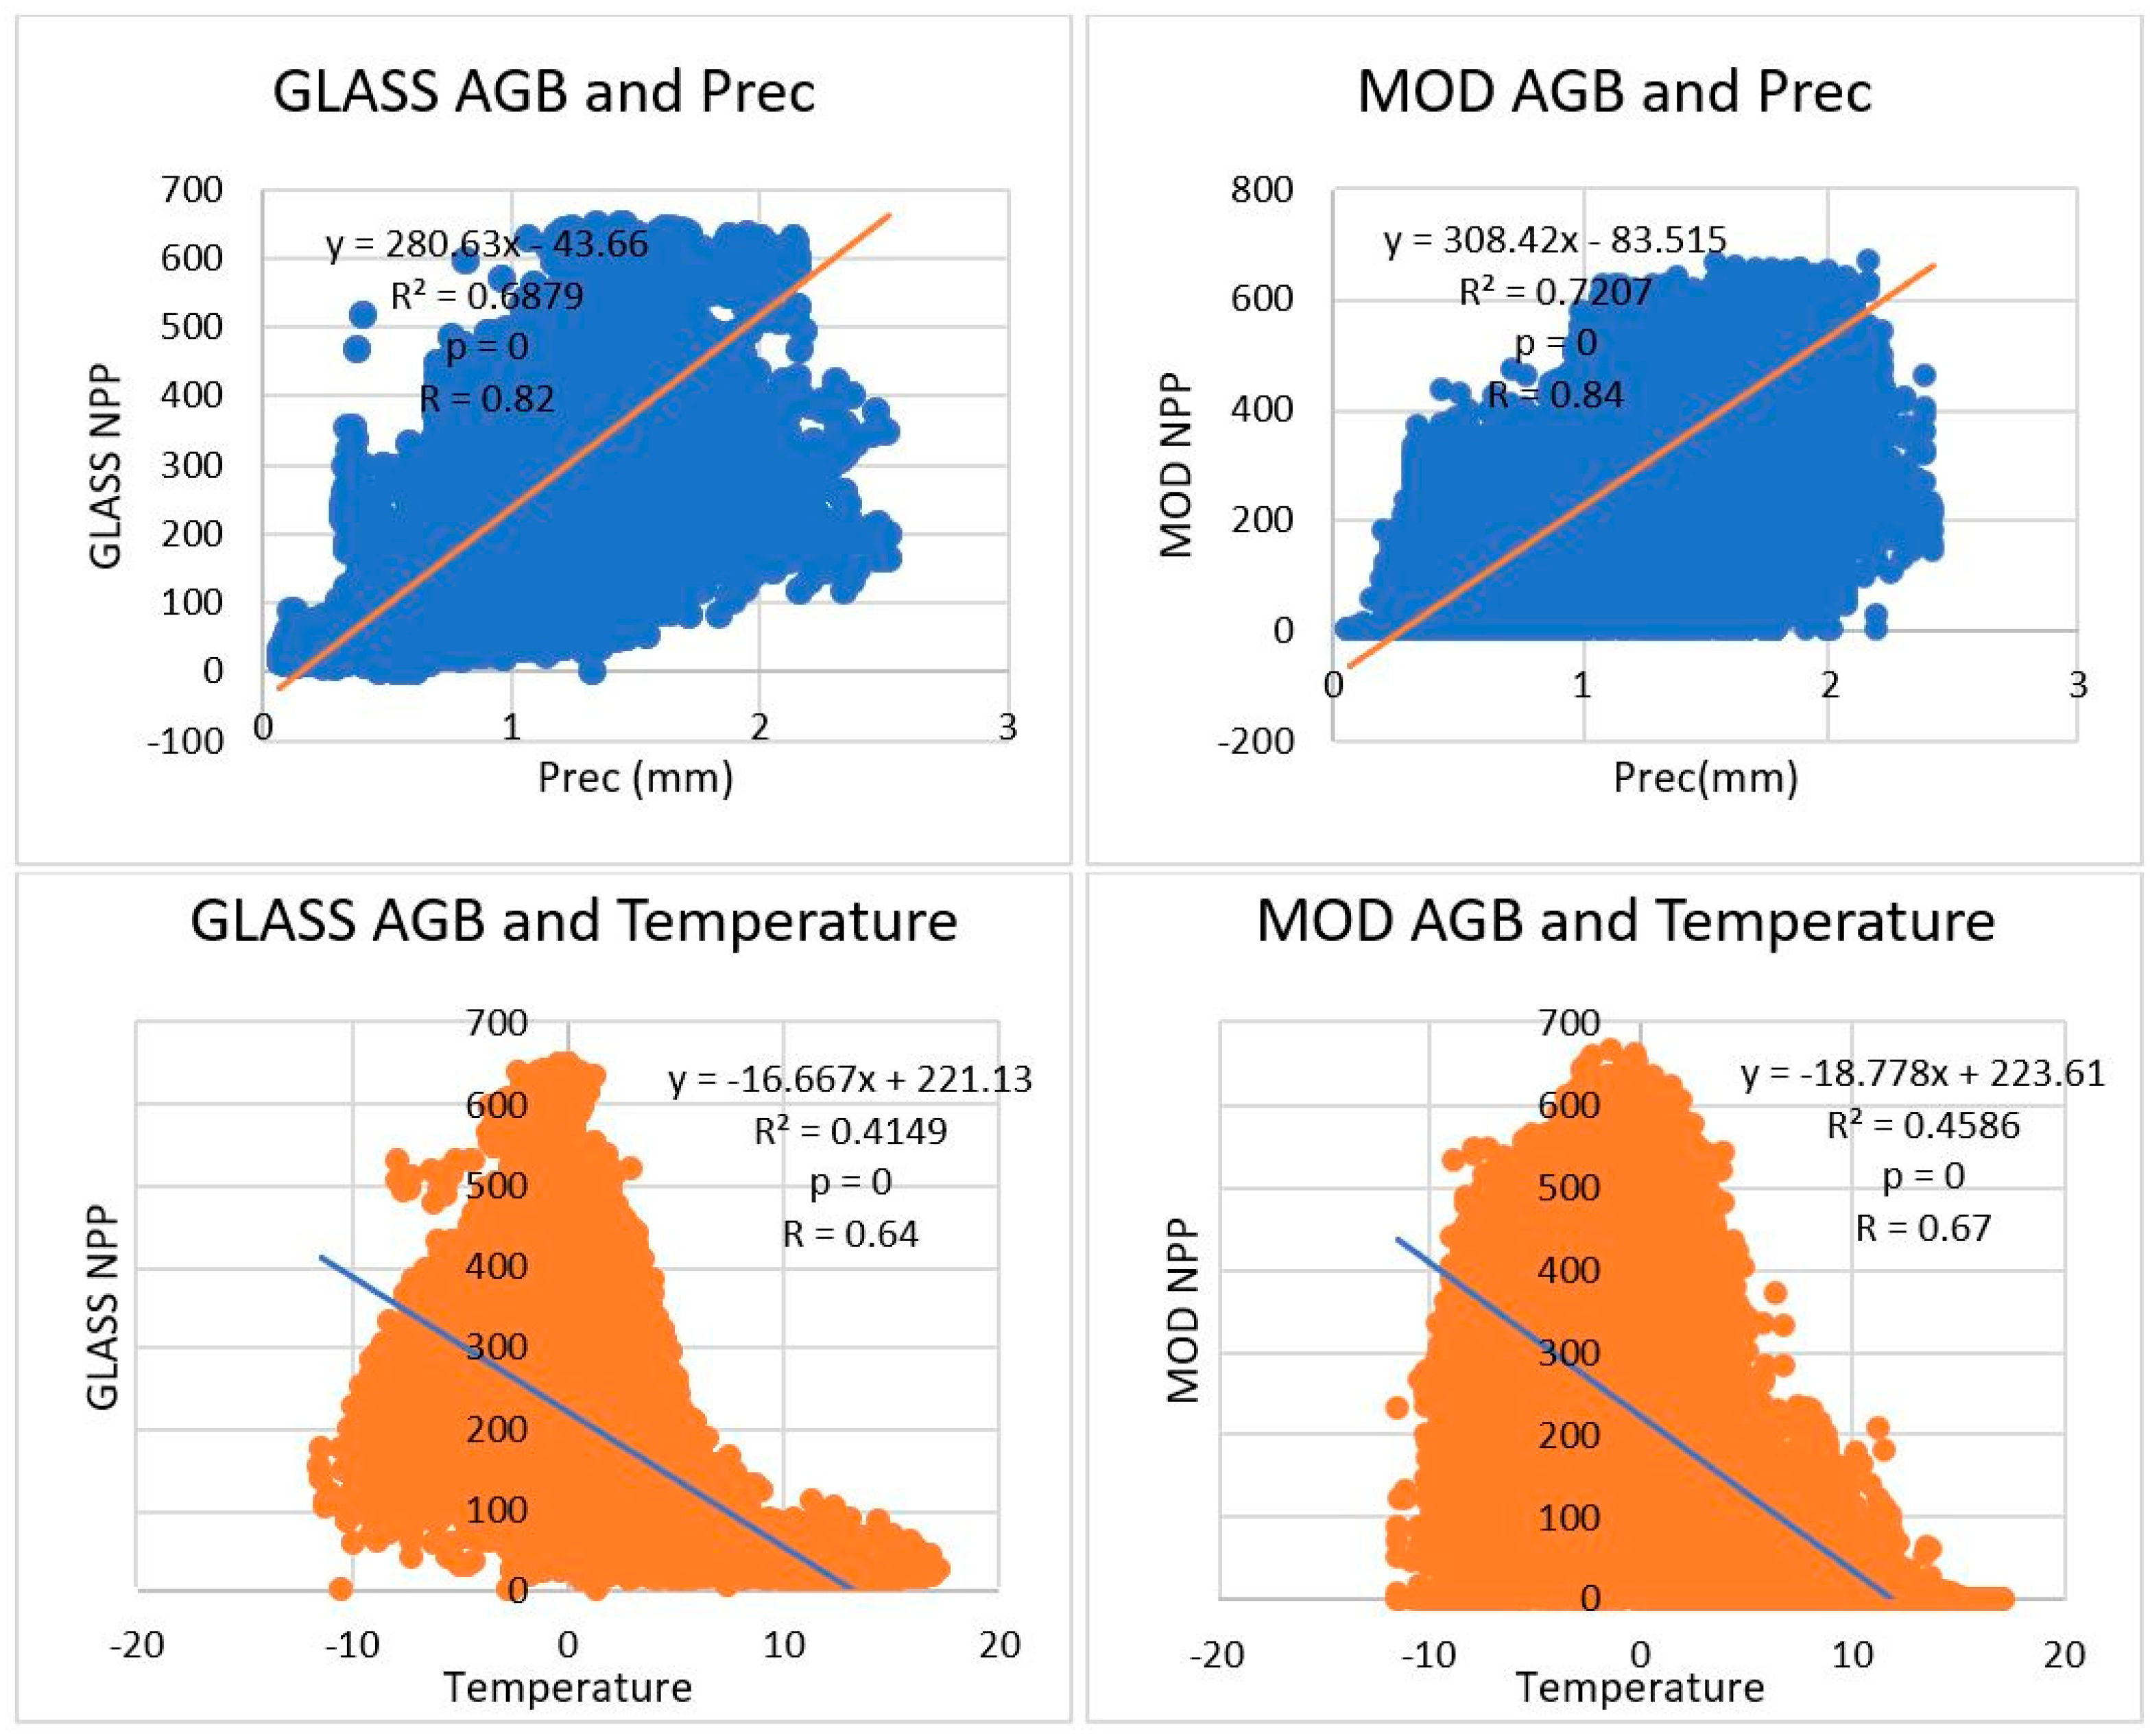
3.3. The Influence of Climate on Grassland Productivity

Over the past 38 years, the slope of the precipitation trend decreased by −0.0054 mm yr−1 (R2 = 0.34, p < 0.01), while temperature has increased by 0.0478 °C yr−1 (R2 = 0.28, p < 0.01). At the national scale in Mongolia, the relationship between precipitation and grassland AGB is positive, with a correlation coefficient exceeding 0.80, while the relationship between grassland AGB and temperature is negative, with a coefficient smaller than −0.60 (Figure 5). The above analysis clearly indicates that both precipitation and temperature influence AGB, with precipitation exerting a more pronounced impact compared to temperature.

3.4. Multi-Year Trends of Livestock Number

Statistical records showed that Mongolia’s livestock population, primarily consisting of five main domestic species (sheep, goat, cattle, horse, and camel) reached 67,603,539 SU. Between 1982 and 2020, it exhibited an average annual growth of 1,620,819 SU yr−1, with a moderate upward trend (R2 = 0.58). Among them, horses were the most numerous, accounting for 26.9%, while the numbers of cattle, goats, and sheep accounted for 26.7%, 17.3%, and 25.8%, respectively, and camels contributed only 3%. The livestock number in Mongolia has consistently increased, by nearly 2.2 times from 50,767,400 SU in 1982 to 114,411,300 SU in 2020.
Spatially, significant variations in livestock distribution were observed across vegetation zones. The forest steppe zone experienced the largest increase, with 27,248,735 SU (42%), while the desert zone had the smallest increase, with 3,467,634 SU (5%). The livestock number was 8,582,882 SU (13%), 16,431,843 SU (25%), and 9,360,832 SU (14%) in the high mountain, steppe, and desert steppe zones, respectively. The increase in Mongolia’s livestock numbers has intensified the utilization of grassland resources. The multi-year average increase in livestock numbers ranged from a minimum of 25,000 to a maximum of 600,000 SU yr−1.

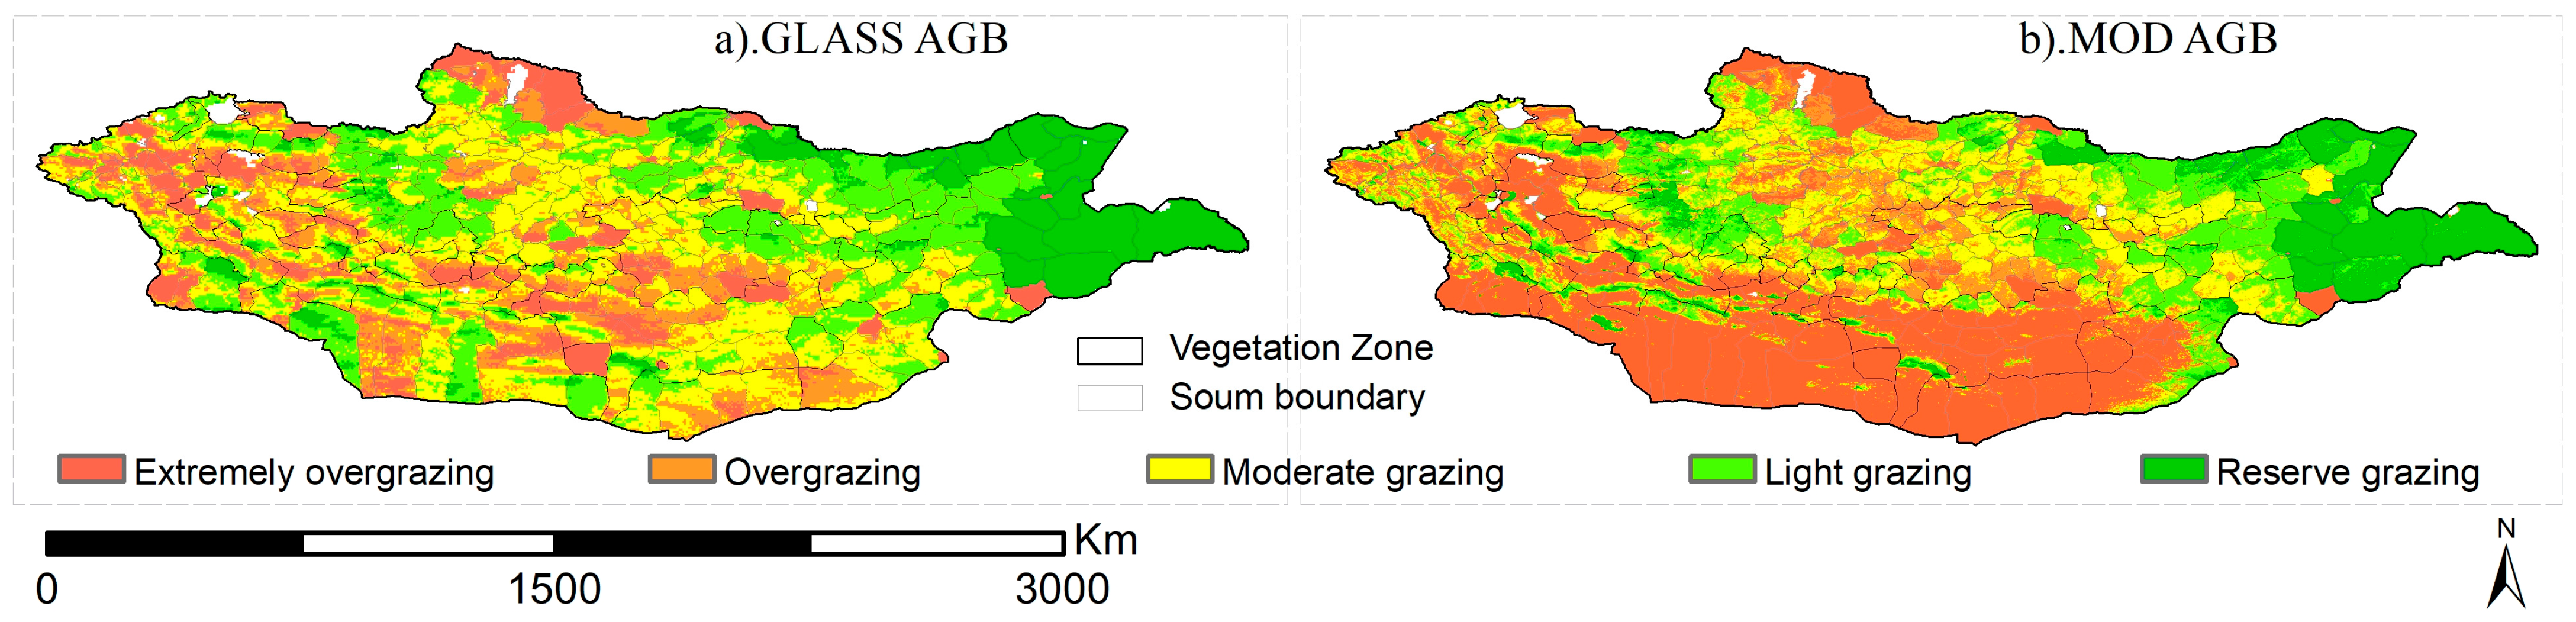
3.5. Spatiotemporal Variations in GCC

Overall, only 6–7% of Mongolia’s total land area had the capacity to support more than 300,000 SU (Table 2). These regions demonstrated a high potential for grazing, offering substantial grassland resources that can sustain more herds without exceeding the theoretical GCC.
The spatial patterns of current grassland use, based on estimated GCC and GCCe, indicate that grasslands in eastern Mongolia are sustainable. In contrast, GCC in the central and western regions exhibits significant spatial variability. The steppe and forest steppe areas have the highest GCC, whereas the desert and semi-desert regions display much lower GCC, primarily due to lower AGB and limited forage availability (Figure 6). This disparity can result from variations in climatic and vegetative environments across the two areas. Although grazing capacity has been exceeded in most regions of Mongolia, some areas remain below their theoretical GCC, particularly in the eastern region. This suggests that these grasslands have the potential to support larger livestock numbers.
The GCC estimated from the GLASS product indicates that 40.7% of the grassland (reserve and light-grazing grassland) was sustainable, while the GCC derived from the MODIS product shows that 31.9% of the area is sustainable grassland (Table 3, Figure 7).

4. Discussion

4.1. Comparison of GLASS and MODIS Products and Their Biomass

Remote sensing data has been proved to advance the monitoring of biomass and the NPP of ecosystems. The precision of the biomass calculation method relies primarily on the NPP estimation error [48,50]. The GLASS NPP product was validated with field measurements in 2010 and 2011, and the error was found to be less than 15% [51]. It is reported that MODIS NPP data are already validated and extensively applied in estimating vegetation biomass at both global and regional scales, as well as in studies of carbon cycling and climate change [32,33]. There are several models developed to estimate aboveground biomass (AGB) during July–August on the Mongolian Plateau. Validation results demonstrated satisfactory performance, with R2 and RMSE values of 0.67 and (14%), and 0.68 and 76.9 g/m2, respectively [12,52]. Studies found that the relationship between GLASS NPP and field measurements was between R = 0.60 and 0.80 [53]. While validation outcomes varied across studies depending on data sources and methodologies, they demonstrated consistent agreement within acceptable margins of error [12]. These research results were comparable to the NPP and AGB observations, indicating that they can be effectively utilized for analyzing changes in grassland productivity and GCC variations in Mongolia.
However, the significant variation in precipitation and temperature, along with the geographically unique environment and different natural zones, further complicates the relationship between NPP and biomass calculation [54]. The combination of low spatial resolution and broad mapping coverage in satellite data presents challenges for parameter retrieval and model validation, primarily due to the spatial mismatch with small ground-reference polygons [55]. Our study found that the agreement between field studies and RS products is 45–55 percent, with low consistency in terms of R2 and RMSE. The commonly observed low correlations (low R2 values) between field measurements and RS data in grassland ecosystems are primarily precipitation heterogeneity, soil moisture, and drought. Grasslands show abrupt productivity changes at precipitation thresholds (~250 mm yr−1 in Mongolia) that linear R2 fails to capture [56]. Plant responses to precipitation can have 1–3 month lags, obscuring annual correlations [57]. The RS captures integrated pixel-level data (500 m–8 km resolution), while field studies measure microsite conditions (1 m2 plots). This “ecological fallacy” creates inherent discrepancies [52].

4.2. Influence of Climate Factors on Grassland Above-Ground Biomass

Grassland productivity/biomass is influenced by the interaction of precipitation and temperature, with a stronger correlation observed when both factors are considered together rather than individually. This suggests that while precipitation promotes grassland growth, high temperatures impose a limiting effect. Productivity was inversely related to temperature and positively related to precipitation, with lower AGB occurring during hot dry intervals and higher during cool wet periods [58,59]. Mongolia’s AGB exhibits a direct correlation with precipitation gradients, manifesting denser growth in eastern regions and sparse distribution in western areas [60,61]. In the Gobi region, AGB showed a notably high correlation with precipitation (R2 = 0.66). To be brief, precipitation is higher in the northern forest steppe region of Mongolia and lower in the desert and arid steppe regions; temperature exhibits the opposite pattern. AGB was lowest in the desert steppe, while pasture biomass demonstrated a direct dependence on mean annual precipitation [62,63]. Annual vegetation cover correlated more strongly with precipitation in Mongolia, whereas monthly vegetation dynamics were jointly influenced by both temperature and precipitation [64,65]. Our findings also confirm a negative relationship between temperature and grassland AGB (or NPP), as well as a positive relationship between precipitation and AGB (or NPP). Multi-decadal averages smooth out critical short-term climate–vegetation dynamics visible in field studies [42]. Research conducted in Mongolia highlights that precipitation is the only factor demonstrating a significant positive correlation with NPP in grassland [66]. The findings of this research aligned with those of previous investigations into the connections between precipitation, temperature, and AGB. Additional information is available in, e.g., [12,67].

4.3. Spatio-Temporal Pattern of GCC and Its Effects from Livestock

Livestock numbers are the primary factor influencing GCC and livestock numbers have increased across Mongolia. The privatization of livestock following Mongolia’s social transition in 1990 was a key driver behind the initial increase in herd sizes. In the present context, the continued growth in livestock numbers is primarily attributed to the relatively low market prices of meat, hides, wool, and cashmere. Raising and selling more livestock provides households with a practical means to meet their economic needs. Furthermore, large herd ownership is widely perceived as a strategy for enhancing livelihood security [68,69]. The livestock numbers are beyond the theoretical GCC, and subsequently the plant growth is strongly restricted across the country. An increase in livestock numbers potentially influences changes in the GCC in national level and vegetation zones. Emergency measures should be taken to prioritize both herd reduction and optimizing grassland productivity to restore ecological balance [70,71]. However, these patterns are not consistent in different vegetation zones. A large amount of livestock on grassland does not necessarily indicate that the grazing capacity is exceeded. In the forest steppe region, high precipitation enhances plant growth, thereby providing sufficient forage for livestock. Furthermore, the recent decline in vegetation productivity, especially in the transitional zone between grasslands and the Gobi desert in Mongolia, is primarily attributed to rising livestock populations and intensified grazing pressure [56]. Over the study period, widespread livestock mortality occurred across Mongolia’s vast territory due to the occurrence of severe summer drought and dzud (extreme weather) events of 1999–2000, 2000–2001, 2001–2002, and 2009–2010. These events caused significant economic losses, leading to a substantial decrease in livestock numbers [46,72]. Addressing the imbalance between livestock density and GCC is essential for sustaining grassland productivity and preventing exceedance of GCC.

4.4. Regional GCC and Grazing Management

Grassland NPP is a key indicator of biomass and one of the main factors limiting and affecting GCC [66]. Our findings indicate that in the eastern regions of Mongolia, particularly in the steppe zones, grassland resources are generally sufficient. In contrast, the desert steppe and desert zones often face significant grassland shortage. Excessive grazing in transitional zones may result in the contraction of grassland areas and the expansion of the Gobi desert, subsequently reducing vegetation productivity and grassland degradation [67]. These regional differences in GCC reflect the variability in grassland productivity and livestock densities across Mongolia and highlight the need for focal interventions in overgrazed areas. The widespread overgrazing, particularly in the central and western regions, underscores the pressing need for policies focused on reducing livestock numbers and implementing effective grassland management strategies. Additionally, the combination of summer droughts and excessive livestock increases have led to a significant reduction in grassland biomass. As a result, more than half of Mongolia’s land area is currently experiencing overgrazing, with the GCC being exceeded in many regions [46,73].
The extent to which grassland forage is utilized significantly influences its availability and is generally defined to promote sustainable resource management and avoid ecological deterioration [14,74]. It is generally recommended to maintain a forage utilization rate of 50% to preserve grassland health [75,76] and advised to limit the forage utilization rate to 30%. Similarly, [11] it is concluded that utilizing 25% of the forage production is advisable to ensure sustainable forage availability, reduce shortage and prevent grassland degradation [12]. These results may change depending on the RS data and field survey validation. Furthermore, in regions with plenty of grassland resources, additional livestock could be grazed, while in overgrazed areas, livestock numbers should be reduced to ensure sustainable grassland management. However, there remains room for improving the precision of GCC assessments in the future.

5. Conclusions

This study provides an assessment of the GCC in Mongolia by converting remotely sensed NPP data (GLASS and MODIS) from 1982 to 2020 to AGB, integrating climate variables and livestock statistics. Our analysis reveals critical spatial and temporal patterns of GCC, highlighting its dynamic relationship with climate factors and overgrazing pressures. Only 30–40% of Mongolia’s grasslands currently operate within sustainable grazing limits, while 37.5% (MODIS) to 12.4% (GLASS) of areas face extreme overgrazing (GCCe > 500%). Climate factors, particularly precipitation and temperature, and the warming–drying trend, threaten grassland resilience, with cascading impacts on GCC. MODIS and GLASS AGB products show high correlation (R2 = 0.90) but divergent trends, underscoring the need for multi-source validation. Field data confirmed RS-based AGB estimates (R2 = 0.32–0.57), though regional calibration remains essential. Livestock numbers have surged by 2.2 times since 1982, exceeding GCC in central/western regions. The escalating livestock numbers, coupled with climatic stressors, exacerbate overgrazing risks; dzud events temporarily reduced herds but failed to reverse long-term overgrazing trends.
The results demonstrate pronounced spatial heterogeneity in GCC across Mongolian ecosystems, with variability driven by differential vegetation productivity, livestock density gradients, and climate change impacts. These findings underscore the imperative for spatially tailored management strategies that account for regional disparities in pastoral ecosystem resilience. In particular, in areas where grazing capacity has been exceeded, it is necessary to reduce livestock numbers, keeping year-round grassland to enhance vegetation productivity. Simultaneously, the grassland resources in the well-preserved eastern regions should be made more accessible for sustainable livestock use. To improve GCC assessments and reduce spatiotemporal biases, opportunities remain to enhance research by integrating high-precision RS and ground-based data.

Author Contributions

B.R.: Conceptualization, formal analysis, methodology, software (PyCharm, ArcGIS 10.8), validation, investigation, writing—original draft preparation, writing—review and editing. S.L.: conceptualization, formal analysis, project administration, funding acquisition, supervision, writing—original draft preparation. Q.G.: data curation, funding acquisition. J.C.: resources, visualization. M.U. and D.B.: investigation. D.A.: resources. All authors have read and agreed to the published version of the manuscript.

Funding

National Natural Science Foundation of China (32171555, 31961143022). National Key Research & Development Plan (2024YFF1306101). Mongolian Foundation for Science and Technology (MFST 2022/176).

Data Availability Statement

The satellite data used in the article are open access; field research data used in the article are available from the author.

Conflicts of Interest

The authors declare no conflicts of interest.

References

  1. Suttie, J.M.; Reynolds, S.G.; Batello, C. Grasslands of the World; Food and Agriculture Organization: Rome, Italy, 2005. [Google Scholar]
  2. Latham, J.; Cumani, R.; Rosati, I.; Bloise, M. FAO Global Land Cover SHARE. Database Beta-Release Verion 1.0. 2014; p. 40. Available online: https://www.fao.org/uploads/media/glc-share-doc.pdf (accessed on 4 June 2025).
  3. ILRI; IUCN; FAO; WWF; UNEP; ILC. Rangelands Atlas. 2021. Available online: https://www.ilri.org/knowledge/publications/rangelands-atlas (accessed on 15 May 2023).
  4. Lemaire, S.A.; Russell, L. Epidemiology of thoracic aortic dissection. Nat. Rev. Cardiol. 2011, 8, 103–113. [Google Scholar] [CrossRef]
  5. Bengtsson, J.; Bullock, J.M.; Egoh, B.; Everson, C.; Everson, T.; O’Connor, T.; O’Farrell, P.J.; Smith, H.G.; Lindborg, R. Grasslands—More important for ecosystem services than you might think. Ecosphere 2019, 10, e02582B. [Google Scholar] [CrossRef]
  6. Sala, S.; Crenna, E.; Secchi, M.; Pant, R. EUR 28984 EN; Global Normalisation Factors for the Environmental Footprint and Life Cycle Assessment; Publications Office of the European Union: Luxembourg, 2017; pp. 1–16. [Google Scholar]
  7. Sunjidmaa, N.; Mendoza-Lera, C.; Hille, S.; Schmidt, C.; Borchardt, D.; Graeber, D. Carbon limitation may override fine-sediment induced alterations of hyporheic nitrogen and phosphorus dynamics. Sci. Total Environ. 2022, 837, 155689. [Google Scholar] [CrossRef] [PubMed]
  8. Asner, G.P.; Elmore, A.J.; Olander, L.P.; Martin, R.E.; Harris, T. Grazing systems, ecosystem responses, and global change. Annu. Rev. Environ. Resour. 2004, 29, 261–299. [Google Scholar] [CrossRef]
  9. Qinxue, W.; Tomohiro, O.; Tadanobu, N.; Batkhishig, O.; Bayarsaikhan, U. Estimation of the Carrying Capacity and Relative Stocking Density of Mongolian grasslands under various adaptation scenarios. Sci. Total Environ. 2024, 913, 169772. [Google Scholar] [CrossRef]
  10. Han, Z.; Song, W.; Deng, X.; Xu, X. Grassland ecosystem responses to climate change and human activities within the Three-River Headwaters region of China. Sci. Rep. 2018, 8, 1–13. [Google Scholar] [CrossRef]
  11. Xu, M.-Y.; He, J.-S. A review of grassland carrying capacity: Definition, theoretical consideration and model. Acta Prataculturae Sin. 2014, 23, 313. [Google Scholar]
  12. Nana, Y.; Weiwei, Z.; Wu, B.; Tuvdendorj, B.; Chang, S.; Mishigdorj, O.; Zhang, X. Assessment of the grassland carrying capacity for winter-spring period in Mongolia. Ecol. Indic. 2023, 146, 109868. [Google Scholar] [CrossRef]
  13. Leeuw, J.d.; Rizayeva, A.; Namazov, E.; Bayramov, E.; Marshall, M.T.; Etzold, J.; Neudert, R. Application of the MODIS MOD 17 Net Primary Production product in grassland carrying capacity assessment. Int. J. Appl. Earth Obs. Geoinf. 2019, 78, 66–76. [Google Scholar] [CrossRef]
  14. Holechek, J.L. An Approach for Setting the Stocking Rate. Rangelands 1988, 10, 10–14. [Google Scholar]
  15. Hunt, E.R.; Miyake, B.A. Comparison of stocking rates from remote sensing and geospatial data. Rangel. Ecol. Manag. 2006, 59, 11–18. [Google Scholar] [CrossRef]
  16. Yu, L.; Zhou, L.; Liu, W.; Zhou, H.K. Using Remote Sensing and GIS Technologies to Estimate Grass Yield and Livestock Carrying Capacity of Alpine Grasslands in Golog Prefecture, China. Pedosphere 2010, 20, 342–351. [Google Scholar] [CrossRef]
  17. Jong, S.M.d.; Meer, F.D.v.; Clevers, J.G. Basics of Remote Sensing; Springer: Berlin/Heidelberg, Germany, 2004; pp. 1–15. [Google Scholar] [CrossRef]
  18. Coops, N.C.; Tooke, T.R. Learning Landscape Ecology; Springer: Berlin/Heidelberg, Germany, 2017. [Google Scholar] [CrossRef]
  19. Langley, S.K.; Cheshire, H.M.; Humes, K.S. A comparison of single date and multitemporal satellite image classifications in a semi-arid grassland. J. Arid Environ. 2001, 49, 401–411. [Google Scholar] [CrossRef]
  20. He, C.; Zhang, Q.; Li, Y.; Li, X.; Shi, P. Zoning grassland protection area using remote sensing and cellular automata modeling—A case study in Xilingol steppe grassland in northern China. J. Arid Environ. 2005, 63, 814–826. [Google Scholar] [CrossRef]
  21. Li, Q.; Wang, J.; Xie, H.; Ochir, A.; Davaasuren, D. Applicability of Grassland Production Estimation Using Remote Sensing for the Mongolian Plateau by Comparing Typical Regions in China and Mongolia. Sustainability 2022, 14, 3122. [Google Scholar] [CrossRef]
  22. Zhao, Y.; Chi, W.; Kuang, W.; Bao, Y.; Ding, G. Ecological and environmental consequences of ecological projects in the Beijing–Tianjin sand source region. Ecol. Indic. 2020, 112, 106111. [Google Scholar] [CrossRef]
  23. Chen, J.; Li, F.; Wang, R.; Fan, Y.; Raza, M.A.; Liu, Q.; Wang, Z.; Cheng, Y.; Wu, X.; Yang, F.; et al. Estimation of nitrogen and carbon content from soybean leaf reflectance spectra using wavelet analysis under shade stress. Comput. Electron. Agric. 2019, 156, 482–489. [Google Scholar] [CrossRef]
  24. Liu, Y.; Zhang, Z.; Tong, L.; Khalifa, M.; Wang, Q.; Gang, C.; Wang, Z.; Li, J.; Sun, Z. Assessing the effects of climate variation and human activities on grassland degradation and restoration across the globe. Ecol. Indic. 2019, 106, 105504. [Google Scholar] [CrossRef]
  25. Yang, Z.; Wei, Y.; Fu, G.; Xiao, R.; Chen, J.; Zhang, Y.; Wang, D.; Li, J. Decreased precipitation in the late growing season weakens an ecosystem carbon sink in a semi-arid grassland. J. Appl. Ecol. 2021, 58, 2101–2112. [Google Scholar] [CrossRef]
  26. Mongolian Academy of Sciences. National Atlas of Mongolia; Mongolian Academy of Sciences: Ulaanbaatar, Mongolia, 2022. [Google Scholar]
  27. Consolidated Report on Mongolia’s Unified Land Fund 2018; Agency of Land Administration and Management, Geodesy and Cartography: Ulaanbaatar, Mongolia, 2019.
  28. Shagdar, E. The Mongolian livestock sector: Vital for the economy and people, but vulner-able to natural phenomena. Erina Rep. 2002, 47, 4–26. [Google Scholar]
  29. Keeling, C.D.; Chin, J.F.S.; Whorf, T.P. Increased activity of northern vegetation inferred from atmospheric CO2 measurements. Nature 1996, 382, 146–148. [Google Scholar] [CrossRef]
  30. Tans, P.P.; Bakwin, P.S.; Guenther, D.W. A feasible Global Carbon Cycle Observing System: A plan to decipher today’s carbon cycle based on observations. Glob. Change Biol. 1996, 2, 309–318. [Google Scholar] [CrossRef]
  31. Methodology of Estimate for Grassland Carrying Capacity in Mongolia. 2019. Available online: https://downloads.1212.mn/1616736153165.pdf (accessed on 20 April 2023).
  32. Rasmus; Fensholt; Sandholt, I.; Rasmussen, M.S.; Stisen, S.; Diouf, A. Evaluation of satellite based primary production modelling in the semi-arid Sahel. Remote Sens. Environ. 2006, 105, 173–188. [Google Scholar] [CrossRef]
  33. Turner, D.P.; Ritts, W.D.; Cohen, W.B.; Gower, S.T.; Running, S.W.; Zhao, M.; Costa, M.H.; Kirschbaum, A.A.; Ham, J.M.; Saleska, S.R.; et al. Evaluation of MODIS NPP and GPP products across multiple biomes. Remote Sens. Environ. 2006, 102, 282–292. [Google Scholar] [CrossRef]
  34. Zhao, F.; Xu, B.; Yang, X.; Jin, Y.; Li, J.; Xia, L.; Chen, S.; Ma, H. Remote sensing estimates of grassland aboveground biomass based on MODIS Net Primary Productivity (NPP): A case study in the Xilingol grassland of northern China. Remote Sens. 2014, 6, 5368–5386. [Google Scholar] [CrossRef]
  35. Running, S.W.; Zhao, M. Daily GPP and Annual NPP (MOD17A2/A3) Products NASA Earth Observing System MODIS Land Algorithm (User’s Guide V3). User Guide 2015, 1–28. Available online: https://www.umt.edu/numerical-terradynamic-simulation-group/files/modis/MOD17UsersGuide2015_v3.pdf (accessed on 8 December 2023).
  36. Bao, G.; Bao, Y.; Qin, Z.; Xin, X.; Bao, Y.; Bayarsaikan, S.; Zhou, Y.; Chuntai, B. Modeling net primary productivity of terrestrial ecosystems in the semi-arid climate of the Mongolian Plateau using LSWI-based CASA ecosystem model. Int. J. Appl. Earth Obs. Geoinf. 2016, 46, 84–93. [Google Scholar] [CrossRef]
  37. Chu, C.; Bartlett, M.; Wang, Y.; He, F.; Weiner, J.; Chave, J.; Sack, L. Does climate directly influence NPP globally? Glob. Change Biol. 2016, 22, 12–24. [Google Scholar] [CrossRef] [PubMed]
  38. Scurlock, J.M.O.; Cramer, W.; Olson, R.J.; Parton, W.J.; Prince, S.D. Terrestrial NPP: Toward a consistent data set for global model evaluation. Ecol. Appl. 1999, 9, 913–919. [Google Scholar] [CrossRef]
  39. Wang, J.; Sun, R.; Zhang, H.; Xiao, Z.; Zhu, A.; Wang, M.; Yu, T.; Xiang, K. New Global MuSyQ GPP/NPP Remote Sensing Products from 1981 to 2018. IEEE J. Sel. Top. Appl. Earth Obs. Remote Sens. 2021, 14, 5596–5612. [Google Scholar] [CrossRef]
  40. Zhang, J.F. The calculating formulae, and experimental methods in error propagation analysis. IEEE Trans. Reliab. 2006, 55, 169–181. [Google Scholar] [CrossRef]
  41. Cheng, D.; Peili, S.; Xianzhou, Z.; Ning, Z.; Xi, C.; Shoubao, G. The Rangeland Livestock Carrying Capacity and Stocking Rate in the Kailash Sacred Landscape in China The Rangeland Livestock Carrying Capacity and Stocking Rate in the Kailash Sacred Landscape in China. J. Resour. Ecol. 2017, 8, 551–558. [Google Scholar] [CrossRef]
  42. Nandintsetseg, B.; Boldgiv, B.; Chang, J.; Ciais, P.; Davaanyam, E.; Batbold, A.; Bat-Oyun, T.; Stenseth, N.C. Risk and vulnerability of Mongolian grasslands under climate change. Environ. Res. Lett. 2021, 16, 034035. [Google Scholar] [CrossRef]
  43. Desta, S.; Coppock, D.L. Cattle population dynamics in the southern Ethiopian. J. Range Manag. 2002, 55, 439–451. [Google Scholar] [CrossRef]
  44. JScanlan, C.; Day, G.M.M.K.A.; Mott, J.J.; Hinton, A.W. Estimating Safe Carrying Capacities of Extensive Cattle-Grazing Properties within Tropical, Semi-Arid Woodlands of North-Eastern Australia. Budid. Ayam Ras Petelur Gallus sp. 1994, 21, 99–104. Available online: https://www.unhcr.org/publications/manuals/4d9352319/unhcr-protection-training-manual-european-border-entry-officials-2-legal.html?query=excom (accessed on 20 September 2023).
  45. Rinehart, L. Pasture, Rangeland and Grazing Management. Management 2008, 20, 1–20. [Google Scholar]
  46. Nandintsetseg, B.; Shinoda, M.; Erdenetsetseg, B. Contributions of multiple climate hazards and overgrazing to the 2009/2010 winter disaster in Mongolia. Nat. Hazards 2018, 92, 109–126. [Google Scholar] [CrossRef]
  47. Tong, S.; Zhang, J.; Bao, Y.; Wurina. Spatial and temporal variations of vegetation cover and the relationships with climate factors in Inner Mongolia based on GIMMS NDVI3g data. J. Arid Land 2017, 9, 394–407. [Google Scholar] [CrossRef]
  48. Dashpurev, B.; Dorj, M.; Phan, T.N.; Bendix, J.; Lehnert, L.W. Estimating fractional vegetation cover and aboveground biomass for land degradation assessment in eastern Mongolia steppe: Combining ground vegetation data and remote sensing. Int. J. Remote Sens. 2023, 44, 452–468. [Google Scholar] [CrossRef]
  49. Sen, P.K. Estimates of the Regression Coefficient Based on Kendall’ s Tau. J. Am. Stat. Assoc. 2012, 37–41. [Google Scholar]
  50. Qin, P.; Sun, B.; Li, Z.; Gao, Z.; Li, Y.; Yan, Z.; Gao, T. Estimation of Grassland Carrying Capacity by Applying High Spatiotemporal Remote Sensing Techniques in Zhenglan Banner, Inner Mongolia, China. Sustainability 2021, 13, 3123. [Google Scholar] [CrossRef]
  51. Zheng, Y.; Shen, R.; Wang, Y.; Li, X.; Liu, S.; Liang, S.; Chen, M.; Ju, W.; Zhang, L.; Yuan, W. Improved estimate of global gross primary production for reproducing its long-term variation, 1982–2017. Earth Syst. Sci. Data 2020, 12, 2725–2746. [Google Scholar] [CrossRef]
  52. John, R.; Chen, J.; Giannico, V.; Park, H.; Xiao, J.; Shirkey, G.; Ouyang, Z.; Shao, C.; Lafortezza, R.; Qi, J. Grassland canopy cover and aboveground biomass in Mongolia and Inner Mongolia: Spatiotemporal estimates and controlling factors. Remote Sens. Environ. 2018, 213, 34–48. [Google Scholar] [CrossRef]
  53. Eisfelder, C.; Klein, I.; Bekkuliyeva, A.; Kuenzer, C.; Buchroithner, M.F.; Dech, S. Above-ground biomass estimation based on NPP time-series—A novel approach for biomass estimation in semi-arid Kazakhstan. Ecol. Indic. 2017, 72, 13–22. [Google Scholar] [CrossRef]
  54. Ji, F.; Xi, G.; Xie, Y.; Zhang, X.; Huang, H.; Guo, Z.; Zhang, H.; Ma, C. Estimating Grassland Carrying Capacity in the Source Area of Nujiang River and Selinco Lake, Tibetan Plateau (2001–2020) Based on Multisource Remote Sensing. Remote Sens. 2024, 16, 3790. [Google Scholar] [CrossRef]
  55. Jargalsaikhan, M.E.; Nagai, M.; Tumendemberel, B.; Dashdondog, E.; Katiyar, V.; Ichikawa, D. Adapting the High-Resolution PlanetScope Biomass Model to Low-Resolution VIIRS Imagery Using Spectral Harmonization: A Case of Grassland Monitoring in Mongolia. Remote Sens. 2025, 17, 1428. [Google Scholar] [CrossRef]
  56. Hilker, T.; Natsagdorj, E.; Waring, R.H.; Lyapustin, A.; Wang, Y. Satellite observed widespread decline in Mongolian grasslands largely due to overgrazing. Glob. Change Biol. 2014, 20, 418–428. [Google Scholar] [CrossRef] [PubMed]
  57. Nanzad, L.; Zhang, J.; Tuvdendorj, B.; Nabil, M.; Zhang, S.; Bai, Y. NDVI anomaly for drought monitoring and its correlation with climate factors over Mongolia from 2000 to 2016. J. Arid Environ. 2019, 164, 69–77. [Google Scholar] [CrossRef]
  58. Munkhtsetseg, E.; Kimura, R.; Wang, J.; Shinoda, M. Pasture yield response to precipitation and high temperature in Mongolia. J. Arid Environ. 2007, 70, 94–110. [Google Scholar] [CrossRef]
  59. Dorligjav, S. Heat and Moisture Regime for Plant Growth Stages in Bayan-Ulgii Province, Mongolia. 2021. Available online: https://www.researchgate.net/publication/355155283_Heat_and_moisture_regime_for_plant_growth_stages_in_Bayan-Ulgii_province_Mongolia (accessed on 15 June 2023).
  60. Nandintsetseg, B.; Shinoda, M. Assessment of drought frequency, duration, and severity and its impact on pasture production in Mongolia. Nat. Hazards 2013, 66, 995–1008. [Google Scholar] [CrossRef]
  61. Batima, P.; Natsagdorj, L.; Gombluudev, P.; Erdenetsetseg, B. Observed Climate Change in Mongolia. AIACC Working Paper 2005. Available online: https://www.start.org/Projects/AIACC_Project/working_papers/Working%20Papers/AIACC_WP_No013.pdf (accessed on 1 May 2023).
  62. Wehrden, H.V.; Wesche, K.; Europe PMC Funders. Group Relationships between climate, productivity and vegetation in southern Mongolian drylands. Basic Appl Dryland Res. 2012, 1, 100–120. [Google Scholar] [CrossRef]
  63. Kürschner, H. Life Strategies and Adaptations in Bryophytes from the Near and Middle East Life Strategies and Adaptations in Bryophytes from the Near and Middle East. Turk. J. Bot. 2004, 28, 73–84. [Google Scholar]
  64. Mu, S.; Yang, H.; Li, J.; Chen, Y.; Gang, C.; Zhou, W.; Ju, W. Spatio-temporal dynamics of vegetation coverage and its relationship with climate factors in Inner Mongolia, China. J. Geogr. Sci. 2013, 23, 231–246. [Google Scholar] [CrossRef]
  65. Fernández-Giménez, M.E. Sustaining the steppes: A geographical history of pastoral land use in Mongolia. Geogr. Rev. 1999, 89, 315–342. [Google Scholar] [CrossRef] [PubMed]
  66. Yang, Y.; Wang, Z.; Li, J.; Gang, C.; Zhang, Y.; Zhang, Y.; Odeh, I.; Qi, J. Comparative assessment of grassland degradation dynamics in response to climate variation and human activities in China, Mongolia, Pakistan and Uzbekistan from 2000 to 2013. J. Arid Environ. 2016, 135, 164–172. [Google Scholar] [CrossRef]
  67. Bao, G.; Tuya, A.; Bayarsaikhan, S.; Dorjsuren, A.; Mandakh, U.; Bao, Y.; Li, C.; Vanchindorj, B. Variations and climate constraints of terrestrial net primary productivity over Mongolia. Quat. Int. 2020, 537, 112–125. [Google Scholar] [CrossRef]
  68. Murphy, D.J.; Ichinkhorloo, B. Index insurance and the moral economy of pastoral risk management in Mongolia. J. Peasant Stud. 2024, 51, 1185–1207. [Google Scholar] [CrossRef]
  69. Fern, E. Spatial and Social Boundaries and the Paradox of Pastoral Land Tenure: A Case Study. Hum. Ecol. 2002, 30, 49–78. [Google Scholar]
  70. Alexandratos, N.; Fao, J.B. World Agriculture Towards 2030/2050 The 2012 Revision ESA Working Paper Rome. Fao 2012, 1–155. Available online: https://ageconsearch.umn.edu/record/288998/?v=pdf (accessed on 9 April 2025).
  71. Munkhzul, O.; Oyundelger, K.; Narantuya, N.; Tuvshintogtokh, I.; Oyuntsetseg, B.; Wesche, K.; Jäschke, Y. Grazing Effects on Mongolian Steppe Vegetation—A Systematic Review of Local Literature. Front. Ecol. Evol. 2021, 9, 1–13. [Google Scholar] [CrossRef]
  72. Chadraabal, A.; Odkhuu, U.; Shinoda, M.; Suzuki, Y. Social Causes of Dzuds in Mongolia Since the 1990s. J. Disaster Res. 2022, 17, 1183–1191. [Google Scholar] [CrossRef]
  73. Dong, Y.; Yan, H.; Du, W.; Hu, Y. Spatio-temporal analysis of grassland carrying capacity in Mongolian Plateau based on supply-consumption relationship. J. Nat. Resour. 2019, 34, 1093. [Google Scholar] [CrossRef]
  74. Cheng Linag, D.L.; Michalk, D.M. The ecology and growth patterns of Cleistogenes species in degraded grasslands of eastern Inner Mongolia, China. J. Appl. Ecol. 2002, 39, 584–594. [Google Scholar]
  75. Sainnemekh, S.; Densambuu, B.; Bestelmeyer, B.; Barrio, I.C.; Aradóttir, A.L. Rangeland Degradation in Mongolia-Using State and Transition Models to Help Understand Rangeland Dynamics. (2022). IGC Proceedings (1989–2023). 42. Available online: https://uknowledge.uky.edu/igc/24/1-2/42/ (accessed on 6 July 2023).
  76. Wang, Z.; Jiao, S.; Han, G.; Zhao, M.; Willms, W.D.; Hao, X.; Wang, J.; Din, H.; Havstad, K.M. Impact of stocking rate and rainfall on sheep performance in a Desert Steppe. Rangel. Ecol. Manag. 2011, 64, 249–256. [Google Scholar] [CrossRef]
Figure 1. Mongolian natural zones [26] and field sampling sites in vegetation investigation in 2019 (a); location (b) and elevation of Mongolia (c) derived from the Global Multi-resolution Terrain Elevation Data 2010 (GMTED2010).
Sustainability 17 05498 g001
Figure 2. Field survey sampling points and RS pixels (a), correlation (b).
Sustainability 17 05498 g002aSustainability 17 05498 g002b
Figure 3. Temporal (3a) and spatial (3b,3c) variations in multi-year average GLASS AGB (3b), MODIS AGB (3c) for Mongolian grasslands. (a) Multi-year average value; (b) M-K mutation recognition/detection; (c) spatial variations and area proportion; (d) p-value.
Sustainability 17 05498 g003
Figure 4. Areal fractions (%) of different AGB groups (0–50, 50–100, 100–200, 200–300, 300–500 and 500< kg ha−1 yr−1) in each vegetation zone. Upper panel: MODIS AGB; lower panel: GLASS AGB.
Sustainability 17 05498 g004
Figure 5. Relationship between GLASS/MODIS AGB and precipitation and temperature for grassland in Mongolia.
Sustainability 17 05498 g005
Figure 6. GCC estimated from GLASS AGB product (a) and from MODIS AGB product (b).
Sustainability 17 05498 g006
Figure 7. Multi-year average temporal (left panel) and spatial (right panel) changes in AGB and GCCe. The units on the y-axis of the graphs are kg ha−1 yr−1. GCCe was estimated among vegetation zones in Mongolia: (a) forest steppe, (b) steppe, (c) high mountain, (d) desert steppe, and (e) desert.
Sustainability 17 05498 g007
Table 1. Multi-year average AGB increase for different vegetation zones in Mongolia.
Vegetation ZoneGLASS AGB (kg ha−1 yr−1)MOD AGB (kg ha−1 yr−1)
Forest steppe1.11.6
Steppe0.41.7
High mountain0.10.5
Desert steppe0.20.4
Desert0.30.04
Table 2. Areal fraction (%) that can support livestock in terms of the group of livestock numbers in Mongolia.
The Livestock Number That Can Be Fed (%)
Livestock Number (SU)GLASS (%)MODIS (%)
<50,00024.541.6
50,001–150,00053.335.0
150,001–300,00015.316.4
300,001–500,0003.53.6
>500,0013.43.3
Table 3. The ratio of the actual livestock number to GCC (GCCe) estimated from GLASS and MODIS data in Mongolia.
GCCeGrazing ConditionsGLASS (%)MODIS (%)
>5Extremely overgrazing12.437.5
3–5Overgrazing16.310.9
1–3Moderate grazing30.619.7
0.5–1Light grazing27.320.8
0–0.5Reserve 13.411.1
Disclaimer/Publisher’s Note: The statements, opinions and data contained in all publications are solely those of the individual author(s) and contributor(s) and not of MDPI and/or the editor(s). MDPI and/or the editor(s) disclaim responsibility for any injury to people or property resulting from any ideas, methods, instructions or products referred to in the content.

