Article

Electrochemical Production of Hypochlorous Acid and Sodium Hydroxide Using Ion Exchange Membranes

by
Juan Taumaturgo Medina Collana
1,*,
Kevin Azorza Guillen
1,
Edgar Williams Villanueva Martinez
1,
Carlos Ancieta Dextre
1,
Luis Carrasco Venegas
1,
Oscar Rodriguez Taranco
1,
Jorge Lopez Herrera
1,
Pablo Diaz Bravo
1,
Jose Porlles Loarte
1 and
Jorge Montaño Pisfil
2
1
Faculty of Chemical Engineering, Research Center for Water Treatment Processes Engineering, National University of Callao, Juan Pablo II 306 Avenue, Bellavista 07011, Peru
2
Faculty of Electrical and Electronic Engineering, Universidad Nacional del Callao, Callao 07011, Peru
*
Author to whom correspondence should be addressed.
Sustainability 2025, 17(12), 5465; https://doi.org/10.3390/su17125465
Submission received: 20 April 2025 / Revised: 5 June 2025 / Accepted: 9 June 2025 / Published: 13 June 2025

Abstract

:
Given the problems related to drinking water supplies in rural and economically disadvantaged regions, point-of-use disinfection technologies are a viable alternative to improve access to drinking. Electrochlorinators are devices that produce chlorine-based disinfectants onsite via the electrolysis of a sodium chloride solution. In this research, we have constructed an innovative laboratory-scale three-compartment cell that includes two ion exchange membranes, fixed between two electrodes; in the anodic compartment, an acidic mixture of chlorine-based species (Cl2, HClO, HCl and ClO) is obtained, and, in the cathodic compartment, an alkaline solution is present (NaOH and hydrogen gas), while the central compartment is fed with a sodium chloride solution. The Taguchi methodology was used to examine the impact of the process operating conditions on the results obtained. The effects of the electrical potential levels (4.5, 6 and 7 V), electrolysis times (30, 60 and 90 min) and initial sodium chloride concentrations (5, 15 and 30 g/L) on the physical and chemical characteristics (concentrations of available chlorine and sodium hydroxide and pH of the solutions) and energy consumption were investigated. Variations in the electrical potential significantly influenced the concentration levels of active chlorine and sodium hydroxide produced, as well as the pH values of the respective solutions. The most favorable conditions for the production of electrolyzed water were an electrical potential of 7 volts, an electrolysis time of 90 min and a concentration of 30 g/L of sodium chloride, which was verified by ANOVA. The maximum concentration of active chlorine reached 290 mg/L and that of sodium hydroxide reached 1450 mg/L without the presence of hypochlorite ions under the best synthesis conditions. The energy consumption was 18.6 kWh/kg Cl2 and 4.4 kWh/kg NaOH, while the average electric current efficiency for sodium hydroxide formation reached 88.9%. Similarly, the maximum conversion of chloride ions reached 24.37% under the best operating conditions.

1. Introduction

The elimination of disease-causing pathogens is a critical problem at present, and scientists have had to research cost-effective and environmentally friendly disinfectants to prevent both epidemic and endemic infections [1]. Acidic electrolyzed water (AEW), especially in its form known as strongly acidic electrolyzed water (AcEW), has become the preferred choice in many disinfection scenarios because of its cost-effectiveness, high disinfection capacity and environmental friendliness [2]. Hypochlorous acid (HClO) is a strong, water-soluble oxidant and is widely used as a safe, non-toxic disinfectant in various fields, such as food safety [3], water treatment and medical sterilization [3]. Hypochlorous acid (HClO) is the most effective disinfectant of all known chlorine species. The germicidal efficacy of this species is due to its relative neutrality, which facilitates penetration into the cell walls of microorganisms. When electrolyzed water comes into contact with organic materials or is diluted with tap water, it becomes ordinary water, which makes it less harmful to the environment and human health [4]. The demand for electrolyzed water has increased considerably due to the prevalence of infectious diseases in recent years [5]. The electrolytic production of hypochlorous acid (HOCl) has proven to be economically competitive with that of traditional disinfectants such as sodium hypochlorite, chlorine and ozone, especially in decentralized or small-scale applications [6]. In addition, HOCl generated onsite avoids the costs associated with transporting and storing commercial disinfectants, and its higher antimicrobial efficacy allows lower concentrations to be used, thus reducing chemical consumption [6]. Electrolyzed water (EW) is widely accepted as an emerging disinfectant because it does not require hazardous chemicals and processes; it is produced by passing a salt (NaCl) or acid (HCl) solution through an electrolytic cell [7]. EW generation involves the electrolysis of a dilute salt solution (NaCl, MgCl2 or KCl) or dilute hydrochloric acid inside a chamber divided by a membrane into anode and cathode sections [8]. Previous work has reported the evaluation of a continuous-mode cell using saline wastewater, achieving a hypochlorite concentration of (20%) under certain operating conditions (flow rate of 4.5 mL/min, current density of 3.183 mA/cm2, electrode spacing of 0.5 cm, salinity of 40 g/L and pH of 6.4) [9]. In another study, the production of active chlorine from a synthetic salt effluent by electrolysis reached a maximum active chlorine concentration of 46 mg/L HClO, with a current intensity of 1.6 A, a reaction time of 35 min and an initial sodium chloride concentration of 0.8 M (46.8 g/L) [10]. Unlike conventional cleaning products, electrolyzed water is eco-friendly, of low cost, highly effective and safe [11]. However, its instability presents considerable storage problems, since it can rapidly degrade into different compounds, such as gaseous Cl2, chlorate (ClO3), hypochlorite (ClO) and other molecules that are harmful to human health and corrosive to the surfaces of objects in a short period of time, ranging from hours to a days [12]. Moreover, a study on the production of disinfecting agents by brine electrolysis using ion exchange membranes revealed that the concentration of hypochlorous acid decreased significantly during storage, reaching 100% reduction after 12 to 16 weeks, depending on the storage conditions [13]. Likewise, it has been reported that the antimicrobial effect of HClO in AEW is 80 times greater than that of the same concentration of ClO [14]. Two types of generators are generally used for the production of electrolyzed water: single-chamber generators and generators with two or more compartments. In single-chamber generation, the electrolysis of sodium chloride requires an anode and a cathode; negatively charged Cl ions move toward the anode, where oxidation occurs to produce HClO, ClO, HCl, oxygen gas (O2) and chlorine gas (Cl2). The positively charged Na+ ions move toward the cathode, where they undergo water reduction, generating sodium hydroxide (NaOH) and hydrogen gas (H2) [15], as given in Equations (1)–(3), (7) and (8). Previous studies have mentioned that the conventional diaphragm electrolysis technique used for the production of AcEW faces challenges such as limited mass transfer efficiency and the high costs and energy consumption associated with ion exchange membranes [2]. Previous studies have shown that non-membrane reactors, although simpler and more cost-effective, may allow the greater mixing of anodic and cathodic products, which could increase the formation of unwanted by-products [15]. Membrane splitting devices allow two types of water to be obtained: acidic electrolyzed water (AEW) on the anode side and basic electrolyzed water (BEW) on the cathode side. The main products at the anode are dissolved Cl2, hypochlorous acid (HClO) and hydrochloric acid (HCl), and, at the cathode, they are sodium hydroxide (NaOH) and dissolved H2 [16]. The purpose of the membrane in the electrolysis process is to separate the two types of electrolyzed water via the migration of Na+ (cation) to the cathode and Cl (anion) to the anode. As highlighted Belhadj et al. (2022), the use of different types of commercial membranes in electrolysis cells can significantly affect the yield and purity of hypochlorous acid, as well as the yield of sodium hydroxide. Their research reveals that the choice of membrane and pH control in the anode compartment are key factors in maximizing active chlorine production and minimizing side reactions and the energy consumption [17]. The durability of ion exchange membranes in hypochlorous acid (HOCl) production depends on several factors, such as the membrane type, operating conditions, electrolyte composition and equipment maintenance [13]. Previous research has reported that high concentrations of electrolyte solutions can degrade the membrane faster; an excessive current density can cause thermal and chemical degradation; elevated temperatures accelerate membrane ageing; and deposits of calcium, magnesium or other minerals can clog or damage the membrane [18]. According to a previous study, anion exchange membranes (AEM) can operate efficiently for more than 12,000 h in alkaline conditions, but their lifetime is significantly reduced in acidic media or in the presence of high chloride concentrations due to the chemical and mechanical degradation of the membrane [19]. The formation of active chlorine and hypochlorous acid in electrolytic cells can be described by several reaction mechanisms. At the anode, the chloride ion is rapidly oxidized by the action of an electric current to produce chlorine gas, as shown in Equation (1):
2 C l C l 2 g + 2 e
Previous studies have mentioned that, at the anode, the accumulation of H+ ions causes the migration of chloride (Cl) from the sodium chloride-containing compartment across the anion exchange membrane [20]. Chlorine gas undergoes a deproportionation reaction with water to form hypochlorous acid (HClO), chloride ions and hydrogen ions, as shown in the following Equation (2):
  H 2 O + C I 2 g H C l O + H + + C l
Upon the dissociation of hypochlorous acid (HClO), a hypochlorite ion (H+) and hypochlorite ion (ClO) are generated in situ, according to the reaction in Equation (3):
H C l O C l O + H +
The pH level of the solution generated by electrolysis from a sodium chloride solution is an important parameter in obtaining hypochlorous acid (HClO) [21]. Depending on the pH of the solution, three chlorine species are continuously generated in the electrochemical system: chlorine gas (Cl2), hypochlorous acid (HClO) and hypochlorite ions (ClO) [22]. Figure 1 shows the different forms of chlorine, which depend on the pH of the solution. Previous studies [23] have mentioned that acidic media with a pH ≥ 0 lead to the formation of chlorine gas through reaction (1). Hypochlorous acid is produced as the pH of the solution changes between 3.5 and 7, through Equation (2). Hypochlorite becomes the dominant product under alkaline conditions with > 7.5. For example, hypochlorous acid (HClO) can reach its maximum production when the pH of the solution is between 5 and 6.5. At a near-neutral pH, hypochlorous acid is the dominant form of free chlorine and could enhance the inactivation of microorganisms [24].
In the electrolysis process, the release of chlorine is simultaneously accompanied by the generation of oxygen through reaction (4):
  2 H 2 O O 2 g + 4 H + + 4 e
The oxygen evolution reaction depends on the pH of the solution, while the chlorine evolution reaction is influenced by the concentration of chloride ions [26]. The selectivity between the reactions of chlorine and oxygen evolution on the anode surface is closely related to the anode’s surface structure [26]. To favor the selectivity evolution reaction toward the production of chlorine instead of oxygen, the chlor-alkali process is optimized under conditions characterized by high current densities (1.5 to 7 kAm−2), using highly concentrated brine solutions (3 to 6 M NaCl), maintaining a pH range of 2 to 4 and operating at a temperature of 90 °C [27]. In order to minimize the formation of chlorate and chlorite during hypochlorous acid production, Ocasio et al. have recommended certain mitigation strategies: control of the pH level, temperature and electric current density; the selection of suitable electrodes; and the regular maintenance of the system [28]. Various secondary reactions may also occur, depending, in particular, on the electrodes used and the operating voltage [29]. Czarnetzki and Janssen investigated the formation of hypochlorite and chlorate during the decomposition of hypochlorous acid; the proposed mechanisms of the reactions in the anodic compartment are the following [30]:
  2 H C l O C l O 2 + 2 H + + C l
C l O 2 + H C l O   C l O 3 + H + + C l
Previous studies have reported the chlorate concentration levels in the anolyte in relation to the electric current applied to a split cell with an anion exchange membrane, operating discontinuously. The chlorate levels obtained ranged from 0.25 to 2.5 ppm for changes in the electric current intensity from 50 mA to 900 mA and for a charge density of 1000 CxL−1 [13]. In unsplit cells, the proximity between the anode and cathode facilitates secondary reactions that can generate chlorates and chlorites [31]. Studies have shown that HOCl can decompose into hypochlorite ions and subsequently to ClO3 and ClO2, especially under conditions of a neutral to alkaline pH, high hypochlorite concentrations, high temperatures, high current densities and prolonged storage times [28]. Recent research indicates that, even in these configurations, the HOCl generated in the anodic compartment can decompose into ClO3 and ClO2, especially under conditions of an acidic pH and high current densities [28]. Previous studies have reported that HClO accumulation in split-cell systems is more efficient and selective, but chlorate generation can be minimized by maintaining an acidic pH in the anode compartment [32]. The composition and stability of free chlorine species, such as HOCl and OCl, are highly dependent on the pH and operating conditions, with the continuous regime being the most favorable for maintaining the HOCl equilibrium at a suitable level [33]. HOCl production in a continuous system can be optimized by keeping the operating conditions constant (electrolyte feed flow rate, electrolyte concentration, residence time, temperature and electrical potential applied to the cell), which improves the efficiency and quality of the final product [1]. In batch processes, the concentration of HOCl can reach the maximum levels, but prolonged electrolysis tends to reduce the concentration of available chlorine due to secondary reactions and the degradation of the products [34]. In addition, continuous electrolysis allows the better use of the energy supplied, since the system remains stationary, avoiding the consumption peaks typical of the start and stop cycles of discontinuous electrolysis [35]. In continuous mode, it is possible to modify chemical equilibria, requiring precise control of the operating parameters to maintain process selectivity and efficiency [5]. Sodium hydroxide is the predominant strong alkaline compound used in the chemical industry worldwide [34]. Its production in industrial settings is carried out by various adaptations of the chlor-alkali electrolysis method, including the use of mercury, diaphragm and membrane cells, each of which presents significant variations in terms of their implications for environmental sustainability [36]. In the electrochemical system, at the cathode, water decomposes, forming hydrogen gas (H2) and hydroxyl ions, as shown in Equation (7):
  2 H 2 O + 2 e H 2 g + 2 O H
Sodium ions migrate across the membrane to the cathodic compartment and combine with hydroxyl ions generated by the reduction of water at the cathode to form sodium hydroxide, as shown in Equation (8):
N a + + O H N a O H a q
Small industries can install an electrolyzed water generator independently; however, the most suitable electrolysis parameters for their production must be determined. The purpose of this study was to investigate the generation of hypochlorous acid and sodium hydroxide using a laboratory-scale electrodialysis cell. We examined the effects of the electrical potential applied to the cell, the electrolysis time and the chloride concentration on the concentrations of hypochlorous acid and sodium hydroxide obtained. Factors such as the current efficiency, the anodic and cathodic solution pH, the decrease in the sodium chloride concentration and the specific energy consumption were also systematically investigated

2. Materials and Methods

2.1. Chemicals and Materials

High-purity sodium chloride crystals containing 99.9% (w/w) NaCl, hydrochloric acid (HCl), potassium iodide (KI), sodium thiosulfate (Na2S2O3) and silver nitrate (AgNO3) were supplied by the CIMATEC S.A.C. Company. Potassium chromate solutions, phenolphthalein and starch solutions were used in the assays. Reverse osmosis water (total dissolved solids) at 2 parts per million was used to prepare the solutions, which were generated internally using the company’s equipment (Xi’an CHIWATEC Water Treatment Technology of the republic of China, Xi’an, China).

2.2. Electrodes

The electrolytic cell used in the experiments consisted of a titanium anode coated with a mixture of ruthenium oxide and iridium (Ti-RuO2-IrO2) and a pure titanium cathode, both with dimensions of 5 cm × 10 cm × 1.5 mm. These electrodes were purchased from the Fujiang Wiztech Intelligence Technology Co., LTD., Fujian Province, Fuzhou, China. Previous studies have reported that ruthenium has good activity, not only for the evolution of chlorine in a saturated sodium chloride solution, as used in the chlor-alkali industry, but also for the evolution of oxygen in a solution of sodium sulfate [37].

2.3. Ion Exchange Membranas

A cation exchange membrane and an anion exchange membrane manufactured by Schekinoazot (Rusia), with a working surface of 90 cm2, were used. Prior to each test, the membranes were immersed for 48 h in a 5% NaCl solution to allow hydration and expansion. Table 1 shows the main characteristics of each membrane.

2.4. Analysis of Electrolyzed Water and Sodium Hydroxide

To evaluate the concentration of available chlorine, it was measured by the iodometric method. Thirty-five mL of 5% potassium iodide (KI) solution and 1 N hydrochloric acid were introduced into a 5 mL sample and it was shaken vigorously for 15 s. The resulting mixture was then titrated with a standardized 0.01 N sodium thiosulfate solution until the end point, characterized by a pale yellow hue, was determined. Subsequently, drops of 0.5% starch indicator were added and the titration process was resumed until a colorless end point was established. The solution was analyzed immediately in order to avoid the degradation of the active component. The concentration of free available chlorine was quantified using Equation (9) [38]:
D m g L = A · B · 35.45 C × 1000
D is the concentration of available chlorine in mg/L; B is the concentration of sodium thiosulfate (N); A is the spent volume of sodium thiosulfate titrated in mL; and C is the weight of the sample used (g).
The changes in the sodium hydroxide concentration were determined by acid–base titration with a calibrated 0.01 N hydrochloric acid solution, using phenolphthalein as an indicator. The sodium hydroxide concentration was calculated using Equation (10):
C N a O H = C H C l ·   V H C l V N a O H
CNaOH (mol/L) is the concentration obtained from the NaOH solution; VNaOH (mL) is the volume of NaOH used; VHCl (mL) is the volume of acid used for titration; and CHCl is the concentration of HCl (0.01 N).
The pH values of the disinfectant solution (HClO) and sodium hydroxide were measured using a precalibrated pH meter (HI 98121, Hanna Instruments, EE.UU., Smithfield, RI, USA). The variations in the chloride concentration before and after electrolysis were determined by titration with silver nitrate. The degree of conversion of chloride ions after electrolysis was calculated via Equation (11):
X A = C A 0 C A C A 0 × 100 %
where XA is the degree of conversion of chloride ions; CA0 is the chloride concentration before performing the test; and CA is that at the end of the experiment. This calculation provided a quantitative indicator of the efficiency of the electrolysis process, allowing the removal of chloride ions from the solution to be evaluated.

2.5. Calculation of Energy Consumption and Electrical Current Efficiency

The performance of the experimental equipment for the production of electrolyzed water and sodium hydroxide was evaluated in terms of the energy consumption (E) and current efficiency (η). The unit energy consumption (kWh/kg NaOH) was calculated using Equation (12) [1]:
  E = U 0 t I d t C t · V t · M
where U is the potential across the cell stack (V); I is the current (A); M is the molar weight of Cl2/NaOH; Ct is the chlorine/base production concentration at time t; and Vt is the volume of the acid/base.
The current efficiency of the system was calculated by means of Equation (11) [39]. The current efficiency is, according to Faraday’s law, the ratio of the actual mass of a substance released from an electrolyte by the passage of a current to the theoretical mass released [40].
C u r r e n t   e f f i c i e n c y   % = E x p e r i m e n t a l   p r o d u c t i o n   o f   t o t a l   c h l o r i n e   m g T h e o r e t i c a l   p r o d u c t i o n   o f   t o t a l   c h l o r i n e ,   ( m g ) × 100 %
According to Faraday’s law, for a time-varying current, the electrical efficiency is determined by Equation (14):
  η = C t · V t N 0 t I t d t z · F × 100 %
η is the current efficiency (%); Ct denotes the final concentrations of HClO and NaOH in mol/L; and Vt is the volume of the solution at the end of the experiment in L. In addition, z corresponds to the ionic valence, F is the Faraday constant (F = 96,485 C/mol), and N indicates the number of repeated units (N = 1).

2.6. Taguchi Experimental Design

The Taguchi experimental design was applied for the trials. Table 2 shows three identified factors and their corresponding levels. The sodium chloride concentration, electrical potential and electrolysis time were selected as controllable factors, and their effects on the pH and the concentrations of chlorine and sodium hydroxide formed were evaluated. The specific energy consumption and efficiency of the electric current were also determined. The trials in this study were planned following Taguchi’s L9 orthogonal matrix. Meanwhile, the statistical significance of the independent variables was evaluated by ANOVA. Preliminary experiments were carried out to determine the levels of experimentation for each independent variable, ensuring that the experimental design encompassed the most favorable conditions for the response. Three levels were evaluated for each variable; these levels were −1—low, 0—medium and +1—high. Previous studies have shown that the chloride concentration in the preparation of electrolyzed water is much lower than in the chlor-alkali industry [20]. The synthetic solution was prepared by dissolving sodium chloride in deionized water to obtain concentrations of 5 and 15 g/L NaCl (brackish water) and 30 g/L NaCl (seawater) [6]. Studies have reported several important factors in the production of EW, including the electric current, electrolyte concentration, temperature, flow rate and water hardness [41].

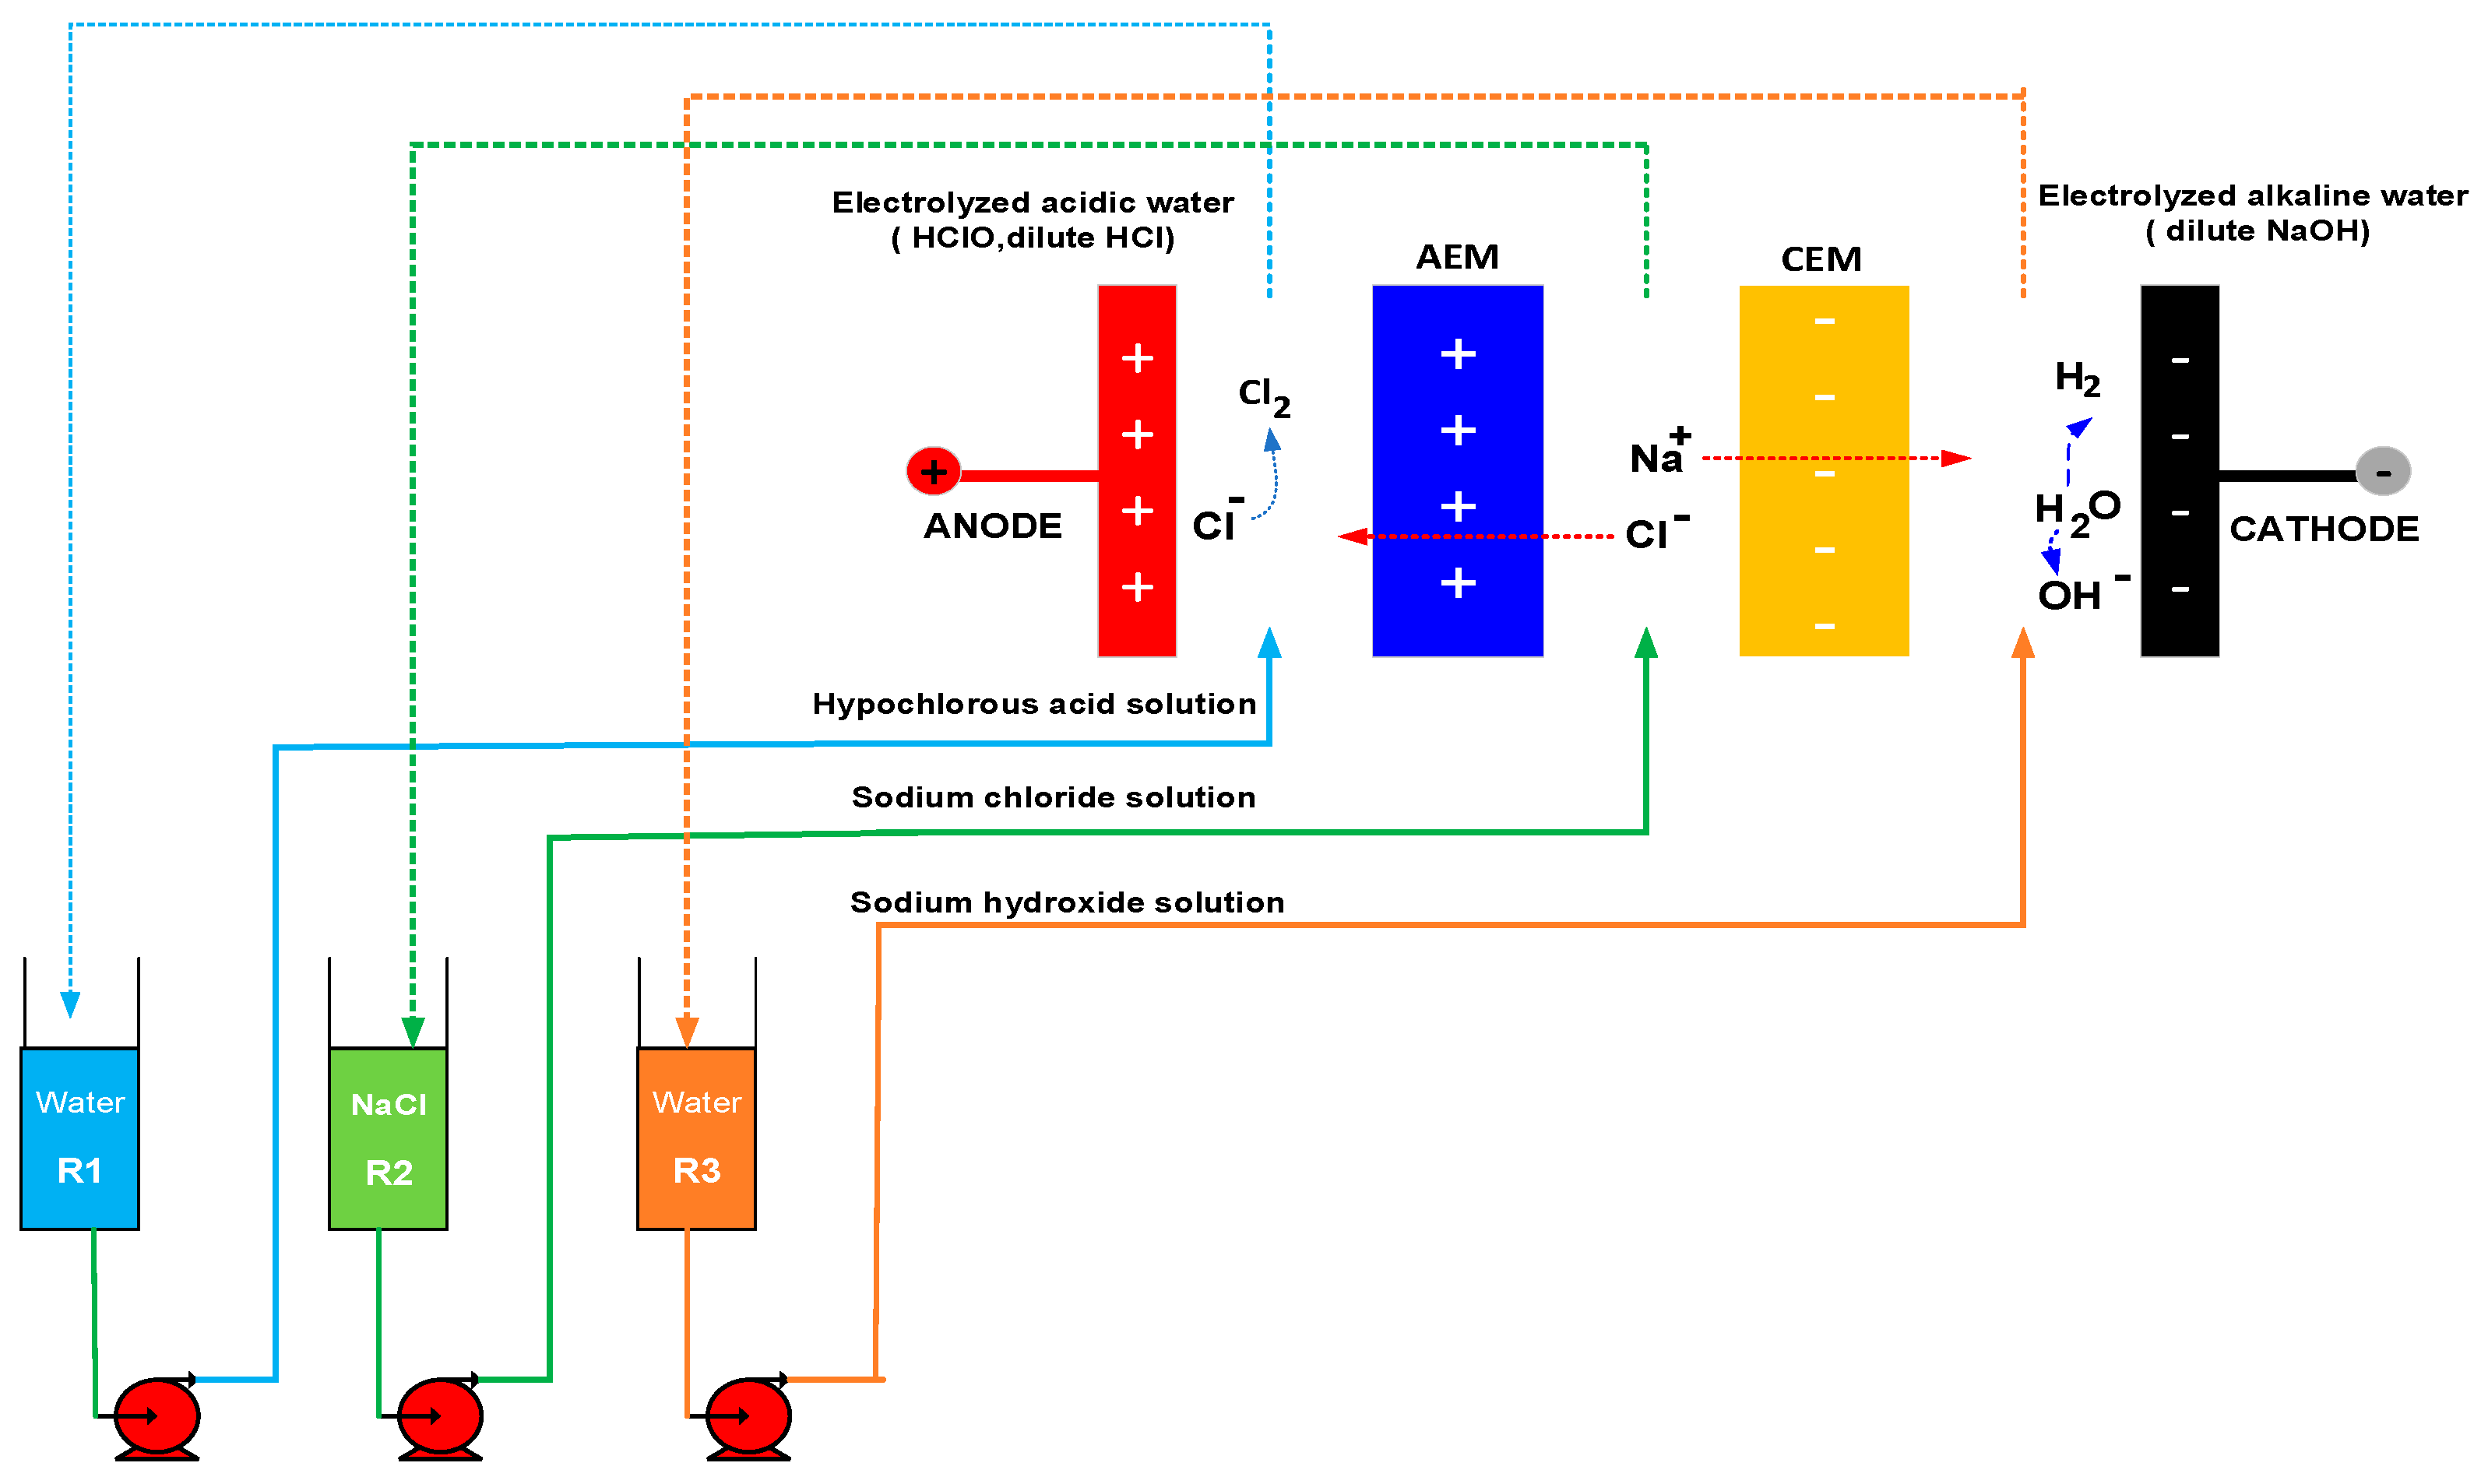
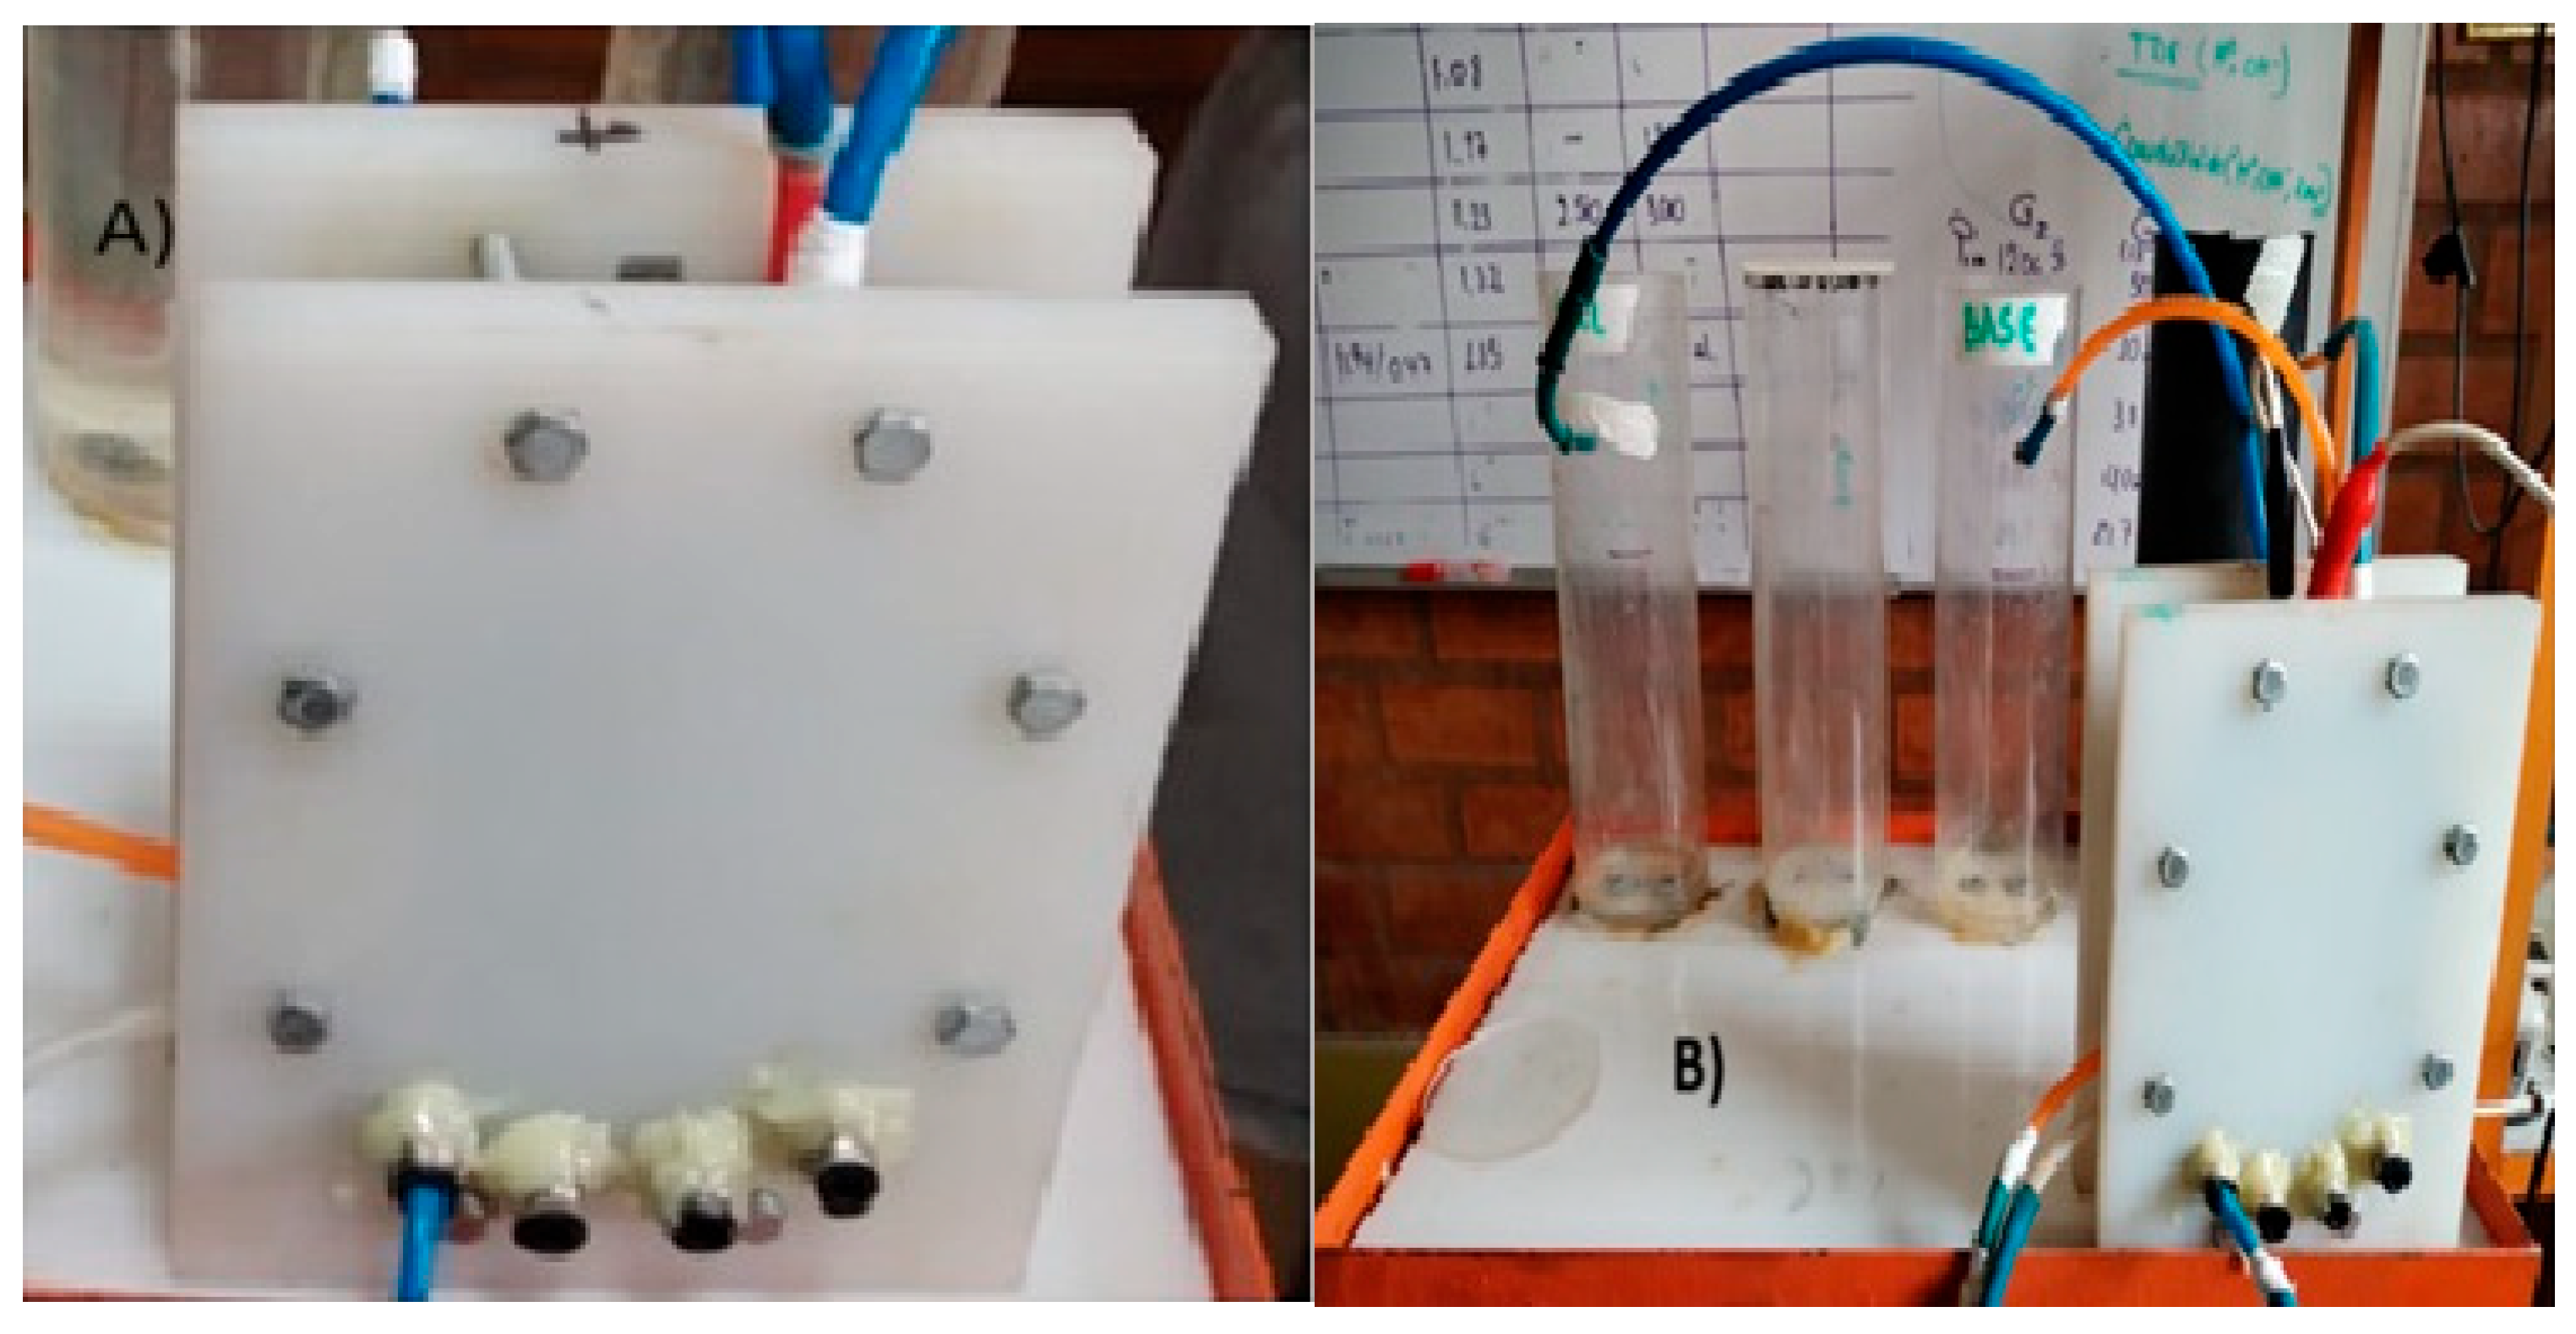
2.7. Experimental Equipment

The generation of electrolyzed water consisted of the electrolysis of sodium chloride in a three-compartment cell that was connected to the rectifier through two electrodes and separated by an anionic membrane and a cationic membrane, as shown in Figure 2. The system consisted of three 1.2 L acrylic containers (R1, R2 and R3) for the sodium hydroxide, sodium chloride and hypochlorous acid solutions. The distance between the electrodes (anode and cathode) was 1.5 cm. The sodium chloride solution (5, 15 and 30 g/L) in vessel R2 was pumped to the electrolyzed water generator. At the beginning of the experiment, the containers (R1 and R3) were pre-filled with 0.8 L of deionized water, and both solutions were transferred to the electrochemical system with independent pumps, as shown in Figure 2. Two types of water with different characteristics were generated: oxidizing electrolyzed water (pH < 2.6) containing dilute hypochlorous acid (HClO) from the anode side and electrolyzed water (pH > 11) containing diluted NaOH. All experiments were carried out in batch mode for better control of the operating conditions. The ambient temperature was monitored throughout the experimental process and was recorded at 26 ± 2 °C. A constant electric potential was applied by means of a DC power supply (A). The intensity of the electric current from the electrical source was recorded throughout the experimental process. The solution was analyzed immediately to avoid the degradation of the active component

2.8. Cell Photograph and Schematic Diagram of Experimental Equipment

The electrodialysis cell took the form of a filter press, consisting of three compartments for the solutions (hypochlorous acid, sodium chloride and sodium hydroxide). Its inner construction consisted of acrylic material on which two ion exchange membranes (cationic and anionic) were assembled with their corresponding turbulence promoters. The exterior consisted of two plates fixed and fastened with eight cross bars with nuts to prevent the leakage, mixing or spillage of the liquid, as shown in Figure 3.

3. Results and Discussion

3.1. Results of the Studied Variables

Table 3 shows the effects of the cell operating parameters on the chlorine concentration, sodium hydroxide, pH, chloride conversion, energy consumption and electrical efficiency.
Table 4 presents the results in terms of the descriptive statistics, chlorine concentration, sodium hydroxide concentration, chloride ion conversion and current efficiency.

3.2. Responses as a Function of Factors

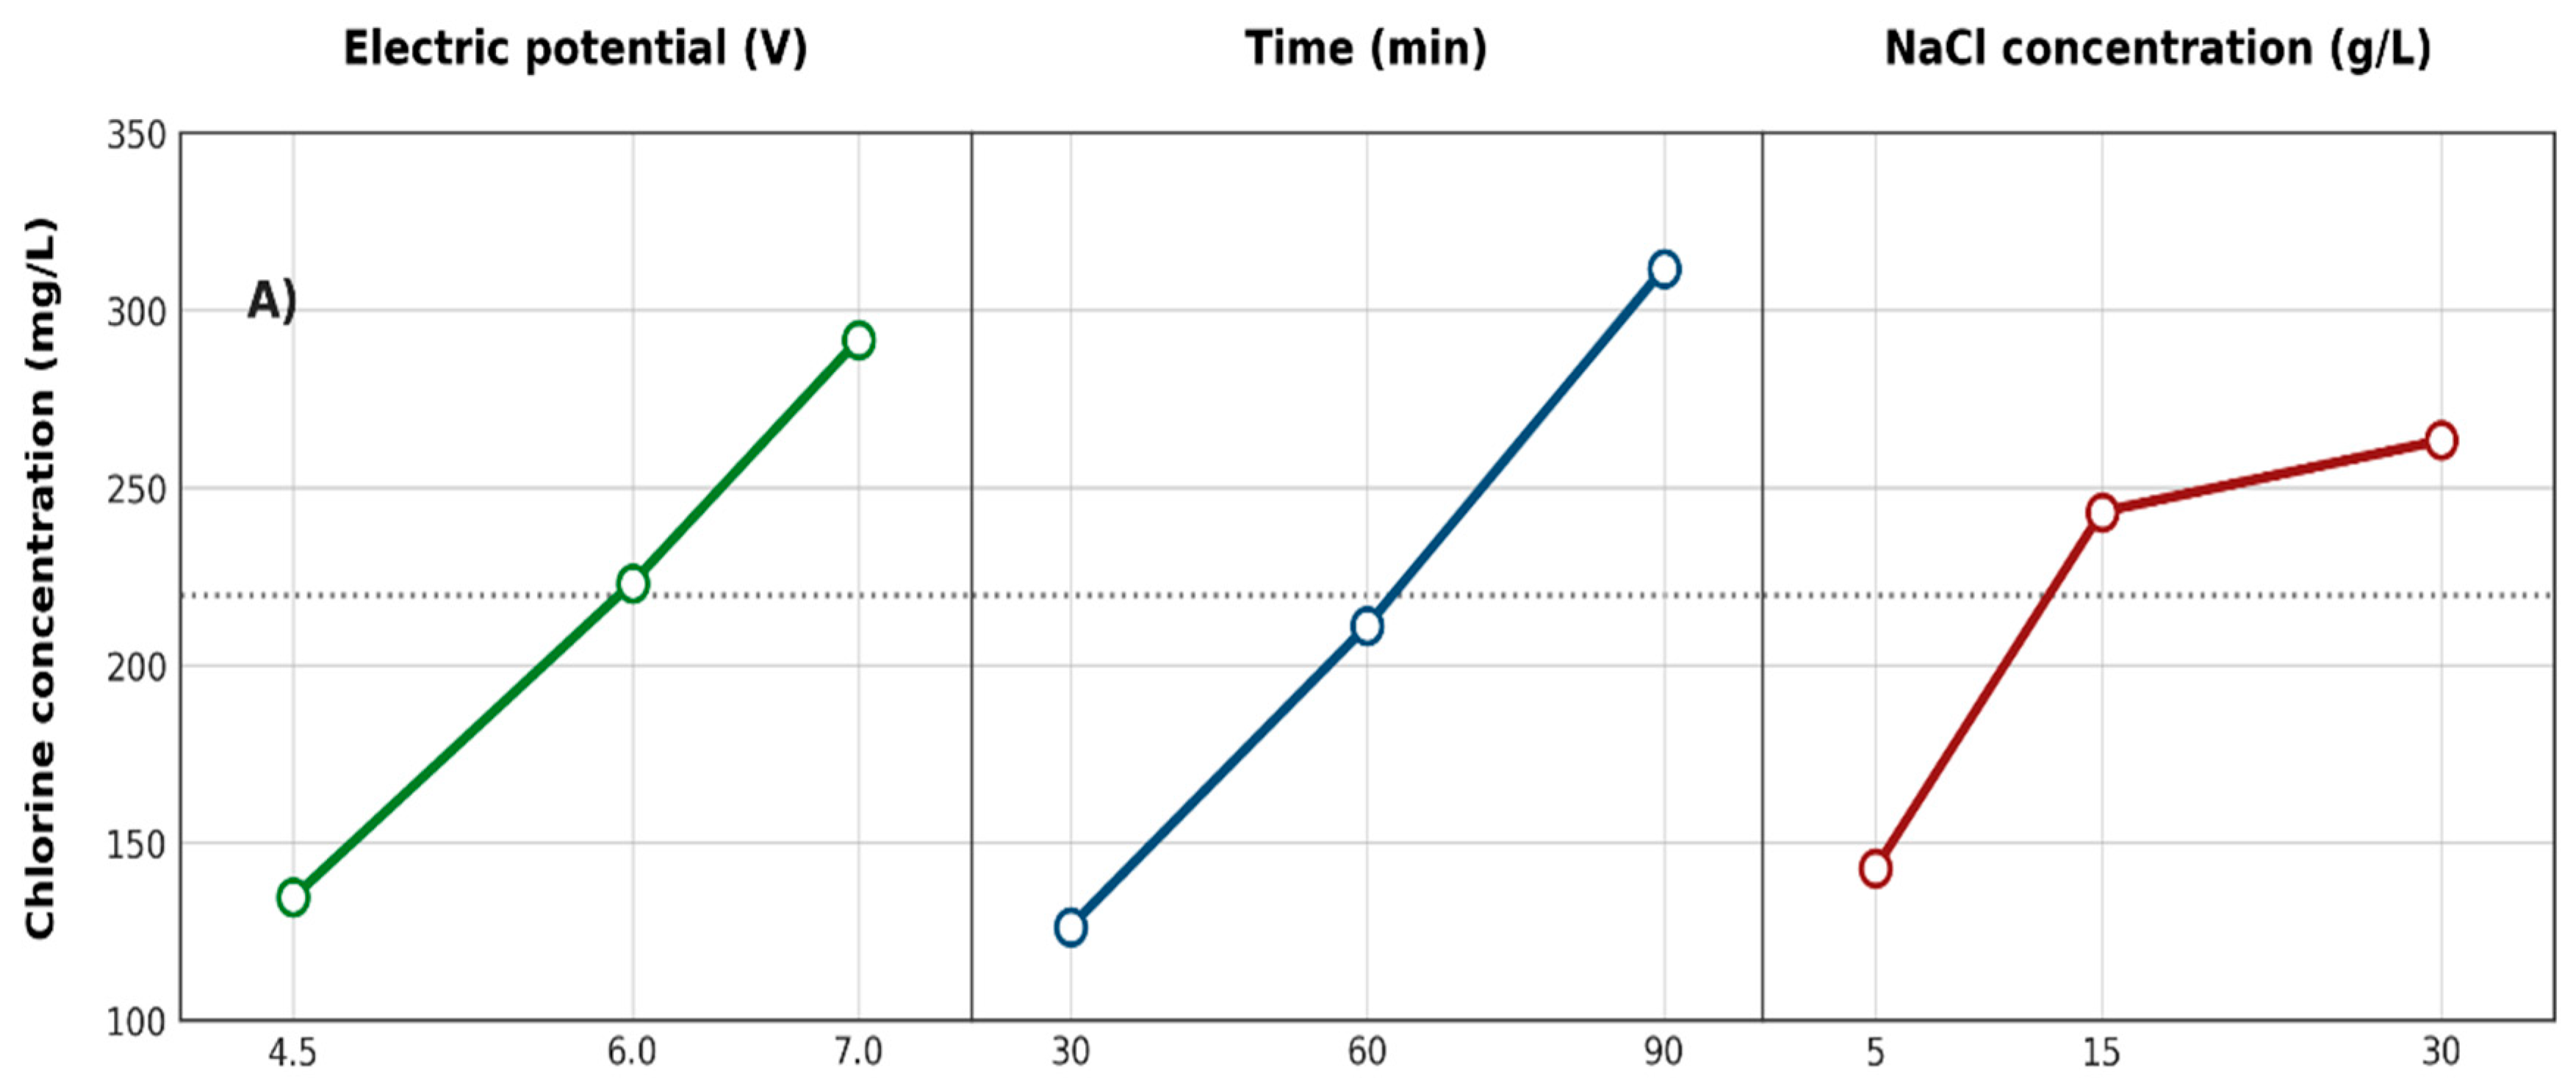
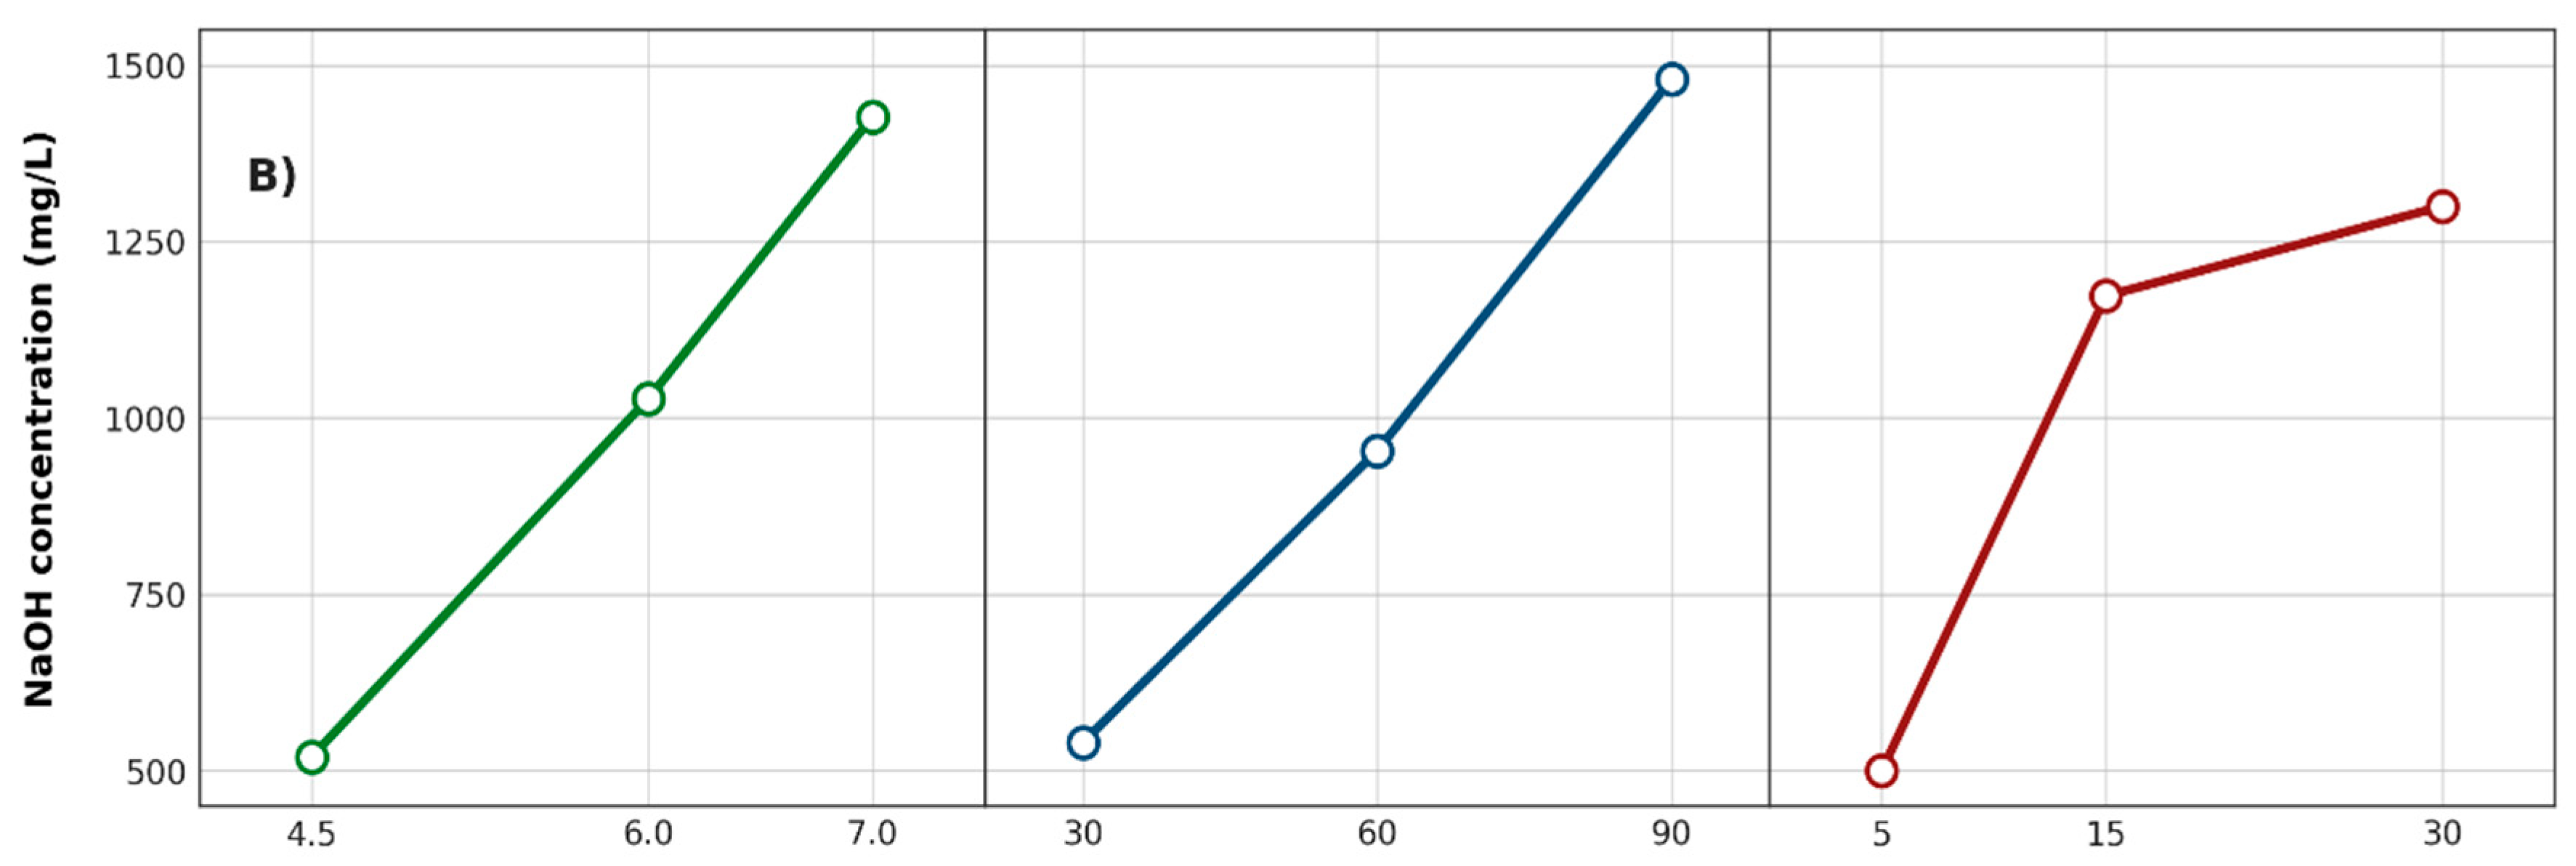
3.2.1. Active Chlorine and Sodium Hydroxide Concentrations

Table 3 shows the chlorine and sodium hydroxide concentrations reached according to the factors and levels studied. Figure 4 shows that the best performances is observed that the best performance (providing the highest concentrations of chlorine and sodium hydroxide) is obtained at the highest test levels (7 V, 90 min and 30 g/L). An electrolysis time of between 60 and 90 min has the greatest effect on the concentrations of chlorine and sodium hydroxide due to its higher growth slope; this result is in line with Faraday’s law. The results of the research suggest that, although prolonging the duration of electrolysis increases the production of chlorine and sodium hydroxide, it simultaneously produces an increase in energy consumption. Previous studies conducted with a splitless reactor for HClO generation show that the application of a high voltage causes a slight increase in the concentration of available chlorine. They also mention that an increase in the concentration of the NaCl solution significantly improves the concentration of available chlorine [1]. The hypothesis is that the decrease in the chlorine concentration with increasing sodium chloride concentrations (level 3) is due to the loss of chlorine gas. Recent studies indicate that long times can increase the concentration of HClO to a maximum point, after which a decrease is observed due to the decomposition and formation of by-products such as hypochlorite (OCl) and chlorate (ClO3) [41]. This shows that it is necessary to set the appropriate duration of electrolysis to achieve the maximum concentration of HOCl and to avoid the formation of unwanted by-products [42]. Nurul Aniyyah et al. (2022) reveal that an electrolysis time of between 30 and 60 min is generally adequate to maximize hypochlorous acid production in ion exchange membrane systems, balancing product generation and stability [42]. Other studies have also found that the chlorine concentration reaches its maximum level at a specific time during the electrolysis process and that the further prolongation of the time results in a decrease in the chlorine concentration [12].

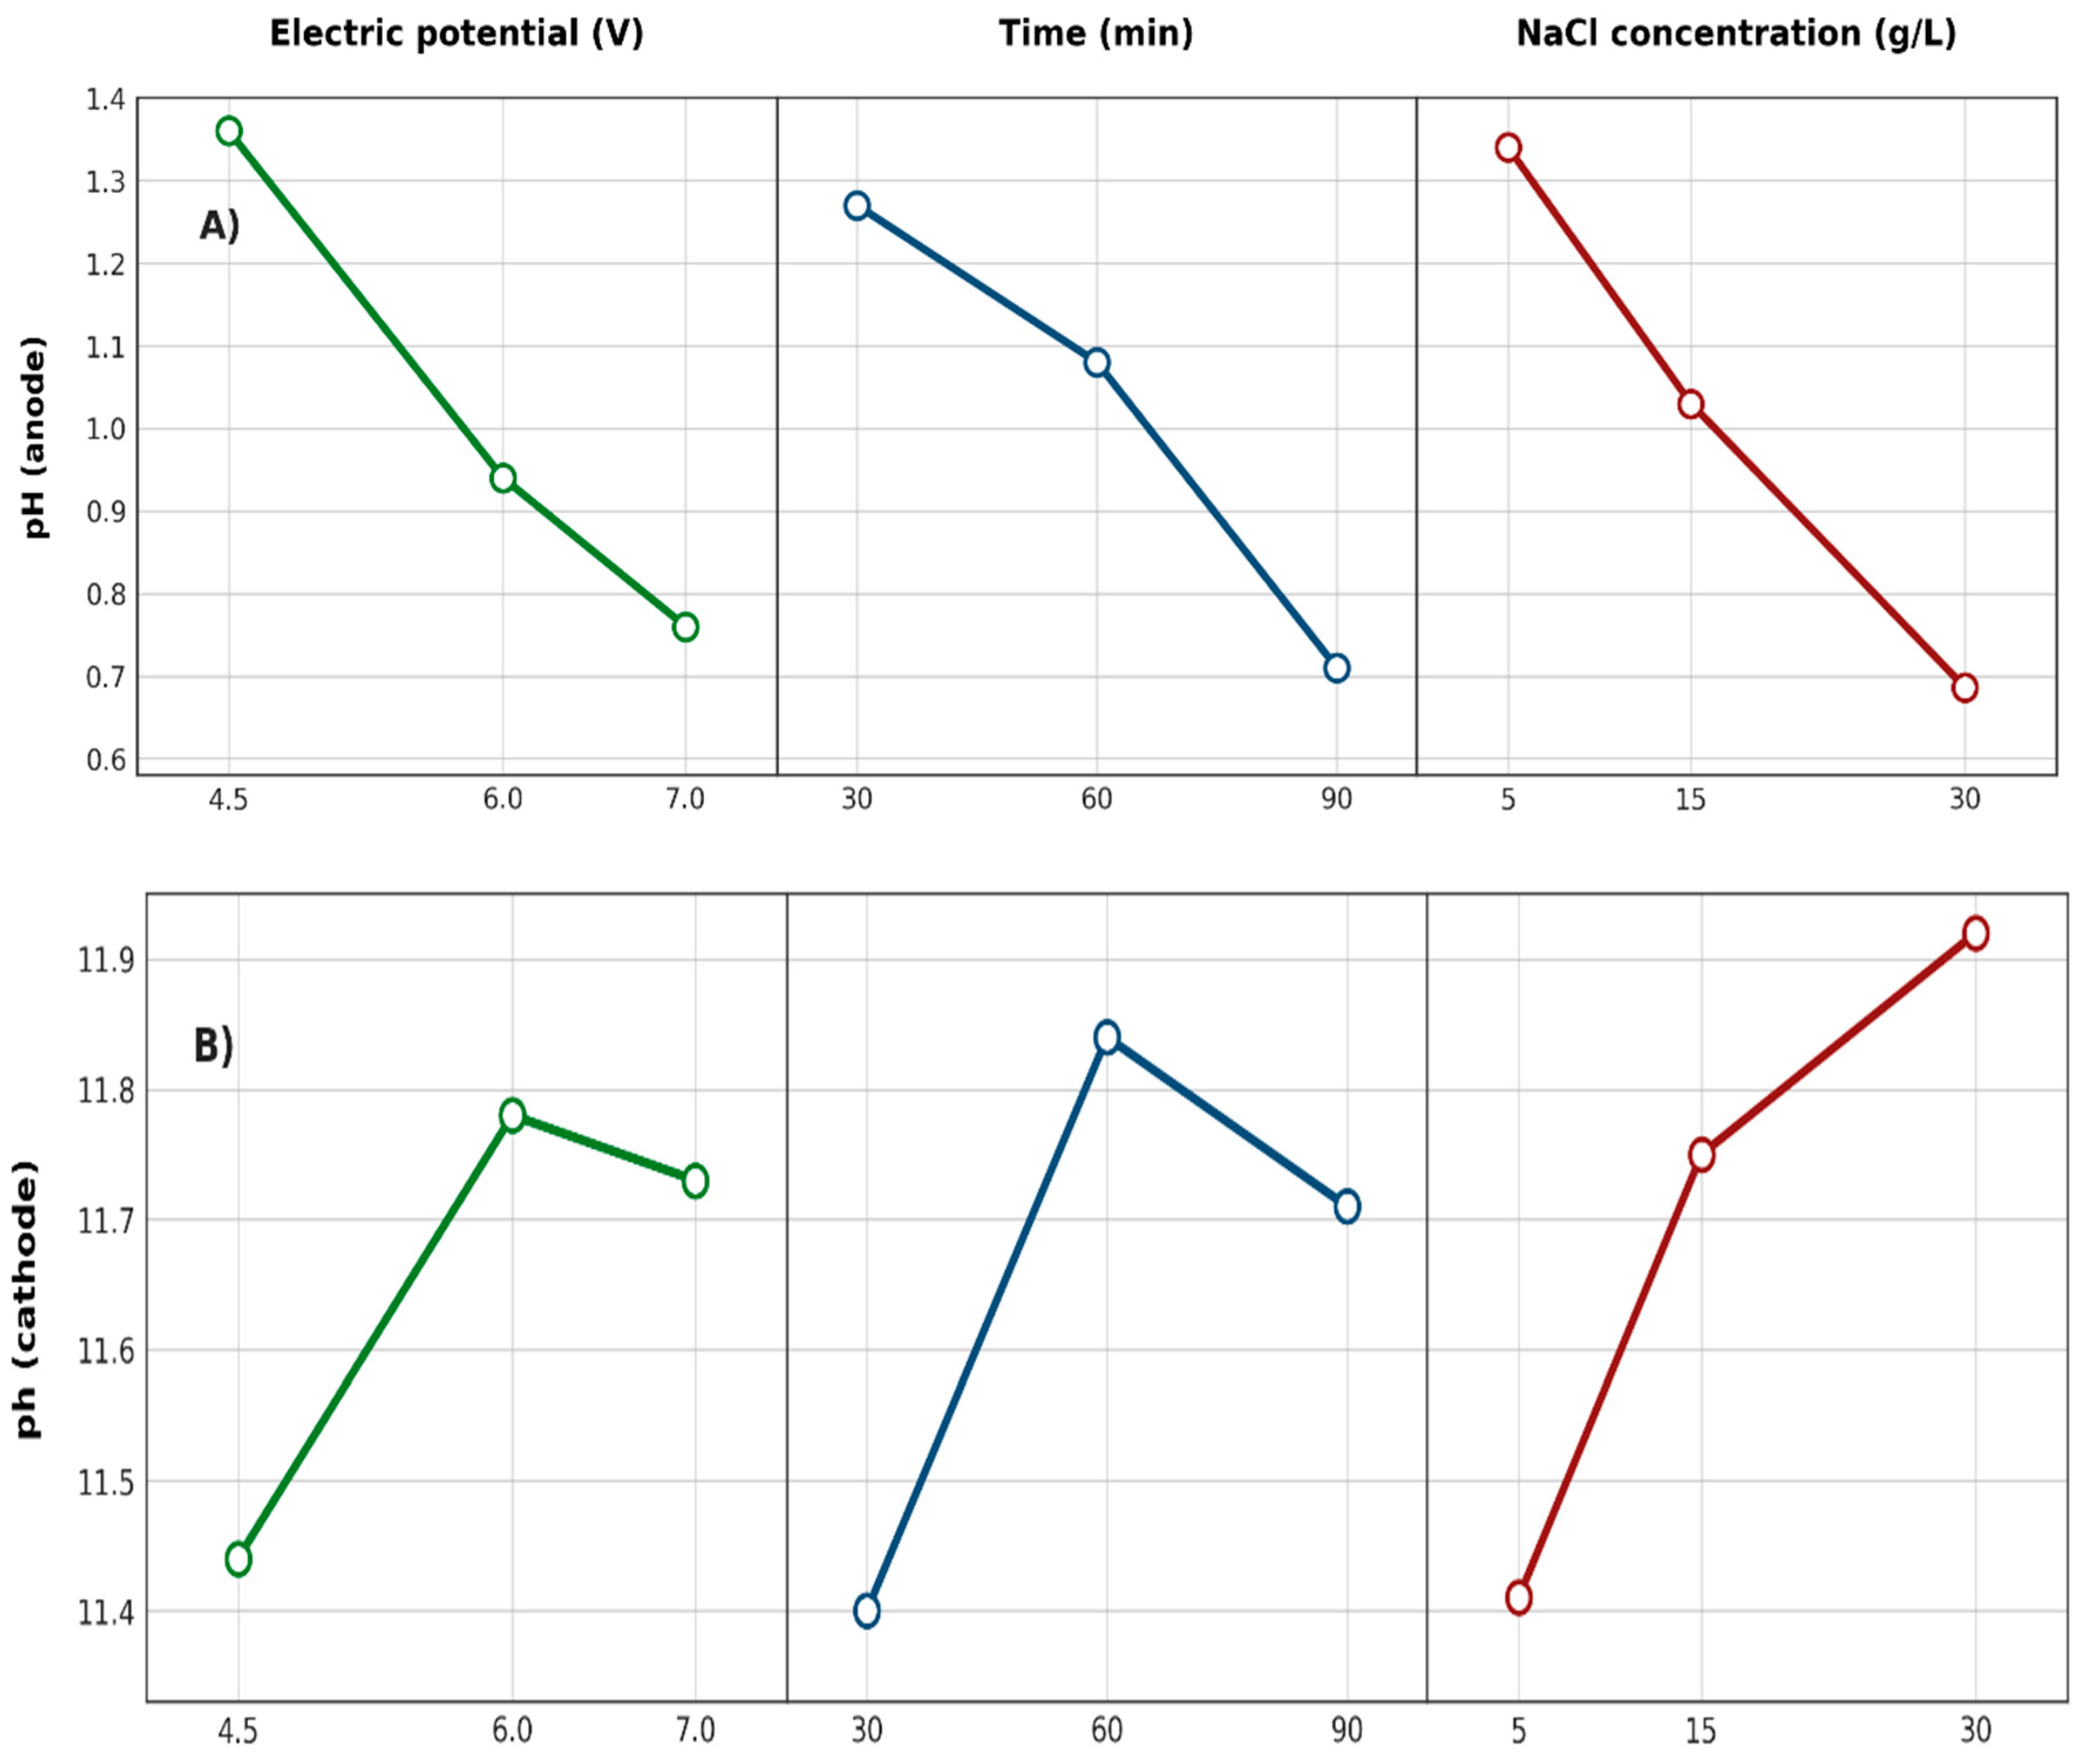
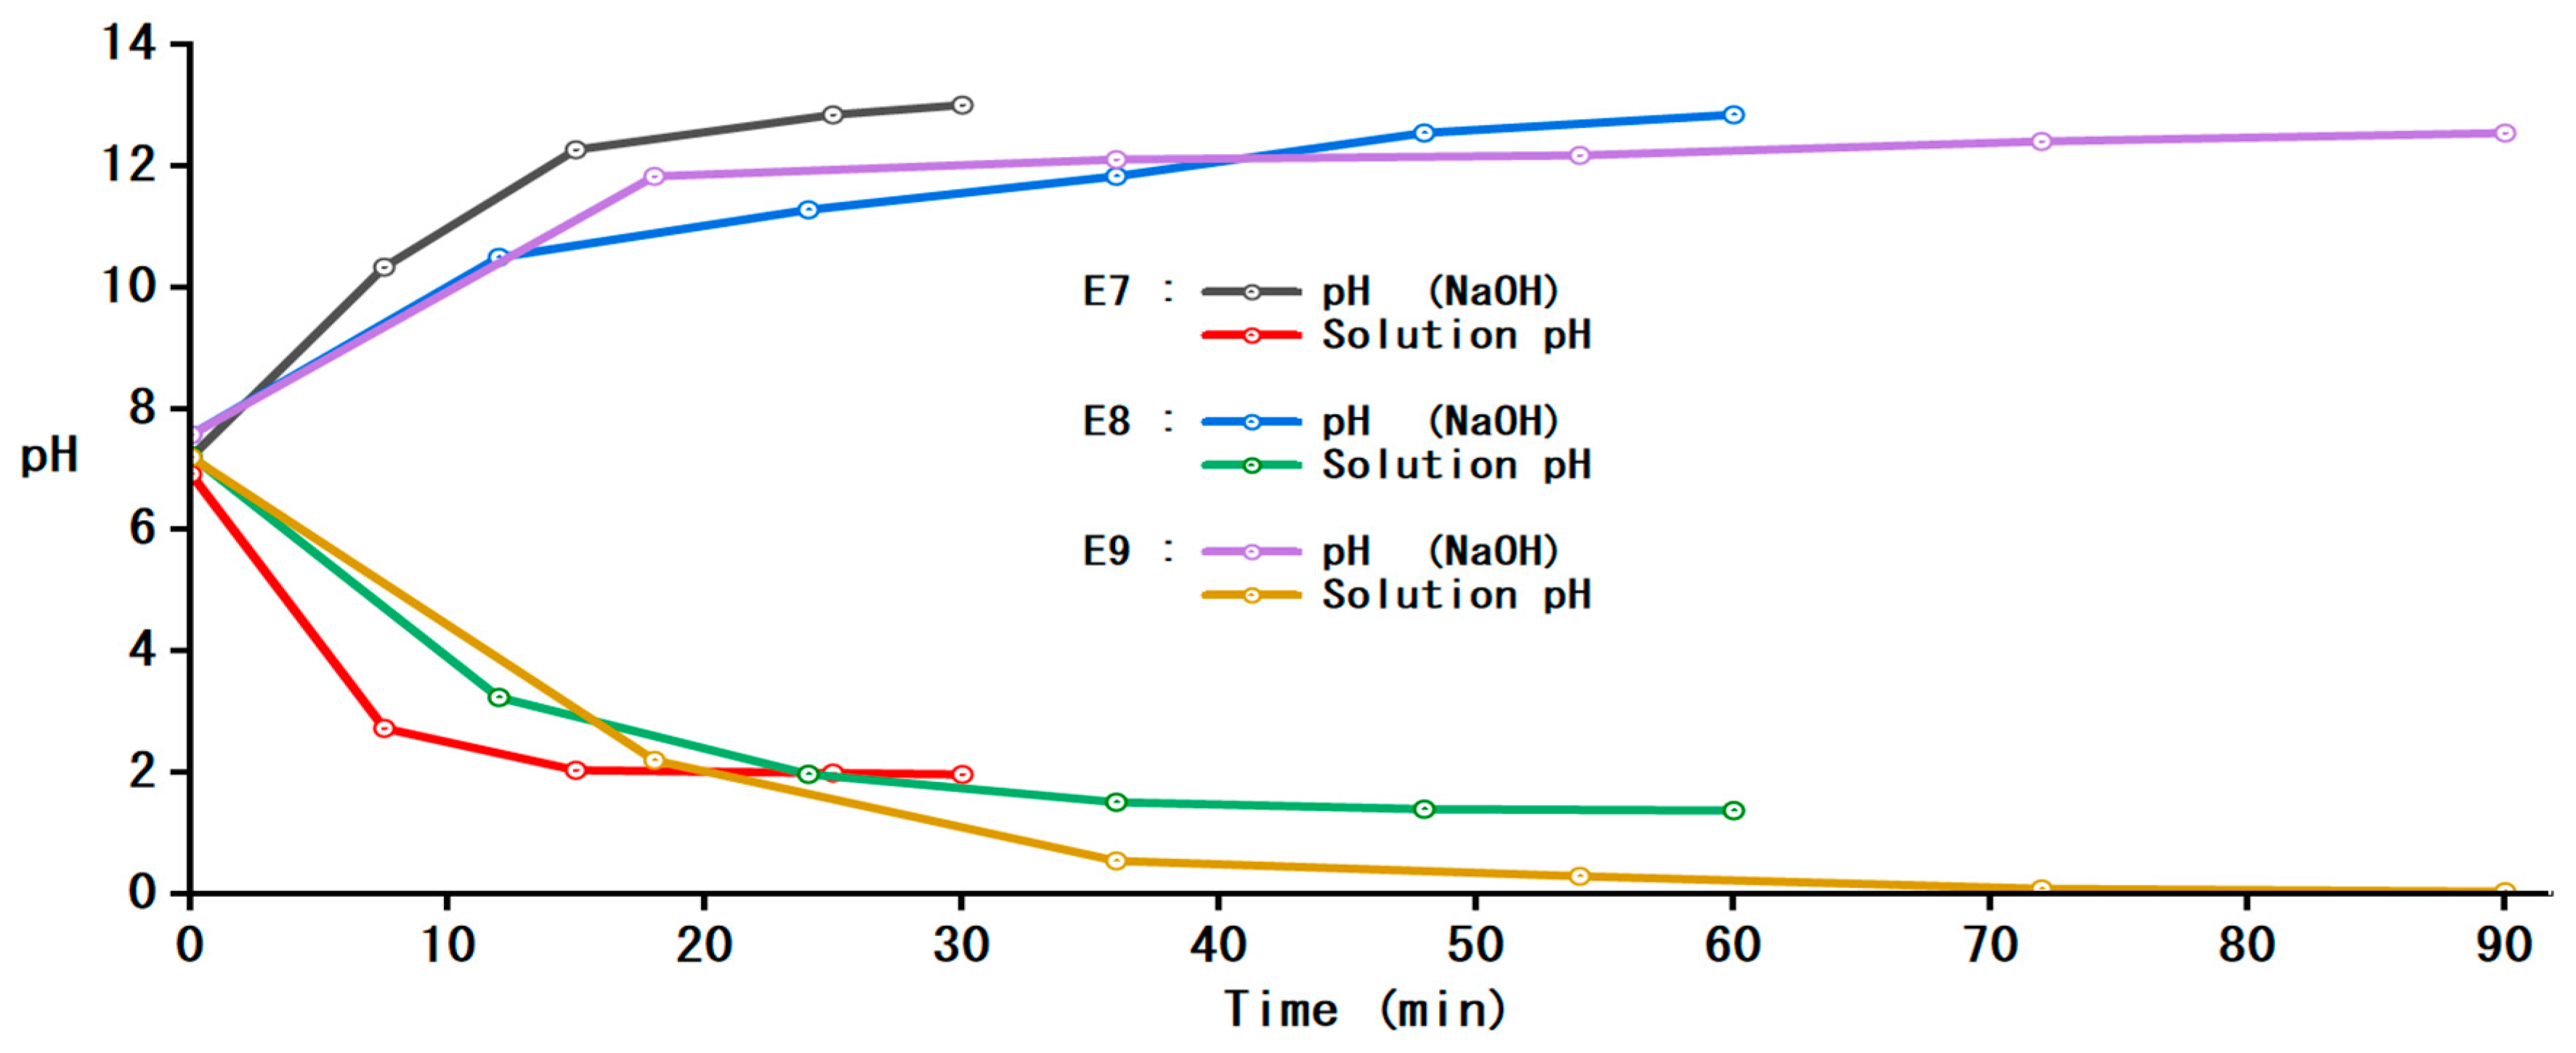
3.2.2. pH Indices of Solutions in Anodic and Cathodic Compartments

Electrolyzed water, with a lower pH level, has strong antimicrobial properties, making it ideal for disinfection purposes in medical settings, as well as in the industrial sector [43]. However, Cl2 in electrolyzed water easily evaporates into the air, which can cause harm to humans. Furthermore, due to its high acidity, AEW can corrode organic materials, which can lead to safety hazards. Electrolyzed water, characterized by a higher pH, is commonly used in degreasing, sterilization and emulsification processes in industrial and cleaning applications [44]. The pH of the acidic (anode) and basic (cathode) solutions showed a progressive increase with increasing electrical potentials, sodium chloride concentrations and electrolysis times. Figure 5 illustrates the results obtained under the experimental conditions of 7 V, a duration of 90 min and a concentration of 30 g/L NaCl, resulting in a pH measurement of 1.5 for acidic solutions and 13 for basic solutions, respectively. The highest results were achieved with experimental levels of 7 V, 90 min and 30 g/L of NaCl, achieving a pH value of 1.5 and 13 for the acidic and basic solutions, respectively. Figure 6 illustrates the temporal progression of the pH levels in the anodic and cathodic compartments as a function of the duration of electrolysis for experiments 7, 8 and 9. It is clear that, in the initial stage of the experiment, the pH level of the water was approximately 7 in both compartments; as the electrolysis progressed over the first 10 min, the pH values of both solutions exhibited a linear variation. During the following 10 to 30 min interval, the rate of pH increase was noticeably slower in both solutions. Furthermore, the electrolysis time was observed to have a pronounced effect on the pH variation in both compartments. Maintaining a constant NaCl concentration ensures the stability of the cell voltage and current density, which are crucial factors in controlling side reactions such as oxygen evolution at the anode, which reduces the chlorine purity. It also helps to maintain pH and ionic strength conditions that are favorable for HOCl stability [29].
Table 5 shows the companies that build devices for the generation of electrolyzed water. As can be seen, the available chlorine concentrations are in the range of 18.67 to 200 mg/L and the pH is 5.46–6.36, while, in the case of N° 5, in the anodic compartment, the pH is 2.71, and that in the cathodic compartment is 11.91.

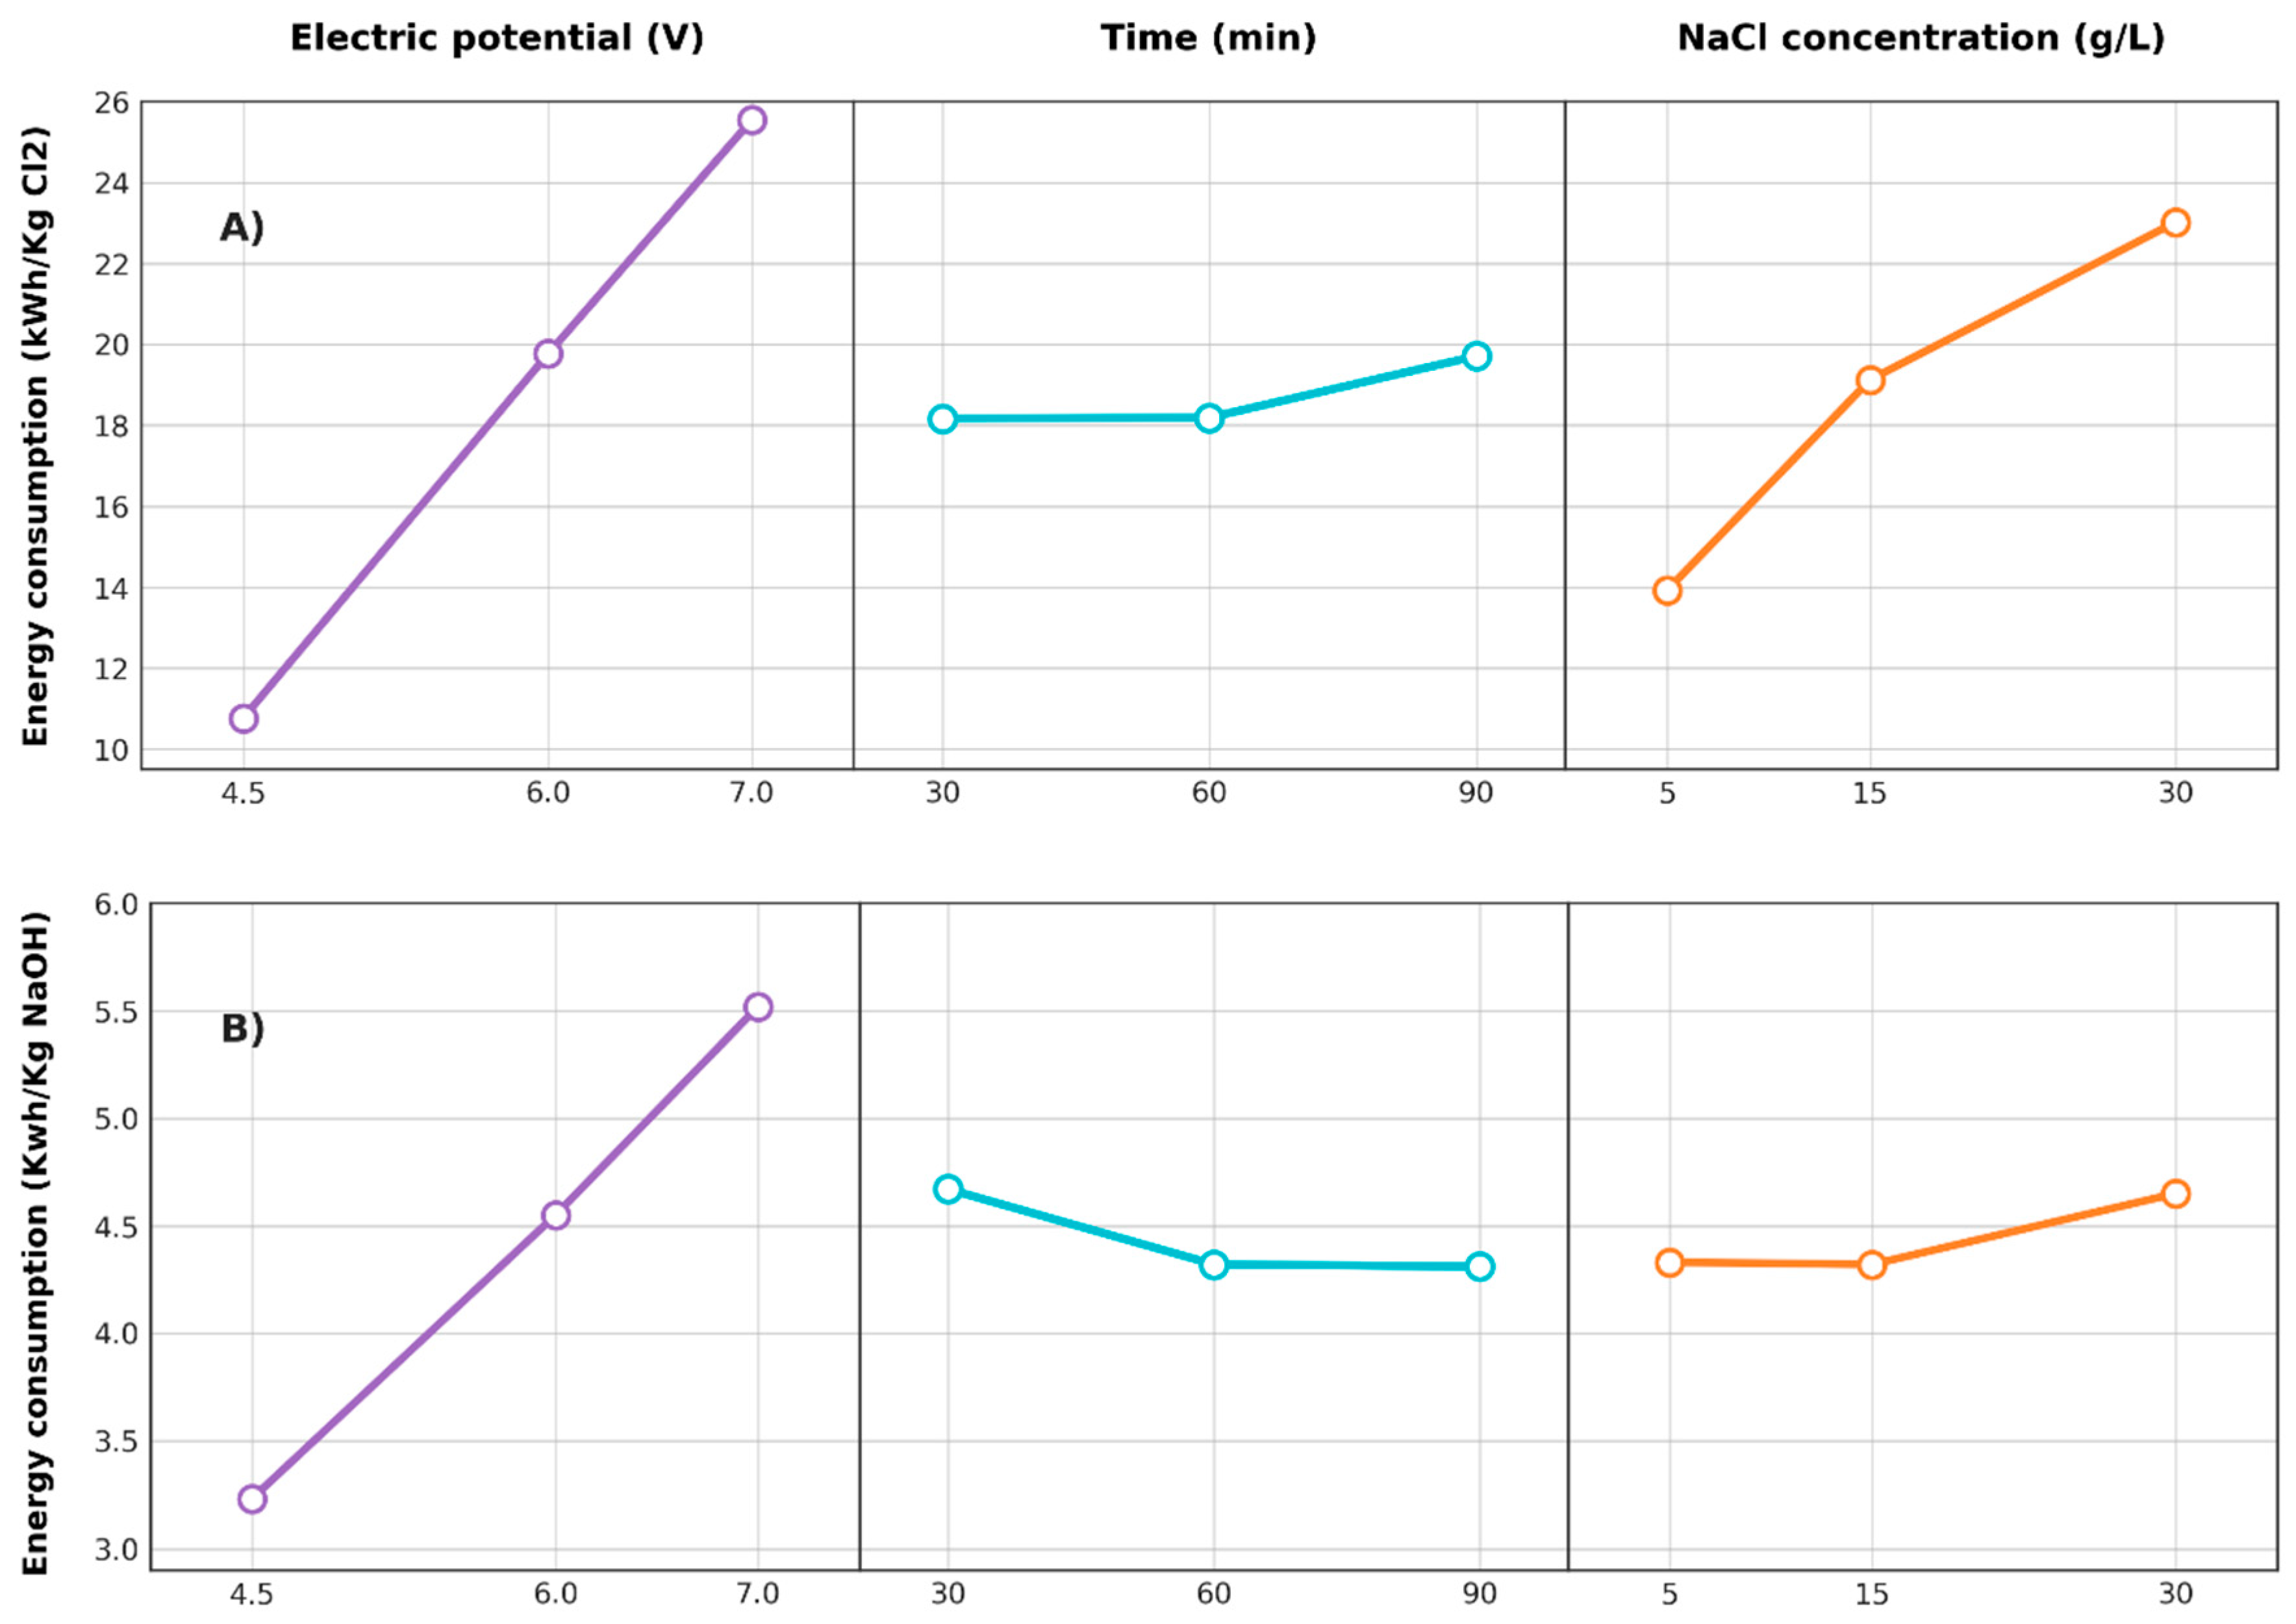
3.2.3. Energy Consumption

Figure 7 shows the mean energy consumption at each factor level. The energy consumption showed a progressive increase with increasing electrical potentials and also with the level of sodium chloride concentration present. When the electric potential was 4.5 V, the energy consumption was 10.5, while, at 7 V, it was 25.8 kWh/kg Cl2. Likewise, for a sodium chloride concentration of 5 g/L, the energy consumption was 14, and, at 30 g/L, it was 23.4 kWh/kg Cl2. With changes in the electrolysis time, the changes in the levels of energy consumption were not significant. However, a lower energy value was obtained when the electrolysis time was 30 min (18.2 kWh/kg Cl2). Regarding sodium hydroxide generation, it was observed that the energy consumption (kWh/Kg NaOH) was directly proportional to the experimental parameters (electric potential and salt concentration), while the electrolysis time showed an inverse correlation with the energy consumption. According to these results, it has been observed that an increase in the electrical potential has the greatest influence on the energy consumption in the generation of chlorine and sodium hydroxide by means of an electrolytic cell. As expected, the energy consumption was higher when a higher electrical potential (higher current) was applied, together with an increase in the sodium chloride concentration, which was manifested as the higher electrical conductivity of the electrolyte solution.
Depending on the technology studied, the specific energy consumption vary depending on the cell design. Table 6 presents the technologies used for the production of chlorine-based compounds, together with their specific energy consumption and the corresponding references.

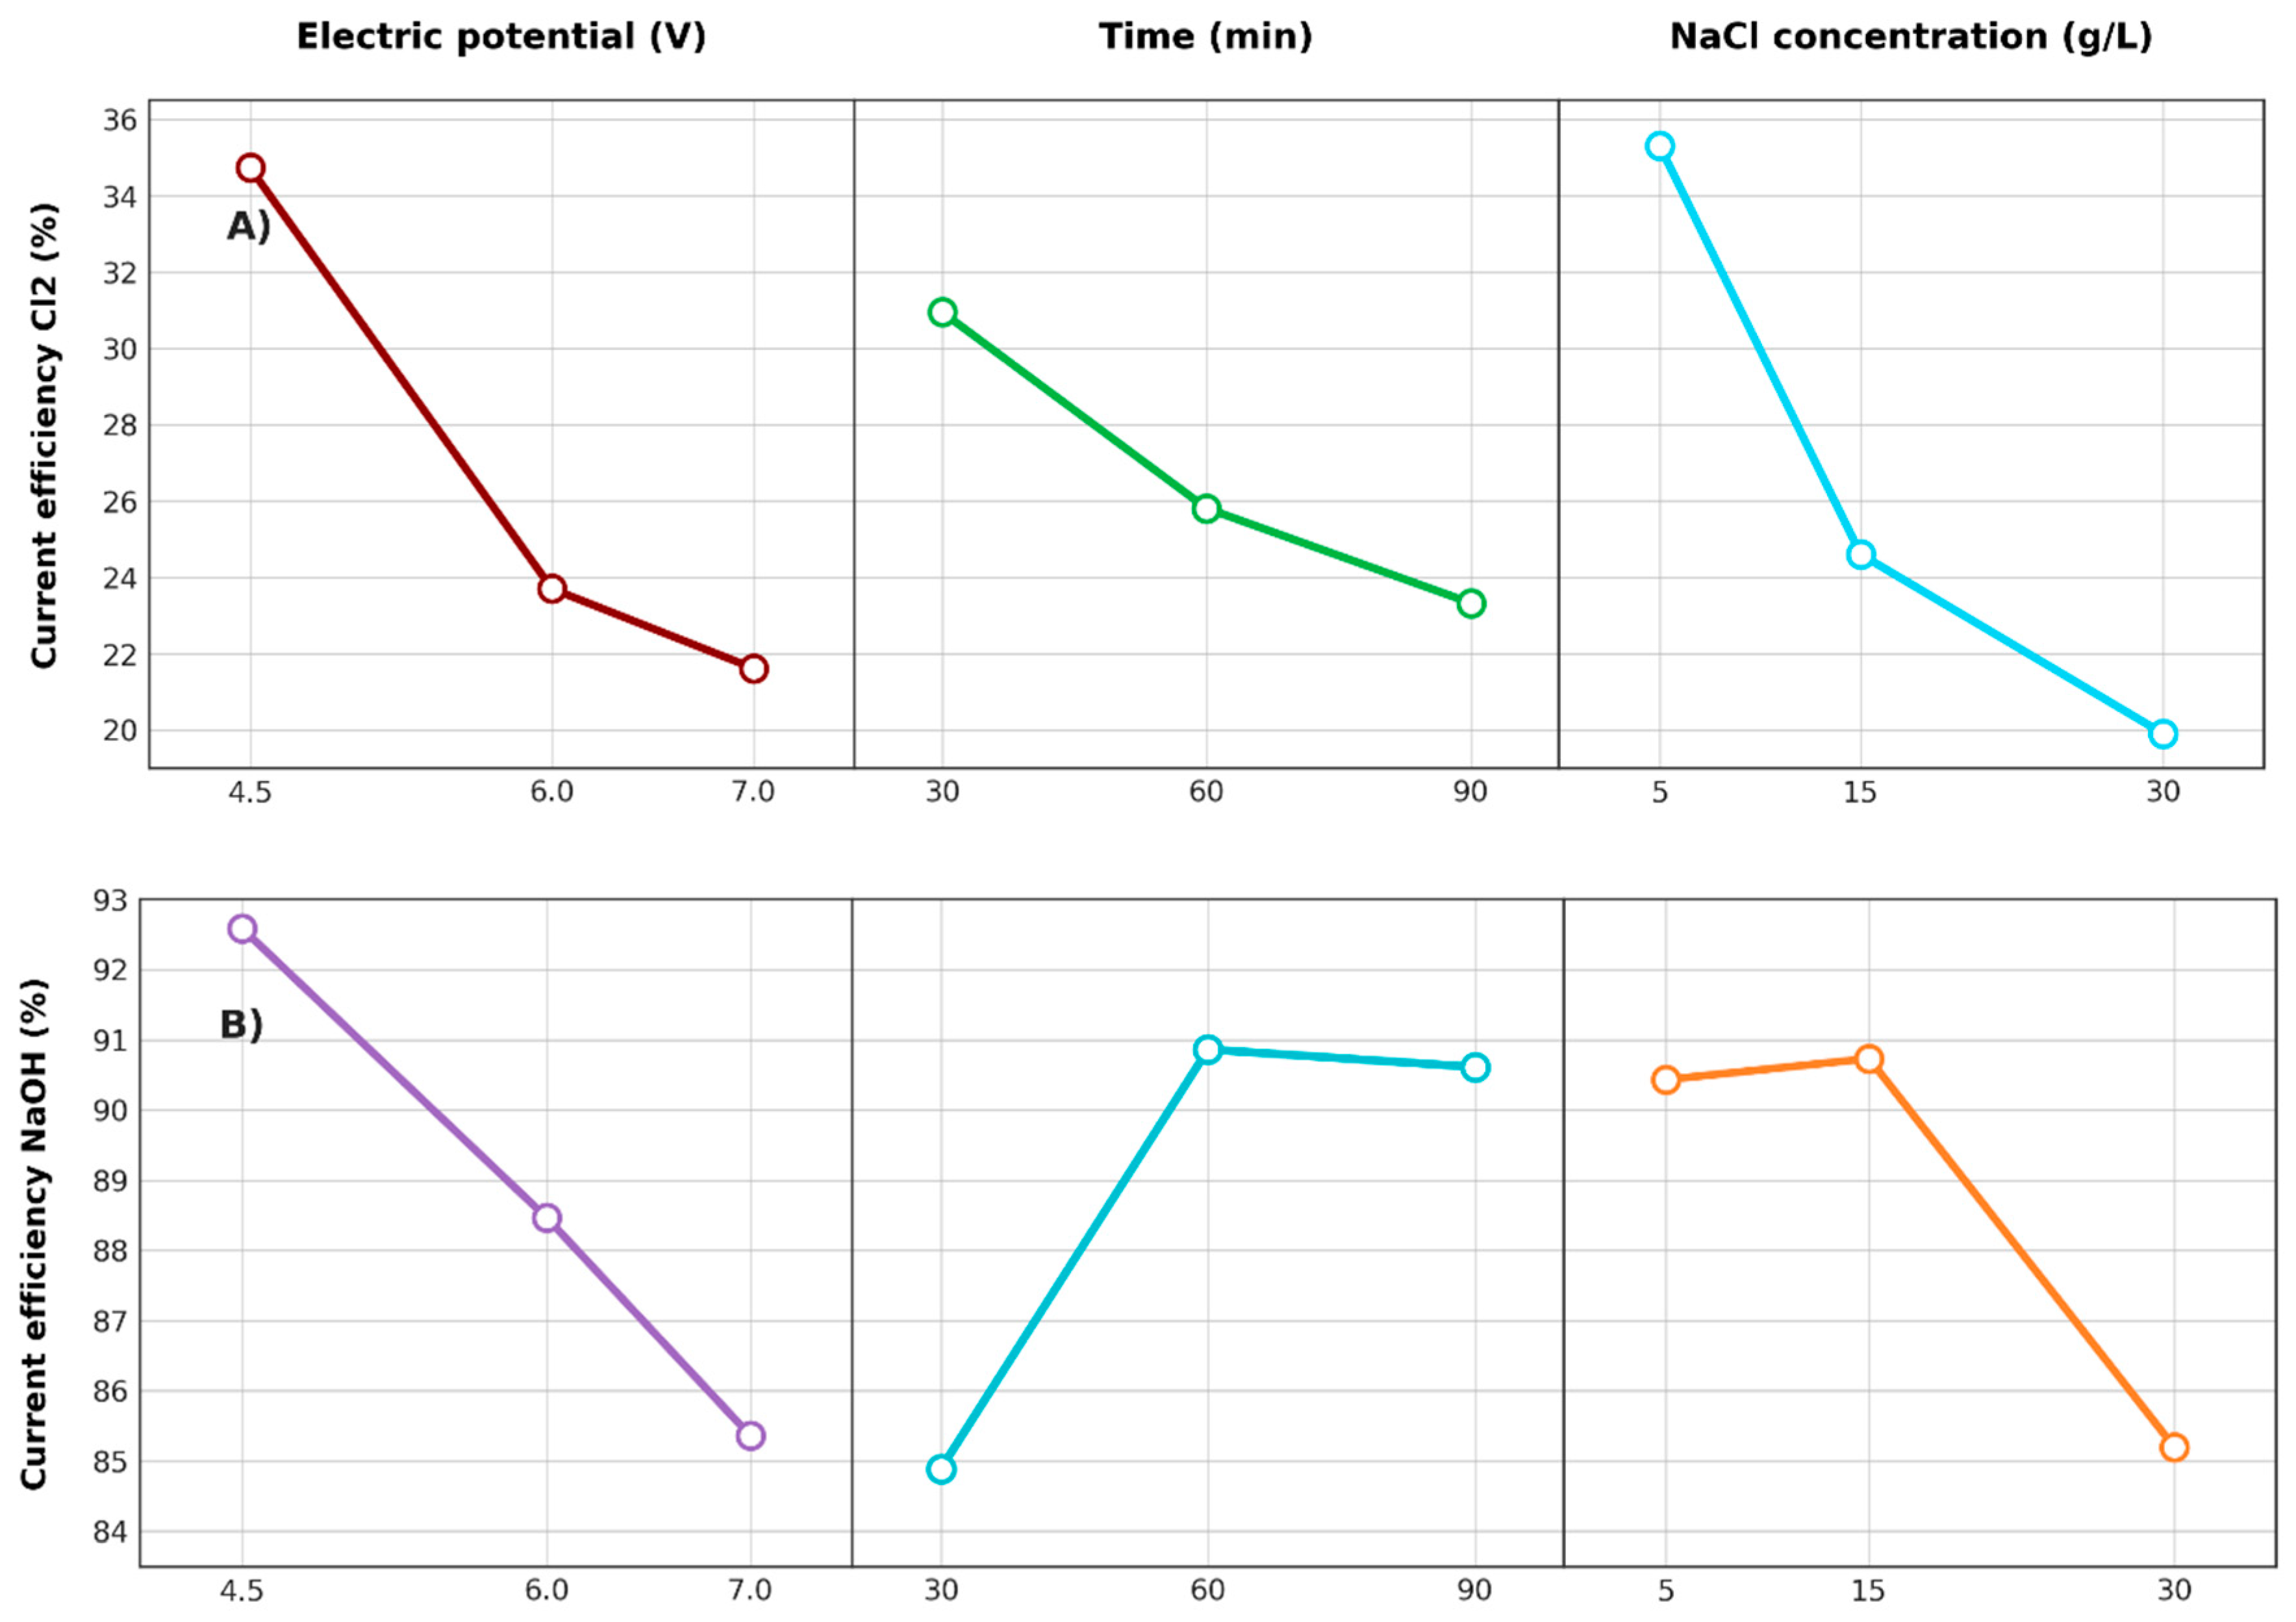
3.2.4. Efficiency of Electric Current

Several studies have suggested that the main driving force in the efficiency of the electrolysis process is the electrical potential [34]. Figure 8B shows the efficiency of the electric current in the formation of sodium hydroxide, which was in the range of 84.9 to 92.5% for the factors and levels studied. Similarly, it was found that the electric potential was the most influential factor in the efficiency of the electric current, reaching the highest level of efficiency at a potential of 4.5 volts. On the other hand, it can be observed that the highest current efficiency was achieved at a duration and salt concentration of 60 min and 15 g/L NaCl, respectively. In addition, the average efficiency of the electric current corresponded to 26.8% of the concentration of active chlorine solubilized in the solution. These comparatively low values are in line with those documented in [57].

3.2.5. ANOVA Results

The purpose of an analysis of variance (ANOVA) is to examine which process variables have a significant impact on the output parameters. This evaluation focused on the analysis of variance of the independent variables X1 (electrical potential), X2 (electrolysis time) and X3 (NaCl concentration) regarding the concentrations of active chlorine and NaOH, the pH of the solutions and the energy consumption and electrical efficiency. The ANOVA results are shown in Table 5. The statistical analysis revealed that certain factors were highly significant (p < 0.05)—specifically, X1, X2 and X3 for energy consumption and electrical efficiency—in the production of sodium hydroxide. The electrical potential variable (X1) showed the lowest p-values, which confirms its high degree of statistical significance and its great influence on the system performance. These results are corroborated by the mean plots, which represent the main effect of the electric potential compared to other process parameters. According to the ANOVA analysis (Table 7), with a confidence level of 95%, all parameters of the experimental design were statistically significant. The most significant factor was the voltage (X1), which contributed 39.55% to the overall response.

3.2.6. Effects of Factors on Responses

Considering that the voltage facilitates the movement of electrons (electric current) within a circuit, it is evident that the voltage is an important variable that warrants thorough investigation. The higher the applied voltage, the higher the ion migration pulse, the faster the migration rate and the higher the desalination efficiency. As the voltage increased from 4.5 to 7 V, the concentrations of chlorine and sodium hydroxide showed a corresponding increase, illustrating a direct relationship between the magnitude of the applied voltage and the efficiency of the process. The chlorine and sodium hydroxide concentrations increased constantly with increasing voltages, with the increase being the most pronounced between 4.5 and 6 volts for chlorine formation.
However, for the production of sodium hydroxide, the increase was constant within the range of 4.5 to 7 volts, reaching the average NaOH concentration of 1450 mg/L at 7 volts.
Previous studies have indicated an increase in acidic conditions (lower pH) as the electrical voltage increases [34]. Previous studies have also reported that the active chlorine concentration levels increase steadily with increasing voltages, except at 3.6 V, where a slight drop can be observed, followed by an increase again at 3.8 V [58]. The higher the electrical potential, the faster the maximum chlorine level will be reached, but the lower the electrical efficiency [34]. As the NaCl concentration increases, the conductivity of the solution increases, leading to a decrease in electrical resistance and energy consumption [59].
This is because the higher ionic strength of NaCl produces an increase in the current density at the same cell voltage. Other studies have shown that the current intensity and NaCl level have a direct influence on the level of available chlorine [60]. The findings indicate that a reduction in the NaCl concentration corresponds to a small rise in pH, which is consistently maintained within the range of 2 to 3. However, the growth rate of the available chlorine concentration (ACC) starts to decrease with increasing concentrations of chloride ions (Cl), as the escaping chlorine gas contributes to ACC losses [34]. Previous studies have mentioned that the optimum electrolysis time varies depending on the chloride concentration in the electrolyte and the cell voltage used during the formation of the electrolyzed water [61].

4. Conclusions

In the present study, the operability of a three-compartment cell with two separate ion exchange membranes, oriented toward the production of chlorine-based compounds (anodic behavior) and alkaline electrolyzed water (cathodic behavior), was built and evaluated. In the electrolytic cell, a Ti-RuO2-IrO2 anode and a titanium cathode were used as electrode materials. The effects of the operating parameters on the final concentrations of active chlorine and sodium hydroxide were investigated, such as the electrical potential at the levels of 4, 6 and 7, the initial concentration of sodium chloride (5, 15 and 30) and the electrolysis time (30, 60 and 90 min). It has been demonstrated that concentrations of active chlorine close to 480 ppm and sodium hydroxide at 2600 ppm can be obtained at the most favorable conditions, namely an electrical potential of 7 volts, an electrolysis time of 90 min and an initial concentration of sodium chloride of 30 g/L. The pH in the anodic and cathodic zones changes as a function of the duration of the electrolysis process, being more noticeable in the first 10 min. The factor that most significantly influences the pH change is the electrical voltage used in the cell. According to the ANOVA, with a 95% confidence level, all parameters of the experimental design (electric potential, electrolysis time and NaCl concentration) were statistically significant. The electrical potential (X1) stood out as the most relevant factor, contributing 39.55% to the process’ performance. This work offers an excellent option to produce acidic electrolyzed water (Cl2 and HClO); moreover, in the cathodic compartment, sodium hydroxide is obtained without hypochlorite contamination.

Author Contributions

Conceptualization, J.T.M.C. and C.A.D.; methodology, P.D.B., L.C.V., J.T.M.C., J.P.L. and O.R.T.; validation, C.A.D., J.T.M.C. and E.W.V.M.; formal analysis, J.T.M.C. and L.C.V.; investigation, J.T.M.C., L.C.V. and K.A.G.; data curation, J.T.M.C. and L.C.V.; writing—original draft preparation, P.D.B.; writing—review and editing, J.T.M.C. and E.W.V.M.; supervision, C.A.D., O.R.T. and L.C.V.; funding acquisition, J.T.M.C., J.L.H. and J.M.P. All authors have read and agreed to the published version of the manuscript.

Funding

This research was funded by National University of Callao in Lima Peru.

Institutional Review Board Statement

Not applicable.

Informed Consent Statement

Not applicable.

Data Availability Statement

The original contributions of this study are included in the article. For further information, please contact the corresponding author.

Acknowledgments

The authors would like to thank the Universidad Nacional del Callao de Lima (Peru), especially the Vice-Rector of Research of the UNAC, for funding the publication of this article. The authors are grateful for the use of AI-assisted technologies, including SCISPACE, which facilitated the paraphrasing process.

Conflicts of Interest

The authors declare that they have no conflicts of interest.

Nomenclature

AEWacidic electrolyzed water
SAEWstrongly acidic electrolyzed water
AcEWstrongly acidic electrolyzed water
BEWbasic electrolyzed water
ACCavailable chlorine concentration
DOFdegrees of freedom

References

  1. Yaqub, M.; Woo, C.; Lee, W. Optimization of hypochlorous acid generation by HCl electrolysis through response surface methodology and artificial neural networks. J. Environ. Chem. Eng. 2021, 9, 105826. [Google Scholar] [CrossRef]
  2. Li, X.; Yang, D.; Li, S.; Li, Z.; Yan, W.; Xu, H.; Yu, K. Revolutionizing Strongly Acidic Electrolyzed Water Production: A Breakthrough in Membrane-Free Pump-Suction Electrochemical System. Sep. Purif. Technol. 2025, 361, 131449. [Google Scholar] [CrossRef]
  3. Luo, C.-H.; Huang, H.-C.; Chuang, C.-Y.; Yang, S.; Hung, P.-C.; Chang, M.-Y.; Fang, W. Inactivation efficiency to Bacillus subtilis and Escherichia coli bacterial aerosols of spraying neutral electrolyzed water. J. Air Waste Manag. Assoc. 2013, 63, 1447–1456. [Google Scholar] [CrossRef]
  4. Lin, M.; Li, M.; Fang, L.; Tang, J.; Hung, Y.-C.; Jiang, X.; Sun, J.; Chen, Y.; Lin, Q.; Lin, H. Recent trends and applications of electrolyzed oxidizing water in fresh foodstuff preservation and safety control. Food Chem. 2022, 369, 130873. [Google Scholar] [CrossRef]
  5. Ren, S.; Zhang, Q.; Yuan, M.; Cui, C.; Qiu, S.; Deng, F. Ehanced electrolytic production of hypochlorous acid using phosphorus-modified carbon felt electrodes: A study in disinfectant synthesis. Chemosphere 2024, 365, 143367. [Google Scholar] [CrossRef] [PubMed]
  6. Mahmoud, S.; Rao, B.; Smesrud, L.; Omole, D.O.; Mehare, M.; Hernandez, D.; N., C.; Gadgil, A.; Matange, V.; Álvarez-Mejía, C.; et al. Low-cost, local production of a safe and effective disinfectant for resource-constrained communities. PLoS Glob. Public Health 2024, 4, e0002213. [Google Scholar] [CrossRef]
  7. Rahman, S.M.E.; Ding, T.; Oh, D.H. Effectiveness of low concentration electrolyzed water to inactivate foodborne pathogens under different environmental conditions. Int. J. Food Microbiol. 2010, 139, 147–153. [Google Scholar] [CrossRef] [PubMed]
  8. Zhao, L.; Li, S.; Yang, H. Recent advances on research of electrolyzed water and its applications. Curr. Opin. Food Sci. 2021, 41, 180–188. [Google Scholar] [CrossRef]
  9. Mąkinia, J.; Majtacz, J.; Al-Hazmi, H.E.; Hassan, G.K.; Drewnowski, J.; El-Gawad, H.A.; Kamal, R.M.; Mohamed, R.M.; Afify, A.A. Electrochemical Production of Sodium Hypochlorite from Salty Wastewater Using a Flow-by Porous Graphite Electrode. Energies 2023, 16, 4754. [Google Scholar] [CrossRef]
  10. Zaviska, F.; Drogui, P.; Pablo, G. Statistical optimization of active chlorine production from a synthetic saline effluent by electrolysis. Desalination 2012, 296, 16–23. [Google Scholar] [CrossRef]
  11. Nyamende, N.E.; Belay, Z.A.; Caleb, O.J. Recent advances in electrolyzed water treatments: Mechanisms of action and its effect on browning, bioactive compounds, and disinfection of fresh-cut fruit and vegetables–A review. Food Chem. Adv. 2023, 3, 100569. [Google Scholar] [CrossRef]
  12. Yan, P.; Daliri, E.B.M.; Oh, D.H. New clinical applications of electrolyzed water: A review. Microorganisms 2021, 9, 136. [Google Scholar] [CrossRef]
  13. Mohammadi, S.; Ebadi, T. Production of a water disinfectant by membrane electrolysis of brine solution and evaluation of its quality change during the storage time. Arab. J. Chem. 2021, 14, 102925. [Google Scholar] [CrossRef]
  14. Hao, J.; Wu, T.; Li, H.; Liu, H. Dfferences of Bactericidal Efficacy on Escherichia coli, Staphylococcus aureus, and Bacillus subtilis of Slightly and Strongly Acidic Electrolyzed Water. Food Bioprocess Technol. 2017, 10, 155–164. [Google Scholar] [CrossRef]
  15. Ampiaw, R.E.; Yaqub, M.; Lee, W. Eectrolyzed water as a disinfectant: A systematic review of factors affecting the production and efficiency of hypochlorous acid. J. Water Process. Eng. 2021, 43, 102228. [Google Scholar] [CrossRef]
  16. Athayde, D.R.; Flores, D.R.M.; Silva, J.S.; Silva, M.S.; Genro, A.L.G.; Wagner, R.; Campagnol, P.; Menezes, C.; Cichoski, A.J. Caracteristics and use of electrolyzed water in food industries. Int. Food Res. J. 2018, 25, 11–16. [Google Scholar]
  17. Dammak, L.; Ammar, R.B.; Ounissi, T.; Mofakhami, A.; Hmida, E.S.B.; Larchet, C.; Baklouti, L. A New Method Based on a Zero Gap Electrolysis Cell for Producing Bleach: Concept Validation. Membranes 2022, 12, 602. [Google Scholar] [CrossRef] [PubMed]
  18. Grabner, B.; Grimmer, I.; Höglinger, M.; Trattner, A.; Kartusch, S.; Ranz, M.; Rauh, J.; Macherhammer, M.-G.; Wallnöfer-Ogris, E. A review on understanding and identifying degradation mechanisms in PEM water electrolysis cells: Insights for stack application, development, and research. Int. J. Hydrogen Energy 2024, 65, 381–397. [Google Scholar] [CrossRef]
  19. Di Noto, V.; Jaouen, F.; Mustarelli, P.; Dekel, D.R.; Elbaz, L.; Santoro, C.; Lavacchi, A. What is Next in Anion-Exchange Membrane Water Electrolyzers? Bottlenecks, Benefits, and Future. ChemSusChem 2022, 15, e202200027. [Google Scholar] [CrossRef]
  20. Ren, Z.; Quan, S.; Gao, J.; Li, W.; Zhu, Y.; Liu, Y.; Chai, B.; Wang, Y. The electrocatalytic activity of IrO2-Ta2O5 anode materials and Electrolyzed Oxidizing Water preparation and sterilization effect. RSC Adv. 2015, 5, 8778–8786. [Google Scholar] [CrossRef]
  21. Waters, B.; Amazonas, M.; Hung, Y.-C. Eectrolyzed Oxidizing Water Generation Methods. J. Funct. Water 2012, 7, 1–13. [Google Scholar]
  22. García-López, I.; Maté, V.I.Á.; Aroca, S.C.; Garrido-Escudero, A. Wter disinfection via nature-inspired electrochemical flow cells in resource-limited settings. Next Sustain. 2025, 5, 100072. [Google Scholar] [CrossRef]
  23. Gomaa, F.A.; Nada, A.A.; Gomaa, H.E.M.; El-Maghrabi, H.H. Avancing green hydrogen: Innovations and challenges in seawater electrolysis for sustainable energy production. J. Environ. Chem. Eng. 2025, 13, 115644. [Google Scholar] [CrossRef]
  24. Zhang, C.; Xia, X.; Li, B.; Hung, Y.C. Dsinfection efficacy of electrolyzed oxidizing water on brown rice soaking and germination. Food Control 2018, 89, 38–45. [Google Scholar] [CrossRef]
  25. Walsh, R.; Brennan, J.; Shergill, G.; Rosen, J.; Varley, R.; Hau, H.; Petran, R.; Gombas, D.; Zomorodi, B.; Khurana, K.; et al. Guidelines to validate control of cross-contamination during washing of fresh-cut leafy vegetables. J. Food Prot. 2017, 80, 312–330. [Google Scholar] [CrossRef]
  26. Chai, B.; Chen, J.; Deng, L.; He, S.; Zhao, G.; Zhu, Y.; Liu, Y.; Ren, Z. Preparation of electrolyzed oxidizing water by TiO2 doped IrO2-Ta2O5 electrode with high selectivity and stability for chlorine evolution. J. Electroanal. Chem. 2019, 832, 459–466. [Google Scholar] [CrossRef]
  27. Karlsson, R.K.B.; Cornell, A. Slectivity between Oxygen and Chlorine Evolution in the Chlor-Alkali and Chlorate Processes. Chem. Rev. 2016, 116, 2982–3028. [Google Scholar] [CrossRef]
  28. Ocasio, D.; Sedlak, D.L. Mmbrane-Assisted Electrochlorination for Zero-Chemical-Input Point-of-Use Drinking Water Disinfection. ACS ES&T Eng. 2022, 2, 1933–1941. [Google Scholar] [CrossRef] [PubMed]
  29. Kim, S.K.; Shin, D.M.; Rhim, J.W. Dsigning a high-efficiency hypochlorite ion generation system by combining cation exchange membrane aided electrolysis with chlorine gas recovery stream. J. Membr. Sci. 2021, 630, 119318. [Google Scholar] [CrossRef]
  30. Czarnetzki, L.R.; Janssen, L.J.J. Frmation of hypochlorite, chlorate and oxygen during NaCl electrolysis from alkaline solutions at an RuO2/TiO2 anode. J. Appl. Electrochem. 1992, 22, 315–324. [Google Scholar] [CrossRef]
  31. Jasper, J.T.; Yang, Y.; Hoffmann, M.R. Txic Byproduct Formation during Electrochemical Treatment of Latrine Wastewater. Environ. Sci. Technol. 2017, 51, 7111–7119. [Google Scholar] [CrossRef] [PubMed]
  32. Murrieta, M.F.; Nava, J.L. Electrosynthesis of hypochlorous acid in a filter-press electrolyzer and its modeling in dilute chloride solutions. J. Electroanal. Chem. 2021, 892, 115286. [Google Scholar] [CrossRef]
  33. Rodriguez, M.H.; Schmidt, U.; Büttner, C.; Bandte, M. Eectrolytic Disinfection of Irrigation Water for Intensive Crop Production in Greenhouses as Demonstrated on Tomatoes (Solanum lycopersicum Mill.). Horticulturae 2022, 8, 414. [Google Scholar] [CrossRef]
  34. Contreras, R.R.; Almarza, J.; Rincón, L.; Ruiz, C. Green sodium hydroxide for industrial purposes. A short review. J. Environ. Chem. Eng. 2025, 13, 114972. [Google Scholar] [CrossRef]
  35. Riaz, M.A.; Trogadas, P.; Aymé-Perrot, D.; Sachs, C.; Dubouis, N.; Girault, H.; Coppens, M.O. Water electrolysis technologies: The importance of new cell designs and fundamental modelling to guide industrial-scale development. R. Soc. Chem. 2025, 18, 5190–5214. [Google Scholar] [CrossRef]
  36. O’Brien, T.F. Slt, Chlor-Alkali, and Related Heavy Chemicals. In Handbook of Industrial Chemistry and Biotechnology; Springer International Publishing: Berlin/Heidelberg, Germany, 2017; pp. 1267–1300. [Google Scholar] [CrossRef]
  37. Hu, M.; Yu, T.; Tan, K.; Zhou, A.; Luo, L.; Yin, S. Utralow Ru loading RuO2-TiO2 with strong oxide-support interaction for efficient chlorine evolution and ammonia-nitrogen-elimination. Chem. Eng. J. 2023, 465, 143001. [Google Scholar] [CrossRef]
  38. Saxena, J.; Williams, T. Eectrolysed water (hypochlorous acid) generation and efficacy against food-borne pathogens. Sustain. Food Technol. 2023, 1, 603–609. [Google Scholar] [CrossRef]
  39. León, T.; Abdullah Shah, S.; López, J.; Culcasi, A.; Jofre, L.; Cipollina, A.; Cortina, J.L.; Tamburini, A.; Micale, G. Electrodialysis with Bipolar Membranes for the Generation of NaOH and HCl Solutions from Brines: An Inter-Laboratory Evaluation of Thin and Ultrathin Non-Woven Cloth-Based Ion-Exchange Membranes. Membranes 2022, 12, 1204. [Google Scholar] [CrossRef]
  40. Khalid, N.I.; Sulaiman, S.; Ab Aziz, N.; Taip, F.S.; Sobri, S.; Nor-Khaizura, M.A.R. Electrolyzed water as a green cleaner: Chemical and physical characterization at different electrolysing parameters. Food Res. 2018, 2, 512–519. [Google Scholar] [CrossRef]
  41. Zayas, T.; Vega, M.; Soriano-Moro, G.; Handal, A.; Morales, M.; Salgado, L. Eectrogeneration of Hypochlorite Ions using a Dimensionally Stable Anode-Type (Ti/PtPd(10%)Ox) Electrode. J. Electrochem. Sci. Technol. 2024, 15, 268–275. [Google Scholar] [CrossRef]
  42. Khalid, N.I.; Sulaiman, N.S.; Aziz, N.A.; Taip, F.S.; Sobri, S.; Rashid, N.K.M.A. Otimization of electrolysis parameters for green sanitation chemicals production using response surface methodology. Processes 2020, 8, 792. [Google Scholar] [CrossRef]
  43. Huang, J.; Pei, L.; Ye, Z.; Zhao, C.; Zhu, L.; Yang, X.; Chen, Y.; Gao, L. Acidic Electrolyzed Water Inhibits the Viability of Gardnerella spp. via Oxidative Stress Response. Front. Med. 2022, 9, 817957. [Google Scholar] [CrossRef]
  44. Nyamende, N.E.; Hoff, J.W.; van Brede, V.; Belay, Z.A.; Oyenihi, A.B.; Caleb, O.J. Iolation and characterization culturable microbes on the surface of ‘Granny Smith’ apples treated with electrolyzed water during cold storage. Food Sci. Biotechnol. 2022, 31, 1603–1614. [Google Scholar] [CrossRef] [PubMed]
  45. Li, Y.; Wu, G.; Zhao, X.; Xue, F.; Zhang, B.; Fu, B.; Shu, D.; Sun, L.; Zang, Y.; Hu, M.; et al. Antibacterial effect and mechanism of shorter ultraviolet light (222 nm) combined with slightly acidic electrolyzed water against Escherichia coli. LWT 2024, 193, 115761. [Google Scholar] [CrossRef]
  46. Ni, K.; Wang, X.; Zhang, P.; Bai, L.; Liu, Y.; Zhou, T.; Chang, G.; Luo, Z.; Zhang, C. Response surface methodology to optimize the sterilization process of slightly acidic electrolyzed water for Chinese shrimp (Fenneropenaeus chinensis) and to investigate its effect on shrimp quality. Food Chem. X 2024, 21, 101180. [Google Scholar] [CrossRef]
  47. Naka, A.; Nakamura, K.; Kurahashi, M. Sightly Acidic Electrolyzed Water to Remove Methylobacterium mesophilicum, Rhodotorula mucilaginosa and Cladosporium cladosporioides in Households. Appl. Microbiol. 2021, 1, 607–614. [Google Scholar] [CrossRef]
  48. Kang, M.; Park, B.; Ha, J.H. Knetic Modeling of Slightly Acidic Electrolyzed Water Decay Characteristics in Fresh Cabbage Disinfection Against Human Norovirus. Front. Microbiol. 2021, 12, 616297. [Google Scholar] [CrossRef]
  49. Satoh, K.; Nagayasu, T.; Nishida, N.; Sano, K.; Sakai, H.; Akamatsu, N.; Nakano, Y.; Fujita, Y.; Miyoshi, Y.; Nakayama, T.; et al. Sequential Washing with Electrolyzed Alkaline and Acidic Water Effectively Removes Pathogens from Metal Surfaces. PLoS ONE 2016, 11, e0156058. [Google Scholar] [CrossRef]
  50. Liu, Y.; Mei, J.; Xie, J. Efects of slightly acidic electrolyzed water and ginger (Zingiber officinale Roscoe) juice on the quality and myofibrillar protein structure of silver carp (Hypophthalmichthys molitrix) fillets during cold storage. LWT 2024, 204, 116451. [Google Scholar] [CrossRef]
  51. Oh, D.-H.; Liu, Y.; Zhong, H.; Liu, S.; Wang, Z.; Han, Z.; Sun, Q.; Liu, Y.; Khan, I.; Wei, S. Antibacterial mechanism of slightly acidic electrolyzed water against Pseudomonas arsenicoxydans A1 from greater amberjack (Seriola dumerili). LWT 2024, 194, 115814. [Google Scholar] [CrossRef]
  52. Lan, W.; Shao, Z.; Lang, A.; Xie, J. Efects of slightly acidic electrolyzed water combined with ԑ-polylysine-chitooligosaccharide Maillard reaction products treatment on the quality of vacuum packaged sea bass (Lateolabrax japonicas). Int. J. Biol. Macromol. 2024, 260, 129554. [Google Scholar] [CrossRef] [PubMed]
  53. Ding, T.; Ye, X.-Q.; Xuan, X.-T.; Liu, D.-H.; Li, J.; Zhao, Y.; Ahn, J.-H.; Chen, S.-G. Estimation of growth parameters of Listeria monocytogenes after sublethal heat and slightly acidic electrolyzed water (SAEW) treatment. Food Control 2017, 71, 17–25. [Google Scholar] [CrossRef]
  54. Kumar, A.; Du, F.; Lienhard, J.H. Custic Soda Production, Energy Efficiency, and Electrolyzers. ACS Energy Lett. 2021, 6, 3563–3566. [Google Scholar] [CrossRef]
  55. Atrashkevich, A.; Alum, A.; Stirling, R.; Abbaszadegan, M.; Garcia-Segura, S. Aproaching easy water disinfection for all: Can in situ electrochlorination outperform conventional chlorination under realistic conditions? Water Res. 2024, 250, 121014. [Google Scholar] [CrossRef]
  56. Sanzani, S.M.; Catalano, P.; Tanucci, G.; Giametta, F.; Bianchi, B. Dsign and Construction and Energy Consumption Study of a New Electrolyzed Water Cell Generator Prototype for Food Disinfection. Sci 2024, 6, 43. [Google Scholar] [CrossRef]
  57. Chai, B.; Zhang, A.; Shi, L.; Ming, R.; Wei, S.; Ren, Z.; Zhu, Y. Preparation of electrolyzed oxidizing water with a platinum electrode prepared by magnetron sputtering technique. RSC Adv. 2017, 7, 45377–45384. [Google Scholar] [CrossRef]
  58. Ampiaw, R.E.; Yaqub, M.; Woo, C.; Lee, W. Otimizing slightly acidic electrolyzed water (SAEW) production through experiments and gene expression programming. J. Water Process Eng. 2022, 47, 102736. [Google Scholar] [CrossRef]
  59. Thangappan, R.; Sampathkumaran, S.T. Eectrochlorination system: A unique method of prevention of biofouling in seawater desalination. Int. J. Nucl. Desalination 2008, 3, 135. [Google Scholar] [CrossRef]
  60. Maruyama, N.; Noda, M.; Goshima, H.; Okamoto, M.; Hirota, M. Eperimental Investigation on Hypochlorous Acid Water Production using Electrode Plates without a Barrier Membrane (Part I: Production conditions for high-concentration Hypochlorous acid water). IOSR J. Mech. Civ. Eng. (IOSR-JMCE) 2015, 12, 48–57. [Google Scholar] [CrossRef]
  61. Chai, B.; Wang, J.; Zhang, A.; Han, Y.; Deng, L.; Ming, R.; Ren, Z.; Zhu, Y. Effect of electrode material and electrolysis process on the preparation of electrolyzed oxidizing water. New J. Chem. 2018, 42, 12143–12151. [Google Scholar] [CrossRef]
Figure 1. Effects of pH on percentage of chlorine in water. Red, chlorine (Cl2); green, hypochlorous acid (HClO); light blue, hypochlorite (ClO) [25].
Sustainability 17 05465 g001
Figure 2. Schematic of the preparation of electrolyzed oxidizing water and sodium hydroxide.
Sustainability 17 05465 g002
Figure 3. (A) Cell photograph; (B) schematic diagram of experimental equipment.
Sustainability 17 05465 g003
Figure 4. Average concentrations of chlorine (A); concentrations of sodium hydroxide (B).
Sustainability 17 05465 g004aSustainability 17 05465 g004b
Figure 5. pH averages of anodic solution (A) and cathodic solution (B).
Sustainability 17 05465 g005
Figure 6. Evolution of pH in cathodic and anodic compartments during electrolysis at 7 V.
Sustainability 17 05465 g006
Figure 7. Energy consumption of Cl2 (A); energy consumption of NaOH (B).
Sustainability 17 05465 g007
Figure 8. Electrical current efficiency averages: (A) chlorine solution; (B) NaOH solution.
Sustainability 17 05465 g008
Table 1. Characteristics of the membranes used.
TypeThickness of Wet Membrane, MicronsExchange Capacity, meq/g Dry MembraneSurface Resistance Escriba Aquí la Ecuación Ω·cm2
MK-4052022
MA-41530 ± 201.6<11
Table 2. Taguchi experimental design variables.
FactorNotationUnitLevel
LowMediumHigh
Electric potentialX1V4.567
Electrolysis timeX2min306090
Sodium chloride concentrationX3g/L51530
Table 3. Response table.
RunX1X2X3Concentration (ppm)pH
of Solution
Energy Consumption (kWh/kg)Chloride Conversion (%)Electrical Efficiency (%)
AcidBaseAcidBaseAcidBase AcidBase
14.530538.98801.9810.786.843.332.3749.7590.44
24.56015116.94201.3911.7511.093.014.3130.6897.61
34.59030248.010600.7211.814.363.365.2123.789.71
463015131.15001.211.817.954.715.9825.2885.4
566030333.118000.7111.9424.964.629.3118.1887.04
66905205.57800.9111.6116.414.3324.1127.6492.94
773030209.010400.6312.0129.735.985.3417.8578.85
87605184.26401.1511.8418.525.3319.628.5887.93
979015481.926000.5111.7228.375.2625.3718.6589.17
Table 4. Standard deviation, mean and variance of responses received.
ResponseNMeanDev. Est.VarianceMinimumMaximum
Chlorine concentration (mg/L)9216.52129.89016,871.538.98481.9
NaOH concentration (mg/L)9991.111775.829601,911802600
Chloride ion conversion (%)911.28899.1133683.05342.3725.37
Current efficiency (NaOH)988.78785.1578326.603278.8597.61
Table 5. Companies generating electrolyzed water and corresponding concentrations of available chlorine (ACC) and pH.
CompanyACC (mg/L)pHR
1V9 (Zhongshan Lady Li Electrical Co., Ltd., Zhongshan, Guangdong, China)986.01[45]
2Harmony-II Electrolytic Water Generator (Rui Andre Environment Equipment Co., Ltd., Beijing, China)100 6.04[46]
3Apia 270 (Hokuetsu Co., Ltd., Kanagawa, Japan)406.02[47]
4SAEW Generator (Purester m-Clean; Morinaga Milk Industry Co., Ltd., Tokyo, Japan)26.655.46[48]
5Y-9201T (Yuasa Membrane Systems Co., Ltd., Tokyo, Japan)18.67 ± 22.71 and 11.91[49]
6SAEW Generator (FXSWS100, Fangxin Water Treatment Equipment Co., Ltd., Yantai, China)30.0 ± 1.546.35 ± 0.04[50]
7Anywhere-320W (Ryande Environmental Protection Equipment Beijing Co., Ltd., Beijing, China)60 ± 16.00 ± 0.15[51]
8SAEW Generator (Intercontinental Resources Environmental Science and Technology Co., Ltd., Beijing, China) 30.0 ± 1.18 6.36 ± 0.03[52]
9Beijing Intercontinental Resources and Environmental Protection Technology Co., Beijing, China200 ± 10 6.3 [53]
R: Reference.
Table 6. Specific energy consumption.
TechnologySpecific Energy ConsumptionReference
Membrane-based chlor-alkali process2.2–2.6 kWh/kg Cl2[54]
Electrochlorination with membrane0.054–0.11 kWh/m3[55]
Prototype membrane electrolyzed water cell generator0.11 kWh/L of electrolyzed water[56]
Table 7. ANOVA results.
Variable ResponseFactor DOF Sum of SquaresContribution (%)SS Adjust.MC Adjust.Fp
Chlorine concentration (mg/L)X1237,21127.569421837,21118,6051.770.361
X2251,70038.304240951,70025,8502.450.289
X3224,99818.520878424,99812,4991.190.457
Error 221,06315.605458921,06310,532
Total 8134,972
Concentration of NaOH (mg/L)X121,238,75625.72547571,238,756619,3781.090.478
X221,331,82227.65819461,331,822665,9111.170.460
X321,109,42223.03957251,109,422554,7110.980.506
Error 21,135,28923.57675731,135,289567,644
Total 84,815,289
pH of acidX120.5704233.19946920.570420.28521146.90.021
X220.4816228.03114960.481620.24081139.60.025
X320.6539638.06164730.653960.32697853.80.018
Error 20.012160.707733850.012160.00607
Total 81.71816
pH of baseX120.291827.77989340.29180.145911.400.416
X220.148414.12795130.14840.074180.710.583
X320.402538.31873570.40250.201241.940.340
Error 20.207819.78293980.20780.10388
Total 81.0504
Energy consumption
(kWh/kgCl2)
X12332.78469.6779543332.784166.39221.80.044
X224.6920.982405894.6922.3460.310.764
X32124.92226.1560334124.92262.4618.220.109
Error 215.2043.1833970915.2047.602
Total 8477.603
Energy consumption
(kWh/kg NaOH)
X127.9274094.40977527.927403.963701300.001
X220.252073.001976940.252070.1260341.50.024
X320.211272.516077550.211270.1056334.80.028
Error 20.006070.072289440.006070.00303
Total 88.39680
Current efficiency in formation of NaOHX1279.76337.478033779.76339.88111.70.078
X2268.23032.059052968.23034.11510.00.090
X3258.05127.276272658.05129.0258.560.105
Total 8212.826
Current efficiency in formation of Cl2X121.5220.611724041.5220.7610.130.886
X2215.0356.0428849915.0357.5181.280.439
X32220.48088.6155825220.480110.24018.70.051
Total 8248.805
Disclaimer/Publisher’s Note: The statements, opinions and data contained in all publications are solely those of the individual author(s) and contributor(s) and not of MDPI and/or the editor(s). MDPI and/or the editor(s) disclaim responsibility for any injury to people or property resulting from any ideas, methods, instructions or products referred to in the content.

