
Techno-Economic Analysis of Onsite Sustainable Hydrogen Production via Ammonia Decomposition with Heat Recovery System


Abstract

1. Introduction
1.1. Storage and Transport of Hydrogen
1.2. Hydrogen Carrier Fuel—Ammonia
1.3. Techno-Economic Analysis of Various Hydrogen Generation Methods
2. Materials and Methods
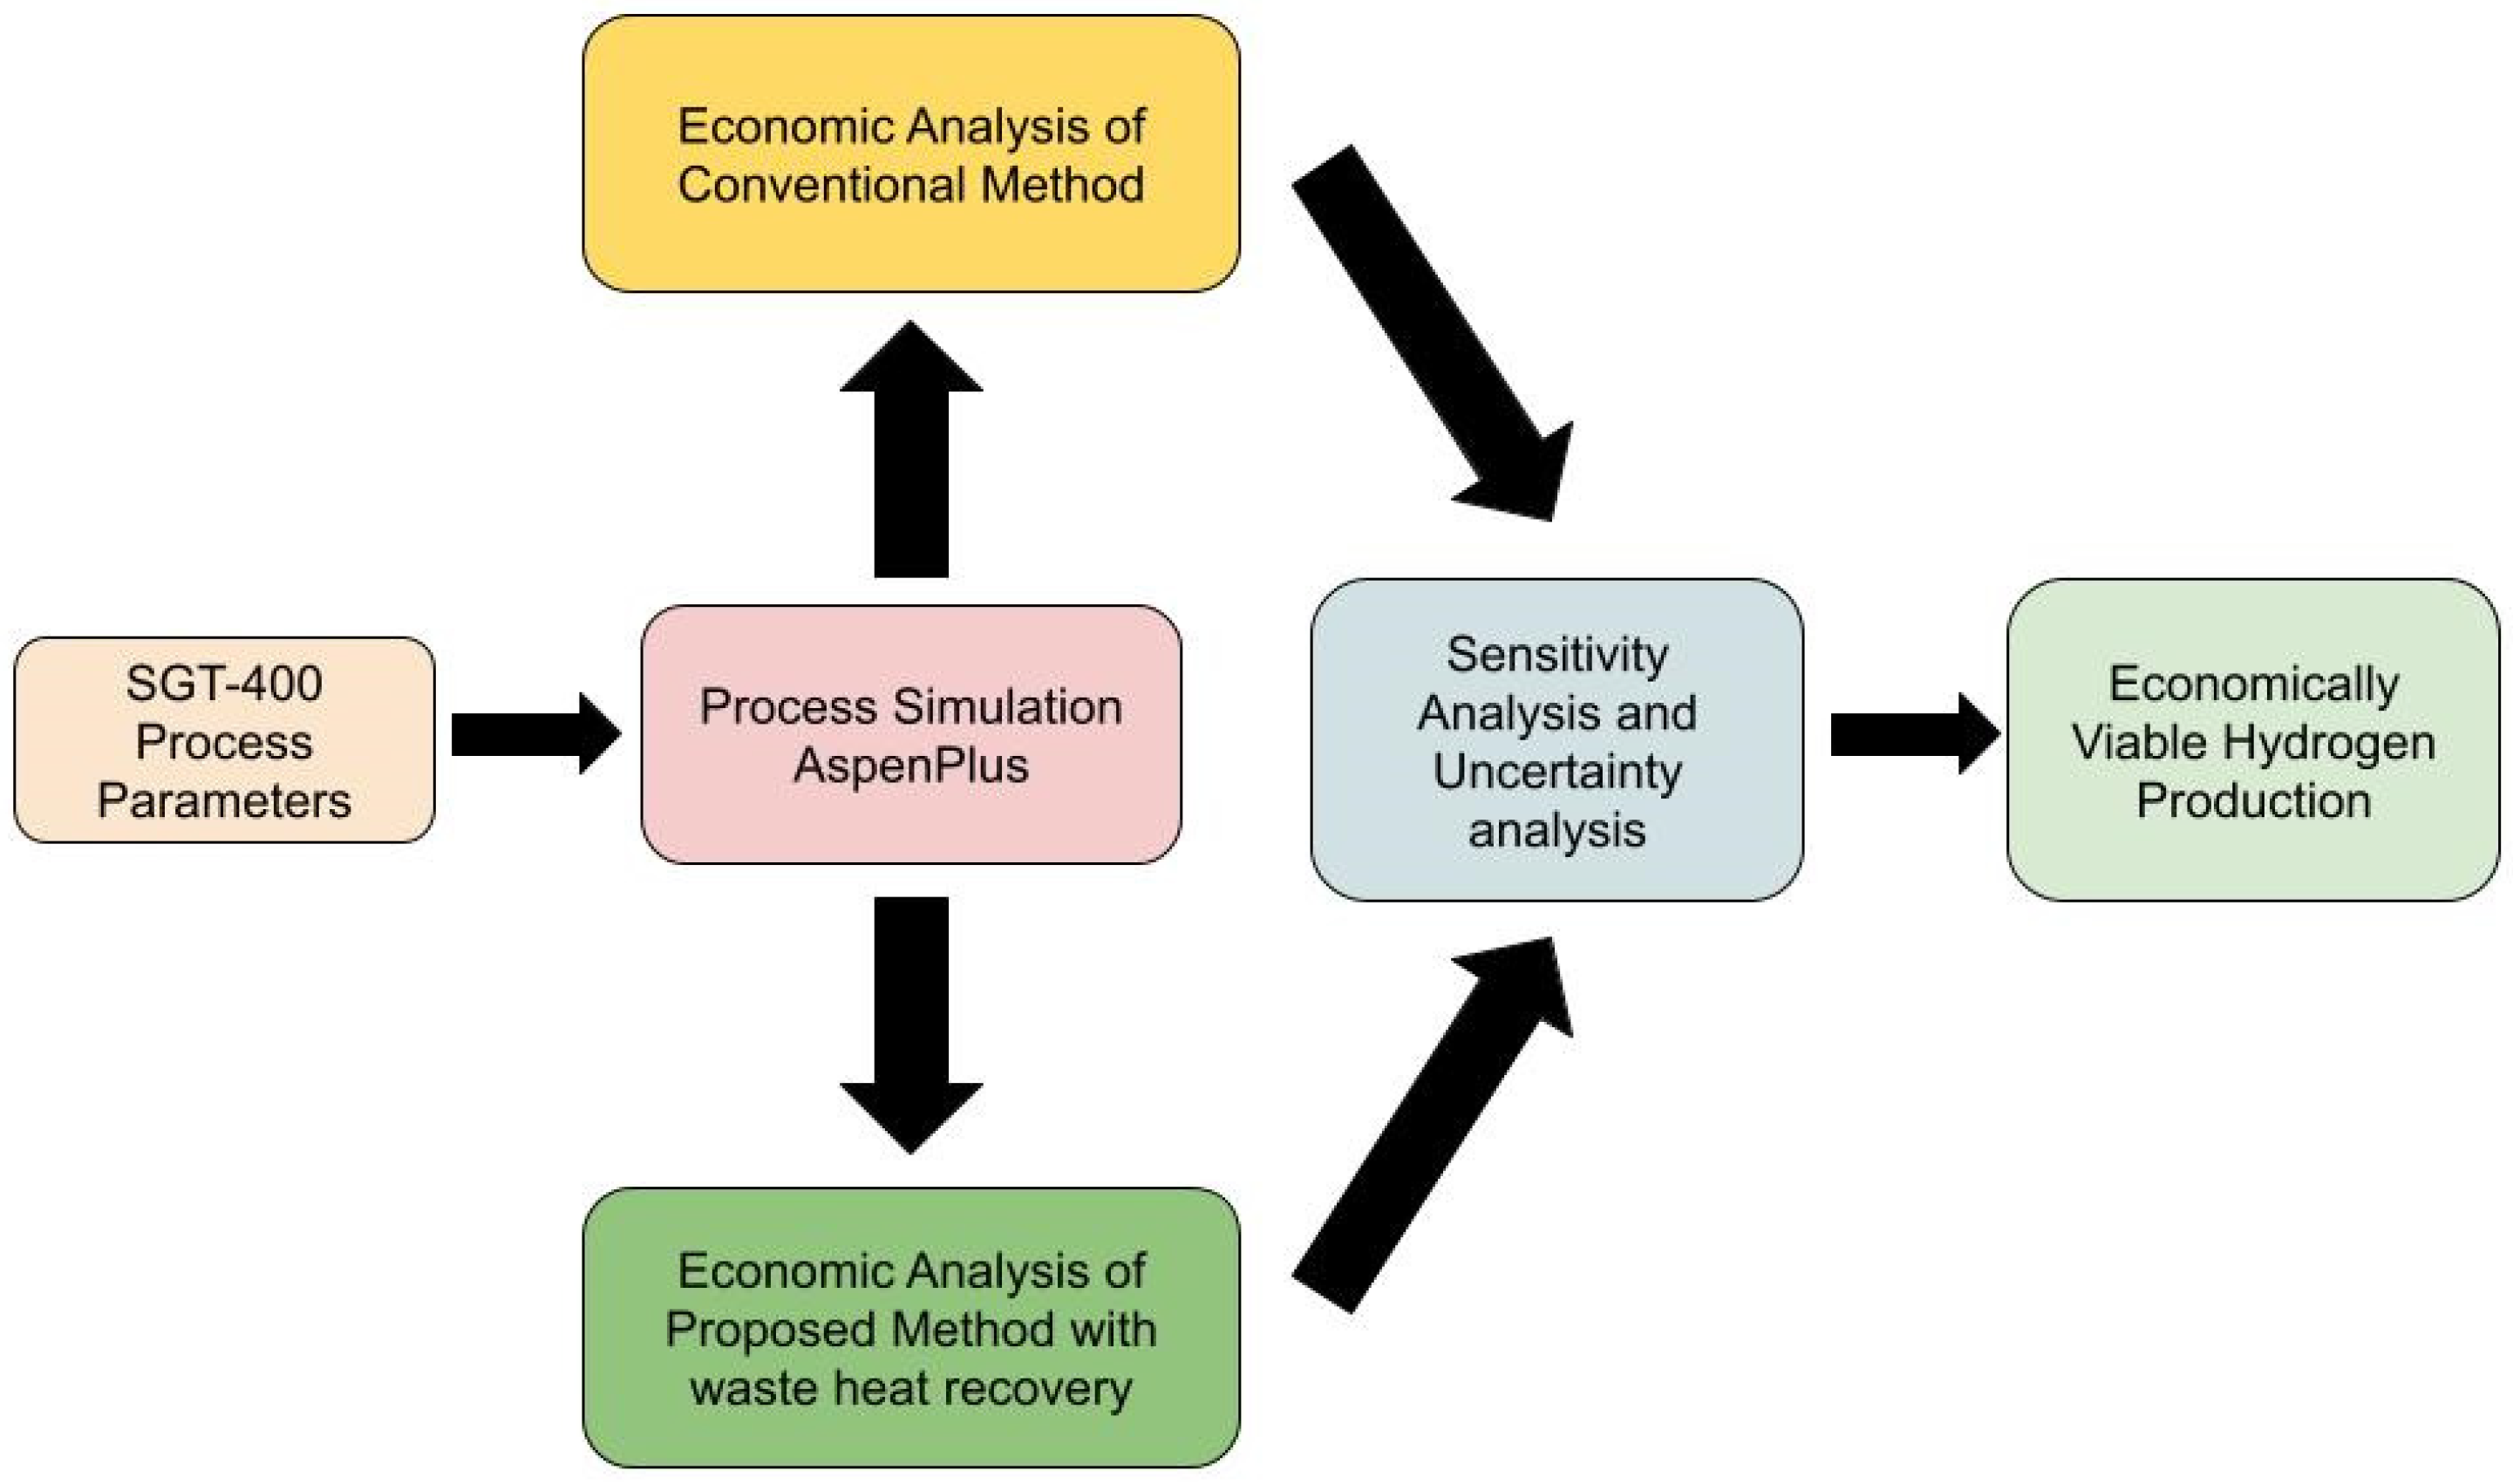
2.1. Techno-Economic Analysis
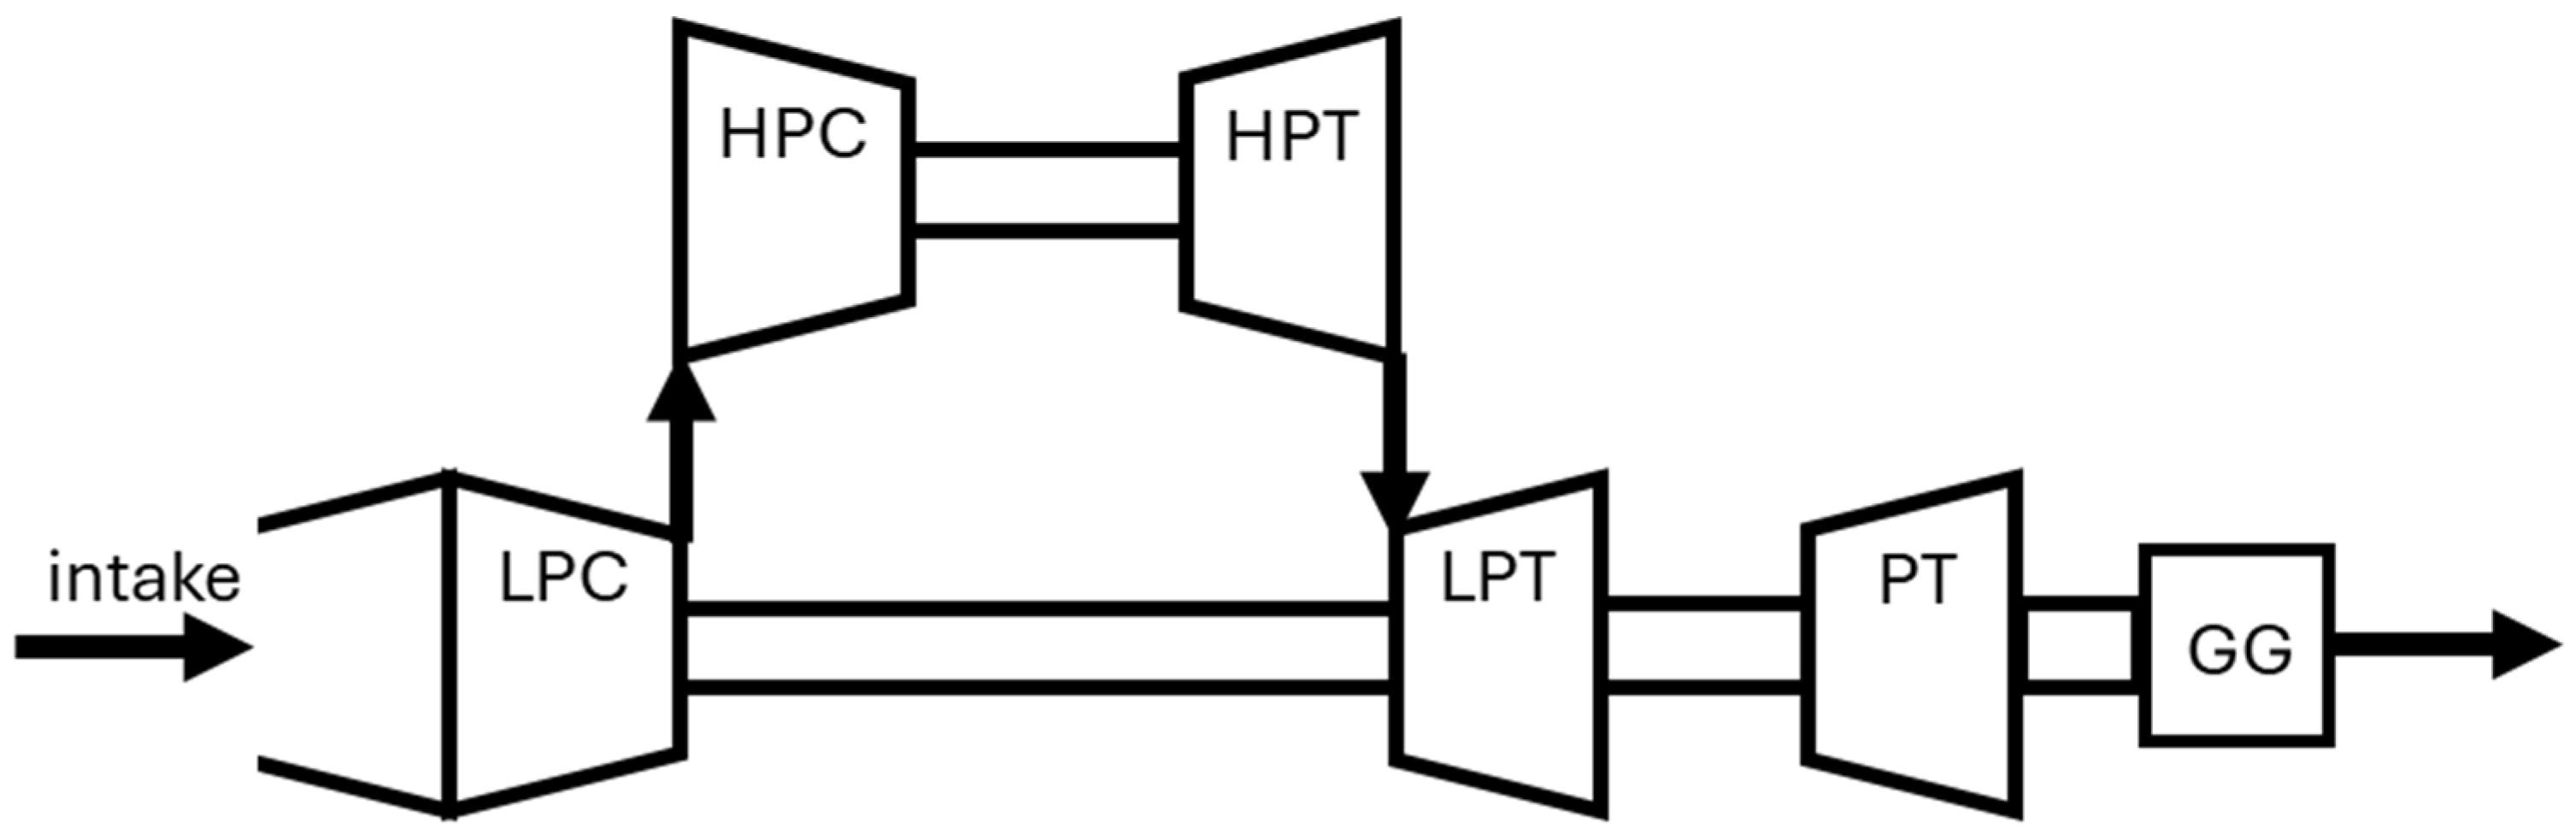
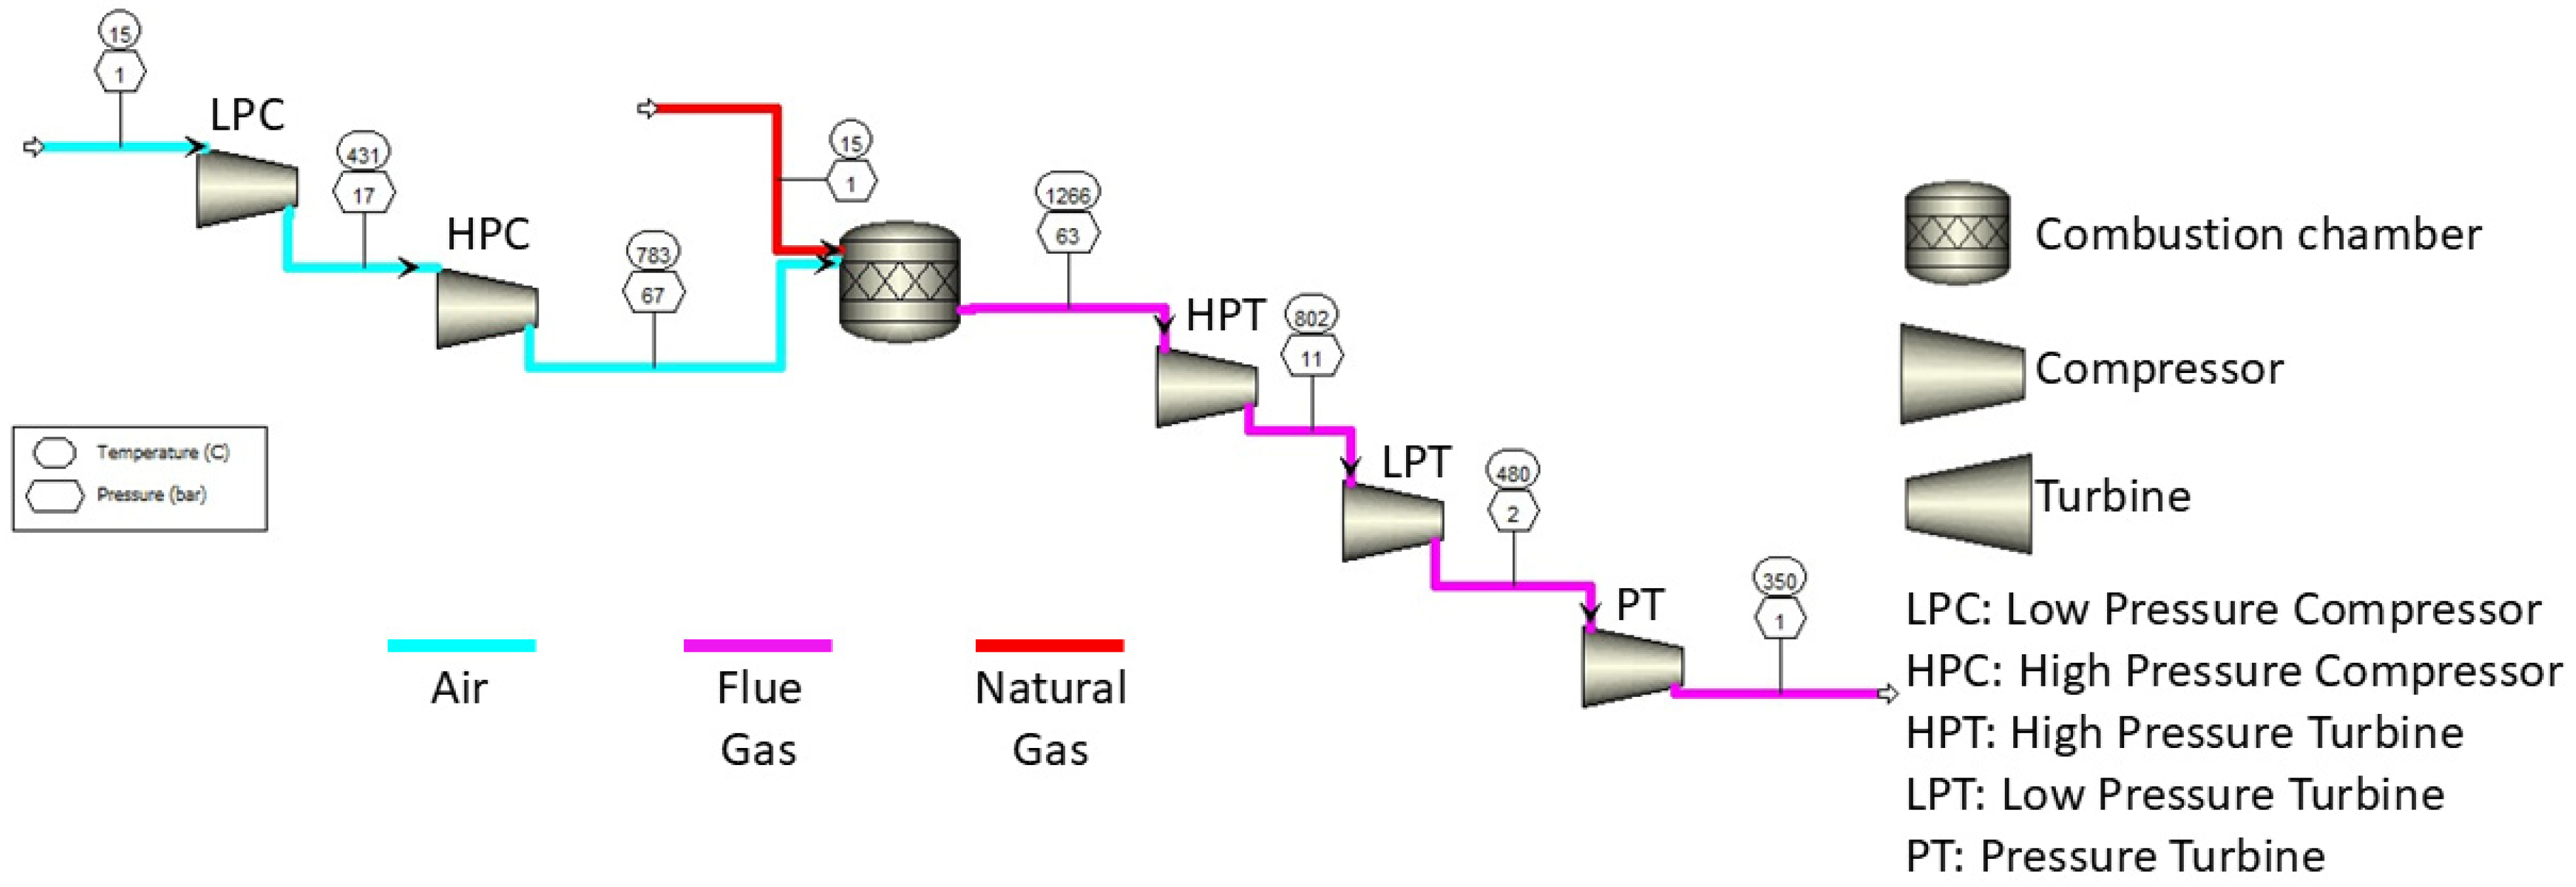
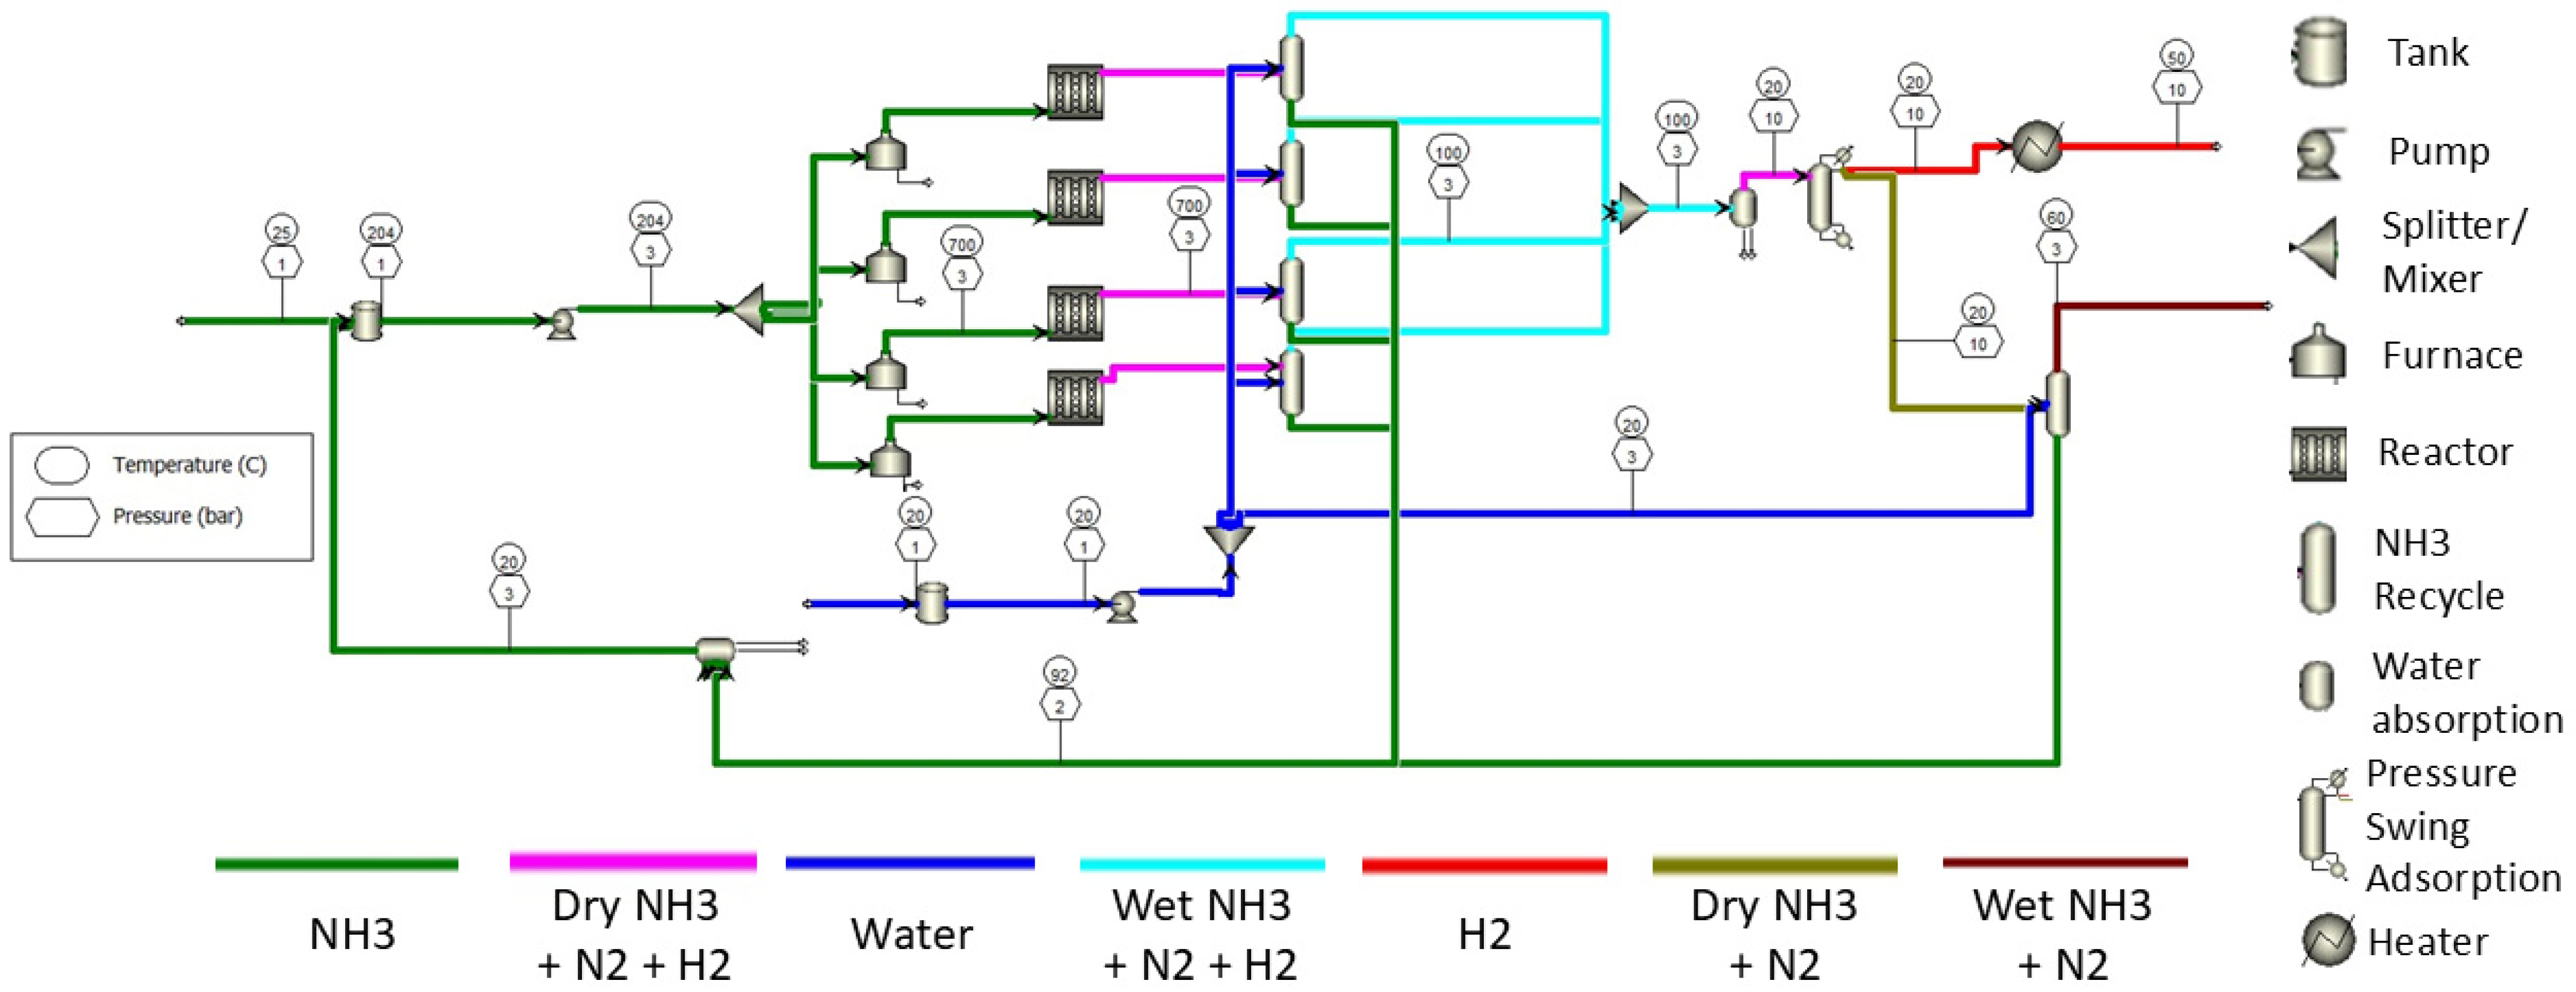
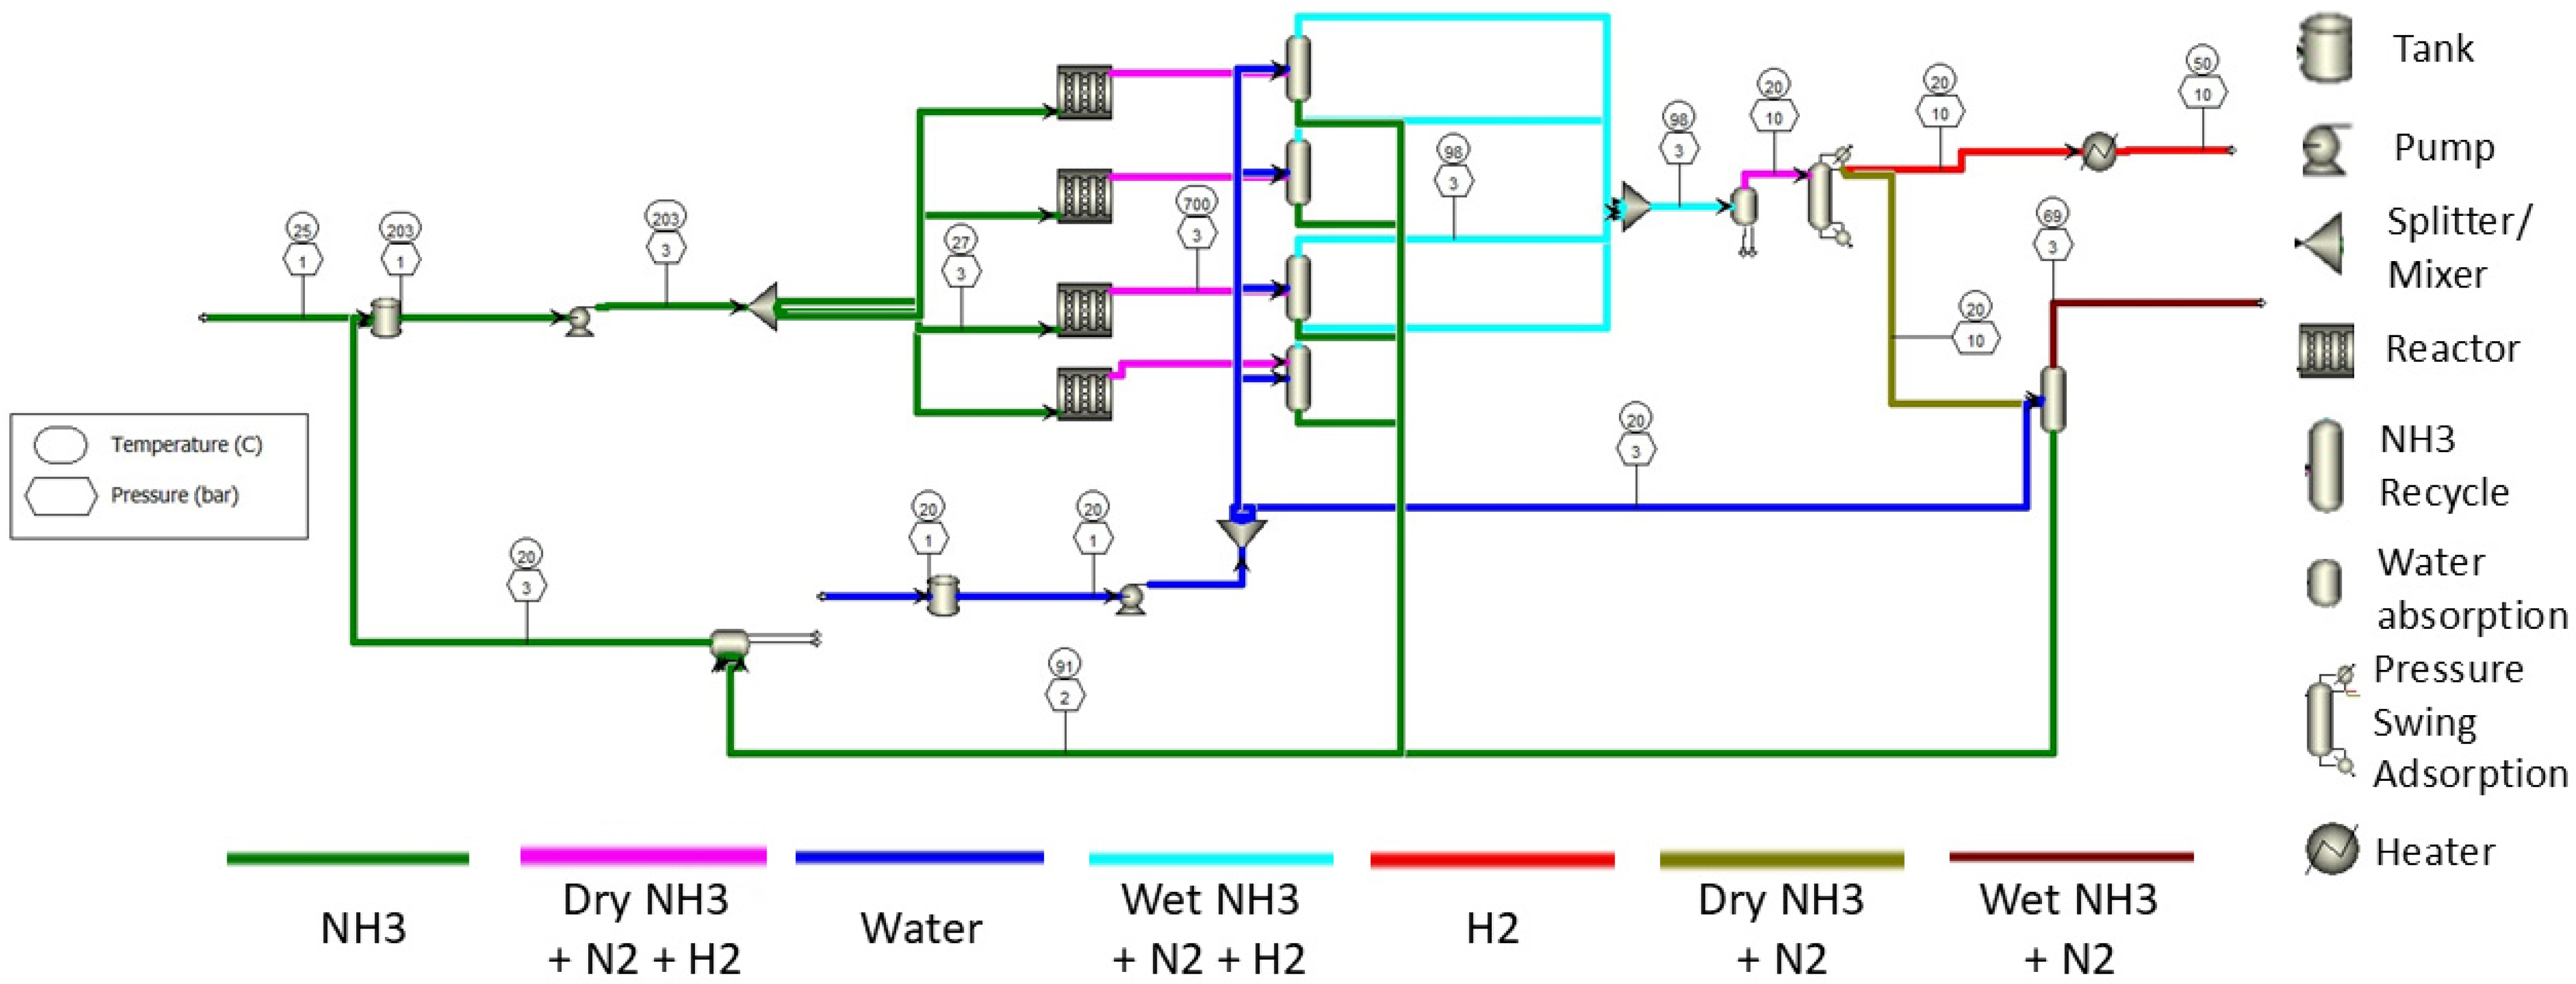
2.1.1. Simulation of SGT-400 Gas Turbine
2.1.2. Basis of Design
2.1.3. Methodology of Techno-Economic Assessment
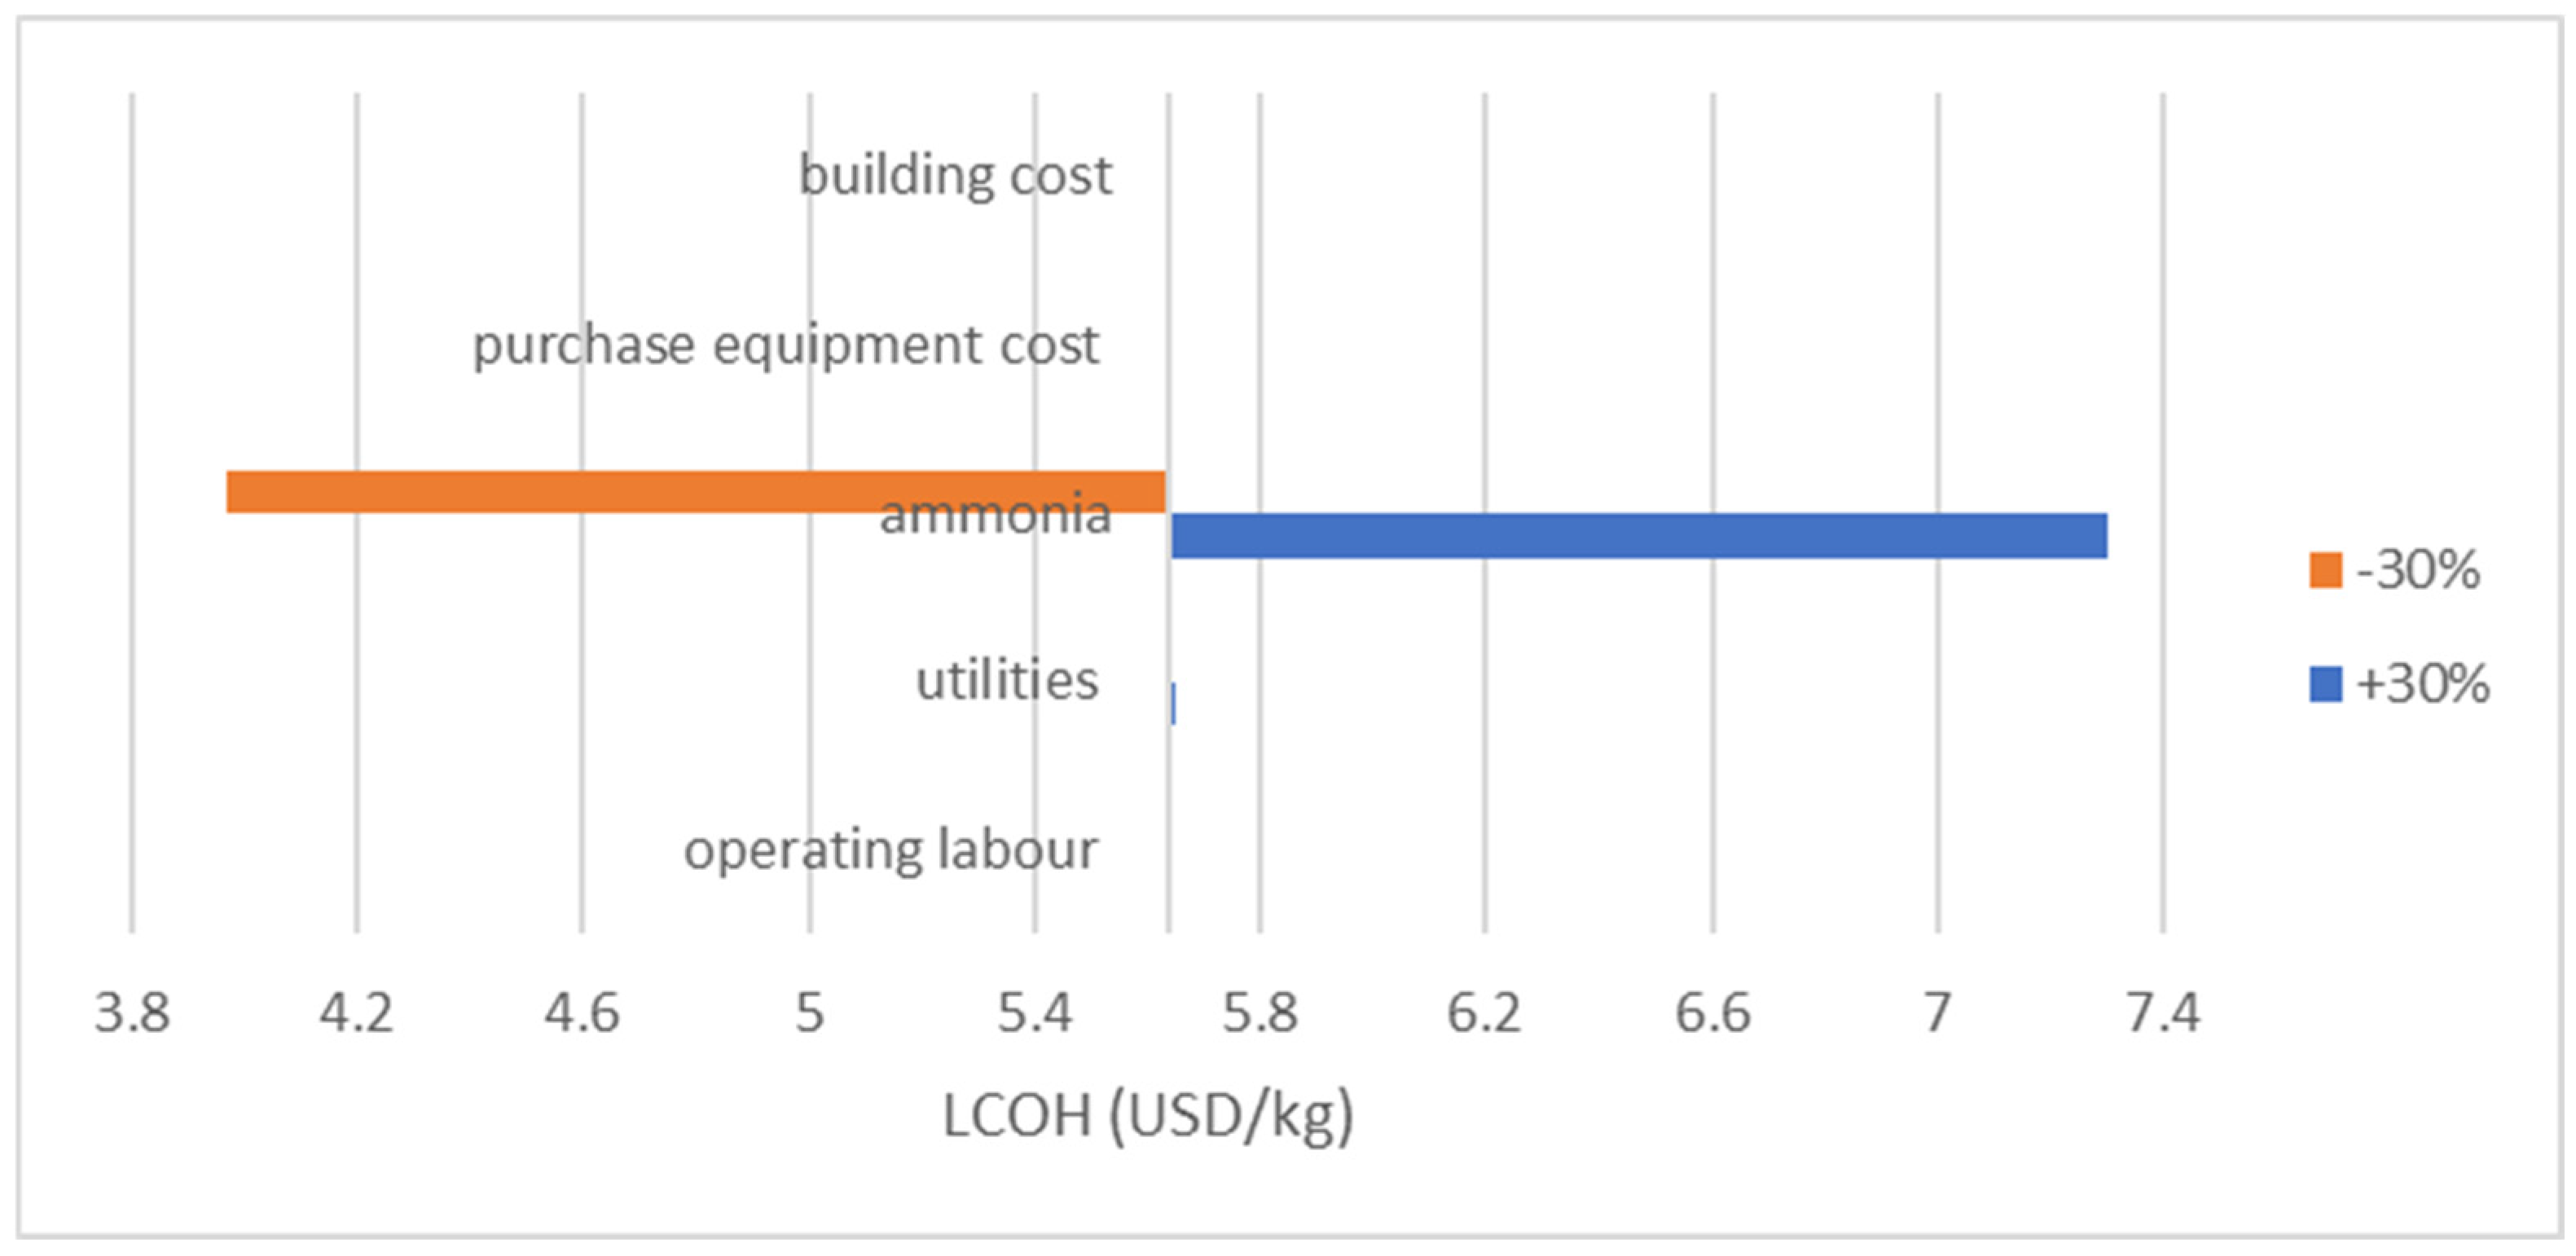
2.1.4. Sensitivity Analysis
2.1.5. Uncertainty Analysis by Monte Carlo Simulation
- Identify the key economic parameters;
- Calculate the minimum and maximum for each parameter with variation of ;
- Calculate the range of each parameter;
- Allocate uniform probability distribution for all parameters except for the ammonia cost in step 1. The triangular probability distribution is used for ammonia cost and the cumulative probability distribution is calculated using the cumulative distribution function (CDF) with Equations (8) and (9);
- Generate a random number between 0 and 1 for one of the parameters;
- Using the random number from step 5, assign a value to the probability distribution for that parameter;
- Calculate the LCOH using the sum of the min value and assigned value with the range;
- Repeat step 5 to step 7 for 10,000 iterations;
- Repeat step 2 to step 7 for variations of , and ;
- Repeat steps 1 to 8 for other parameters.
- : minimum value;
- : most likely value;
- : maximum value;
- : random value.
2.1.6. Exergy Analysis
- Potential and kinetic exergy are negligible;
- Steady-state model;
- No loss due to pressure in a system.
2.1.7. Climate Change Impacts Based on the Global Warning Potential
3. Results and Discussion
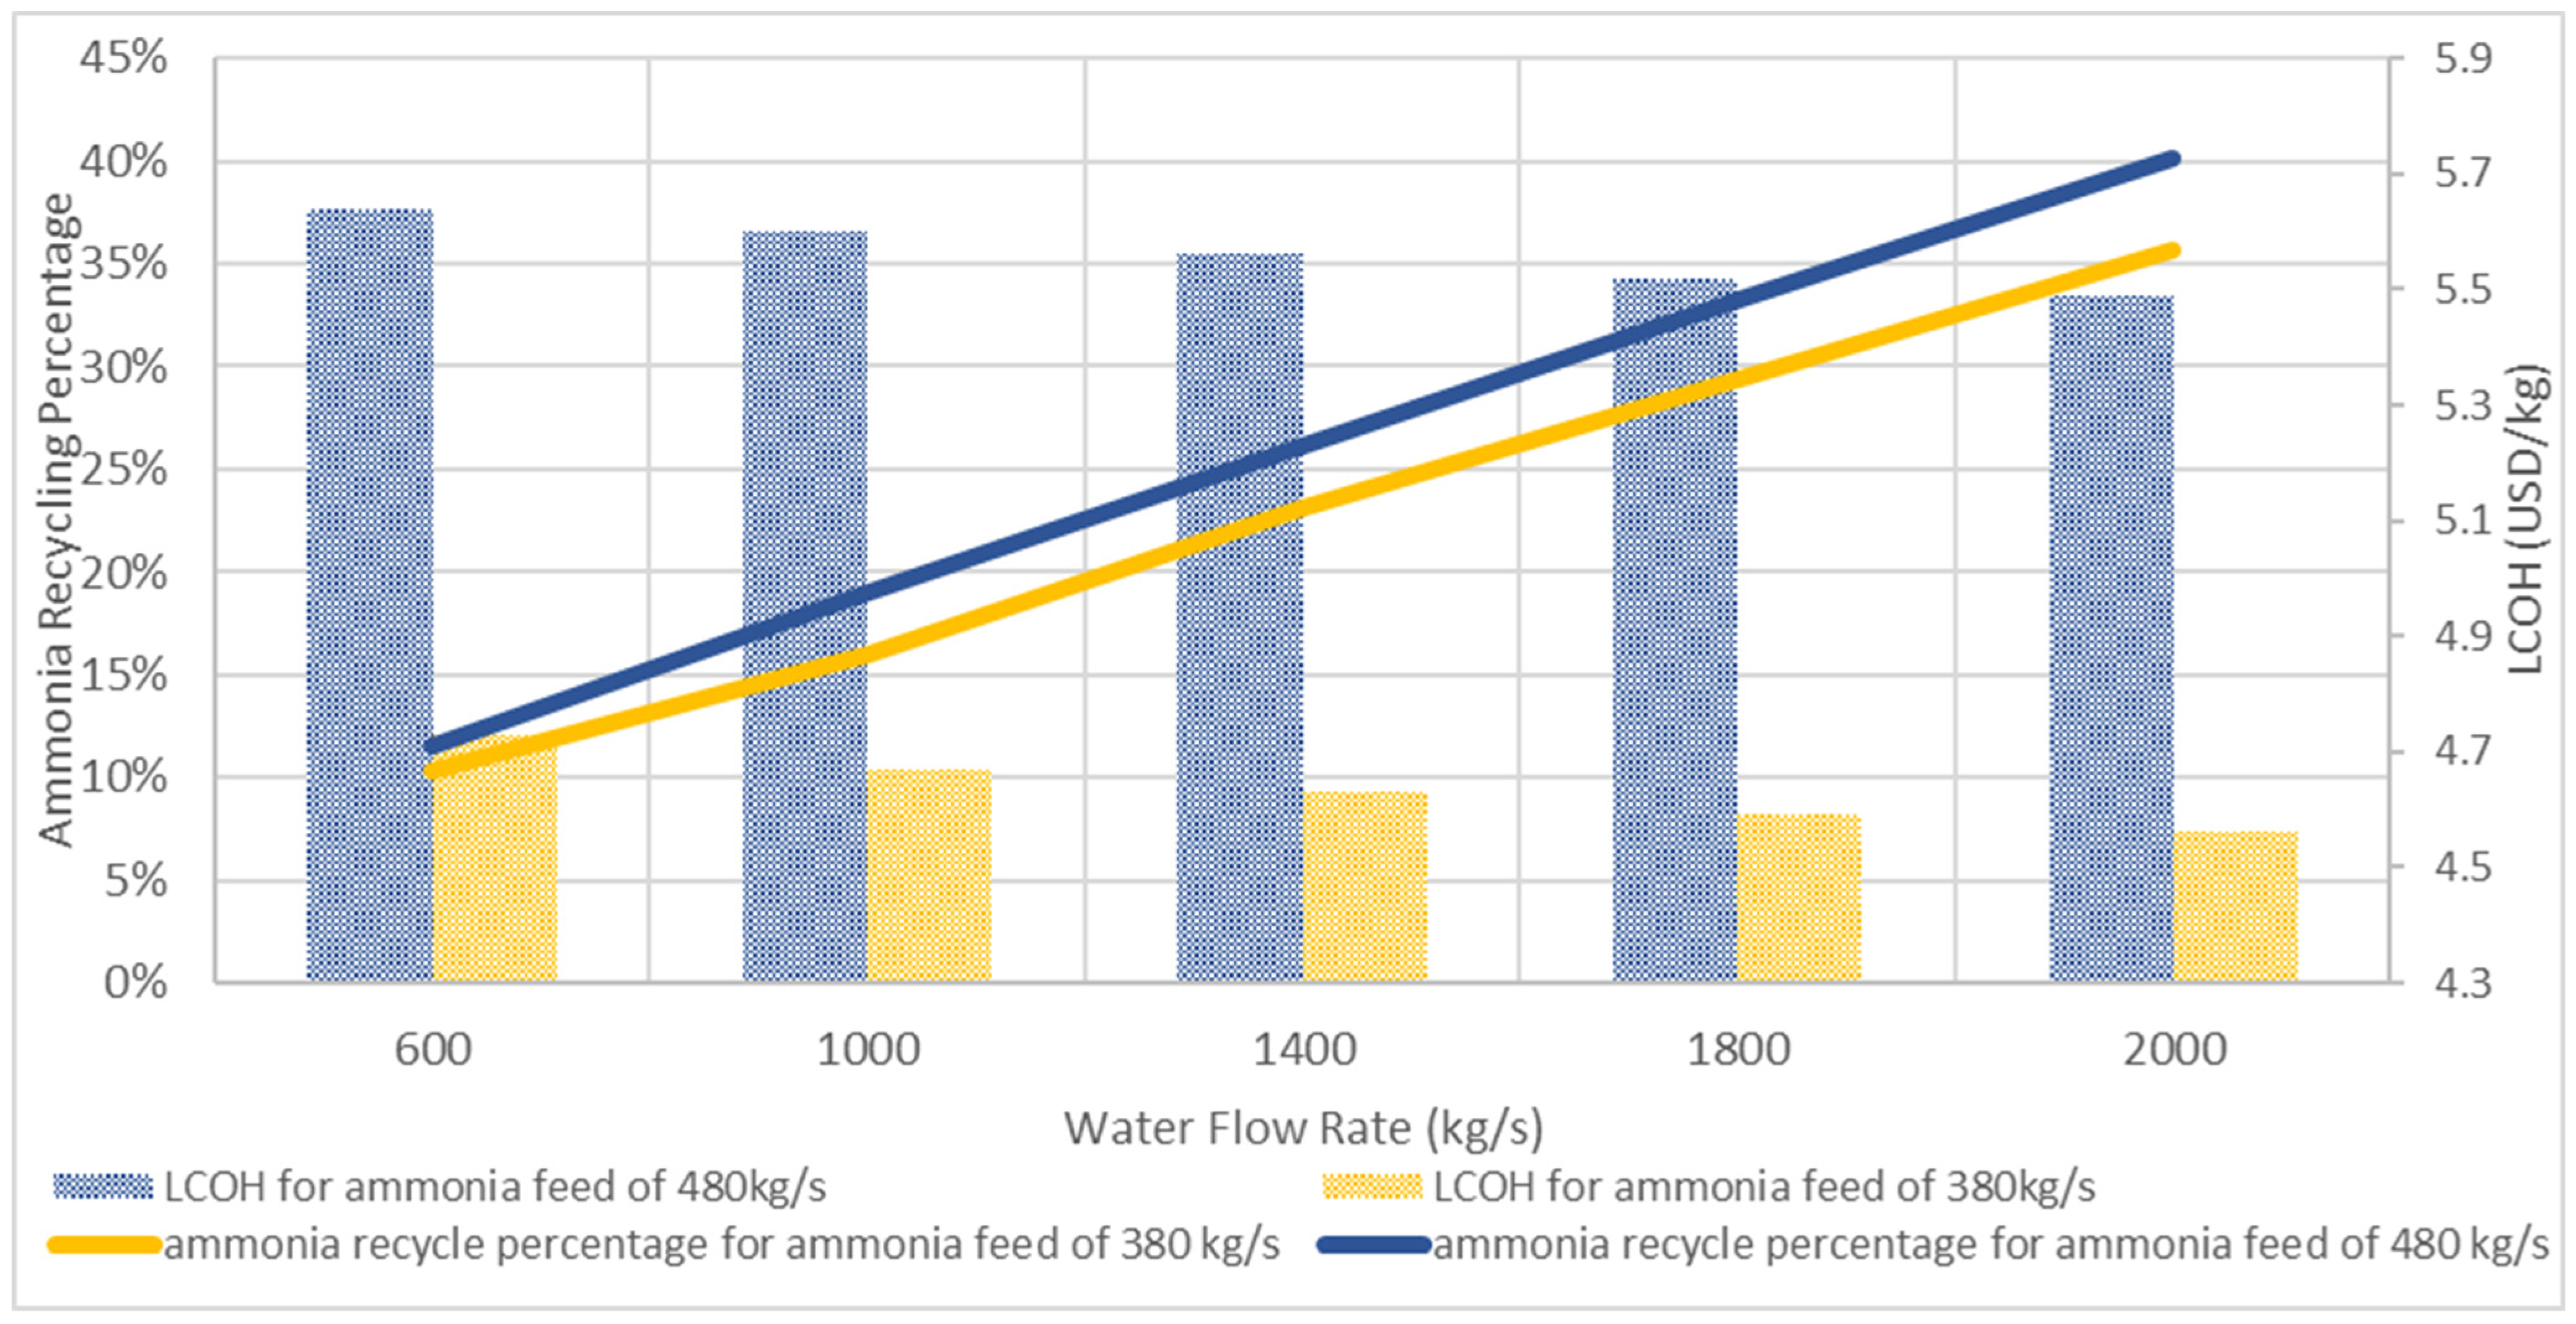
3.1. Effect of Economic and Process Parameters on LCOH
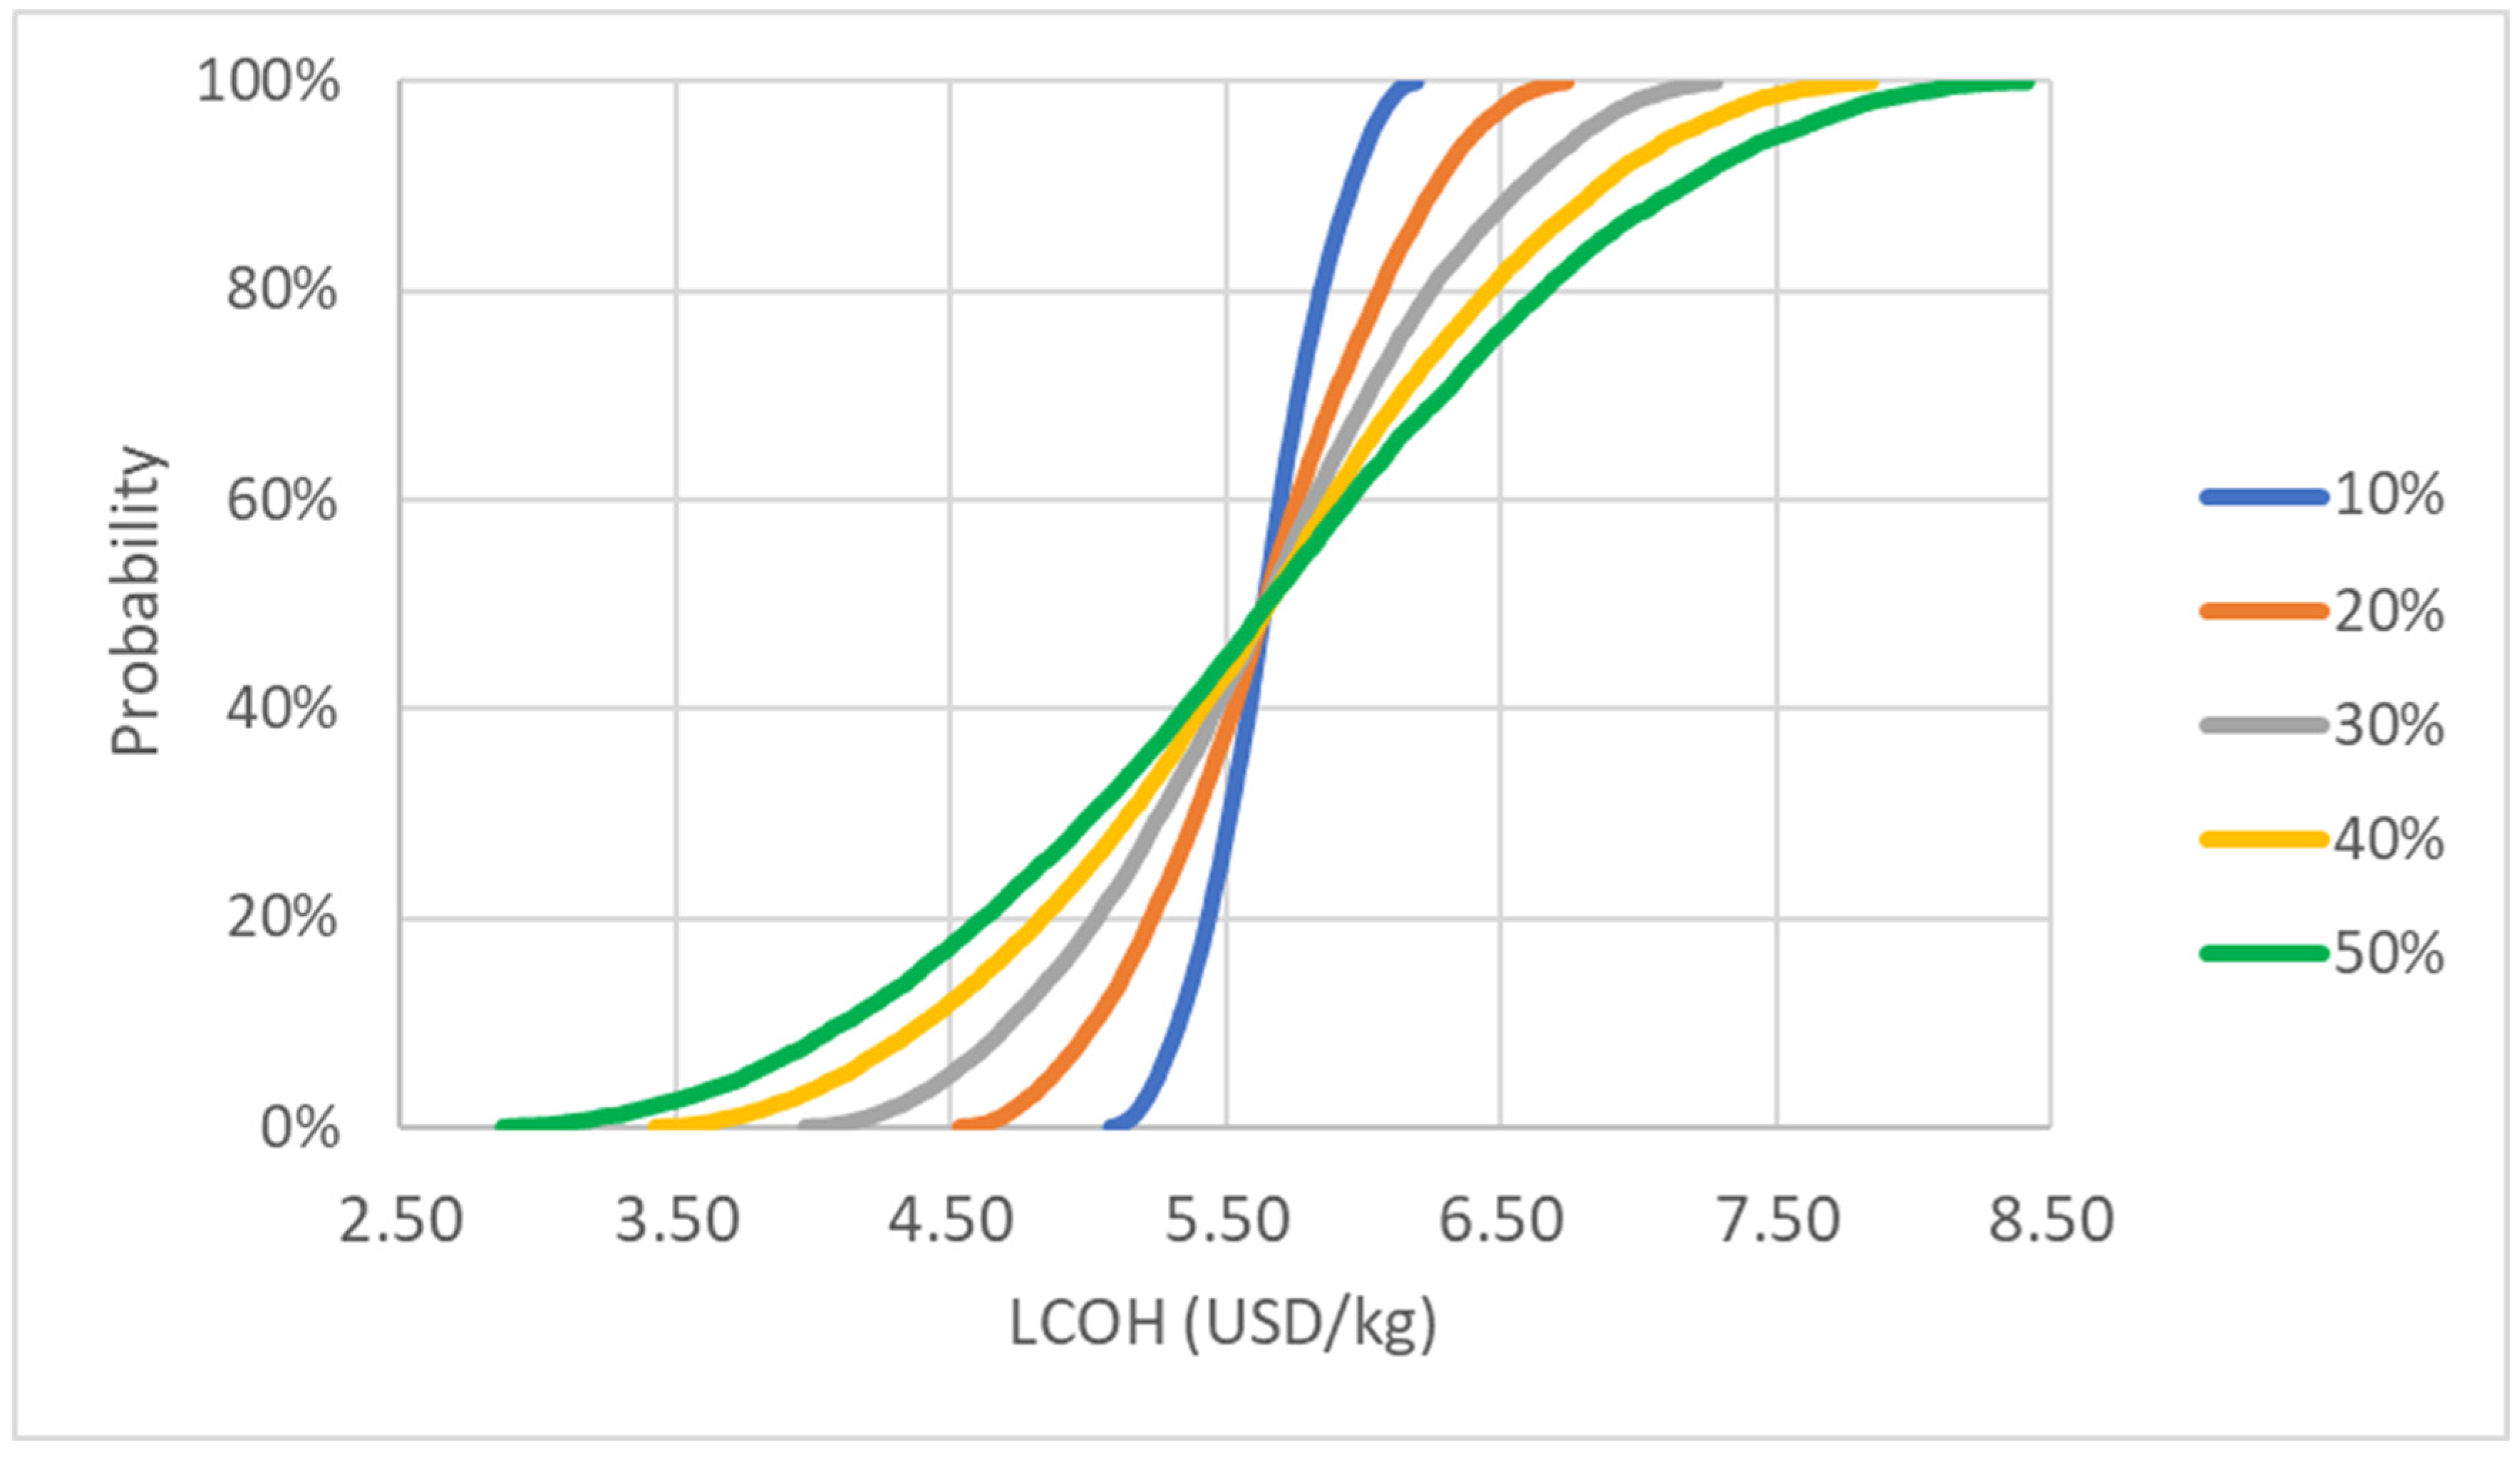
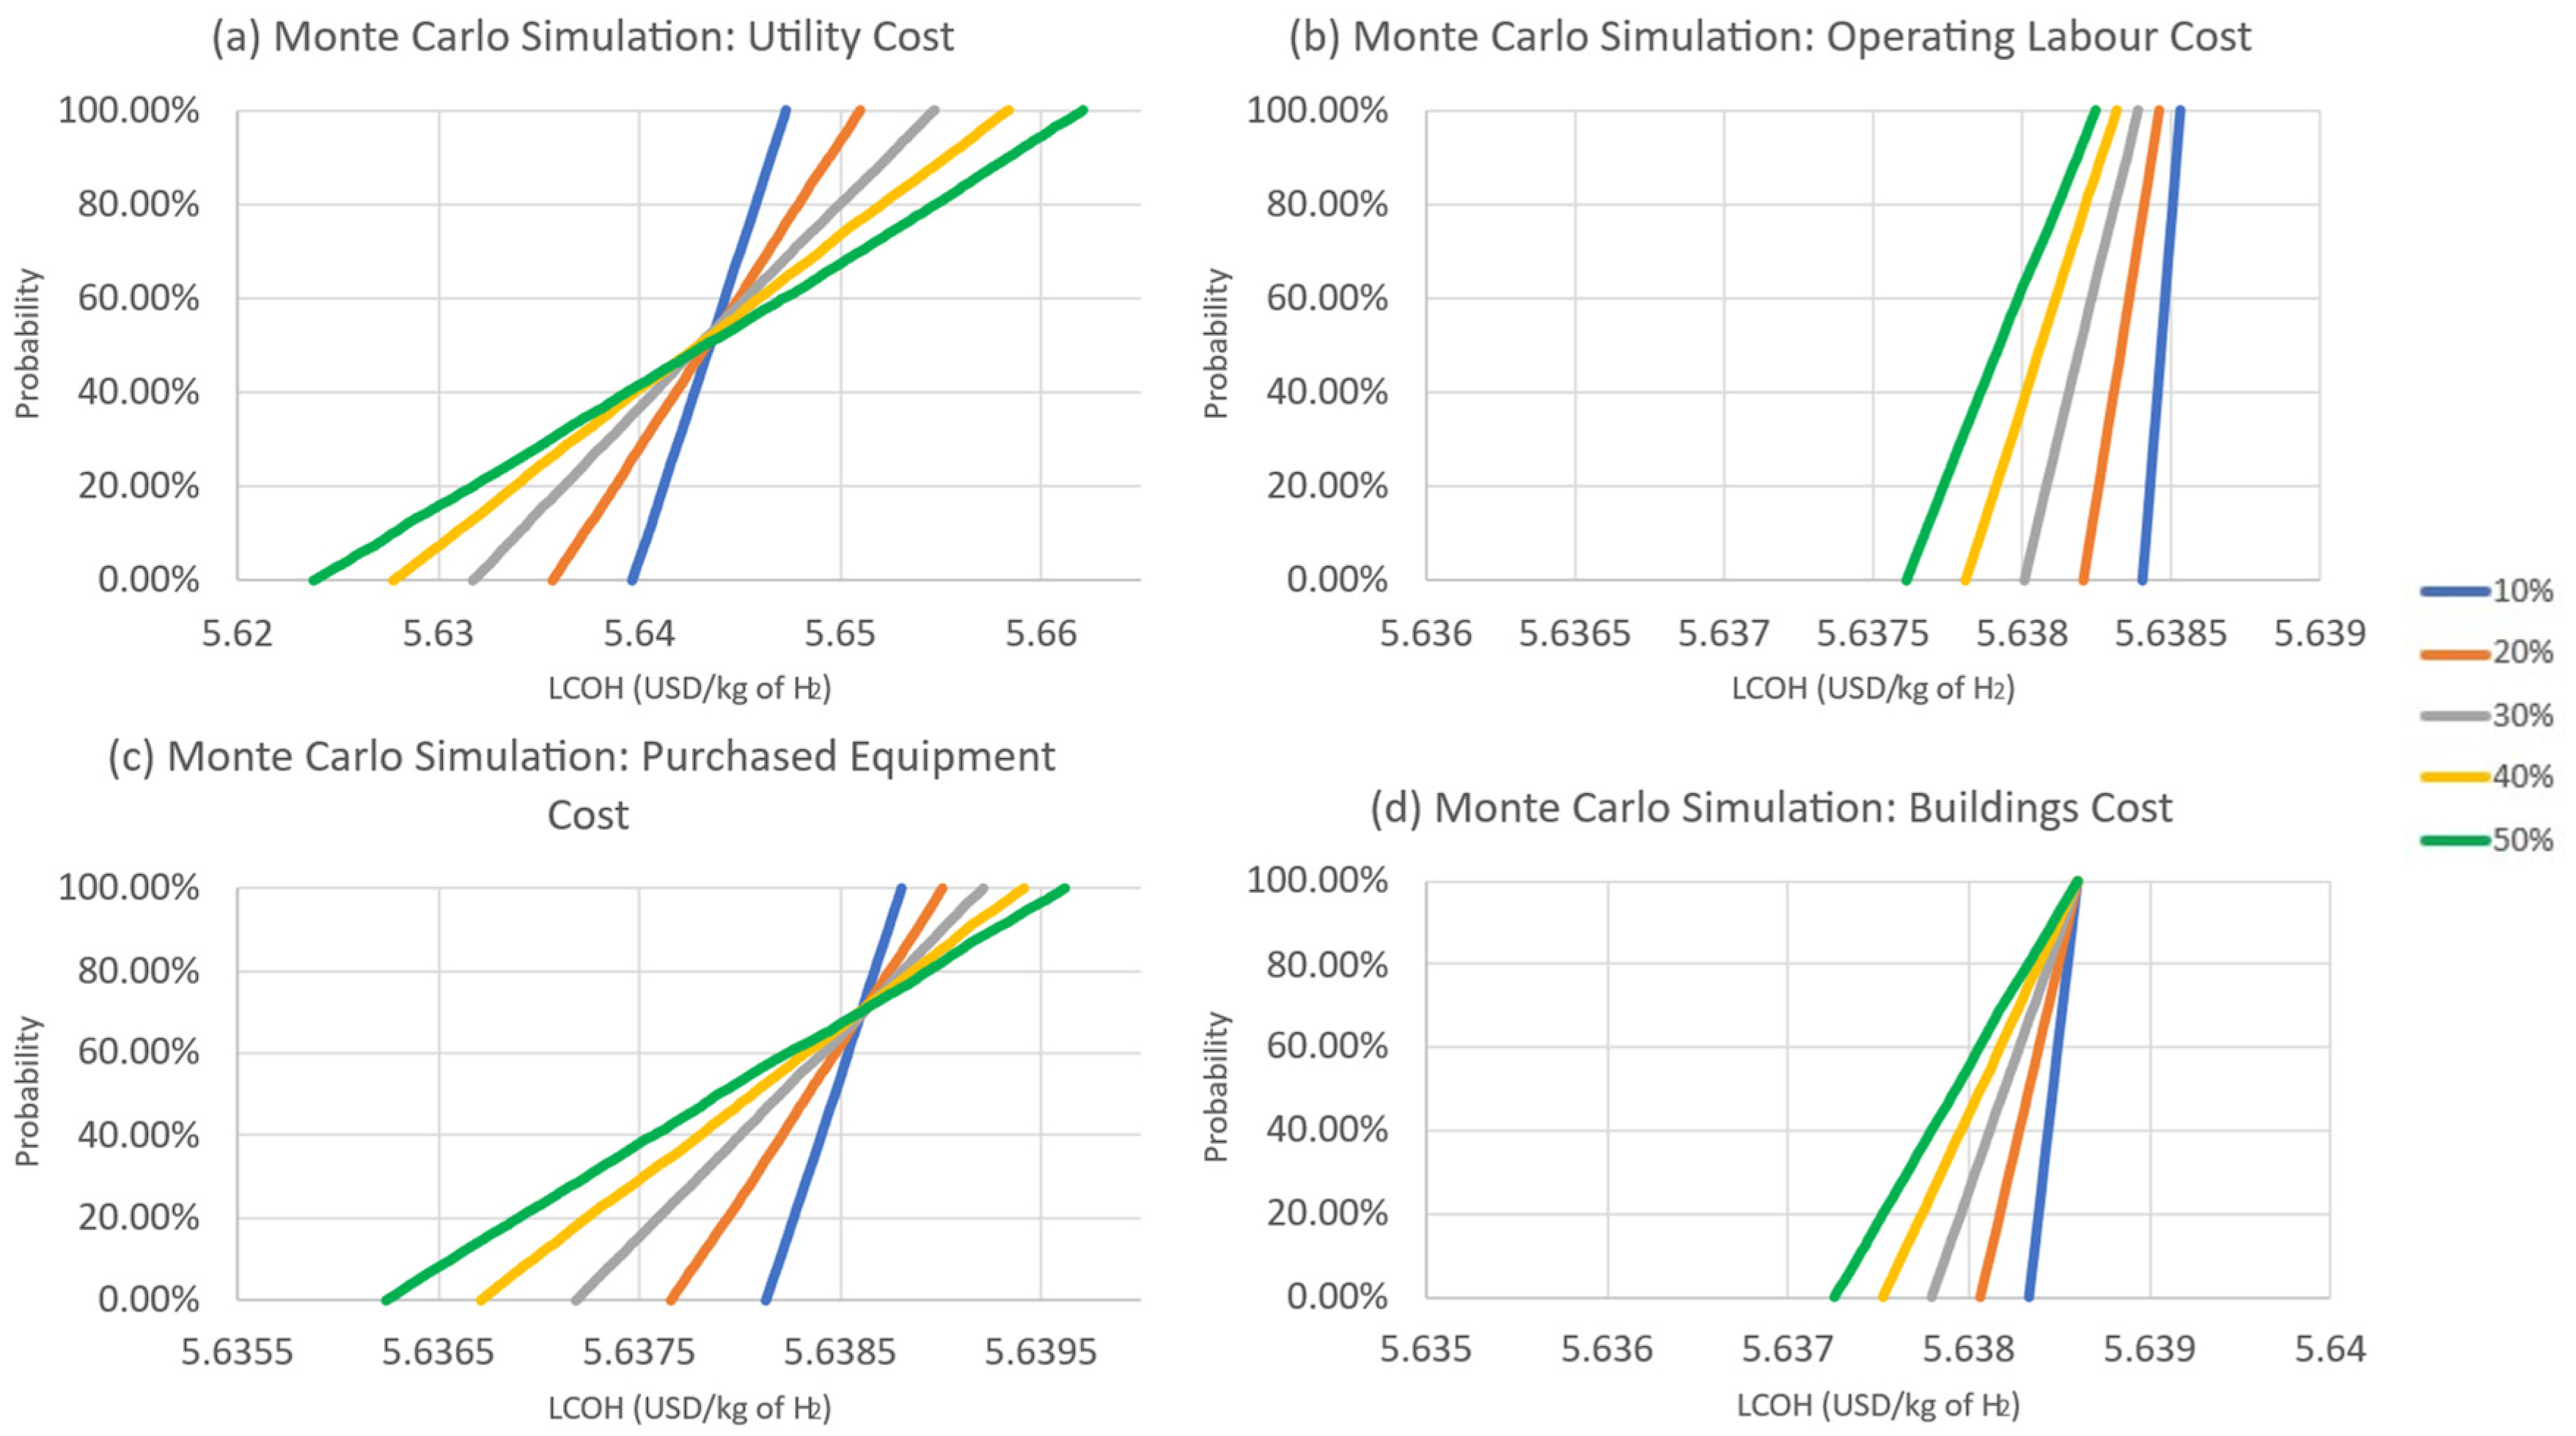
3.2. Uncertainty Analysis with Monte Carlo Simulation
3.3. Exergy Analysis Result
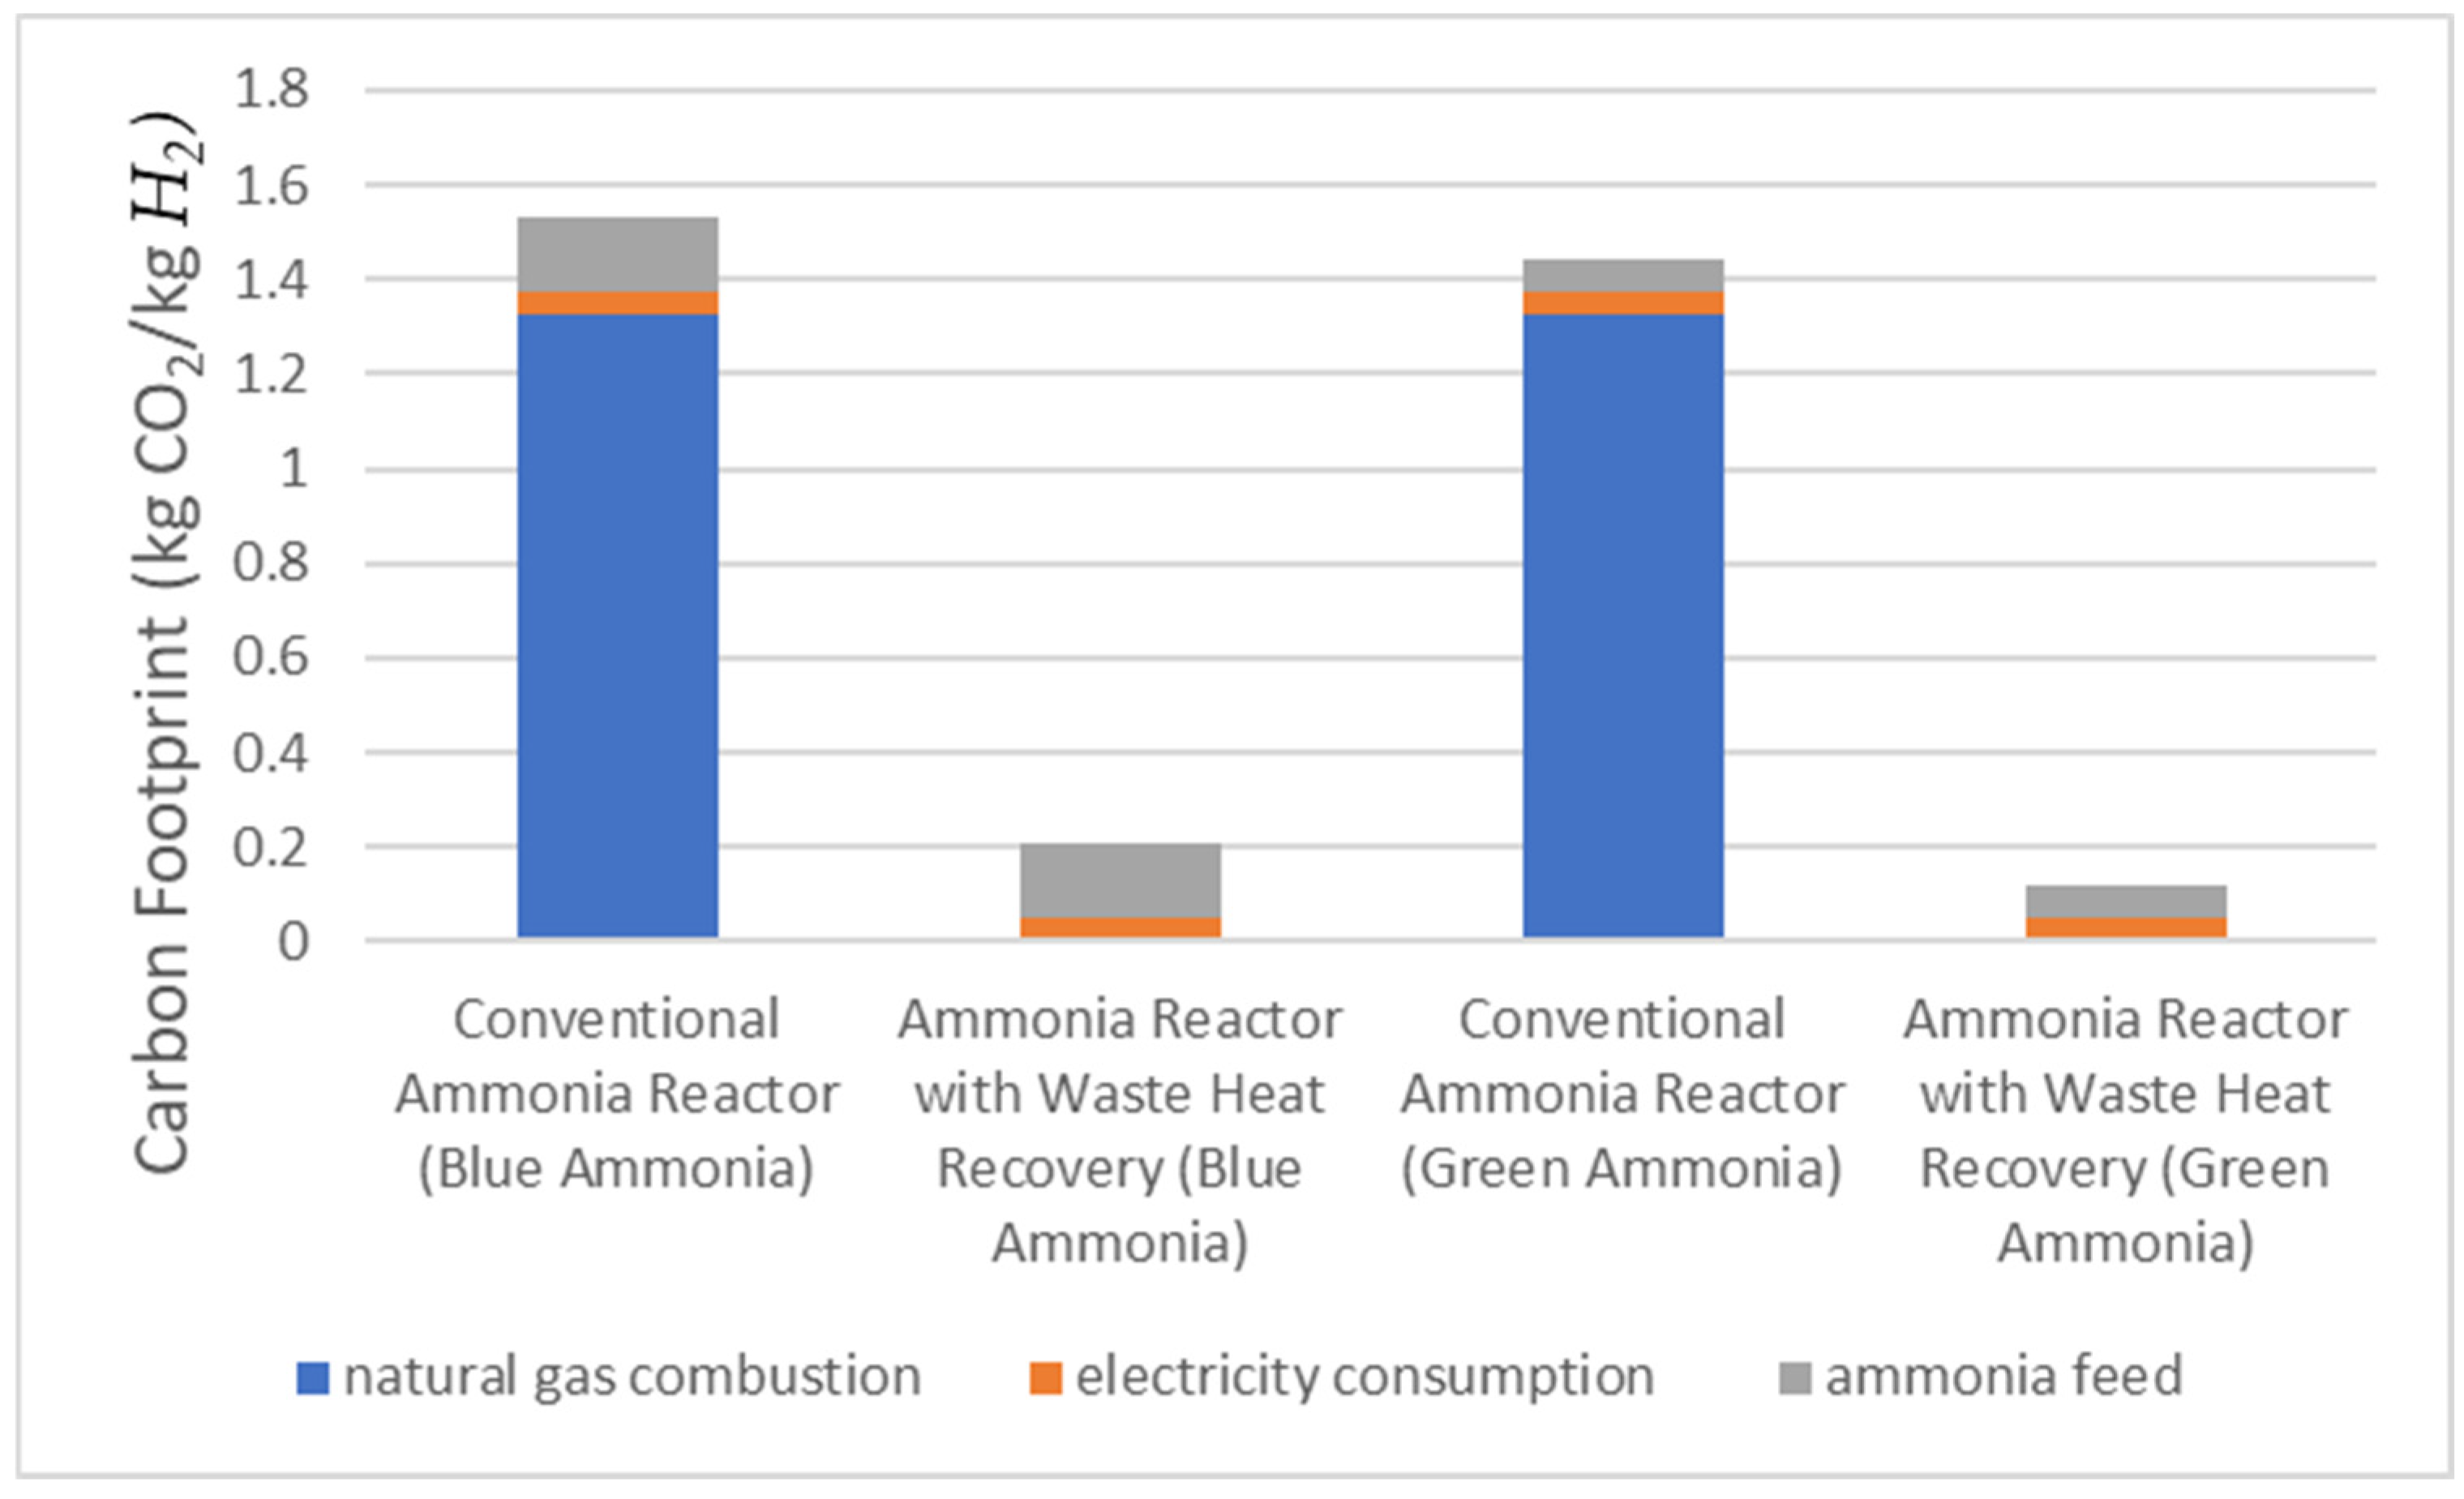
3.4. Carbon Emission Comparison
4. Conclusions
Author Contributions
Funding
Institutional Review Board Statement
Informed Consent Statement
Data Availability Statement
Acknowledgments
Conflicts of Interest
Appendix A

| Equipment Name | Simulated Purchased Equipment Cost, USD | Calculated Purchased Equipment Cost in 2024, USD |
|---|---|---|
| Reactor 1 | 18,100 | 25,486.13 |
| Ammonia Absorber 1 | 1,652,700 | 2,327,122.79 |
| Ammonia Flash Distillate with Splitter | 3,650,800 | 5,140,594.11 |
| PSA | 1,469,000 | 2,068,459.72 |
| Water Pump | 104,800 | 147,566.08 |
| Ammonia Pump | 851,600 | 1,199,115.25 |
| Water Absorption | 137,900 | 194,173.31 |
| Ammonia Absorber 5 | 2,358,300 | 3,320,659.33 |
| Reactor 2 | 18,100 | 25,486.13 |
| Ammonia Absorber 2 | 1,652,700 | 2,327,122.79 |
| Ammonia Absorber 4 | 1,652,700 | 2,327,122.79 |
| Reactor 4 | 18,100 | 25,486.13 |
| Ammonia Absorber 3 | 1,652,700 | 2,327,122.79 |
| Reactor 3 | 18,100 | 25,486.13 |
| HEATER | 585,400 | 824,286.13 |
| Total | 22,305,289.62 | |
References
- IEA. Global Hydrogen Review 2023; International Energy Agency: Paris, France, 2023. [Google Scholar]
- Roy, R.; Antonini, G.; Hayibo, K.S.; Rahman, M.M.; Khan, S.; Tian, W.; Boutilier, M.S.; Zhang, W.; Zheng, Y.; Bassi, A. Comparative techno-environmental analysis of grey, blue, green/yellow and pale-blue hydrogen production. Int. J. Hydrogen Energy 2025, 116, 200–210. [Google Scholar] [CrossRef]
- Yang, M.; Hunger, R.; Berrettoni, S.; Sprecher, B.; Wang, B. A review of hydrogen storage and transport technologies. Clean Energy 2023, 7, 190–216. [Google Scholar] [CrossRef]
- Sdanghi, G.; Maranzana, G.; Celzard, A.; Fierro, V. Review of the current technologies and performances of hydrogen compression for stationary and automotive applications. Renew. Sustain. Energy Rev. 2019, 102, 150–170. [Google Scholar] [CrossRef]
- Yowell, G. How Does the Cost of Hydrogen Stack Up Against Gasoline. Stillwate Associates. 2022. Available online: https://stillwaterassociates.com/how-does-the-cost-of-hydrogen-stack-up-against-gasoline/ (accessed on 2 May 2025).
- Zhang, L.; Jia, C.; Bai, F.; Wang, W.; An, S.; Zhao, K.; Li, Z.; Li, J.; Sun, H. A comprehensive review of the promising clean energy carrier: Hydrogen production, transportation, storage, and utilization (HPTSU) technologies. Fuel 2024, 355, 129455. [Google Scholar] [CrossRef]
- Ashcroft, J.; Goddin, H. Centralised and Localised Hydrogen Generation by Ammonia Decomposition: A technical review of the ammonia cracking process. Johns Matthey Technol. Rev. 2022, 66, 375–385. [Google Scholar] [CrossRef]
- Usman, M.R. Hydrogen storage methods: Review and current status. Renew. Sustain. Energy Rev. 2022, 167, 112743. [Google Scholar] [CrossRef]
- Lucentini, I.; Garcia, X.; Vendrell, X.; Llorca, J. Review of the decomposition of ammonia to generate hydrogen. Ind. Eng. Chem. Res. 2021, 60, 18560–18611. [Google Scholar] [CrossRef]
- Shafie, P.; DeChamplain, A.; Lepine, J. Thermal Ammonia Decomposition for Hydrogen-Rich Fuel Production and the Role of Waste Heat Recovery. Int. J. Energy Res. 2024, 2024, 9534752. [Google Scholar] [CrossRef]
- Su, Z.; Guan, J.; Liu, Y.; Shi, D.; Wu, Q.; Chen, K.; Zhang, Y.; Li, H. Research progress of ruthenium-based catalysts for hydrogen production from ammonia decomposition. Int. J. Hydrogen Energy 2024, 51, 1019–1043. [Google Scholar] [CrossRef]
- Chellappa, A.; Fischer, C.; Thomson, W. Ammonia decomposition kinetics over Ni-Pt/Al2O3 for PEM fuel cell applications. Appl. Catal. A Gen. 2002, 227, 231–240. [Google Scholar] [CrossRef]
- Lucentini, I.; Casanovas, A.; Llorca, J. Catalytic ammonia decomposition for hydrogen production on Ni, Ru and NiRu supported on CeO2. Int. J. Hydrogen Energy 2019, 44, 12693–12707. [Google Scholar] [CrossRef]
- Mukherjee, S.; Devaguptapu, S.V.; Sviripa, A.; Lund, C.R.; Wu, G. Low-temperature ammonia decomposition catalysts for hydrogen generation. Appl. Catal. B Environ. 2018, 226, 162–181. [Google Scholar] [CrossRef]
- Council, H. Hydrogen Scaling Up: A Sustainable Pathway for the Global Energy Transition; Hydrogen Council: Davos, Switzerland, 2017. [Google Scholar]
- Council, H. Hydrogen Insights 2024; Hydrogen Council: Davos, Switzerland, 2024. [Google Scholar]
- Minutillo, M.; Perna, A.; Forcina, A.; Di Micco, S.; Jannelli, E. Analyzing the levelized cost of hydrogen in refueling stations with on-site hydrogen production via water electrolysis in the Italian scenario. Int. J. Hydrogen Energy 2021, 46, 13667–13677. [Google Scholar] [CrossRef]
- Villalba-Herreros, A.; d’Amore-Domenech, R.; Crucelaegui, A.; Leo, T.J. Techno-economic assessment of large-scale green hydrogen logistics using ammonia as hydrogen carrier: Comparison to liquified hydrogen distribution and in situ production. ACS Sustain. Chem. Eng. 2023, 11, 4716–4726. [Google Scholar] [CrossRef]
- Energy, S.; Centrax. HYFLEXPOWER Consortium Successfully Operates a Gas Turbine with 100 Percent Renewable Hydrogen, a World First; Siemens Energy Munich: Munich, Germany, 2023. [Google Scholar]
- Ajoko, T.J.; Awusa, G.T.; Ogbonnaya, E.A. The Effects of Intrinsic Parameters on the Performance of Industrial Gas Turbines. The Effects of Intrinsic Parameters on the Performance of Industrial Gas Turbines. Int. J. Sci. Res. Eng. Technol. (IJSRET) 2018, 7, 758–764. [Google Scholar]
- Edwards, P.P.; Kuznetsov, V.L.; David, W.I. Hydrogen energy. Philos. Trans. R. Soc. A Math. Phys. Eng. Sci. 2007, 365, 1043–1056. [Google Scholar] [CrossRef]
- Lamb, K.E.; Dolan, M.D.; Kennedy, D.F. Ammonia for hydrogen storage; A review of catalytic ammonia decomposition and hydrogen separation and purification. Int. J. Hydrogen Energy 2019, 44, 3580–3593. [Google Scholar] [CrossRef]
- Ye, F.; Ma, S.; Tong, L.; Xiao, J.; Bénard, P.; Chahine, R. Artificial neural network based optimization for hydrogen purification performance of pressure swing adsorption. Int. J. Hydrogen Energy 2019, 44, 5334–5344. [Google Scholar] [CrossRef]
- Sircar, S.; Golden, T. Purification of hydrogen by pressure swing adsorption. Sep. Sci. Technol. 2000, 35, 667–687. [Google Scholar] [CrossRef]
- Inc, A.T. Aspen Plus V14; Aspen Technology Inc.: Bedford, MA, USA, 2022. [Google Scholar]
- Peng, D.-Y.; Robinson, D.B. A new two-constant equation of state. Ind. Eng. Chem. Fundam. 1976, 15, 59–64. [Google Scholar] [CrossRef]
- Peters, M.S.; Timmerhaus, K.D. Plant Design and Economics for Chemical Engineers; McGraw-Hill International: New York, NY, USA, 2018. [Google Scholar]
- Devkota, S.; Cha, J.-Y.; Shin, B.-J.; Mun, J.-H.; Yoon, H.C.; Mazari, S.A.; Moon, J.-H. Techno-economic and environmental assessment of hydrogen production through ammonia decomposition. Appl. Energy 2024, 358, 122605. [Google Scholar] [CrossRef]
- Singapore Energy Market Authority Organization. Buying at Regulated Tariff. Available online: https://www.ema.gov.sg/consumer-information/electricity/buying-electricity/buying-at-regulated-tariff (accessed on 2 May 2025).
- Simon Property Group, Inc. Interactive: Ammonia Price Chart. Available online: https://cilive.com/commodities/energy-transition/news-and-insight/051023-interactive-ammonia-price-chart-natural-gas-feedstock-europe-usgc-black-sea (accessed on 2 May 2025).
- Singapore’s National Water Agency. Water Price. Available online: https://www.pub.gov.sg/Public/WaterLoop/Water-Price (accessed on 2 May 2025).
- City Energy. Gas Tariffs. Available online: https://www.cityenergy.com.sg/gas-tariffs/ (accessed on 2 May 2025).
- Mehrpooya, M.; Asadnia, M.; Karimi, A.H.; Allahyarzadeh-Bidgoli, A. Hybrid Poly-Generation Energy Systems: Thermal Design and Exergy Analysis; Elsevier: Amsterdam, The Netherlands, 2023. [Google Scholar]
- Szargut, J. Egzergia: Poradnik Obliczania i Stosowania; Wydawnictwo Politechniki Śląskiej: Gliwice, Poland, 2007. [Google Scholar]
- Mayer, P.; Ramirez, A.; Pezzella, G.; Winter, B.; Sarathy, S.M.; Gascon, J.; Bardow, A. Blue and green ammonia production: A techno-economic and life cycle assessment perspective. iScience 2023, 26, 107389. [Google Scholar] [CrossRef] [PubMed]
- Commission Implementing Regulation (EU). 2018/2066 of 19 December 2018 on the monitoring and reporting of greenhouse gas emissions pursuant to Directive 2003/87/EC of the European Parliament and of the Council and amending Commission Regulation (EU) No 601/2012. Off. J. Eur. Union 2018, 31, 1–93. [Google Scholar]
- Del Pozo, C.A.; Cloete, S. Techno-economic assessment of blue and green ammonia as energy carriers in a low-carbon future. Energy Convers. Manag. 2022, 255, 115312. [Google Scholar] [CrossRef]
- Kerscher, F.; Stary, A.; Gleis, S.; Ulrich, A.; Klein, H.; Spliethoff, H. Low-carbon hydrogen production via electron beam plasma methane pyrolysis: Techno-economic analysis and carbon footprint assessment. Int. J. Hydrogen Energy 2021, 46, 19897–19912. [Google Scholar] [CrossRef]


| Hydrogen Storage Method | ) | Reference |
|---|---|---|
| Compressed hydrogen gas at 500 bar | 31 | [7] |
| Liquid hydrogen | 71 | [7] |
| Cryogenic compressed hydrogen at 350 bar and −253 °C | 80 | [8] |
| Ammonia | 120 | [7] |
| Methanol | 99 | [7] |
| Component | Power (MW) |
|---|---|
| LPC | 39.8 |
| LPT | −36.7 |
| PT | −15.8 |
| Total Work Output | −12.8 |
| Duty Heat (kW) | Power Consumption (kW) | |
|---|---|---|
| Reactors with Furnace | 1,733,042.12 | - |
| Water Absorption | −1,043,321.721 | - |
| Ammonia Flash Distillation | 75,866.531 | - |
| Ammonia Feed Pump | - | 520.636 |
| Water Feed Pump | - | 133.498 |
| PSA | - | −3519.065 |
| Component | Duty Heat (kW) | Power Consumption (kW) |
|---|---|---|
| Reactors | 1,733,041.352 | - |
| Water Absorption | −1,043,320.976 | - |
| Ammonia Flash Distillation | 75,866.954 | - |
| Ammonia Feed Pump | - | 520.636 |
| Water Feed Pump | - | 133.498 |
| PSA | - | 3519.061 |
| Parameter | Value | Reference |
|---|---|---|
| Electricity cost, USD/kWh | 0.235 | [29] |
| Blue ammonia cost, USD/kg | 0.48 | [30] |
| Green ammonia cost, USD/kg | 0.972 | [30] |
| Water cost, USD/L | 0.001296 | [31] |
| Natural gas, cent/kWh | 16.88 | [32] |
| Discount rate,% | 10 | - |
| Plant life, Years | 25 | - |
| Number of labourers | 15 | - |
| Labor salary, | 31,111 | - |
| Component | Molar Flow (kmol/s) | Molar Fraction | ||
|---|---|---|---|---|
| Inlet Stream | Outlet Stream | Inlet Stream | Outlet Stream | |
| Ammonia | 7.86 | 4.42 | 1 | 0.39 |
| Hydrogen | 5.15 | 0.46 | ||
| Nitrogen | 1.72 | 0.15 | ||
| Component | Molar Flow (kmol/s) | Molar Fraction | ||
|---|---|---|---|---|
| Inlet Stream | Outlet Stream | Inlet Stream | Outlet Stream | |
| Ammonia | 7.86 | 4.42 | 1 | 0.39 |
| Hydrogen | 5.15 | 0.46 | ||
| Nitrogen | 1.72 | 0.15 | ||
| Component | Standard Chemical Exergy (kJ/mol) |
|---|---|
| Ammonia | 337.90 |
| Hydrogen | 236.09 |
| Nitrogen | 0.72 |
| Component | Physical Exergy (GW) | |
|---|---|---|
| Inlet Stream | Outlet Stream | |
| Reactor with Heat Recovery | 0.14 | 0.17 |
| Reactor with furnace | 0.087 | 0.17 |
| Components | Cost, USD | |
|---|---|---|
| Ammonia Reactor with Waste Heat Recovery | Conventional Ammonia Reactor | |
| Fixed Capital Investment (FCI) | 90,204,520 | 138,680,360 |
| Direct costs | ||
| Purchased equipment cost | 22,305,290 | 40,710,216 |
| Installation cost, including insulation, and painting | 1,156,296 | 1,917,330 |
| Instrumentation and controls (installed) | 2,479,310 | 3,255,750 |
| Piping cost (installed) | 17,101,700 | 20,427,300 |
| Electrical systems (installed) | 1,097,320 | 1,116,210 |
| Buildings including all the facilities | 15,979,900 | 20,140,300 |
| Total direct plant cost | 60,119,816 | 87,567,106 |
| Indirect costs | ||
| Engineering and supervision | 4,115,000 | 4,885,300 |
| Construction expenses | 12,144,544 | 26,524,704 |
| Legal expenses | 1,498,770 | 2,201,450 |
| Contractor’s fee | 1,968,890 | 2,557,200 |
| Contingency | 10,357,500 | 14,944,600 |
| Total indirect plant cost | 30,084,704 | 51,113,254 |
| Working capital investment (WCI) | 17,844,232 | 32,568,173 |
| Total capital investment (TCI) | 108,048,751 | 171,248,533 |
| Capital expenditure (CAPEX) | 11,903,515 | 18,866,108 |
| Cost Recovery Factor (CRF) | 0.11 | 0.11 |
| OPEX | 7,365,986,525 | 8,245,465,939 |
| Annual production capacity, kg/year | 1,308,744,000 | 1,308,744,000 |
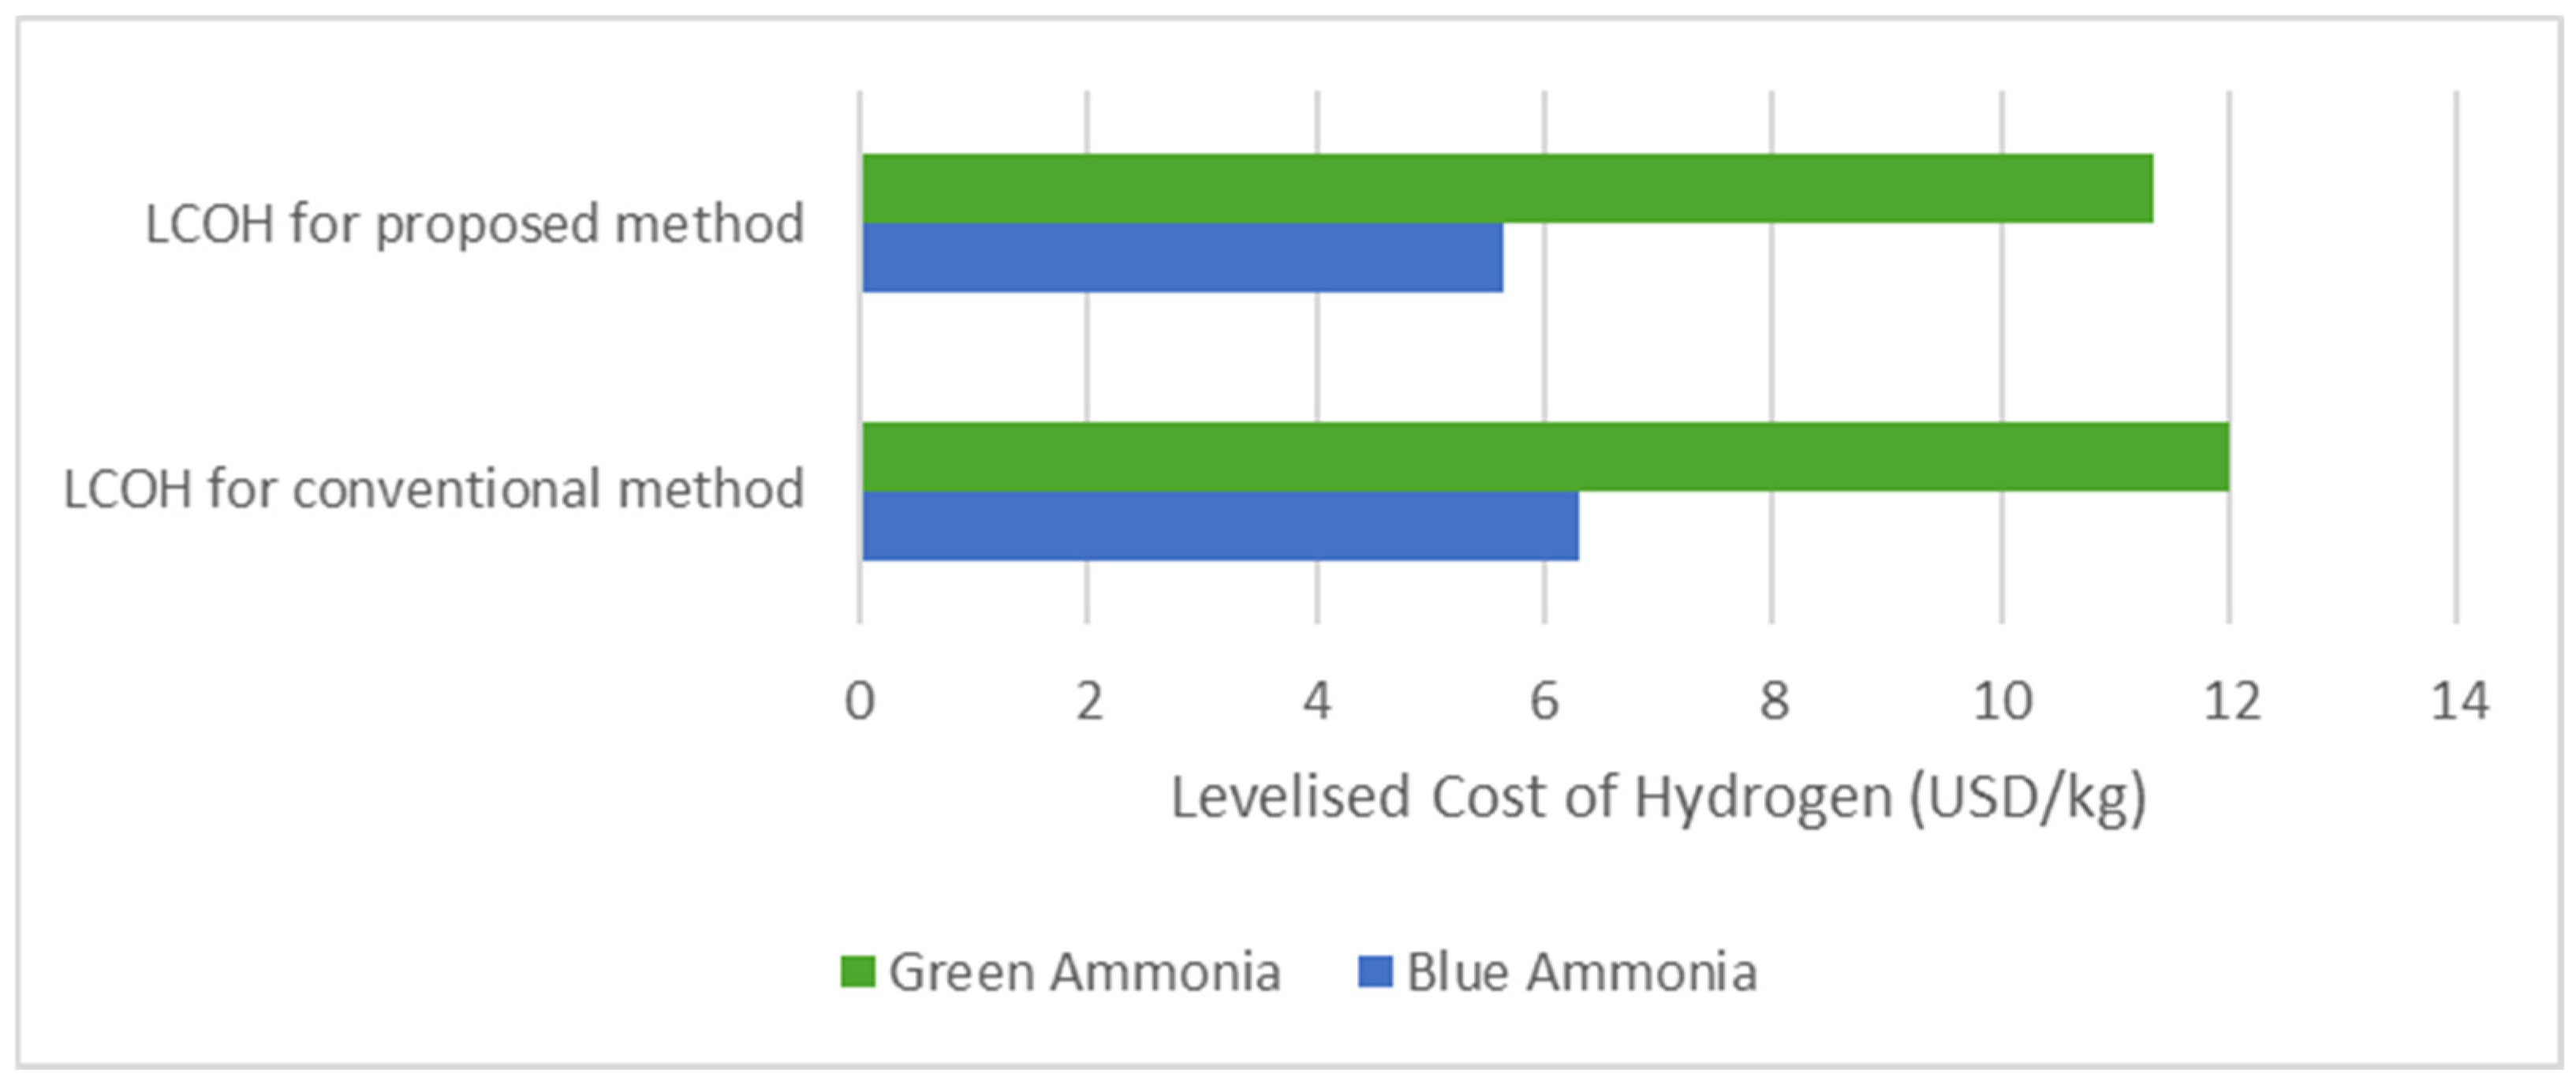
| LCOH/kg | 5.64 | 6.31 |
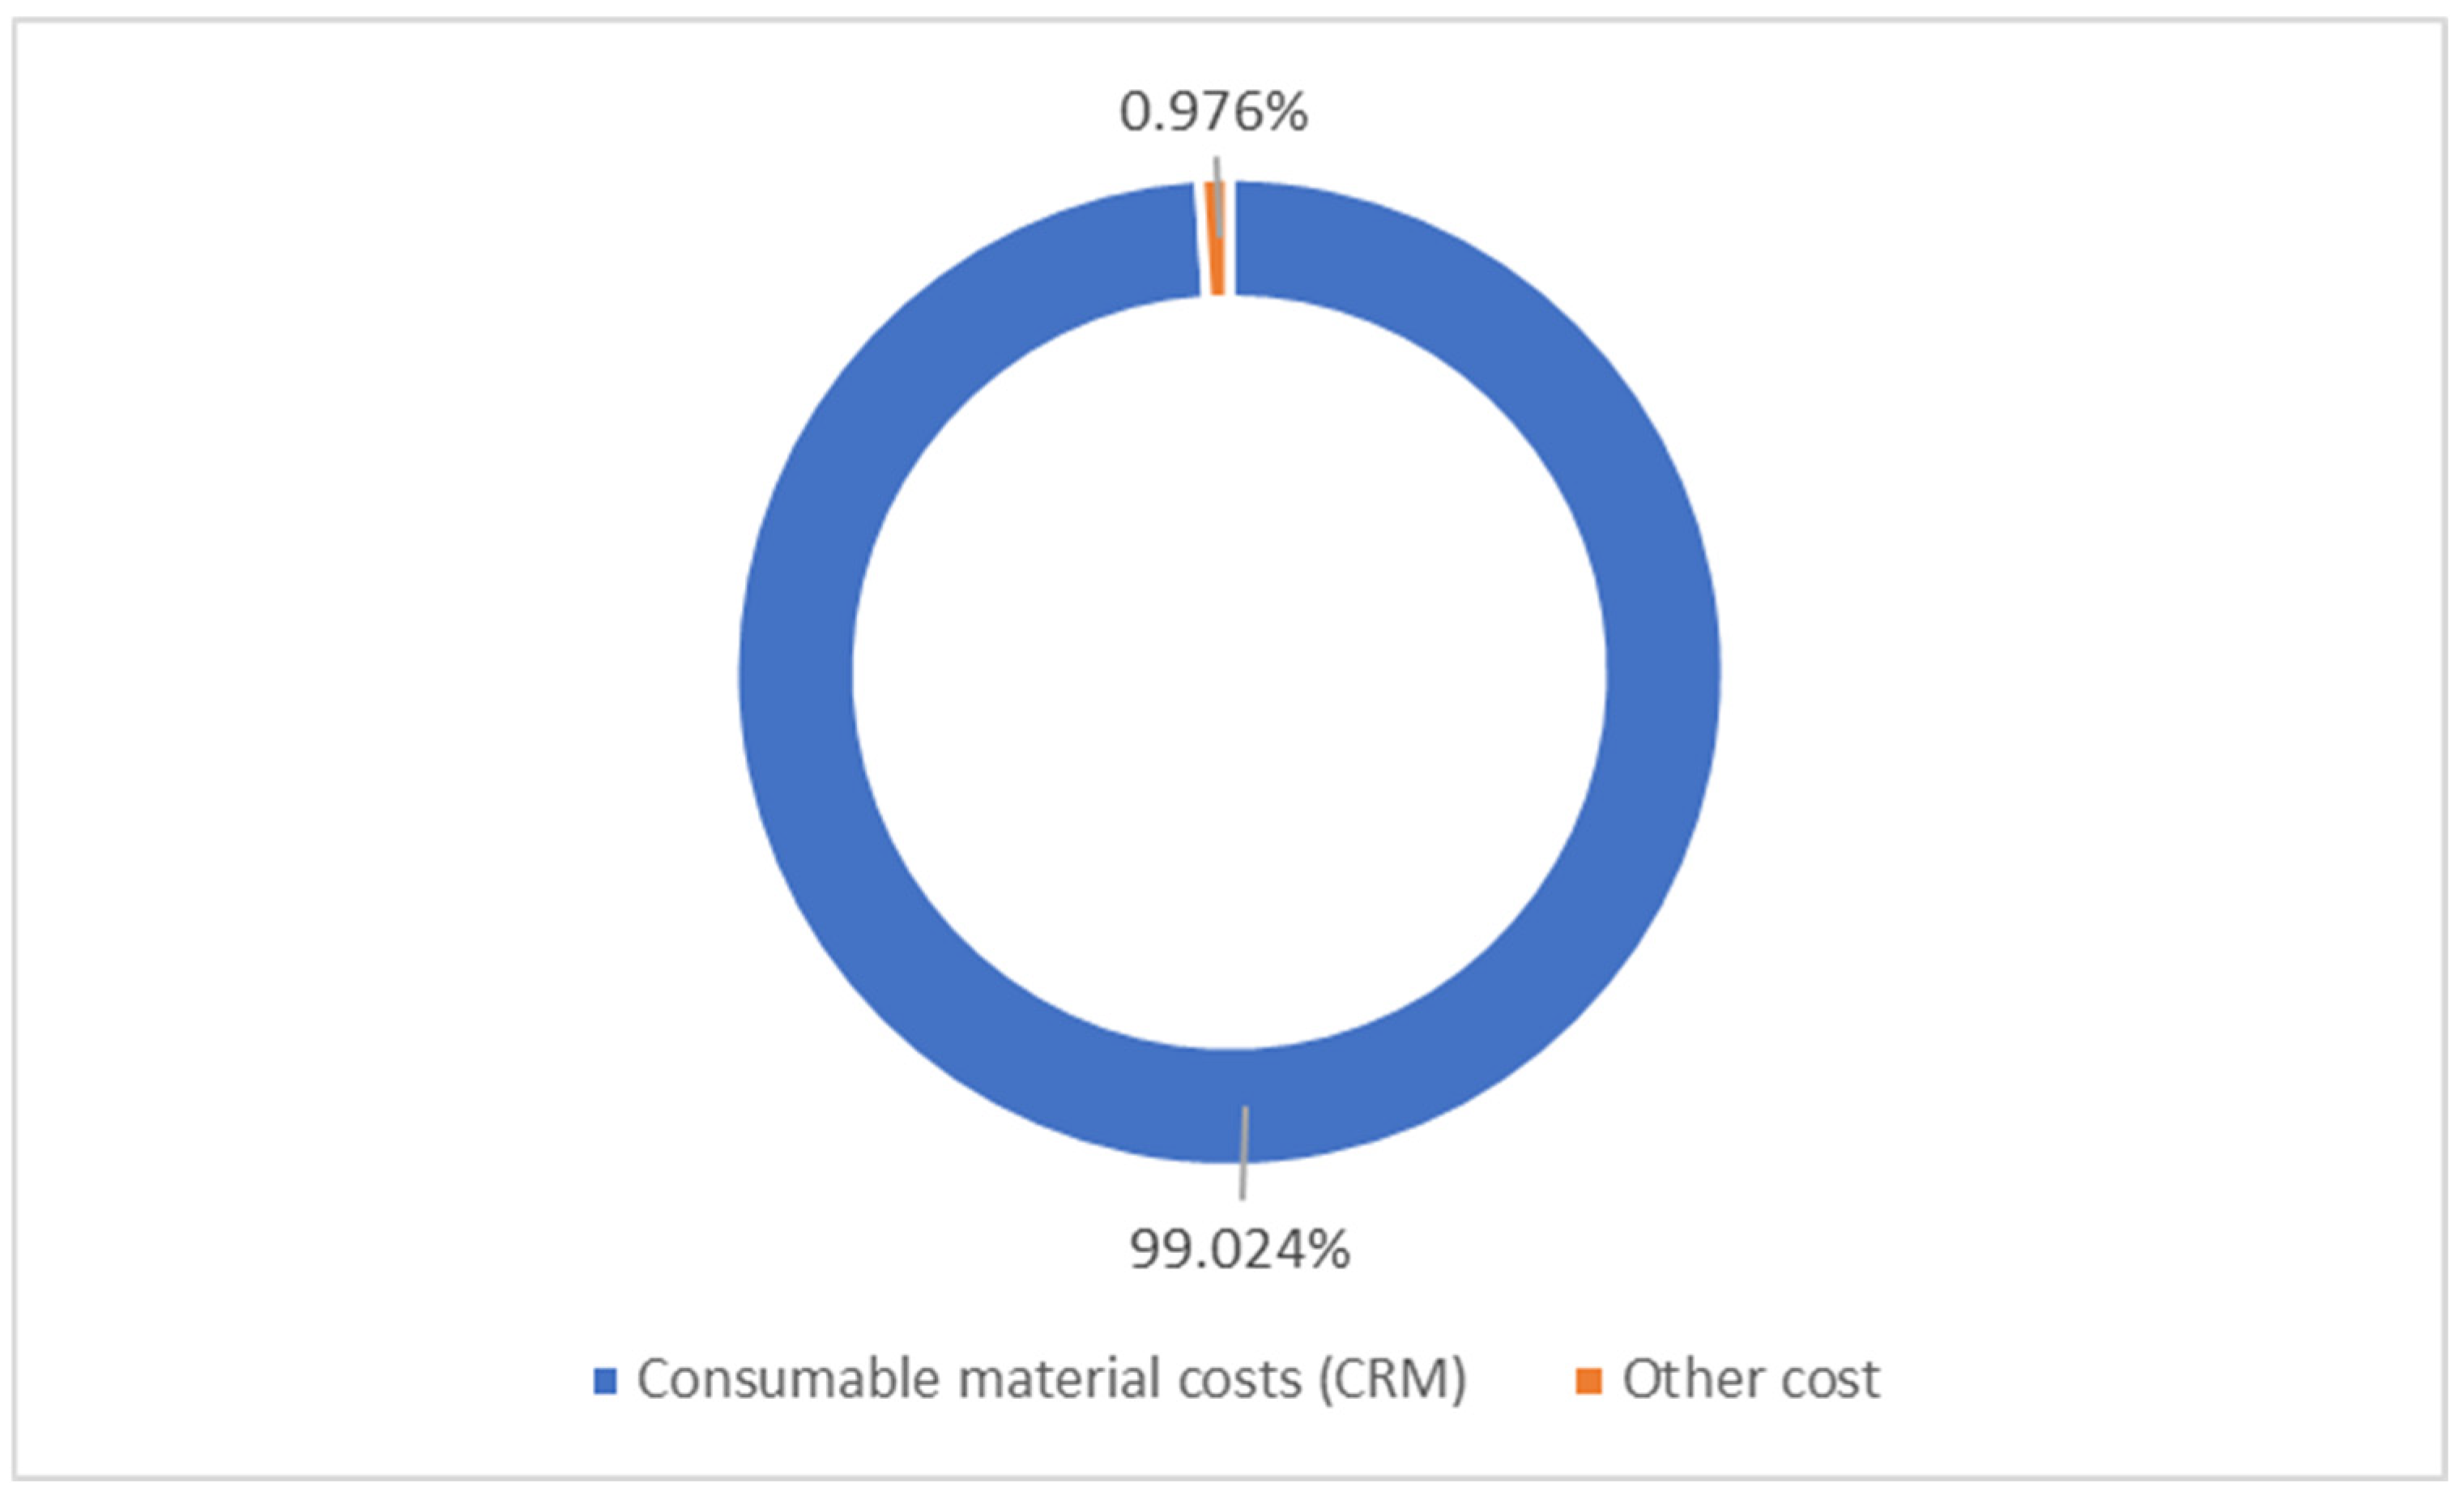
| Manufacturing Costs | Cost, USD/Year | ||
|---|---|---|---|
| Ammonia Reactor with Waste Heat Recovery | Conventional Ammonia Reactor | ||
| Direct production costs | |||
| Consumable material costs (CRM) | 1 X CRM | 7,294,090,000 | 7,294,090,000 |
| Operating labour cost (CL) | 1 X CL | 466,667 | 466,667 |
| Direct supervision cost (CS) | 0.15 X CL | 70,000 | 70,000 |
| Utilities (CU) | 1 X CU | 50,129,959 | 835,452,784 |
| Maintenance (CM) | 0.06 X FCI | 5,362,411 | 24,259,624 |
| Total direct production | CRM + 1.15 CL + CU + 0.06 FCI | 7,350,119,037 | 8,154,339,075 |
| Fixed Charges | |||
| Local taxes (CLT) | 0.025 X FCI | 2,234,338 | 10,108,177 |
| Insurance (CI) | 0.007 X FCI | 62,561 | 2,830,290 |
| Financing (CF) | 0.1 X TCI | 10,326,095 | 64,550,438 |
| Plant overhead costs | 0.6325 CL + 0.033 FCI | 3,244,493 | 13,637,960 |
| Total operating expenditure (OPEX) | CRM + 1.7825 CL + CU + 0.125 FCI + 0.1 TCI | 7,365,986,525 | 8,245,465,939 |
| Reactor with Furnace | Reactor with Heat Recovery | |||
|---|---|---|---|---|
| Inlet Stream | Outlet Stream | Inlet Stream | Outlet Stream | |
| Physical Exergy (kW) | 143,694.70 | 165,299.19 | 86,929.30 | 165,299.24 |
| Chemical Exergy 1st Term (kW) | 2,654,562.56 | 1,140,393.30 | 2,654,563.55 | 1,140,393.77 |
| Chemical Exergy 2nd Term (kW) | −0.058 | −9812.748 | −0.058 | −9812.75 |
| Total Chemical Exergy (kW) | 2,654,562.50 | 1,130,580.55 | 2,654,563.50 | 1,130,581.01 |
| Total Exergy (kW) | 2,798,257.20 | 1,295,879.74 | 2,741,492.79 | 1,295,880.26 |
| Exergy Efficiency | 46.3% | 47.3% | ||
| Exergy Destruction (kW) | 1,502,377.46 | 1,445,612.54 | ||
Disclaimer/Publisher’s Note: The statements, opinions and data contained in all publications are solely those of the individual author(s) and contributor(s) and not of MDPI and/or the editor(s). MDPI and/or the editor(s) disclaim responsibility for any injury to people or property resulting from any ideas, methods, instructions or products referred to in the content. |
© 2025 by the authors. Licensee MDPI, Basel, Switzerland. This article is an open access article distributed under the terms and conditions of the Creative Commons Attribution (CC BY) license (https://creativecommons.org/licenses/by/4.0/).
Share and Cite
Lim, J.T.; Ng, E.Y.-K.; Ong, H.X. Techno-Economic Analysis of Onsite Sustainable Hydrogen Production via Ammonia Decomposition with Heat Recovery System. Sustainability 2025, 17, 5399. https://doi.org/10.3390/su17125399
Lim JT, Ng EY-K, Ong HX. Techno-Economic Analysis of Onsite Sustainable Hydrogen Production via Ammonia Decomposition with Heat Recovery System. Sustainability. 2025; 17(12):5399. https://doi.org/10.3390/su17125399
Chicago/Turabian StyleLim, Jian Tiong, Eddie Yin-Kwee Ng, and Hong Xun Ong. 2025. "Techno-Economic Analysis of Onsite Sustainable Hydrogen Production via Ammonia Decomposition with Heat Recovery System" Sustainability 17, no. 12: 5399. https://doi.org/10.3390/su17125399
APA StyleLim, J. T., Ng, E. Y.-K., & Ong, H. X. (2025). Techno-Economic Analysis of Onsite Sustainable Hydrogen Production via Ammonia Decomposition with Heat Recovery System. Sustainability, 17(12), 5399. https://doi.org/10.3390/su17125399