Abstract
As the demand for sustainable heating, ventilation, and air conditioning (HVAC) solutions rises, ground source heat pumps (GSHPs) offer high efficiency but are sensitive to subsurface thermal dynamics. The overall objective of this study is to evaluate the impact of ground temperature variations on GSHP performance by proposing a semi-analytical dynamic model capable of simulating medium- to long-term heat pump operations. The proposed model accounts for the interactions between the ground heat exchanger (GHE) and the heat pump. A case study using the proposed model demonstrates how ground temperature variations from external factors affect the coefficient of performance (COP) and the heating and cooling capacity of GSHP systems. For ±5 °C ground shifts, the heating capacity falls below peak demand if the subsurface temperature drops by more than 2 °C, requiring supplemental heating. Peak cooling and capacity vary by less than 1% and 3% for every unit of ground temperature change (°C), respectively. These results quantify both the resilience and limits of GSHP sustainability under realistic thermal disturbances.
1. Introduction
In recent years, the need for sustainable and efficient HVAC systems has intensified as societies confront concerns of climate change and energy conservation. GSHPs are among renewable energy technologies that can significantly address these concerns. It is suggested that the widespread adoption of GSHPs in about 70% of U.S. buildings, combined with enhancements to building envelopes, could prevent the emission of 7 Gt of CO2-equivalent gases by 2050 [1].
Despite the promising potential of GSHP systems, their widespread adoption remains limited partially due to concerns over long-term performance, especially in varying underground thermal conditions, as the performance of GSHPs is significantly influenced by temperature variations in the ground during their operation [2,3,4]. As climate patterns shift and urbanization intensifies, ground temperatures are increasingly affected by external influences such as neighboring systems, urban heat islands, and land-use changes [2,4]. Zhu et al. [5] indicate that urban heat islands and climate change have contributed to elevated subsurface temperatures in central areas of cities, like Cologne and Winnipeg, with warming trends reaching up to 5 °C. Another case study shows a temperature decrease of around 4 °C near boreholes after 10 years of operation, driven by thermal interference from neighboring boreholes [6]. These evolving subsurface conditions introduce uncertainty into the design and operation of GSHP systems, as substantial fluctuations in underground temperatures can detrimentally impact the COP of the heat pump, diminish its heating and/or cooling capacity, or potentially lead to operational shutdowns, ultimately compromising the sustainability of the system. Yet, existing research has not sufficiently assessed how these ground temperature dynamics impact heat pump performance over the entire duration of the system operation. Addressing this gap is vital for ensuring the reliability, efficiency, and sustainability of GSHP installations over their operational lifespan. Consequently, the goal of this study is to address the need for robust integrated heat pump and ground heat exchanger models that can dynamically assess system performance under realistic, time-dependent thermal disturbances.
To assess the long-term sustainability of GSHP systems in the presence of ground temperature fluctuations, a dynamic GSHP model is required, as it allows for the analysis of how key system parameters—such as GHE running fluid temperature, heat pump capacity, and COP—change over time, reflecting the transient nature of the GSHP operation. This capability to capture time-dependent variations is what defines the model as “dynamic”.
The GHE can be modeled either numerically or analytically. Due to their high computational demands compared with analytical models, numerical models are primarily suitable for short-term simulations of GSHP operations. Analytical models of GHEs typically involve separate models to assess heat transfer within and around boreholes, using the borehole wall temperature as the coupling factor [2,7,8].
To analytically model the heat transfer inside the borehole, steady-state heat transfer models employ thermal resistances in boreholes to connect fluid temperature inside U-tube pipes to steady-state heat transfer rates between the pipes and the borehole wall, and the pipes themselves (thermal short circuiting). These models are categorized into one-dimensional, two-dimensional, and quasi-three-dimensional models. One-dimensional models, such as the “equivalent diameter” assumption, are investigated by various researchers [9,10,11]. Hellstrom [12] and Claesson and Hellstrom [13] introduced two-dimensional solutions using steady-state line source and multipole methods. While one- and two-dimensional models streamline calculations, they neglect the effects of axial heat flow in the GHE fluid. To address this limitation, Hellström [12] proposed two quasi-three-dimensional models, which were later refined by Zeng et al. [4]. The quasi-three-dimensional models incorporate fluid temperature variations along the borehole depth, providing a more comprehensive understanding of heat transfer dynamics in GHEs.
For simulating the ground temperature response to heat injection or extraction by GHEs, the g-function concept introduced by Eskilson [14] is used, which formulates the temperature response of the borehole wall (or any other point in the ground) to steady heat input or output within the borefield. Ingersoll and Plass [15] introduced the infinite line source (ILS) model from Kelvin’s theory [16], viewing the borehole as an infinite line source with constant heat flux. Carslaw and Jaeger [17] proposed the infinite cylindrical source (ICS) model. Both models have limited applicability for extended timescales due to ignoring axial heat transfer effects at the ground surface and the bottom end of the borehole. Zeng et al. [18] developed a finite line source (FLS) model, conceptualizing the borehole as a finite line source with the ground as a reflective plane. Initially suggested by Eskilson [14], this model assumes a constant temperature boundary at the ground surface, effectively capturing edge effects, and it is valid for medium- to long-term ground temperature responses. The borehole wall temperature serves as the linking parameter between the models for the inside and outside of the borehole. However, because the borehole wall temperature varies along the length of the borehole, the mean borehole wall temperature along its length is often used as the linking parameter [8,19,20]. The mean borehole wall temperature solution based on Zeng et al.’s FLS model involves a double integral, which is computationally expensive to solve. Several researchers [21,22,23,24] further revised this model to reduce the computational requirements for calculating the mean borehole wall temperature along its length.
The steady-state heat pump models in the literature typically fall into two main categories: curve fit models and detailed models. Curve fit models [25,26,27,28,29,30,31,32,33,34,35] rely on manufacturer catalog data to create curves representing heating and cooling capacities, heat rejection and extraction rates, COP, and input power against the entering liquid temperature (ELT) to the heat pump. However, a significant limitation of curve fit models is their poor performance or failure when operating at ELTs outside the catalog data range [30]. This is particularly important in this study, since the ground temperature variations under investigation may cause the ELT to fall outside the manufacturers’ specified range. We need such information, as it indicates the potential negative impacts of system interaction and provides a way to measure the extent of such impact. Detailed models [36,37,38,39,40,41,42,43], on the other hand, simulate the individual components of a heat pump using heat and mass transfer principles and thermodynamic relations. These models estimate parameters such as the heat transfer coefficient of heat exchangers, superheating and subcooling at the evaporator and condenser exits, and the displacement rate of the compressor to produce results comparable to manufacturer data.
More recently, hybrid physics and data-driven modeling approaches (HPDM)—including physics-informed neural networks and physics-guided surrogate models—have been developed for air source heat pump systems to improve prediction accuracy and generalizability across a wide range of operating conditions [44]. While promising, these methods typically require extensive, high-quality training datasets and may still extrapolate poorly outside the training range. Consequently, studies aiming to evaluate heat pump performance outside the design range—such as Gabrielli et al. [45]—or in situations where ELTs may fall outside the manufacturer’s specified range (such as the present study) may derive limited benefit from such models.
The on–off cycling of the heat pump negatively affects its performance. Part-load fraction (PLF) models [46,47] are used to account for this negative effect on the heat pump COP, which is the ratio of part-load COP to full-load COP [30].
Several studies in the literature have proposed dynamic models for GSHP systems [2,3,48,49,50,51,52,53,54,55]. While existing studies offer valuable insights into GSHP system modeling, gaps remain in key aspects of their dynamic models. Some of the models simplify critical aspects, such as the influence of fluid temperature variation along the borehole and thermal interference between U-tube legs, by employing one-dimensional (1D) GHE models for heat transfer inside the borehole [3,53,55]. Furthermore, they often neglect on–off cycling behavior, which can impact system performance [2,3,48,51,52,53,54,55]. Additionally, some of the existing approaches are often constrained by computational limitations because of using numerical methods for modeling heat transfer inside and/or outside of the borehole(s), restricting their applicability to medium- to long-term simulations [3,49,50,51,54,55,56]. Full three-dimensional (3D) numerical simulations, in particular, require fine spatial and temporal discretization, resulting in substantial computational costs. This is partly due to the small size of the system and the large size of the solution domain due to the long-term simulation of the system. In contrast, semi-analytical models offer comparable accuracy in predicting ground temperature and GHE outlet fluid temperature while significantly reducing computation time. Recent comparative studies demonstrate that hybrid models incorporating the finite line source (FLS) method can execute over 100,000 times faster than equivalent numerical simulations, without compromising accuracy for design-level analyses [57].
Moreover, the effect of ground temperature variations on both the COP and the heating/cooling capacities of the GSHP remains underexplored in the literature. While some studies [2,3,48,49,50,51,52] have examined the impact of temperature variations on the COP, they overlook the corresponding effects on the heating and cooling capacities of the heat pump—key factors for system design and operation. In addition, most of the studies [3,48,49,50,51,52,53] only consider ground temperature changes caused by the heat pump operation itself, neglecting external influences such as adjacent systems, climate change, or other factors. Considering these effects is crucial for assessing the long-term sustainability and efficiency of GSHP systems.
The main contributions of this work lie in the following aspects:
- This study introduces a semi-analytical dynamic model for GSHP systems that is suitable for medium- to long-term simulations. The model accurately captures the dynamic interactions between building loads, a detailed heat pump model, and an analytically modeled GHE. It accounts for essential factors that are often overlooked in existing models, including on–off cycling of the heat pump, temperature variations along the GHE borehole length, and thermal short circuiting between U-tube legs.
- This work evaluates the impact of ground temperature variations—caused by both heat pump operation and external factors—on GSHP system performance, including heating and cooling capacities as well as COP. This comprehensive assessment addresses critical gaps in prior studies by considering a broader range of influencing factors.
Table 1 highlights the distinctions between the proposed model and existing ones, as well as the focus on analyzing the effect of ground temperature fluctuations on GSHP systems.

Table 1.
Comparison of reviewed dynamic ground source heat pump models from the literature with the proposed model in this study (GTC: ground temperature change; FLS: finite line source; ILS: infinite line source; ICS: infinite cylindrical source; DST: Duct Heat Storage Model implemented as component type 557 in TRNSYS Versions 16 and 17 [58]). “✓” indicates that the feature is included; “-“ indicates that it is not included or not applicable.
2. Methodology
The model of the GSHP comprises a dynamic heat pump model (as described in Section 1) and a GHE model. These models are coupled via the ELT to the heat pump, which is the returning GHE running fluid temperature, to the heat pump. The heat pump model utilizes the ELT to determine the heating (or cooling) capacity, the rate of ground heat extraction (or injection), and the heat pump COP. Given the rate of heat rejection or extraction to and from the ground, the borehole wall temperature is determined using the model for outside the borehole [2]. The running fluid temperature within the GHE—especially at the inlet and outlet—can then be obtained using the model for inside the borehole and the known borehole wall temperature [2].
2.1. Heat Pump Model
In this study, detailed modeling of the heat pump, rather than curve-fitting methods, is used because the ground temperature variations that are being examined may cause the ELT to fall outside the range of manufacturers’ data. The heat pump model comprises a reciprocating compressor, an expansion valve, and two heat exchangers: one for transferring heat between GHE running fluid and heat pump refrigerant, referred to as liquid-to-refrigerant (LTR), and the other for transferring heat between the building indoor air and refrigerant, referred to as air-to-refrigerant (ATR). The specific function of each heat exchanger depends on the operational mode of the heat pump; i.e., heating or cooling mode. In cooling mode, the ATR heat exchanger functions as an evaporator, extracting heat from the indoor air. Simultaneously, the LTR heat exchanger functions as a condenser, releasing heat to the fluid in the ground loop. In heating mode, this process is reversed. Figure 1 illustrates the thermal cycle of the heat pump, with refrigerant flow directions corresponding to heating mode. The numbering used for refrigerant flow—1 to 4—refers to the exits of the expansion valve, evaporator, compressor, and condenser, respectively, and is used consistently in the equations throughout this paper.
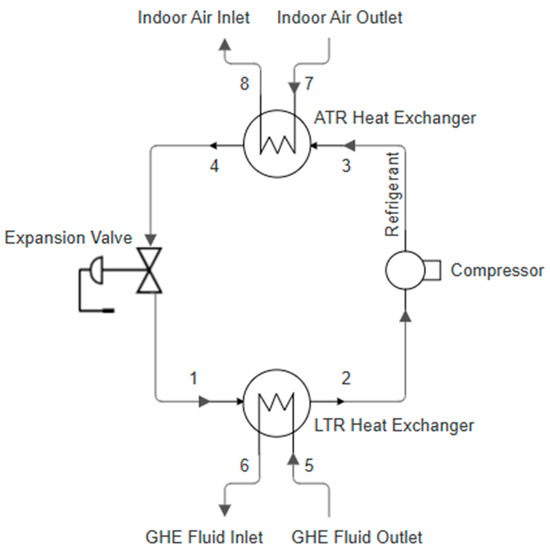
Figure 1.
Schematic of the heat pump thermal cycle (ATR: air to refrigerant, LTR: liquid to refrigerant).
The modeling of the heat exchangers follows the approach described by Nellis and Klein [59] in which the heat exchangers are segmented into multiple discrete sections, each representing different thermal regimes, and the effectiveness-NTU method is applied to each sub-heat exchanger. The total heat transfer rate of the evaporator and condenser can be calculated as the sum of the heat transfer rates from the different thermal regions.
The compressor is modeled as a reciprocating type based on the method described by Jahnig et al. [60]. The refrigerant mass flow rate can be calculated as:
where [m3/s] and represent the displacement rate of the compressor and the specific volume of the refrigerant at the inlet of the compressor, respectively, and is the compressor volumetric efficiency and accounts for deviations from a constant volumetric flow rate.
The input power to the compressor, , can be calculated using Equation (2) as follows:
where is the ratio of specific heat at constant pressure, , and volume, , is the suction pressure, is the specific volume of the refrigerant at the suction of the compressor, represents the condenser pressure, and is the combined mechanical efficiency of the compressor and motor. The specific enthalpy of the refrigerant at the compressor outlet can be determined using Equation (3) as follows:
where is the specific enthalpy of the refrigerant at the compressor inlet. The expansion valve is considered adiabatic, and the specific enthalpy of the refrigerant remains constant as it passes through the valve.
It should be noted that the current model does not explicitly account for thermal or dynamic lags associated with refrigerant-side transients, such as refrigerant inertia or the thermal response time of internal heat exchanger surfaces. Instead, the heat pump is modeled using a steady-state thermodynamic cycle that is recalculated at each simulation time step, while the effects of on–off cycling are incorporated through a part-load fraction (PLF) model, as described in Section 2.3. This modeling approach is well suited for the medium- to long-term simulation objectives of this study, where system performance evolves over hours to years and the impact of short-term transient effects is negligible. Although the inclusion of dynamic lags would be important for short-term operational analysis or control strategy optimization, as evidenced by Li and Alleyne’s dynamic VCC model resolving refrigerant-side transient effects during compressor start-up and shut-down [61] and by Qiao et al.’s transient modeling of a multi-evaporator air conditioning system for control method investigation [62], their exclusion has minimal effect on the accuracy of the long-term performance predictions, which are the primary focus of this work.
2.2. Ground Heat Exchanger Model
To model temperature variations in the GHE circulating fluid and the surrounding ground due to heat delivery or extraction, analytical models for heat transfer both inside and outside the borehole are integrated using the borehole wall temperature as a key parameter. This integration is essential because the temperature at the borehole wall governs the interaction between the ground heat exchanger and the surrounding ground.
The GHE simulations cover different time scales based on the borehole radius characteristic time, , where denotes the borehole radius and represents the thermal diffusivity of the grouting material. This characteristic time represents the time scale over which the heat transfer processes within the borehole reach a quasi-steady state relative to the size of the borehole [63,64]. Short-term simulations (, in the order of minutes to hours) provide insights for optimizing system control and operation, while medium- to long-term simulations (, in the order of hours to years) are crucial for assessing the design, overall viability, and performance of the system [64]. In short-term scenarios, the thermal capacity of the grout material has a significant impact on the transient heat conduction within the borehole, as modeled by various scholars [65,66,67,68,69,70]. However, in medium- to long-term simulations, heat transfer inside the borehole can be assumed to be in a steady-state mode, allowing the heat capacity of the grout material and the GHE fluid to be neglected. In this study, the focus is on assessing the performance and sustainability of the GSHP system over medium- to long-time scales. For this purpose, a steady-state long-term model is sufficient for analyzing the borehole interior. Specifically, the quasi-three-dimensional model proposed by Zeng et al. [4] is employed, which accounts for fluid temperature variations in the downward and upward tubes, as well as thermal short circuiting between them.
To capture the ground temperature response over medium- to long-time scales, a finite line source (FLS) model is utilized to model the heat transfer outside the borehole. Figure 2 shows the time scales during which the infinite line source, infinite cylindrical source, and finite line source models are valid. The infinite line source and cylindrical source models are applicable for short- to medium-time scales (), while FLS models are appropriate for medium-time scales () and long-time scales () [64,71,72]. Here, represents the borefield characteristic time, with and denoting the borehole length and the ground thermal diffusivity, respectively. Consequently, the infinite line source and infinite cylindrical source models are not suitable for medium- to long-time scale simulations.

Figure 2.
Regions of validity for different analytical models for outside the borehole: infinite line source, infinite cylindrical source, and finite line source models [64,71,72].
In this study, the FLS solution proposed by Claesson and Javed [24] is utilized, assuming that the GHE does not consist of a large number of closely spaced boreholes. This model provides the ground step response function (g-function) for both single and multiple boreholes. Their solution is simpler and more computationally efficient compared to other previously proposed FLS models [18,21,22]. For example, a GHE was simulated using Zeng et al.’s FLS model [18] to calculate the mid-point borehole wall temperature and Claesson and Javed’s model [24] to calculate the mean borehole wall temperature. The results showed that Zeng et al.’s model required approximately 5.4 times more computational time. It should be emphasized that computing the mean borehole wall temperature using Zeng et al.’s model would take even more time since it requires integration along the borehole depth, whereas Claesson and Javed’s model provides the mean temperature explicitly. It is important to note that this and earlier FLS solutions [18,21,22,23,24] may overestimate the g-function derived by Eskilson [14] when applied to a large number of densely packed boreholes, particularly for time scales greater than approximately [72,73]. For such cases, the FLS solution proposed by Cimmino and Bernier [72] can be used, although it increases the computational time by a factor of 144 [74]. To account for variable heat rejection or extraction rates from the boreholes, temporal superposition of the step response function (g-function) is applied, as described by Koohi-Fayegh and Rosen [2].
Although the present study focuses on a single-borehole configuration, the proposed modeling framework is inherently adaptable to multiple interacting boreholes, as commonly encountered in commercial or district-scale systems. The outside-borehole thermal model, based on the FLS formulation by Claesson and Javed [24], enables the calculation of ground thermal response functions for arbitrary multi-borehole configurations by applying the principle of superposition to account for thermal interactions among boreholes (see Ref. [24] for further details). This capability allows the model to capture borehole-to-borehole interference effects in both regular and irregular geometries. In parallel, the inside-borehole model developed by Zeng et al. [4] can be applied individually to each borehole to simulate axial fluid temperature variations and thermal short circuiting between the U-tube legs.
Several assumptions are made to streamline the analytical modeling process as follows:
- -
- Natural convection, moisture flow, groundwater flow, and freezing are neglected.
- -
- The ground is treated as a homogeneous semi-infinite medium.
- -
- The ground is assumed to have a uniform initial temperature.
- -
- The thermophysical properties of the ground are assumed constant regardless of temperature changes.
- -
- Thermal contact resistance between the grout and ground is considered negligible.
- -
- In the model for outside the borehole, the radial dimension of the borehole is neglected.
- -
- In the model for inside the borehole, axial heat conduction is neglected.
- -
- A constant temperature is assumed at the ground surface throughout the considered period, representing an isothermal boundary condition.
These simplifications are widely adopted in analytical GSHP modeling [2,7,64], particularly for preliminary design and long-term performance evaluation. As noted by Li and Lai [64], such assumptions are fundamental to many semi-analytical models due to their computational efficiency and the dominance of conductive heat transfer in most practical applications. In particular, in low-permeability ground—such as clay-rich formations—conduction is the primary mode of heat transfer, and the effects of advection or moisture migration are minimal. The influence of groundwater flow can be significant in high-permeability formations—and neglecting it may under- or over-predict seasonal recovery rates (the fraction of heat recharged during the off-season). Numerical simulations show that a Darcy velocity of 1 m/year (≈0.0027 m/day) can shift the thermal plume by nearly 2 °C over 15 years and raise circulating fluid temperatures by up to 1.98 °C compared to no-flow cases, leading to over-predicted recovery if ignored [75]. For example, beneath Edmonton, Alberta—where Quaternary tills and lacustrine clays extend to a ~200 m depth [76]—effective Darcy velocities are <0.0001 m/day; therefore, advective effects alter seasonal recovery by less than 5% for 100–200 m boreholes. The effect of groundwater is often ignored in analytical solutions or treated using simplified assumptions (e.g., homogeneous horizontal flow), as its precise characterization is both complex and site-specific. An accurate representation of groundwater flow requires fully numerical approaches [71]. Similarly, moisture migration and natural convection are rarely included in analytical solutions due to the limited availability of field data and the high complexity of coupled heat and mass transfer mechanisms. Yet, increasing moisture content from dry to 5–10% can boost ground thermal conductivity significantly and raise diffusivity by up to 2–3 times the dry value [64]. Freezing effects around the borehole are also neglected. As Li and Lai [64] point out, under typical GSHP operating conditions, ground or groundwater phase change plays a much smaller role in thermal resistance than moisture migration. Analytical models that account for freezing impose restrictive conditions—uniform pore-size distributions, complete saturation, or high-porosity aquifers—that rarely reflect field installations. Furthermore, design standards (e.g., Canadian GeoExchange Coalition guidelines [77]) mandate circulating fluid temperatures above −4 °C, which effectively prevents freezing of the surrounding ground or grout and limits its impact on long-term system performance.
The assumption of a homogeneous semi-infinite ground is generally acceptable for preliminary design in locations with uniform geology. However, when the ground consists of strongly contrasting layers (e.g., clay over rock or saturated versus unsaturated strata), the mean borehole wall temperature and heat transfer predictions can deviate from reality. Raymond et al. [78] have shown that under such conditions, fully numerical models offer better accuracy. Therefore, the current model is most applicable in geologies with limited vertical variability in thermal properties.
It should also be noted that the proposed GHE model is tailored to vertical ground heat exchangers and is not directly applicable to horizontal loop configurations or energy piles without modification. However, recent studies have demonstrated that line source models can be adapted for horizontal GHEs, yielding results comparable to 2D numerical simulations in homogeneous ground [79]. Nonetheless, horizontal GHEs exhibit different heat transfer characteristics due to shallow burial depths and variable conditions at the ground surface (e.g., ambient weather). Therefore, adapting this model to horizontal GHEs would require major reformulations, particularly in the boundary conditions and geometry of heat transfer.
For vertical GHEs, short-term surface weather fluctuations—including extreme events—have minimal effect on deep ground temperatures due to the substantial thermal inertia of the subsurface, particularly at depths beyond 10 m [71]. As a result, the proposed model remains robust under a wide range of typical and extreme surface climate conditions. In contrast, extreme long-term changes—such as gradual subsurface warming driven by urban heat islands, climate change, and/or persistent thermal interference from nearby systems—can meaningfully alter ground thermal behavior. These effects can be effectively incorporated into the model by adjusting the ground temperature, as demonstrated in the case study scenarios with ±5 °C ground temperature shifts presented in Section 6.
In this study, the analytical models for inside and outside the borehole are coupled using the mean borehole wall temperature along its length, following the model coupling approach presented by Koohi-Fayegh and Rosen [2,80]. While the coupling method is the same, this study differs in its implementation of the FLS model. Koohi-Fayegh and Rosen [2] used the borehole wall temperature at the mid-point of the borehole, calculated with the FLS model by Zeng et al. [18], as a good estimate of the mean temperature for model coupling. In contrast, this study directly calculates the mean borehole wall temperature using the model proposed by Claesson and Javed [24], which eliminates the approximation and reduces the computational cost.
2.3. Dynamic Ground Source Heat Pump Simulation
The dynamic simulation framework is summarized in Figure 3. At each time step, the states of key points at the heat pump cycle are determined based on iterations of initial guesses for the saturated temperatures at the condenser and evaporator and specified subcooling and superheating values.
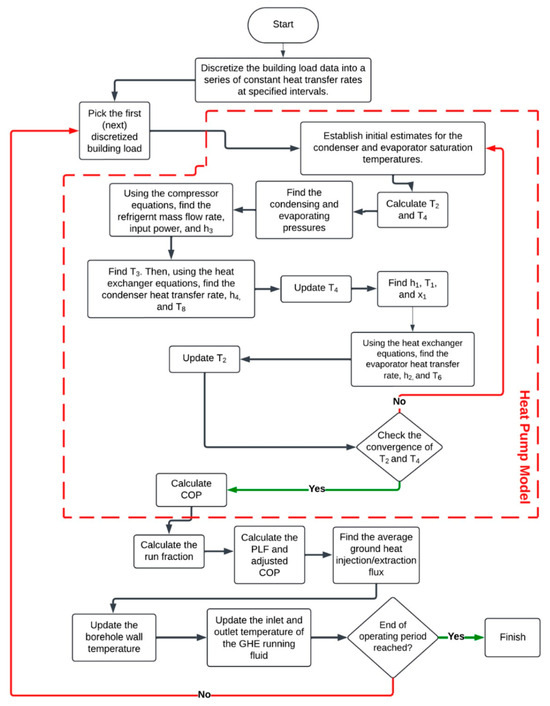
Figure 3.
Flowchart of ground source heat pump dynamic simulation.
Following convergence to the state points, the COP of the heat pump is determined using the respective equations for heating and cooling modes, as shown in Equation (4) as follows:
The varying building load is approximated (i.e., discretized) by a series of constant loads, denoted as , which are the average or maximum loads in each time interval (see Section 4 for further discussion). These rates are applied at , changing after time intervals . The subscript indicates that the parameter corresponds to the time step .
To determine the duration the heat pump needs to operate to meet the required building load during the time interval , the run fraction (RF) of the heat pump is calculated using Equation (5) as follows:
where indicates a heating load, while signifies a cooling load.
The total amount of time the heat pump must operate within each time interval can be obtained using Equation (6) as follows:
To account for the negative impact of on–off cycling on the performance of the heat pump, the part-load fraction (PLF), defined as the ratio of part-load COP to full-load COP, can be obtained iteratively using the model presented in the study by Henderson and Rengarajan [47]. This model requires a time constant and a maximum cycling rate, which are considered to be 60 s and 2.5, respectively, as recommended by Henderson et al. [81] for typical conditions. In the study by Biglarian et al. [50], a third-order polynomial trendline was fitted to the results obtained from the PLF iterative formula with the specified time constant and maximum cycling rate. The regression equation gives the PLF as a function of the run fraction, as shown in Equation (7) as follows:
The PLF and run fraction have a direct correlation; a higher run fraction results in a higher PLF, and vice versa. Using the PLF, the adjusted COP can be obtained from Equation (8), incorporating the negative effects of cycling as follows:
The on–off cycling of the heat pump results in a series of pulse heat injection or extraction fluxes to and from the ground within each time interval , as shown in Figure 4. Because of the steady-state heat conduction assumption within the borehole, in this study, the average heat injection/extraction per unit length of the borehole during each time interval is utilized to capture the ground temperature response. This average rate can be calculated using Equation (9) as follows:
where is the ground heat injection/extraction per unit length of the borehole, which can be calculated using Equation (10) as follows:
where is the total borehole length. In Equation (10), it is assumed that there is no heat loss in the LTR heat exchanger, and heat is fully transferred between the refrigerant and the ground loop running fluid.
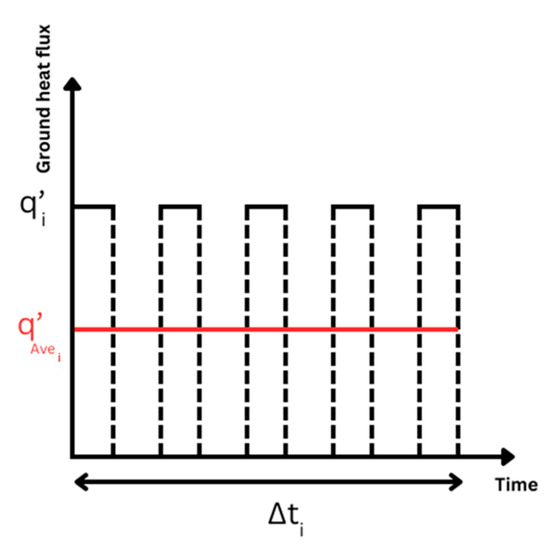
Figure 4.
Heat injection/extraction per unit length of the borehole to and from the ground and its average during each time interval.
Using the undisturbed ground temperature and the average ground heat injection/extraction flux calculated in the previous step, the borehole wall temperature is updated using the model for outside the borehole (see Section 2.2). The inlet and outlet temperature of the GHE running fluid is calculated and updated based on the updated borehole wall temperature using the model for inside the borehole (see Section 2.2). This process is repeated for each .
3. Model Validation
3.1. Ground Model Validation
To validate the GHE models, the results from the numerical simulation by Koohi-Fayegh and Rosen [2] are used to assess the GHE analytical model developed in this study.
Koohi-Fayegh and Rosen [2] considered a sinusoidal ground load, performed semi-analytical and numerical simulations of a GHE, and obtained the transient temperatures of the borehole wall and the inlet and outlet running fluid over one year of operation. They used their numerical model to validate a GHE analytical model, which differs from the model used in this study in how the mean borehole wall temperature along the borehole length is treated. While they approximated the mean borehole wall temperature using the temperature at the mid-length of the borehole, in this study, the mean borehole wall temperature is calculated directly. A comparison of the analytical results from the model proposed in this study with the numerical results from Koohi-Fayegh and Rosen [2] is shown in Figure 5. The analytical results align closely with the numerical solution, indicating that the GHE analytical model is valid.
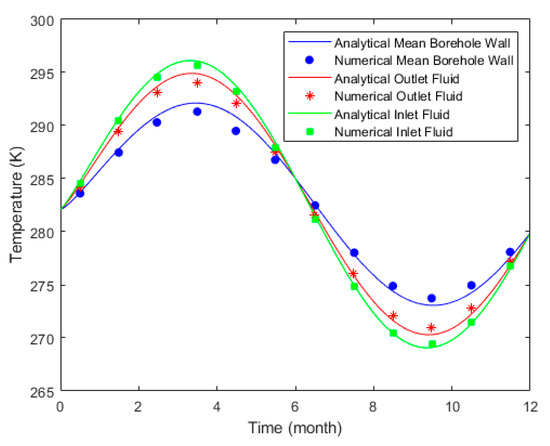
Figure 5.
Comparison of borehole wall and inlet/outlet running fluid temperatures between the analytical solution from this study and a numerical study by Koohi-Fayegh and Rosen [2].
3.2. Heat Pump Modeling and Validation
To examine the effect of temperature fluctuations in the ground on the long-term performance of the GSHP, a model for a heat pump that is sized to the heating and cooling loads is needed. For the given type and geometry of the heat exchangers, the subcooling and superheating at the condenser and evaporator exits, the saturated temperatures of the condenser and evaporator (see Table 2), compressor properties (e.g., displacement rate, clearance volume ratio, suction pressure drop ratio, and combined efficiency), and the condenser and evaporator heat transfer areas (see Table 3) are selected or calculated in an iterative procedure (see Figure 6).

Table 2.
Properties of the modeled heat pump in cooling and heating modes at its rated conditions (in accordance with AHRI/ASHRAE ISO Standard 13256-1 [82]).

Table 3.
Specifications of the modeled heat pump.
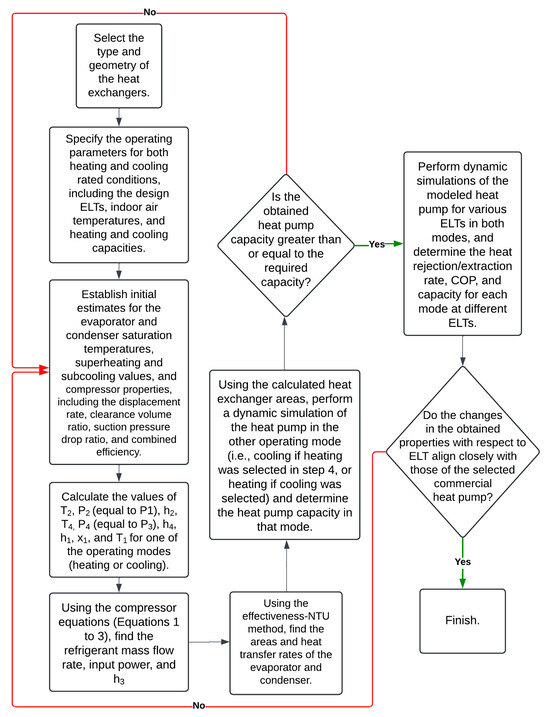
Figure 6.
Flowchart of the design and validation of the heat pump model.
To validate the design, manufacturer data from a commercial heat pump is used (refer to Table 4 for the technical details of the commercial heat pump). Dynamic simulations of the heat pump are conducted across different ELTs for both heating and cooling modes, and the performance characteristics—such as the COP, heating/cooling capacities, and heat rejection/extraction rates—are plotted against the ELT for the modeled heat pump. These performance curves are compared with those of the commercial heat pump. The values of subcooling, superheating, and saturated temperatures are iteratively adjusted until the performance curves of the modeled and commercial heat pumps closely match. It is important to note that the dimensions of the heat exchangers and compressor characteristics may also be adjusted during the design process if convergence on heat exchanger lengths is not achieved or if curve alignment cannot be obtained. Figure 6 shows the flowchart of the design and validation of the heat pump model.

Table 4.
Technical details of the commercial heat pump.
The final properties of the modeled heat pump components, including the types of heat exchangers, their heat transfer areas, and compressor characteristics, are listed in Table 3. The variations in the COP, capacity, and heat extraction/rejection rate are compared against the ELT for both heating and cooling modes and show close alignment with the performance curves of commercial heat pumps (see Figure 7, Figure 8 and Figure 9).
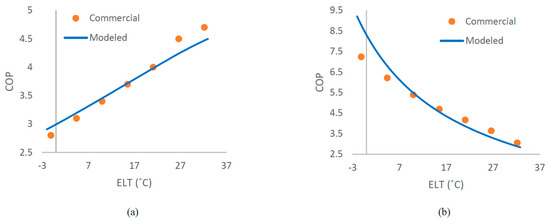
Figure 7.
Comparison of COP variation with the ELT between the modeled and commercial heat pump: (a) heating mode, (b) cooling mode.
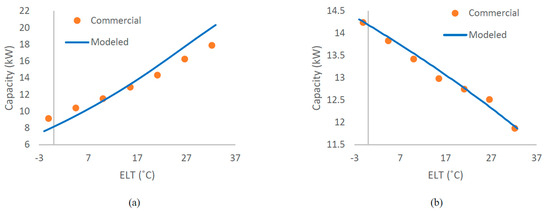
Figure 8.
Comparison of capacity variation with the ELT between the modeled and commercial heat pump: (a) heating mode, (b) cooling mode.
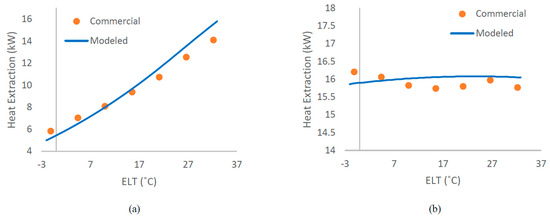
Figure 9.
Comparison of heat extraction/rejection variation with the ELT between the modeled and commercial heat pump: (a) heating mode, (b) cooling mode. Note: Although the study is focused on a GSHP model, the term “ground” heat extraction/rejection is not used here, as the heat pump component that is modeled is a water source heat pump that can generally extract/reject heat from/to a medium other than the ground.
4. System Design and Specifications
A case study is conducted to illustrate the system design process and assess the impact of ground temperature fluctuations on the performance of a GSHP system. This study assumes a heating-dominated building load profile that approximately follows an uneven sinusoidal pattern as the daily average, with added hourly noise to enable a more realistic building load that varies on an hourly basis (see Figure 10). The maximum building hourly cooling and heating loads throughout the year are assumed to be 6.2 kW and 8.6 kW, respectively. A sinusoidal pattern is chosen as the daily average because it approximates building load profiles in many residential applications and facilitates easier interpretation of the results. This profile may represent the load pattern of a typical single-family residential house in cold climate zones (e.g., Alberta, Canada). During the first six months of the year, the building requires cooling, and the heat pump transfers the extracted heat from the building to the ground. In the following six months, the process reverses. Additionally, there are a few days in the 1st, 2nd, 6th, and 12th months when the building requires both heating and cooling. The hourly building load profile (Figure 10a) can be represented by daily average and daily maximum load profiles (Figure 10b). The daily average load profile is used in simulating long-term system performance, while the daily maximum load profile is employed for simulating extreme conditions, essential for selecting a heat pump system capable of meeting peak demand under extreme conditions. To validate the applicability and simulation results obtained from the proposed model based on these two daily profiles, an hourly simulation of the system is conducted using OpenModelica Version 1.23.1, an open-source modeling and simulation environment for complex physical systems based on Modelica language [83]. The building library in this open-source software provides tools for dynamic simulations of various energy systems. The borefields model within the library (Buildings.Fluid.Geothermal.Borefields) combines short-term and long-term GHE models (refer to Figure 2), enabling simulations over timescales ranging from minutes to decades [7]. The same heat pump model, building load, and GHE properties are implemented in OpenModelica, with the only difference being the GHE model.
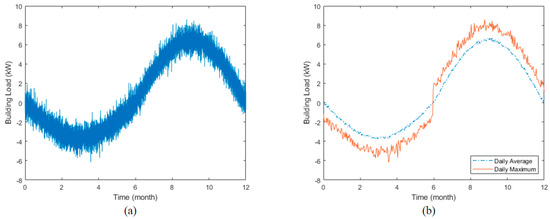
Figure 10.
Building load profile: (a) hourly, (b) daily average and daily maximum. Note: “Month 1” marks the first month of the cooling season.
The heat pump is selected to meet the total heating and cooling load of the building over the 20-year operational period. The properties of the heat pump at its rated conditions for cooling and heating modes are listed in Table 2. This system maintains an approximate annual balance between the heat rejected to the ground during cooling and the heat extracted during heating, thereby preventing long-term thermal accumulation or depletion in the ground. This balance is achieved because the rate of heat rejection to the ground during cooling mode per kW of capacity generally exceeds the rate of heat extraction during heating mode per kW of capacity, as the power consumption by the heat pump is also dissipated as heat to the ground during cooling [84]. Consequently, although the building heating demand exceeds the cooling load, the heat rejected to the ground during cooling mode compensates for the heat extracted during the heating period. To ensure the heat pump satisfies the entire building load, dynamic simulations must be conducted over the lifespan of the system using the daily maximum building load. During this period, the run fraction of the heat pump is monitored, ensuring it remains below 1 (but not significantly lower, as this could indicate overdesign). Figure 11 shows the comparison of the run fraction of the heat pump during the first year of system operation, obtained from a daily simulation using the proposed model and an hourly simulation in OpenModelica. It can be seen that the daily simulation with the daily maximum building load, using the proposed model, effectively captures the maximum run fraction of the heat pump. The run fraction in both cooling mode (first half of the year) and heating mode (second half of the year) approximately follows a sinusoidal pattern, with the maximum run fraction in cooling mode being lower than in heating mode. The run fraction of the heat pump in cooling mode may suggest that the water source heat pump is overdesigned for cooling. This overdesign could be mitigated by implementing a hybrid GSHP system, sizing the GSHP based on the cooling load, and using supplementary heating to cover any unmet heating load. However, this study assumes a standalone GSHP system designed to meet all seasonal demands without auxiliary heating to evaluate the capability of the GSHP for sustainable and year-round operation. If a supplementary heating system were used and if the GSHP was sized based on the cooling load, the borehole length would decrease, and the maximum ELT during cooling mode would increase. Additionally, the run fraction and accordingly the PLF in cooling mode would rise. The higher ELT negatively impacts the COP, while the improved PLF positively affects the COP. These opposing effects generally offset each other, resulting in a COP comparable to the values achieved in this study.
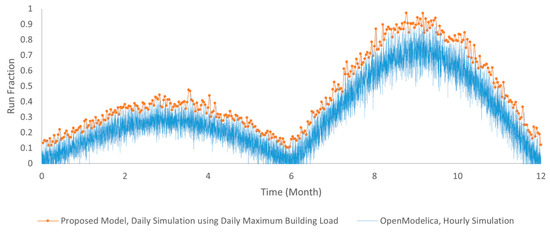
Figure 11.
Run fraction of the heat pump during the first year of GSHP operation.
For the ground heat exchanger, a single borehole is utilized, with specifications provided in Table 5.

Table 5.
Ground and ground heat exchanger specifications.
To properly assess the impact of temperature rise or drop on the operation of the GSHP using the model proposed in the current study, it is important that the borehole model is based on a borehole length that ensures the ELT remains in a proper range in the heating and cooling modes. This is ignored in similar studies [2,3]. The borehole length selected for the current model allows the ELT to remain within an optimal range for 20 years of operation. The ELT should not fall more than 8 °C below the undisturbed ground temperature in heating mode, while it should not exceed 17 °C above the ground temperature in cooling mode for optimal system efficiency and ground loop length [84].
To design the borehole length, an initial estimate is made. Then, the dynamic simulation of the GSHP system is performed using the proposed model (see Figure 3) with the daily average building load profile for the desired duration of operation. The borehole length is adjusted iteratively so that the ELT or outlet GHE running fluid temperature remains within the optimal range throughout the entire period of operation. Although the 24 h load aggregation resolution used for designing the borehole differs from the design levels categorized by Ahmadfard and Bernier [85], it provides sufficient accuracy for this study. This accuracy is demonstrated in the figures in Section 6, which show strong agreement between the results from the proposed model and those from the hourly simulation in OpenModelica.
5. Uncertainty and Sensitivity Analysis
To evaluate the robustness of the adopted PLF–RF model, a sensitivity analysis was performed on the two key empirical parameters, the maximum cycling rate () and the time constant (), which govern the dynamic response of part-load performance. In this study, both parameters varied from 50% to 150% of their base values while computing the PLF across the full range of part-load ratios. The results indicate that the maximum deviation in the PLF remains below 8.2%, with the largest deviations occurring at low run fractions, where the system is more sensitive to short-cycle transient effects.
Specifically, reducing to 1.25 cycles/hour or to 30 s resulted in a negligible PLF deviation (i.e., a maximum of 0.0819) compared to the base case. Conversely, increasing either parameter to 150% of its nominal value also yielded symmetric deviations of similar magnitude. These findings suggest that while the PLF model is modestly sensitive to cycling dynamics at low load conditions, the annual impact remains limited, particularly given that the system in this study typically operates at moderate to high RF values (see Figure 11). Thus, the assumed PLF model parameters are considered reasonable, and the simulation results are not significantly affected by moderate variations in and .
To assess the influence of parameter uncertainty on system performance, a comprehensive Monte Carlo-based uncertainty analysis is conducted. This analysis captures the variability in the ground, borehole grout, and running fluid thermal properties (i.e., thermal conductivity, specific heat capacity, density, and viscosity of running fluid), as well as parameters of the PLF model (i.e., the maximum number of on–off cycles and the time constant). Specifically, 10,000 independent simulations are performed, each with randomized values for key input parameters. Each parameter is sampled from a uniform distribution across its specified range. The selected range for each parameter is based on the relevant literature and is summarized in Table 6. The impact of input uncertainty on system performance is shown using error bars based on the 95% prediction interval, and the resulting distributions of output parameters are shown in Section 6.

Table 6.
Summary of the parameters and their uncertainty ranges used in the Monte Carlo-based uncertainty analysis of the GHE model.
To further quantify the sensitivity of model outputs to each input parameter, partial rank correlation coefficients were calculated using the Spearman method [86]. The Spearman method provides a quantitative measure of the monotonic influence of each input variable while controlling for all other variables, and it can be computed directly from the existing Monte Carlo ensemble, eliminating the separate one-at-a-time sampling required by Morris sensitivity analysis used in several studies [87,88,89] to screen parameters qualitatively—without isolating individual effects. The resulting partial Spearman coefficients for each parameter are presented in Section 6.
6. Results and Discussion
Figure 12 compares the results of the proposed model with those from the hourly simulation in OpenModelica for the transient temperatures of the borehole wall and the GHE outlet fluid during the first year of system operation. The borehole wall inlet and GHE outlet running fluid temperatures follow a sinusoidal pattern, with their peaks occurring after the building load peaks. These phase shifts are due to the thermal inertia of the ground. This effect is also evident in Figure 13, which depicts the yearly average borehole wall temperature over 20 years of operation for two cases, one based on the actual building load and a hypothetical scenario with a 10% heat rejection imbalance, where the system injects 10% more heat into the ground than it extracts. Initially, the borehole wall temperature matches the undisturbed ground temperature of 9 °C. However, after one year of operation, the average borehole wall temperature rises slightly to above 9.3 °C for the balanced case and exceeds 9.5 °C for the unbalanced case. Despite an approximately balanced annual ground load in the actual load scenario, the heat injected into the ground during cooling mode is not immediately offset by heat extraction during heating mode due to the delayed thermal response of the ground. Over time, for the balanced case, the average borehole wall temperature gradually stabilizes near 9 °C as the ground reaches thermal equilibrium. In contrast, for the unbalanced case, the average borehole wall temperature initially decreases before slowly increasing each year, reaching approximately 4% above the initial undisturbed temperature by the end of the 20th year.

Figure 12.
Comparison of the borehole wall and the GHE outlet fluid temperatures during the first year from the proposed model and hourly simulation in OpenModelica: (a) borehole wall temperature, (b) GHE outlet fluid temperature.
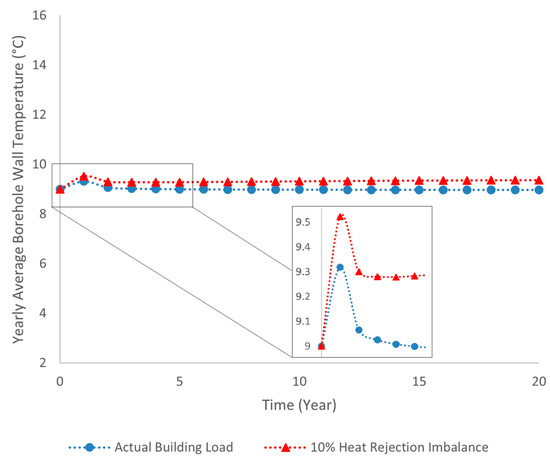
Figure 13.
Yearly average borehole wall temperature over 20 years of operation for two scenarios: one with the actual building load and another with a 10% heat rejection imbalance.
Figure 14 depicts the yearly average COP of the heat pump in both heating and cooling modes, alongside the corresponding variations in average heating and cooling capacities over 20 years of operation, for two scenarios: one based on the actual building load and another with a 10% heat rejection imbalance. The trends for the cooling mode COP and capacity differ from those for the heating mode COP and capacity. For the actual building load, the cooling mode COP and capacity gradually increase before stabilizing, whereas in the imbalanced scenario, they initially increase and then experience a slight decline. In contrast, the heating mode COP and capacity show the opposite behavior. For the actual (balanced) load, the borehole wall temperature decreases slightly—by approximately 0.35 °C—over the 20-year period. In the imbalanced case, it first decreases and then rises slightly in later years. A lower borehole wall temperature enhances cooling efficiency and capacity but reduces heating performance, as cooler ground improves heat rejection during cooling mode but impairs heat extraction during heating mode. Conversely, a higher borehole wall temperature benefits heating mode but adversely affects cooling performance.
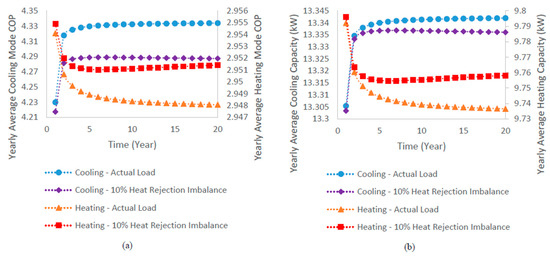
Figure 14.
Yearly average performance of the heat pump over 20 years of operation: (a) COP in heating and cooling modes, (b) heating and cooling capacities.
Despite these variations, the overall impact of ground temperature changes on heat pump performance is minimal for both scenarios, with changes in the COP and capacity remaining below 3% over 20 years of operation.
The impact of temperature variations in the ground due to factors such as the operation of adjacent systems, changes in ground moisture content, and construction or urban activities on heat pump performance is analyzed through dynamic simulation of the GSHP operation for different ground temperatures ranging from 4 °C to 14 °C (i.e., temperature variations of up to 5 °C from the original undisturbed ground temperature at 9 °C). This approach is viable because the effects of heat flows entering or leaving the ground near the borehole can be modeled as corresponding changes in temperature at the borehole wall.
Figure 15 displays the variations in cooling and heating capacities over the cooling season (first half of the year) and heating season (second half of the year) for various ground temperature changes. It also compares the results of the proposed model with the hourly simulation in OpenModelica for the case where the system operates without any ground temperature changes due to external factors, demonstrating that the use of daily simulations for the operation period does not significantly impact the results of this study. The cooling and heating capacities decline and then recover during the cooling and heating seasons in response to changes in the borehole wall temperature and ELT (see Figure 12 for annual trends in the borehole wall temperature and ELT). Specifically, as the borehole wall temperature and ELT decrease during heating mode (or increase during cooling mode), capacities decline because the heat pump must draw heat from a cooler medium (or reject heat to a warmer medium). Conversely, as these temperatures increase in heating mode (or decrease in cooling mode), capacities rise again, as the heat pump draws heat from a warmer medium (or rejects heat to a cooler medium).
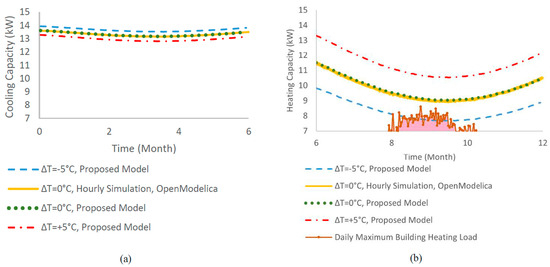
Figure 15.
Variation in cooling and heating capacities throughout one year of operation for various ground temperature changes: (a) cooling mode, (b) heating mode. ΔT: ground temperature changes.
Ground temperature drop enhances cooling capacity only slightly and reduces heating capacity, while ground temperature rise reduces cooling capacity slightly and enhances heating capacity. The heat pump investigated in the current study can meet the cooling requirements of the building across all the investigated ground temperature disturbances. However, if the ground temperature drops by 2 °C or more due to any of the aforementioned effects, the heat pump fails to meet part of the heating demand of the building, represented by the highlighted region in Figure 15b, falling below the daily maximum building heating load curve. During these periods, the heat pump operates continuously (run fraction of 1) but only partially meets the required load. Additional supplementary heating systems are necessary to meet the extra heating needs of the building during these times. If the ground temperature decreases by 2 °C, it is predicted that the system will be unable to meet the annual peak heating demand of the building, which occurs on the 263rd day of the year, while meeting all other heating demands throughout the year. With a 5 °C decrease in ground temperature, the proposed model predicts unmet daily peak heating demand for 22 or 23 days, according to predictions of the hourly or daily simulations, respectively.
Figure 16 shows the variation in cooling and heating capacities of the heat pump in response to changes in ground temperature on the peak demand days of the building—day 107 for cooling and day 263 for heating. The error bars represent the 95% prediction interval (see Section 5). It can be seen that the cooling capacity exhibits less variation with changes in ground temperature (approximately 0.5% per 1 °C rise in ground temperature) compared to the heating capacity (approximately 3% per 1 °C drop in ground temperature). This is due to the evaporator being connected to the building and ground sides in the cooling and heating seasons, respectively. The suction pressure of the compressor and the mass flow rate of the refrigerant through the compressor are primarily governed by evaporator conditions. When the evaporator is situated on the building side (i.e., cooling mode), its temperature is tightly controlled to meet the cooling requirements of the building, typically maintaining a stable chilled water supply temperature. This controlled evaporator temperature leads to a stable refrigerant suction pressure and mass flow rate through the compressor. In contrast, during heating mode, the evaporator is on the ground side, making the heating capacity highly sensitive to ELT variations.
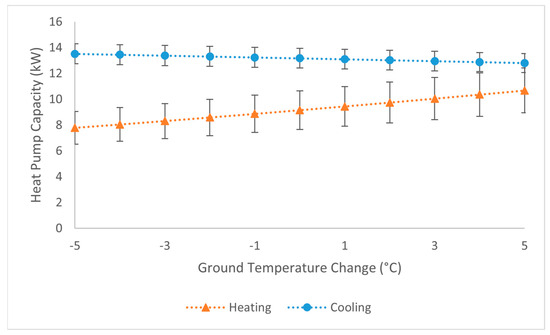
Figure 16.
Cooling and heating capacities as a function of ground temperature change on the peak cooling and heating demand days of the building, including 95% prediction interval error bars.
Figure 17 shows the variations in the COP for cooling and heating modes of the heat pump over the cooling and heating seasons, considering various ground temperature changes. It also compares the results of the proposed model with the hourly simulation in OpenModelica for the case where the system operates without any ground temperature changes due to external factors to show the impact of daily simulations on the results. In cooling mode, as the borehole wall temperature and the ELT rise, the COP decreases. Conversely, when the borehole wall temperature and ELT drop, the COP improves (refer to Figure 12 for the trends in the borehole wall temperature and ELT throughout the year). In heating mode, although the initial drop in the ELT negatively impacts the COP, the increased part-load fraction (PLF) due to a higher run fraction during peak heating (refer to Figure 11 for the trend in run fraction) compensates for this effect, causing a slight increase in the COP. When the ELT rises, the reverse occurs; the reduction in the PLF outpaces COP improvement, ultimately leading to a decline in the COP. This effect is also present in the cooling mode, but to a lesser degree due to the smaller variation in run rime fraction in the cooling season, making the COP variations during the cooling season smaller. The observed trend in the heating mode COP differs from what Koohi-Fayegh and Rosen [2] predicted (an initial decrease followed by an increase), assuming ideal thermodynamic COP relations. This highlights the importance of detailed heat pump modeling and accounting for the effect of on–off cycling, which is not considered in similar studies [2,3]. The impact of ground temperature changes on the cooling and heating mode COPs parallels their effect on the cooling and heating capacities, which has been discussed earlier.
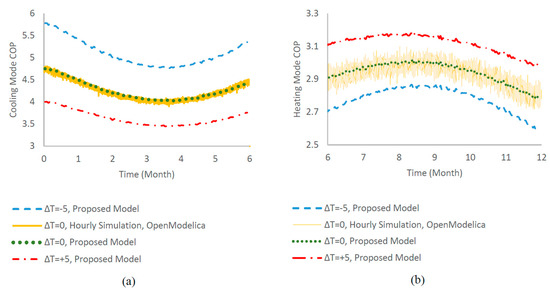
Figure 17.
Variation in cooling and heating mode COPs throughout one year of operation for various ground temperature changes: (a) cooling mode, (b) heating mode. ΔT: ground temperature changes.
Figure 18 illustrates the changes in the yearly average COP for cooling and heating modes across various ground temperature changes. To account for the uncertainty in model input parameters, 95% prediction interval error bars are included, representing the likely range of COP outcomes due to the variability in ground and fluid properties, as well as heat pump cycling behavior. The average COP in cooling mode decreases by approximately 0.2 units for every 1 °C increase in ground temperature, while the average COP rise in heating mode for every 1 °C drop in ground temperature is negligible.
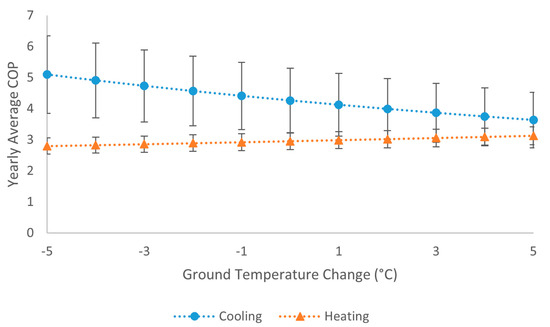
Figure 18.
Average COP for cooling and heating modes at different ground temperature changes, with 95% prediction interval error bars.
If an ideal heat pump model, similar to the one used by Koohi-Fayegh and Rosen [2], is employed instead of the dynamic model used in this study, the average COP in cooling mode would decrease by approximately 7% per 1 °C rise in ground temperature, and the average COP in heating mode would decrease by 4% per 1 °C drop in ground temperature. These predicted changes are more than double those of the dynamic model. Also, as expected, the ideal model produces unrealistically high COP values for both modes, making it not suitable for the use of COP values. This highlights the importance of using a dynamic heat pump model for accurately predicting the performance of a GSHP system.
Figure 19 shows the probability distributions of the seasonal average COPs and yearly average heating and cooling capacities, generated from 10,000 Monte Carlo simulations. These histograms illustrate the spread in performance due to input uncertainty in soil, grout, and fluid properties, as well as part-load operation parameters. The distributions are relatively narrow for COPs, indicating moderate sensitivity, while capacities exhibit slightly broader variability, reflecting their dependence on both thermal and operational conditions.
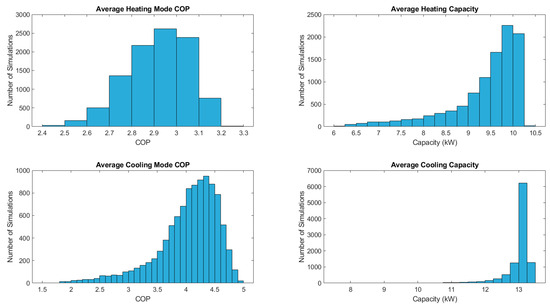
Figure 19.
Probability distributions of seasonal average COPs (heating and cooling) and yearly average heating and cooling capacities obtained from 10,000 Monte Carlo simulations.
To identify the most influential parameters, Figure 20 shows the partial Spearman rank correlation coefficients between each input and output metric. The analysis reveals that soil and grout thermal conductivities are the dominant factors positively correlated with both the COP and capacity. Other inputs, such as the specific heat capacity and density of the soil and grout, show weaker effects. Among operational parameters, the maximum number of on–off cycles per hour has a modest negative correlation with the COP, highlighting the performance impact of frequent cycling. Additionally, the properties of the GHE circulating fluid show a minimal impact on the performance outputs under the simulated conditions.
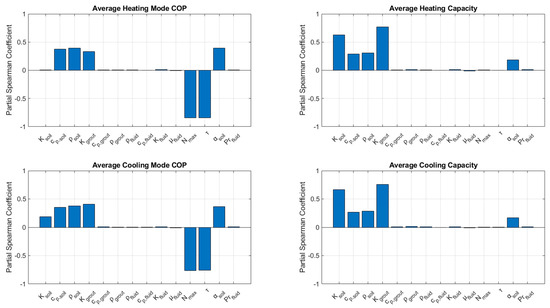
Figure 20.
Partial Spearman rank correlation coefficients showing the sensitivity of seasonal COPs and system capacities to variations in input parameters.
7. Conclusions
This study presents a semi-analytical dynamic model for ground source heat pump (GSHP) systems, focusing on medium- to long-term simulations to assess the system performance under varying underground temperature conditions. A case study is presented for a heating-dominated building load profile to analyze the impact of ground temperature fluctuations—caused by system operation and external factors—on GSHP performance and heating/cooling capacities, evaluating the sustainability and efficiency of the system.
The case study results indicate that while temperature variations in the ground due to the system operation impact system performance and capacity, their overall effect is relatively minor if the heat injection and extraction are balanced and the borehole wall temperature does not gradually rise or drop as a result of imbalances. Underground temperature fluctuations caused by external factors (e.g., adjacent systems in densely populated areas) affect the heating and cooling capacities of the system as well as its performance. Notably, if ground temperatures drop by 2 °C or more, the heat pump in the case study cannot fully meet the heating demand of the building, necessitating supplementary heating systems. This underscores the need to integrate site-specific temperature forecasts into system planning.
In general, it can be concluded that dynamic modeling of GSHP systems is essential for accurately designing these systems and predicting their performance in the long term under variable underground temperature conditions. Maintaining a thermal balance between heat injection and extraction is essential for long-term performance stability. In heating/cooling-dominated scenarios, designers must anticipate potential ground temperature declines/rises and consider mitigation strategies—such as hybrid systems—to ensure reliability during extreme conditions.
While the current study focuses on a standalone GSHP configuration, the proposed modeling framework is inherently extensible to hybrid and grid-interactive GSHPs, including integration with photovoltaic (PV) systems, thermal energy storage (TES), and grid-aware control strategies. These insights are broadly applicable to GSHP implementations worldwide, particularly in regions prone to subsurface temperature variability, and provide a foundation for improving the sustainability and resilience of this renewable energy technology.
Author Contributions
Conceptualization, S.K.-F.; methodology, S.K.-F. and M.M.M.; software, M.M.M.; validation, S.K.-F. and M.M.M.; formal analysis, S.K.-F. and M.M.M.; investigation, M.M.M.; resources, S.K.-F.; writing, M.M.M.; writing—review and editing, S.K.-F.; visualization, M.M.M.; supervision, S.K.-F.; project administration, S.K.-F.; funding acquisition, S.K.-F. All authors have read and agreed to the published version of the manuscript.
Funding
This research was funded by the Canada First Research Excellence Fund at the University of Alberta.
Institutional Review Board Statement
Not applicable.
Informed Consent Statement
Not applicable.
Data Availability Statement
All methodology details are described within the article. No additional research data were created for this study.
Conflicts of Interest
The authors declare no conflicts of interest. The funders had no role in the design of the study; in the collection, analyses, or interpretation of data; in the writing of the manuscript; or in the decision to publish the results.
Nomenclature
| ATR | Air to refrigerant | T | Temperature (°C) |
| cp | Specific heat capacity (J/kg K) | t | Time (s) |
| COP | Coefficient of performance | v | Specific volume of refrigerant (m3/kg) |
| DR | Displacement rate of the compressor (m3/s) | Ẇ | Compressor input power (W) |
| EAT | Entering air temperature (°C) | α | Thermal diffusivity (m2/s) |
| ELT | Entering liquid temperature (°C) | ∆ | Difference |
| GHE | Ground heat exchanger | η | Efficiency |
| FLS | Finite line source | μ | Viscosity (Pa.s) |
| GSHP | Ground source heat pump | ρ | Density (kg/m3) |
| h | Specific enthalpy of refrigerant (J/kg) | τ | Time (s) |
| H | Total borehole length (m) | subscripts | |
| ICS | Infinite cylindrical source | adj | Adjusted |
| ILS | Infinite line source | Ave | Average |
| k | Specific heat ratio (isentropic exponent) | b | Building |
| K | Thermal conductivity (W/mK) | c | Condenser |
| LTR | Liquid to refrigerant | cm | Combined mechanical |
| ṁ | Mass flow rate of refrigerant (kg/s) | e | Evaporator |
| N | Number of cycles | max | Maximum |
| P | Pressure (Pa) | o | Operating |
| PLF | Part-load fraction | v | Volumetric |
| Pr | Prandtl number | ||
| q′ | Ground heat injection/extraction per unit length of the borehole (W/m) | ||
| Q̇ | Heat transfer rate (W) | ||
| RF | Run fraction | ||
| rb | Borehole radius (m) | ||
References
- Liu, X.; Ho, J.; Winick, J.; Porse, S.; Lian, J.; Wang, X.; Liu, W.; Malhotra, M.; Li, Y.; Anand, J. Grid Cost and Total Emissions Reductions Through Mass Deployment of Geothermal Heat Pumps for Building Heating and Cooling Electrification in the United States; U.S. Department of Energy: Washington, DC, USA, 2023. [Google Scholar]
- Koohi-Fayegh, S.; Rosen, M.A. An analytical approach to evaluating the effect of thermal interaction of geothermal heat exchangers on ground heat pump efficiency. Energy Convers. Manag. 2014, 78, 184–192. [Google Scholar] [CrossRef]
- Qian, H.; Wang, Y. Modeling the interactions between the performance of ground source heat pumps and soil temperature variations. Energy Sustain. Dev. 2014, 23, 115–121. [Google Scholar] [CrossRef]
- Zeng, H.Y.; Diao, N.R.; Fang, Z. Heat transfer analysis of boreholes in vertical ground heat exchangers. Int. J. Heat Mass Transf. 2003, 46, 4467–4481. [Google Scholar] [CrossRef]
- Zhu, K.; Blum, P.; Ferguson, G.; Balke, K.-D.; Bayer, P. The geothermal potential of urban heat islands. Environ. Res. Lett. 2010, 5, 044002. [Google Scholar] [CrossRef]
- Shao, H.; Chen, S.; Witte, F.; Kolditz, O. Modelling the Change of Heat Exchange Rate of Borehole Heat Exchangers in Large GSHP Systems. In Proceedings of the World Geothermal Congress, Reykjavik, Iceland, 21–26 May 2021; Available online: https://www.geothermal-energy.org/pdf/IGAstandard/WGC/2020/29008.pdf (accessed on 12 November 2024).
- Laferrière, A.; Cimmino, M.; Picard, D.; Helsen, L. Development and validation of a full-time-scale semi-analytical model for the short- and long-term simulation of vertical geothermal bore fields. Geothermics 2020, 86, 101788. [Google Scholar] [CrossRef]
- Yuan, Y.; Cao, X.; Sun, L.; Lei, B.; Yu, N. Ground source heat pump system: A review of simulation in China. Renew. Sustain. Energy Rev. 2012, 16, 6814–6822. [Google Scholar] [CrossRef]
- Gu, Y.; O’Neal, D. Development of an equivalent diameter expression for vertical U-Tubes used in ground-coupled heat pumps. ASHRAE Trans. 1998, 104, 347–355. [Google Scholar]
- Shonder, J.A.; Beck, J.V. Field test of a new method for determining soil formation thermal conductivity and borehole resistance. ASHRAE Trans. 1999, 106, 843–850. [Google Scholar]
- Sharqawy, M.H.; Mokheimer, E.M.; Badr, H.M. Effective pipe-to-borehole thermal resistance for vertical ground heat exchangers. Geothermics 2009, 38, 271–277. [Google Scholar] [CrossRef]
- Hellström, G. Ground Heat Storage: Thermal Analyses of Duct Storage Systems. Doctoral Thesis, University of Lund, Lund, Sweden, 1991. [Google Scholar]
- Claesson, J.; Hellström, G. Multipole method to calculate borehole thermal resistances in a borehole heat exchanger. HVAC&R Res. 2011, 17, 895–911. [Google Scholar]
- Eskilson, P. Thermal Analysis of Heat Extraction Boreholes. Doctoral Thesis, University of Lund, Lund, Sweden, 1987. [Google Scholar]
- Ingersoll, L.R.; Plass, H.J. Theory of the ground pipe heat source for the heat pump. ASHRAE Trans. 1948, 47, 339–348. [Google Scholar]
- Kelvin, T.W. Mathematical and Physical Papers; Cambridge University Press: London, UK, 1882. [Google Scholar]
- Carslaw, H.S.; Jaeger, J.C. Conduction of Heat in Solids, 2nd ed.; Oxford University Press: London, UK, 1959. [Google Scholar]
- Zeng, H.; Diao, N.; Fang, Z. A finite line-source model for boreholes in geothermal heat exchangers. Heat Transfer Asian Res. 2002, 31, 558–567. [Google Scholar] [CrossRef]
- Retkowski, W.; Ziefle, G.; Thöming, J. Evaluation of different heat extraction strategies for shallow vertical ground-source heat pump systems. Appl. Energy 2015, 149, 259–271. [Google Scholar] [CrossRef]
- Li, M.; Zhu, K.; Fang, Z. Analytical methods for thermal analysis of vertical ground heat exchangers. In Advances in Ground-Source Heat Pump Systems; Rees, S., Ed.; Woodhead Publishing: Amsterdam, The Netherlands, 2016; pp. 157–183. [Google Scholar]
- Lamarche, L.; Beauchamp, B. A new contribution to the finite line-source model for geothermal boreholes. Energy Build. 2007, 39, 188–198. [Google Scholar] [CrossRef]
- Costes, V.; Peysson, P. Projet D’initiation à la Recherche et au Développement-Capteurs Géothermiques Verticaux Enterrés: Validation Expérimentale de Nouveaux Modèles Développés Dans L’environnement TRNSYS; École Polytechnique de Montréal: Montréal, QC, Canada, 2008. [Google Scholar]
- Bandos, T.V.; Montero, A.; Fernández, E.; Santander, J.L.G.; Isidro, J.M.; Pérez, J.; Fernández de Córdoba, P.J.; Urchueguía, J.F. Finite line-source model for borehole heat exchangers: Effect of vertical temperature variations. Geothermics 2009, 38, 263–270. [Google Scholar] [CrossRef]
- Claesson, J.; Javed, S. An analytical method to calculate borehole fluid temperatures for time-scales from minutes to decades. ASHRAE Trans. 2011, 117, 279–288. [Google Scholar]
- Allen, J.J.; Hamilton, J.F. Steady-State Reciprocating Water Chiller Models. ASHRAE Trans. 1983, 89, 398–407. [Google Scholar]
- Hamilton, J.F.; Miller, J.L. A Simulation Program for Modeling an Airconditioning System. ASHRAE Trans. 1990, 96, 213–221. [Google Scholar]
- Stoecker, W.F.; Jones, J.W. Refrigeration and Air Conditioning, 2nd ed.; McGraw-Hill: New York, NY, USA, 1982. [Google Scholar]
- Lash, T. Simulation and Analysis of a Water Loop Heat Pump System. Master’s Thesis, University of Illinois at Urbana-Champaign, Urbana-Champaign, IL, USA, 1992. [Google Scholar]
- Shenoy, A. Simulation, Modeling and Analysis of a Water to Air Heat Pump. Master’s Thesis, Oklahoma State University, Stillwater, OK, USA, 2004. [Google Scholar]
- Tang, C.C. Modeling Packaged Heat Pumps in a Quasi-Steady State Energy Simulation Program. Master’s thesis, Oklahoma State University, Stillwater, OK, USA, 2005. [Google Scholar]
- Staffell, I.; Brett, D.; Brandon, N.; Hawkes, A. A review of domestic heat pumps. Energy Environ. Sci. 2012, 5, 9291. [Google Scholar] [CrossRef]
- You, T.; Wu, W.; Wang, B.; Shi, W.; Li, X. Dynamic soil temperature of Ground-Coupled Heat pump system in cold region. In Energy and Environment; Wang, Z., Wang, F., Wang, P., Shen, C., Liu, J., Zhu, Y., Eds.; Springer: Berlin/Heidelberg, Germany, 2013; pp. 439–448. [Google Scholar]
- Yang, W.; Zhang, S.; Chen, Y. A dynamic simulation method of ground coupled heat pump system based on borehole heat exchange effectiveness. Energy Build. 2014, 77, 17–27. [Google Scholar] [CrossRef]
- Ruiz-Calvo, F.; Montagud, C.; Cazorla-Marín, A.; Corberán, J.M. Development and experimental validation of a TRNSYS dynamic tool for design and energy optimization of ground source heat pump systems. Energies 2017, 10, 1510. [Google Scholar] [CrossRef]
- Zong, Y.; Valocchi, A.J.; Lin, Y.F. Coupling a borehole thermal model and MT3DMS to simulate dynamic ground source heat pump efficiency. Groundwater 2021, 61, 237–244. [Google Scholar] [CrossRef]
- Stefanuk, N.B.M.; Aplevich, J.D.; Renksizbulut, M. Modeling and Simulation of a Superheat-controlled Water-to-Water Heat Pump. ASHRAE Trans. 1992, 98, 172–184. [Google Scholar]
- Cecchini, C.; Marchal, D. A Simulation Model of Refrigerant and Air-conditioning Equipment Based On Experimental Data. ASHRAE Trans. 1991, 97, 388–393. [Google Scholar]
- Parise, J.A.R. Simulation of Vapor-compression Heat Pumps. Simulation 1986, 46, 71–76. [Google Scholar] [CrossRef]
- Norberg, R.R.; Brandstetter, E.A. An overview of heat pump modeling. ASHRAE Trans. 1995, 101, 469–478. [Google Scholar]
- Zeng, W.; Zhang, K.; Chen, W.; Huang, W. Numerical study on the thermal performance of ground source heat pumps in buildings. Renew. Energy 2018, 120, 386–394. [Google Scholar]
- de Oliveira, C.A.G.; Mesquita, G.Z.; Silva, D.C.C.D.; de Carvalho, A.A.B. Simulation of an unbalanced ground-source heat pump system. J. Build. Perform. 2014, 5, 1–11. [Google Scholar]
- Jin, H.; Spitler, J.D. A parameter estimation based model of water-to-water heat pumps for use in energy calculation programs. ASHRAE Trans. 2002, 108, 3–17. [Google Scholar]
- Jin, H. Parameter Estimation Based Models of Water Source Heat Pumps. Ph.D. Dissertation, Oklahoma State University, Stillwater, OK, USA, 2002. [Google Scholar]
- Guo, Y.; Liu, X.; Wang, X.; Zhang, Y.; Wang, H. A review on hybrid physics and data-driven modeling methods applied in air source heat pump systems for energy efficiency improvement. Renew. Sustain. Energy Rev. 2024, 204, 114804. [Google Scholar] [CrossRef]
- Gabrielli, P.; Sansavini, G.; Singh, S.; Garcia, L.S.; Jacquemoud, E.; Jenny, P. Off-design modeling and operational optimization of trans-critical carbon dioxide heat pumps. J. Eng. Gas Turbines Power 2022, 144, 101013. [Google Scholar] [CrossRef]
- Katipamula, S.; O’Neal, D.L. A part load factor for a heat pump derived from laboratory measurements. Energy Build. 1992, 19, 125–132. [Google Scholar] [CrossRef]
- Henderson, H.I.; Rengarajan, K. Model to predict the latent capacity of air conditioners and heat pumps at part-load conditions with constant fan operation. ASHRAE Trans. 1996, 102, 266–274. [Google Scholar]
- Cai, W.; Wang, F.; Chen, S.; Chen, C.; Zhang, Y.; Kolditz, O.; Shao, H. Importance of long-term ground-loop temperature variation in performance optimization of Ground Source Heat Pump system. Appl. Therm. Eng. 2022, 204, 117945. [Google Scholar] [CrossRef]
- Li, W.; Li, X.; Wang, Y.; Tu, J. An integrated predictive model of the long-term performance of ground source heat pump (GSHP) systems. Energy Build. 2018, 159, 309–318. [Google Scholar] [CrossRef]
- Biglarian, H.; Abbaspour, M.; Saidi, M.H. Evaluation of a transient borehole heat exchanger model in dynamic simulation of a ground source heat pump system. Energy 2018, 147, 81–93. [Google Scholar] [CrossRef]
- Zhao, P.; Zhang, D.; Li, X.; Gao, P.; Lin, Y.; Chu, Z. Dynamic numerical investigation of the long-term performance of a GSHP system considering groundwater seepage and layered subsurface coupling conditions. Appl. Therm. Eng. 2022, 222, 119944. [Google Scholar] [CrossRef]
- Yang, W.; Shi, M.; Liu, G.; Chen, Z. A two-region simulation model of vertical U-tube ground heat exchanger and its experimental verification. Appl. Energy 2009, 86, 2005–2012. [Google Scholar] [CrossRef]
- Li, S.; Dong, K.; Wang, J.; Zhang, X. Long term coupled simulation for ground source heat pump and underground heat exchangers. Energy Build. 2015, 106, 13–22. [Google Scholar] [CrossRef]
- Lee, C. Dynamic performance of ground-source heat pumps fitted with frequency inverters for part-load control. Appl. Energy 2010, 87, 3507–3513. [Google Scholar] [CrossRef]
- Yang, S.; Lee, S. Dynamic thermal analysis of a residential ground-source heat pump. Sustain. Energy Technol. Assess. 2020, 37, 100608. [Google Scholar] [CrossRef]
- Koohi-Fayegh, S.; Rosen, M.A. Long-term study of vertical ground heat exchangers with varying seasonal heat fluxes. Geothermics 2018, 75, 15–25. [Google Scholar] [CrossRef]
- Heim, E.; Grözinger, J.; Stuhlberger, J.; Ohrdes, T.; Stryi-Hipp, G. Comparison of simulation tools for optimizing borehole heat exchanger field operation. Geotherm. Energy 2024, 12, 24. [Google Scholar] [CrossRef]
- Hellström, G. Duct Ground Heat Storage Model: Manual for Computer Code; Department of Mathematical Physics, University of Lund: Lund, Sweden, 1989. [Google Scholar]
- Nellis, G.; Klein, S.A. Heat Transfer; Cambridge University Press: Cambridge, UK, 2009. [Google Scholar]
- Jähnig, D.I.; Reindl, D.T.; Klein, S. A semi-empirical method for representing domestic refrigerator/freezer compressor calorimeter test data. ASHRAE Trans. 2000, 106, 122–130. [Google Scholar]
- Li, B.; Alleyne, A.G. A dynamic model of a vapor compression cycle with shut-down and start-up operations. Int. J. Refrig. 2010, 33, 538–552. [Google Scholar] [CrossRef]
- Qiao, H.; Kwon, L.; Aute, V.; Radermacher, R. Transient modeling of a multi-evaporator air conditioning system and control method investigation. In Proceedings of the 11th IEA Heat Pump Conference, Montréal, QC, Canada, 12–16 May 2014. [Google Scholar]
- Eskilson, P.; Claesson, J. Simulation model for thermally interacting heat extraction boreholes. Numer. Heat Transf. 1988, 13, 149–165. [Google Scholar] [CrossRef]
- Li, M.; Lai, A.C. Review of analytical models for heat transfer by vertical ground heat exchangers (GHEs): A perspective of time and space scales. Appl. Energy 2015, 151, 178–191. [Google Scholar] [CrossRef]
- Javed, S.; Claesson, J. New analytical and numerical solutions for the short-term analysis of vertical ground heat exchangers. ASHRAE Trans. 2011, 117, 3–12. [Google Scholar]
- Lamarche, L. Short-time analysis of vertical boreholes, new analytic solutions and choice of equivalent radius. Int. J. Heat Mass Transf. 2015, 91, 800–807. [Google Scholar] [CrossRef]
- Bauer, D.; Heidemann, W.; Müller-Steinhagen, H.; Diersch, H.G. Thermal resistance and capacity models for borehole heat exchangers. Int. J. Energy Res. 2011, 35, 312–320. [Google Scholar] [CrossRef]
- Zarrella, A.; Scarpa, M.; De Carli, M. Short time step analysis of vertical ground-coupled heat exchangers: The approach of CaRM. Renew. Energy 2011, 36, 2357–2367. [Google Scholar] [CrossRef]
- Pasquier, P.; Marcotte, D. Short-term simulation of ground heat exchanger with an improved TRCM. Renew. Energy 2012, 46, 92–99. [Google Scholar] [CrossRef]
- Minaei, A.; Maerefat, M. Thermal resistance capacity model for short-term borehole heat exchanger simulation with non-stiff ordinary differential equations. Geothermics 2017, 70, 260–270. [Google Scholar] [CrossRef]
- Philippe, M.; Bernier, M.; Marchio, D. Validity ranges of three analytical solutions to heat transfer in the vicinity of single boreholes. Geothermics 2009, 38, 407–413. [Google Scholar] [CrossRef]
- Cimmino, M.; Bernier, M. A semi-analytical method to generate g-functions for geothermal bore fields. Int. J. Heat Mass Transf. 2014, 70, 641–650. [Google Scholar] [CrossRef]
- Fossa, M. The temperature penalty approach to the design of borehole heat exchangers for heat pump applications. Energy Build. 2011, 43, 1473–1479. [Google Scholar] [CrossRef]
- Cimmino, M. Fast calculation of the g-functions of geothermal borehole fields using similarities in the evaluation of the finite line source solution. J. Build. Perform. Simul. 2018, 11, 655–668. [Google Scholar] [CrossRef]
- Yang, X.; Yu, X.; Duan, Y.; Wang, H.; Zhu, K.; Zhao, C.; Narsilio, G.A.; Jiang, Y. Numerical investigation on the influence of groundwater flow on long-term heat extraction performance of deep borehole heat exchanger array. Geotherm. Energy 2024, 12, 45. [Google Scholar] [CrossRef]
- Alberta Geological Survey. Available online: https://ags.aer.ca (accessed on 23 May 2025).
- Canadian GeoExchange Coalition. Design and Installation of Residential Ground Source Heat Pump Systems; Canadian GeoExchange Coalition: Montreal, QC, Canada, 2010; ISBN 978-0-9811612-3-5. [Google Scholar]
- Raymond, J.; Therrien, R.; Gosselin, L.; Lefebvre, R. Numerical analysis of thermal response tests with a groundwater flow and heat transfer model. Renew. Energy 2011, 36, 315–324. [Google Scholar] [CrossRef]
- Düber, S.; Fuentes, R.; Narsilio, G.A. Comparison and integration of simulation models for horizontal connection pipes in geothermal bore fields. Geotherm. Energy 2023, 11, 15. [Google Scholar] [CrossRef]
- Koohi-Fayegh, S.; Rosen, M.A. Modeling of vertical ground heat exchangers. Int. J. Green Energy 2021, 18, 755–774. [Google Scholar] [CrossRef]
- Henderson, H.; Huang, Y.J.; Parker, D. Residential Equipment Part Load Curves for Use in DOE-2; Lawrence Berkeley National Laboratory: Berkeley, CA, USA, 1999. [Google Scholar]
- ANSI/AHRI/ASHRAE/ISO 13256-1; Water-to-Air and Brine-to-Air Heat Pumps—Testing and Rating for Performance; International Organization for Standardization: Geneva, Switzerland, 2012.
- OpenModelica. Welcome to OpenModelica. Available online: https://www.openmodelica.org/ (accessed on 2 June 2025).
- Kavanaugh, S.; Rafferty, K. Geothermal Heating and Cooling: Design of Ground-Source Heat Pump Systems; ASHRAE: Atlanta, GA, USA, 2014. [Google Scholar]
- Ahmadfard, M.; Bernier, M. A review of vertical ground heat exchanger sizing tools including an inter-model comparison. Renew. Sustain. Energy Rev. 2019, 110, 247–265. [Google Scholar] [CrossRef]
- Spearman, C. The Proof and Measurement of Association between Two Things. Am. J. Psychol. 1904, 15, 72–101. [Google Scholar] [CrossRef]
- Xia, L.; Ma, Z.; Kokogiannakis, G.; Wang, Z.; Wang, S. A model-based design optimization strategy for ground source heat pump systems with integrated photovoltaic thermal collectors. Appl. Energy 2018, 214, 178–190. [Google Scholar] [CrossRef]
- Richter, S.; Lubashevsky, K.; Randow, J.; Henker, S.; Buchwald, J.; Bucher, A. Global sensitivity analysis and uncertainty quantification for design parameters of shallow geothermal systems. Geotherm. Energy 2024, 12, 8. [Google Scholar] [CrossRef]
- Morris, M.D. Factorial sampling plans for preliminary computational experiments. Technometrics 1991, 33, 161–174. [Google Scholar] [CrossRef]
Disclaimer/Publisher’s Note: The statements, opinions and data contained in all publications are solely those of the individual author(s) and contributor(s) and not of MDPI and/or the editor(s). MDPI and/or the editor(s) disclaim responsibility for any injury to people or property resulting from any ideas, methods, instructions or products referred to in the content. |
© 2025 by the authors. Licensee MDPI, Basel, Switzerland. This article is an open access article distributed under the terms and conditions of the Creative Commons Attribution (CC BY) license (https://creativecommons.org/licenses/by/4.0/).