
Advancing Equity in China’s Vehicle Electrification


 and
and
Abstract
1. Introduction
2. Literature Review
3. Analysis and Result Discussions
3.1. Inequality Degree Calculation
3.1.1. Gini Index
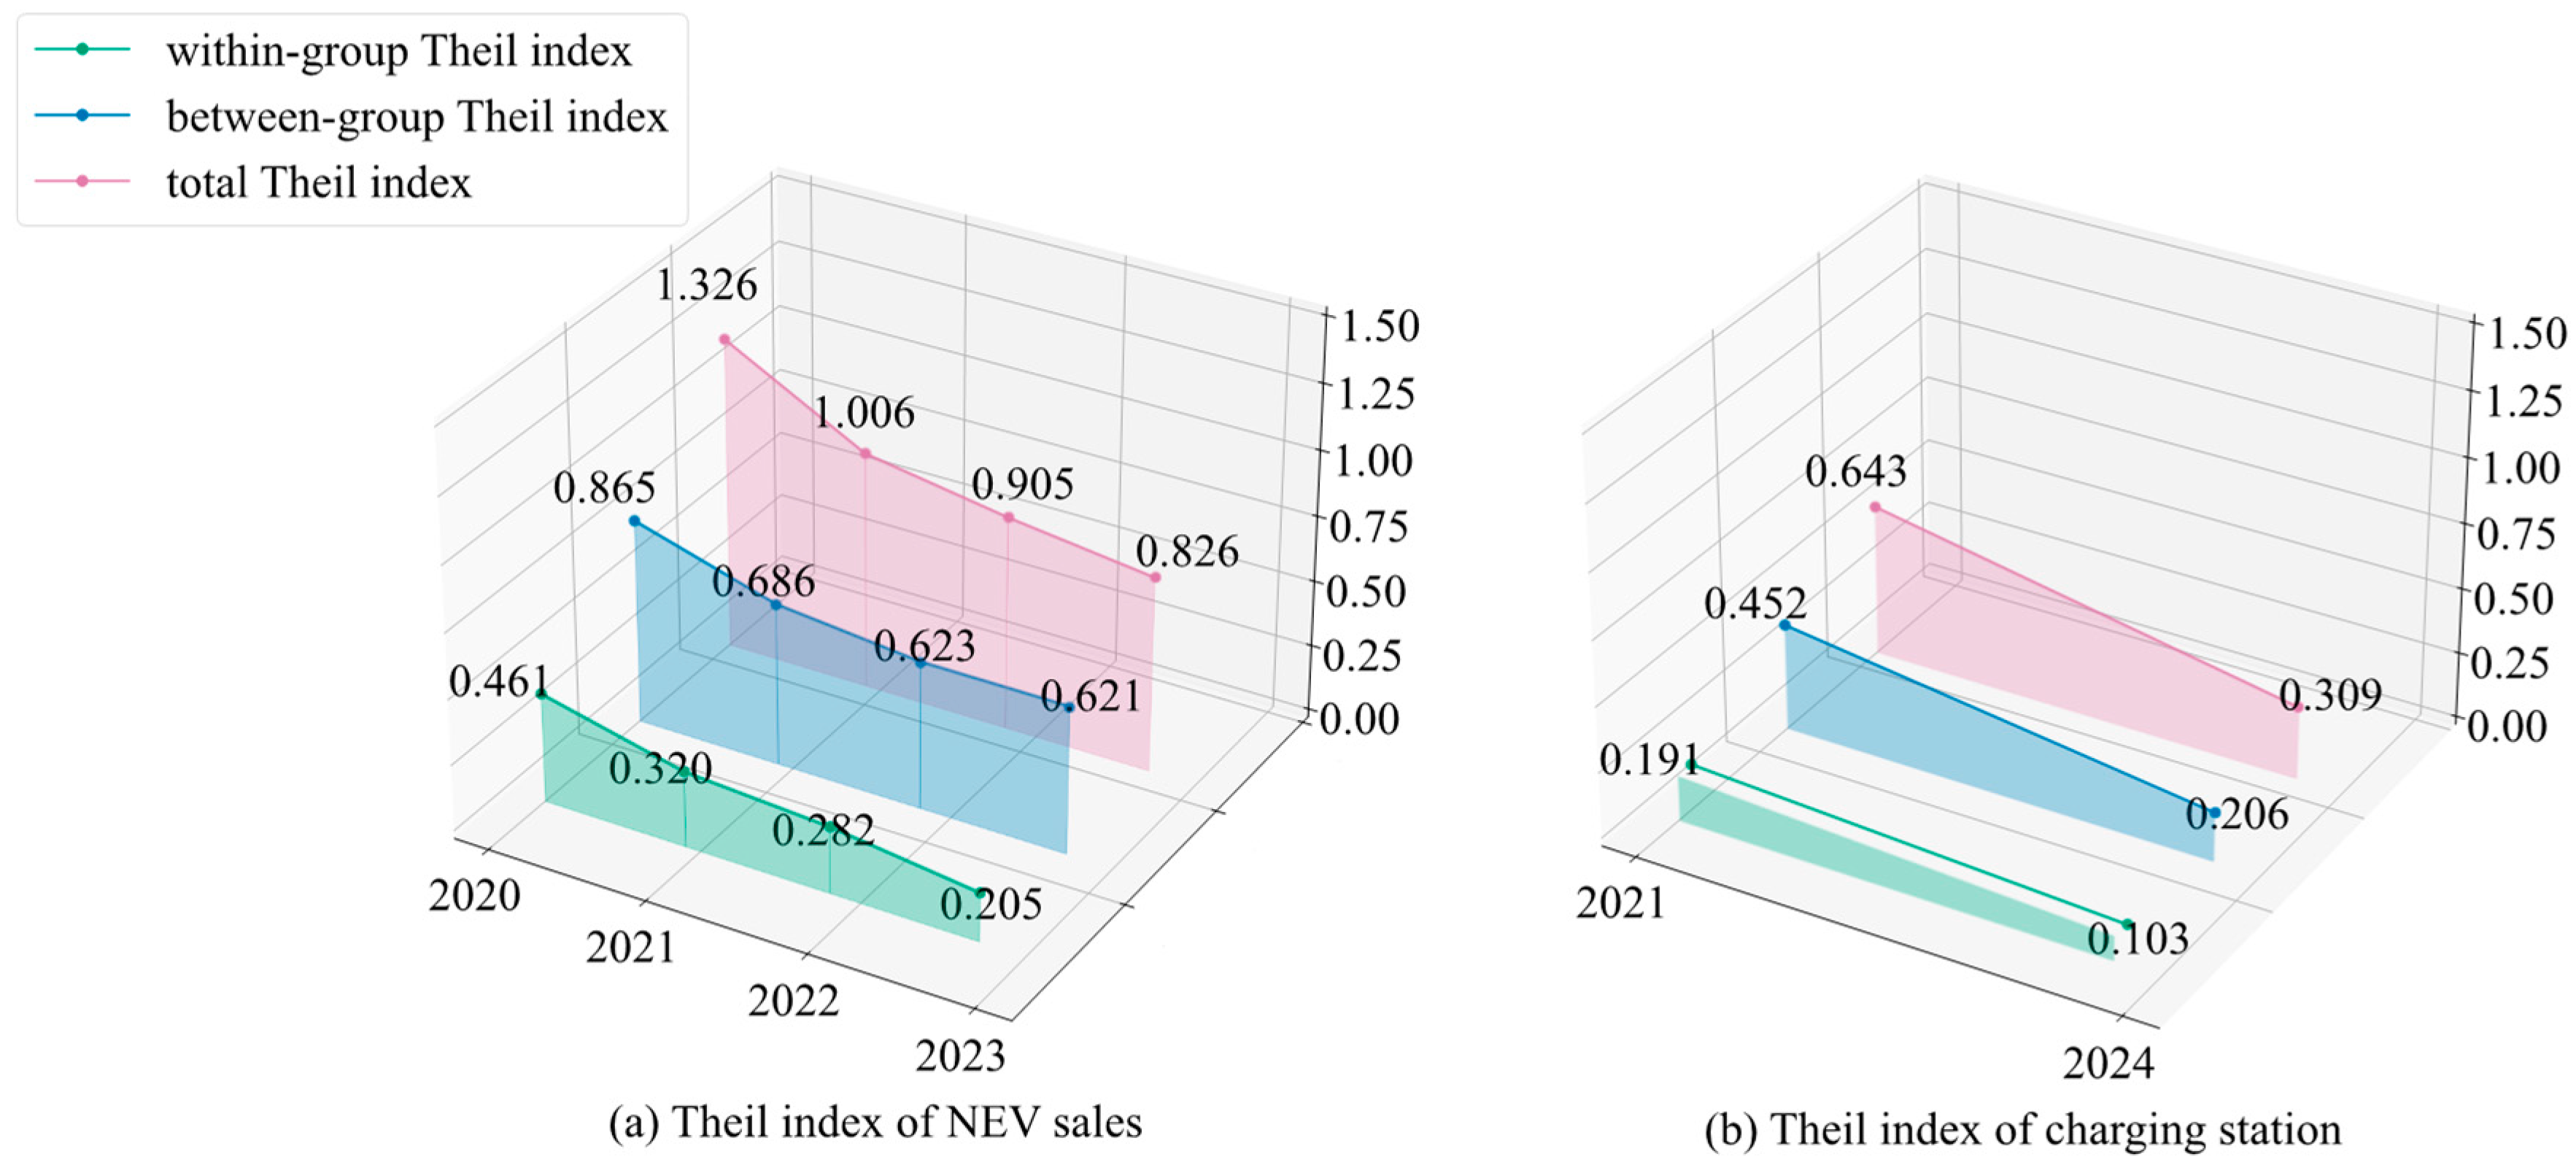
3.1.2. Theil Index
3.2. Vehicle Electrification Prevalence Analysis
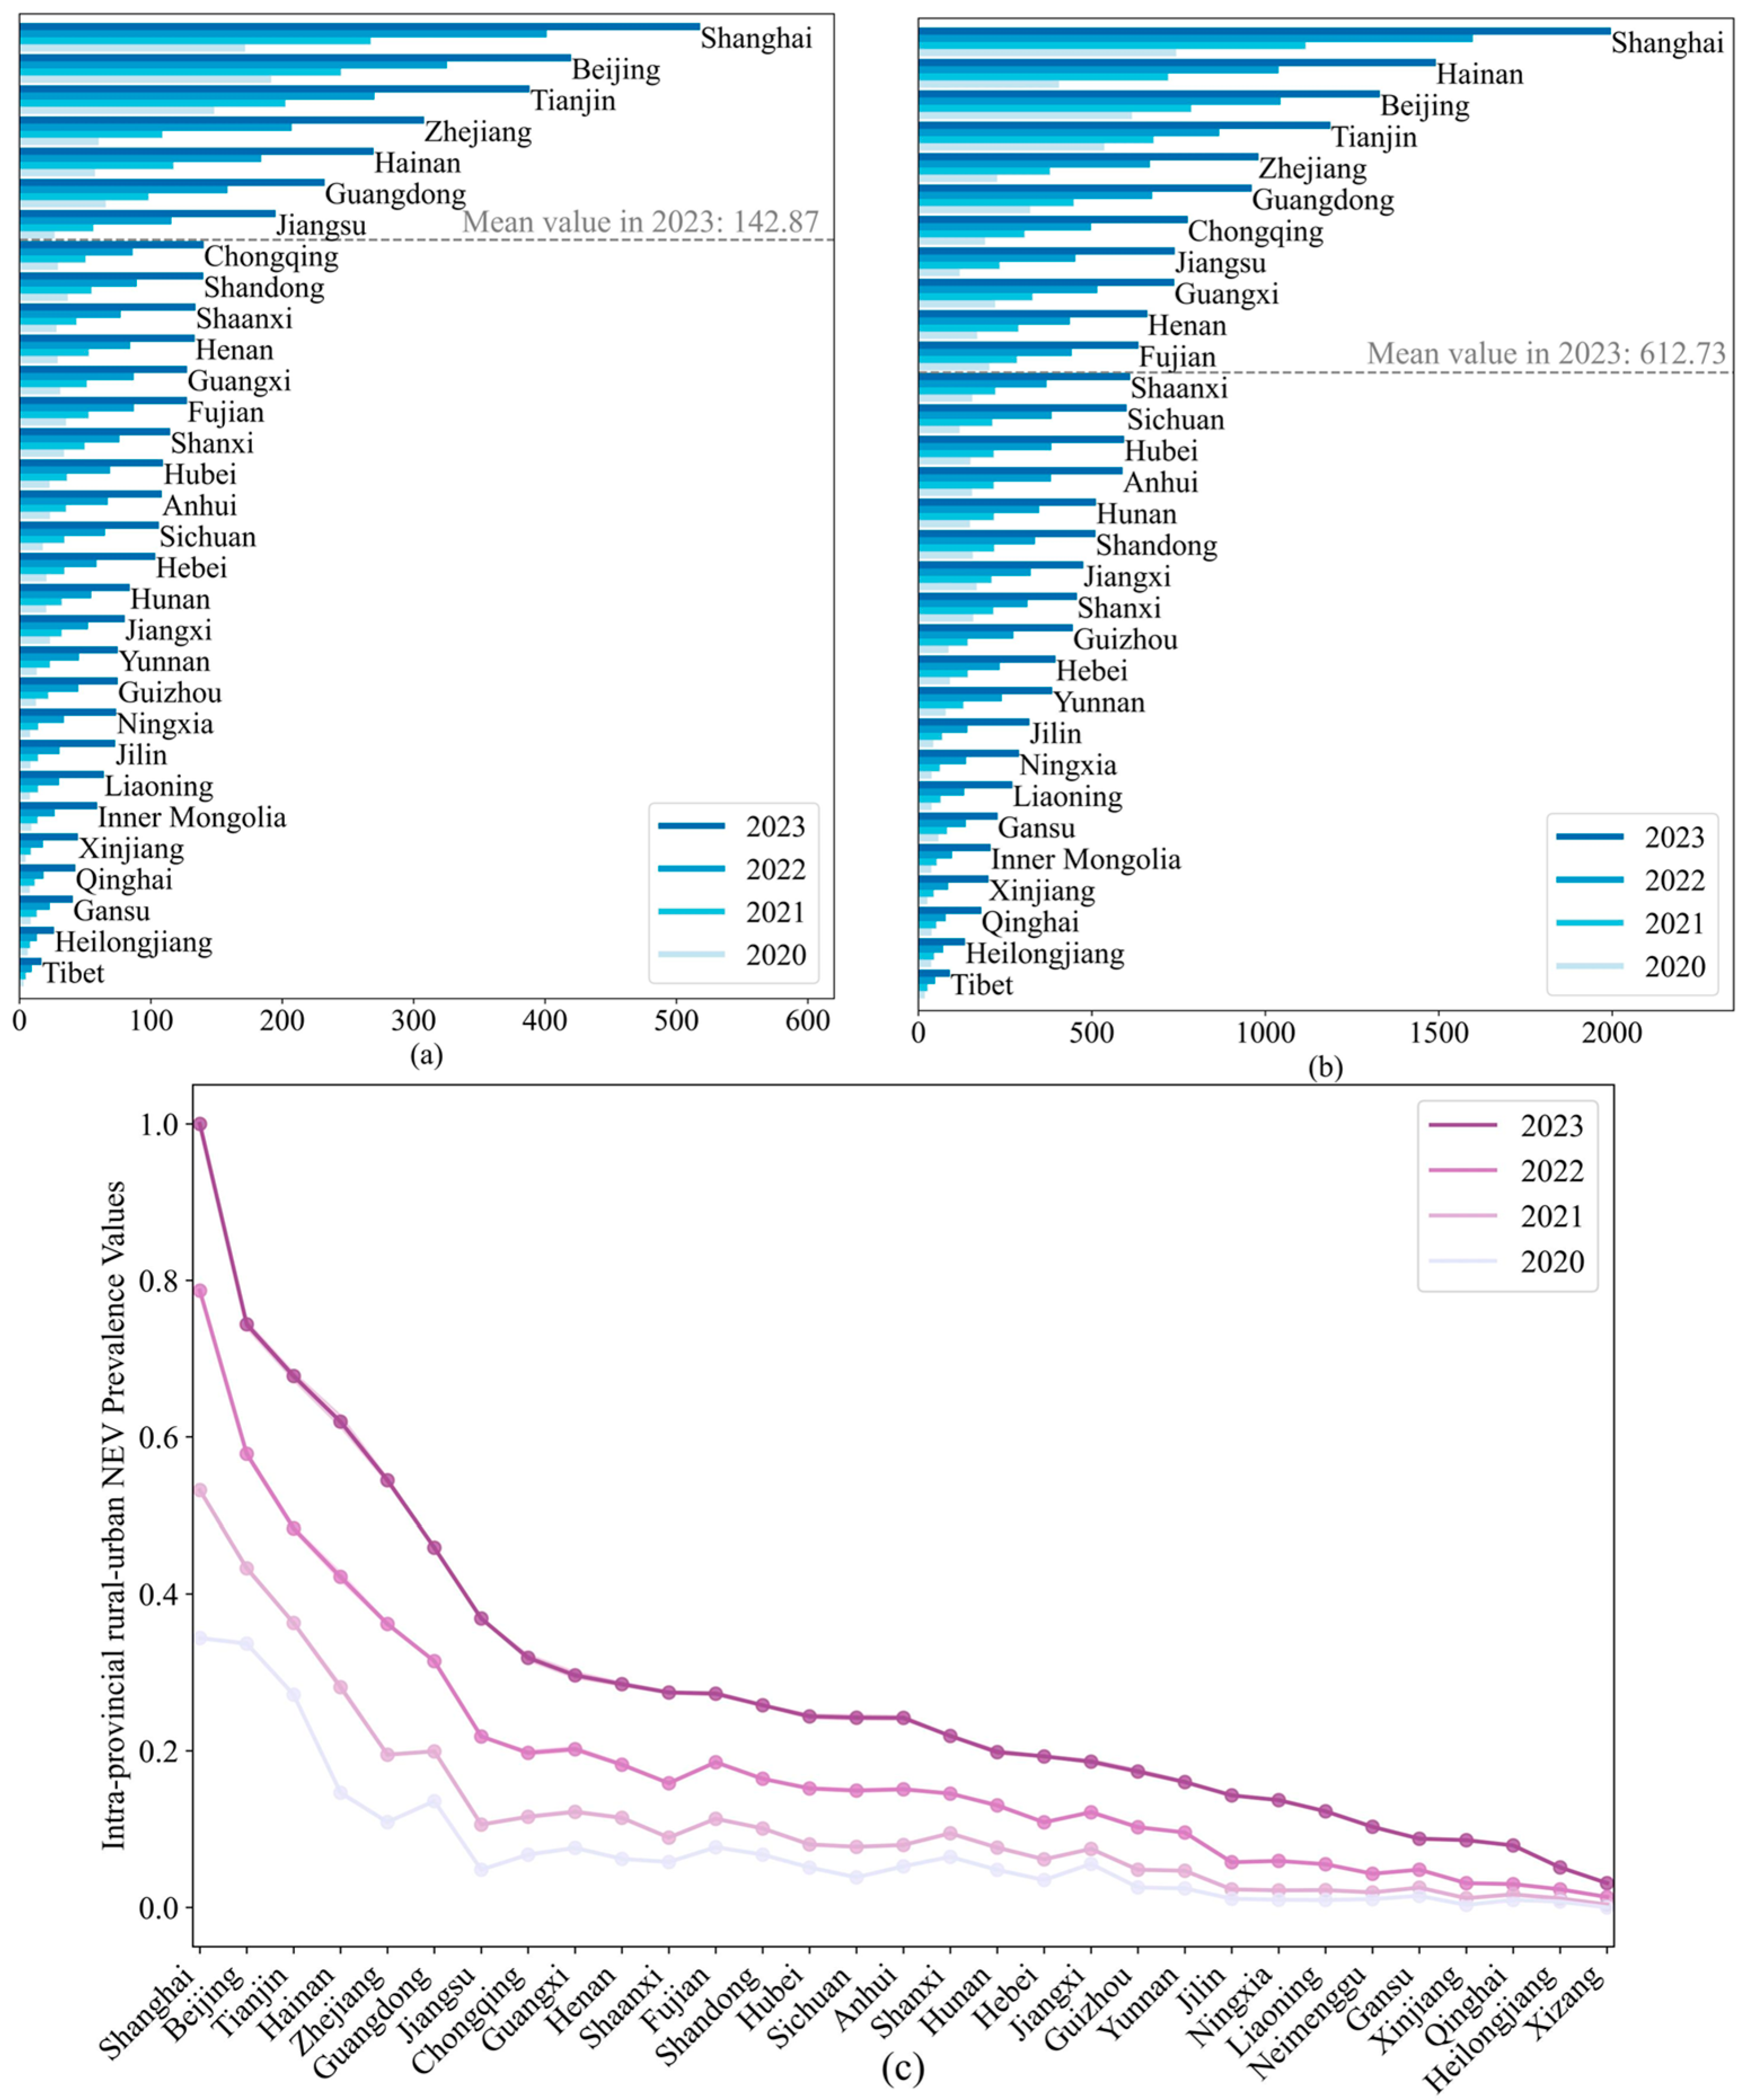
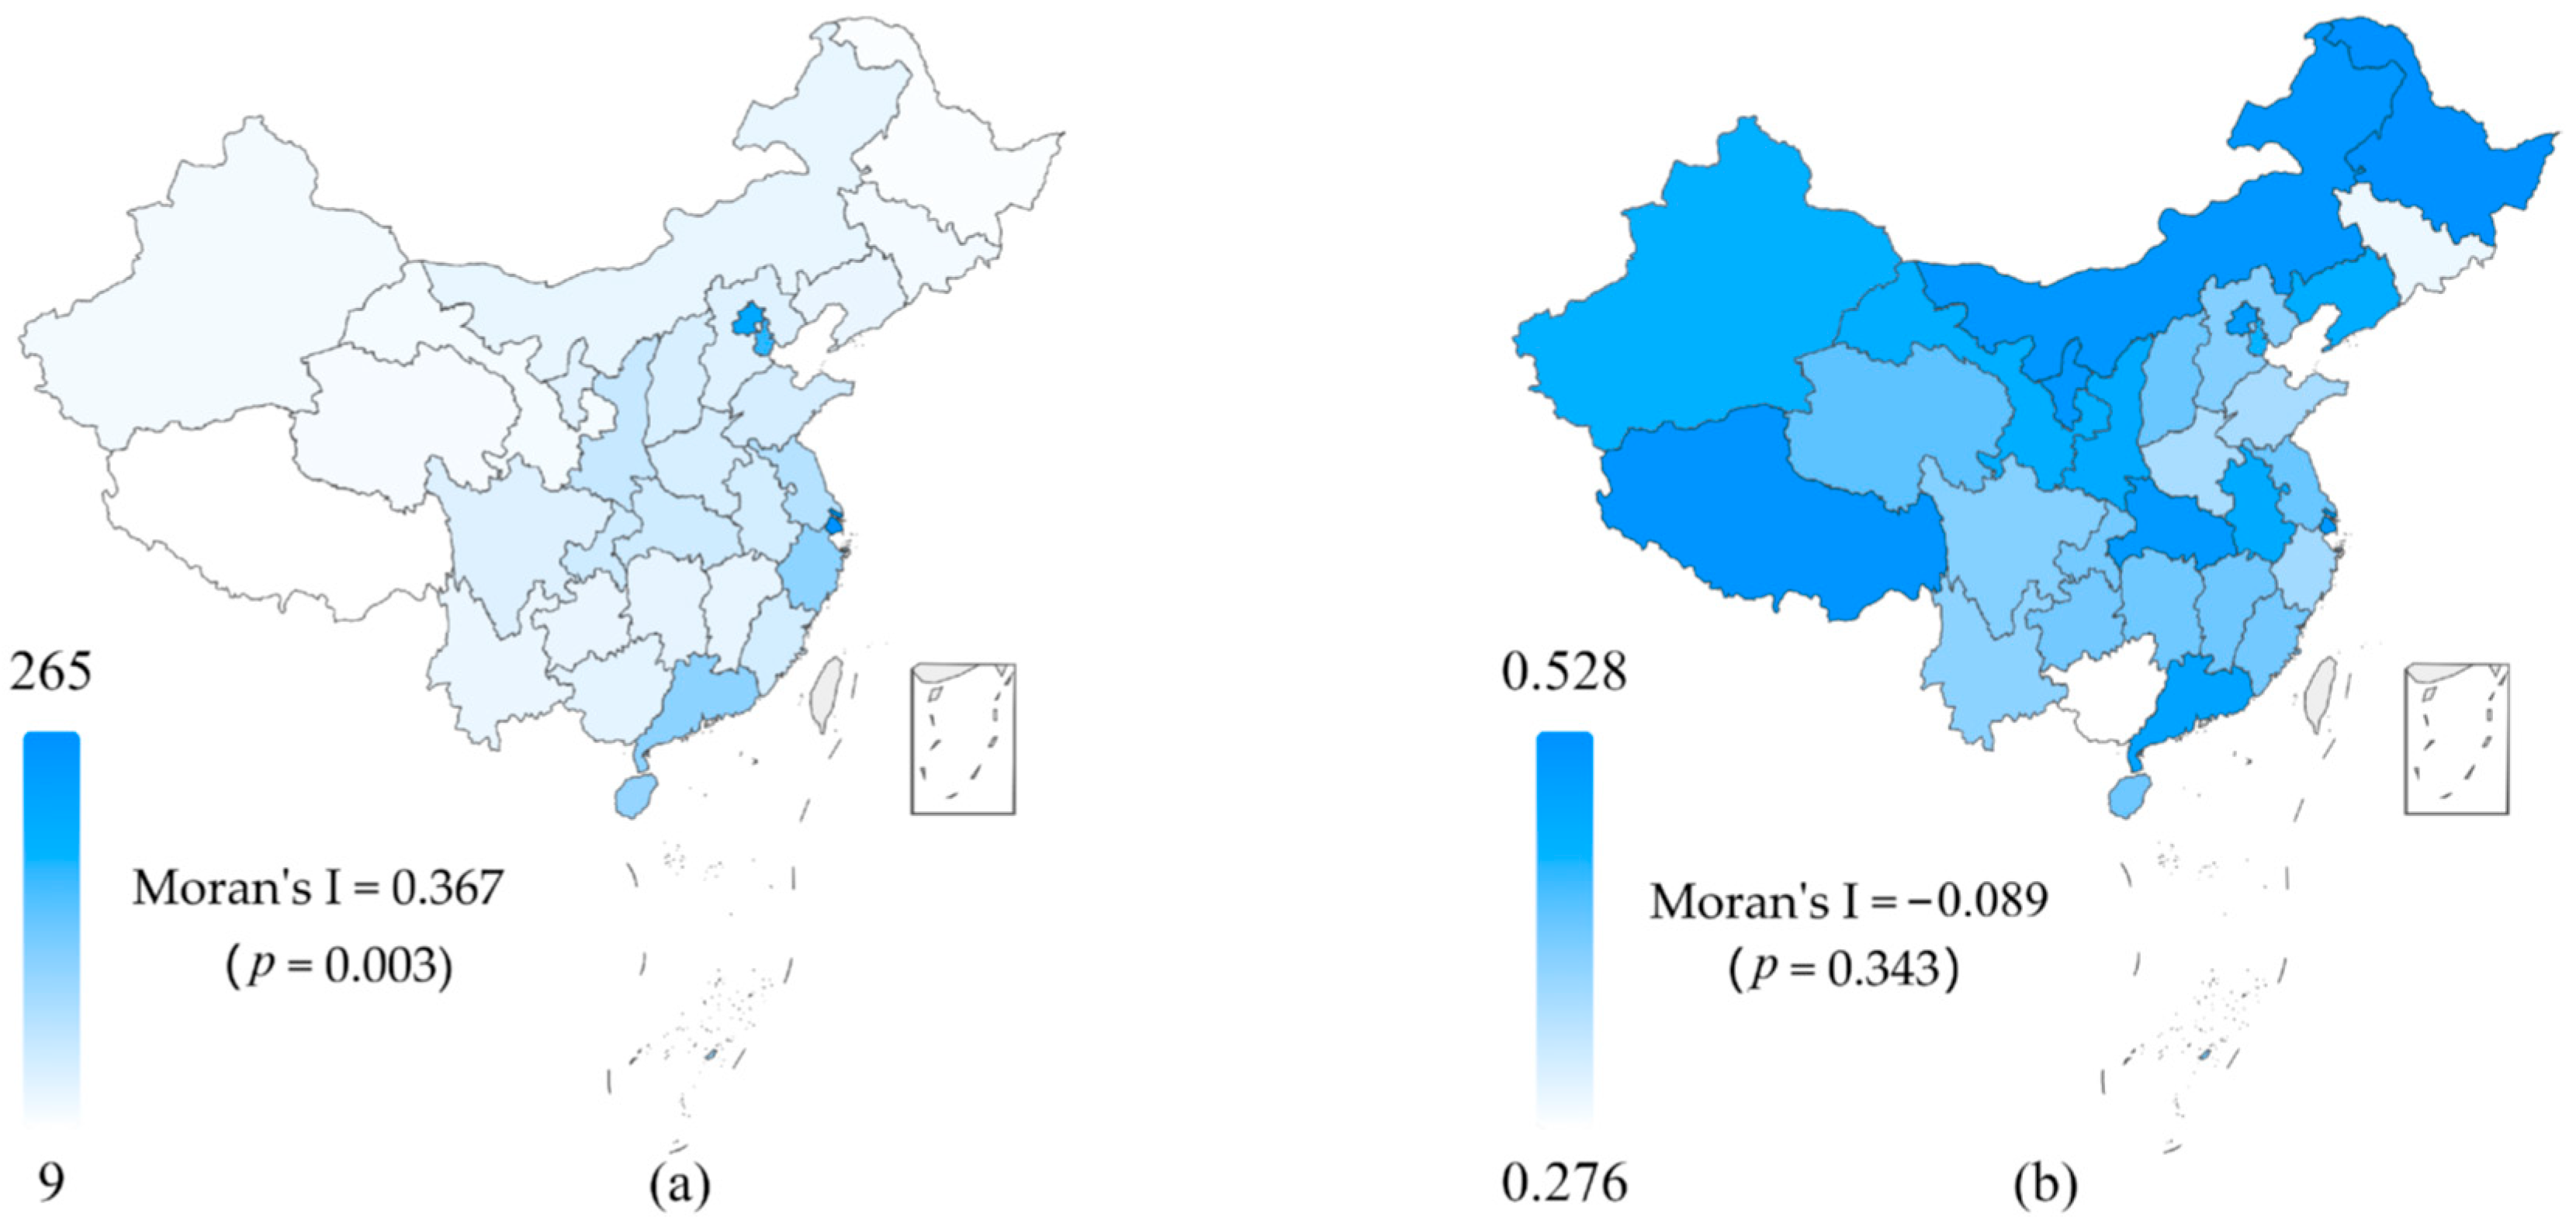
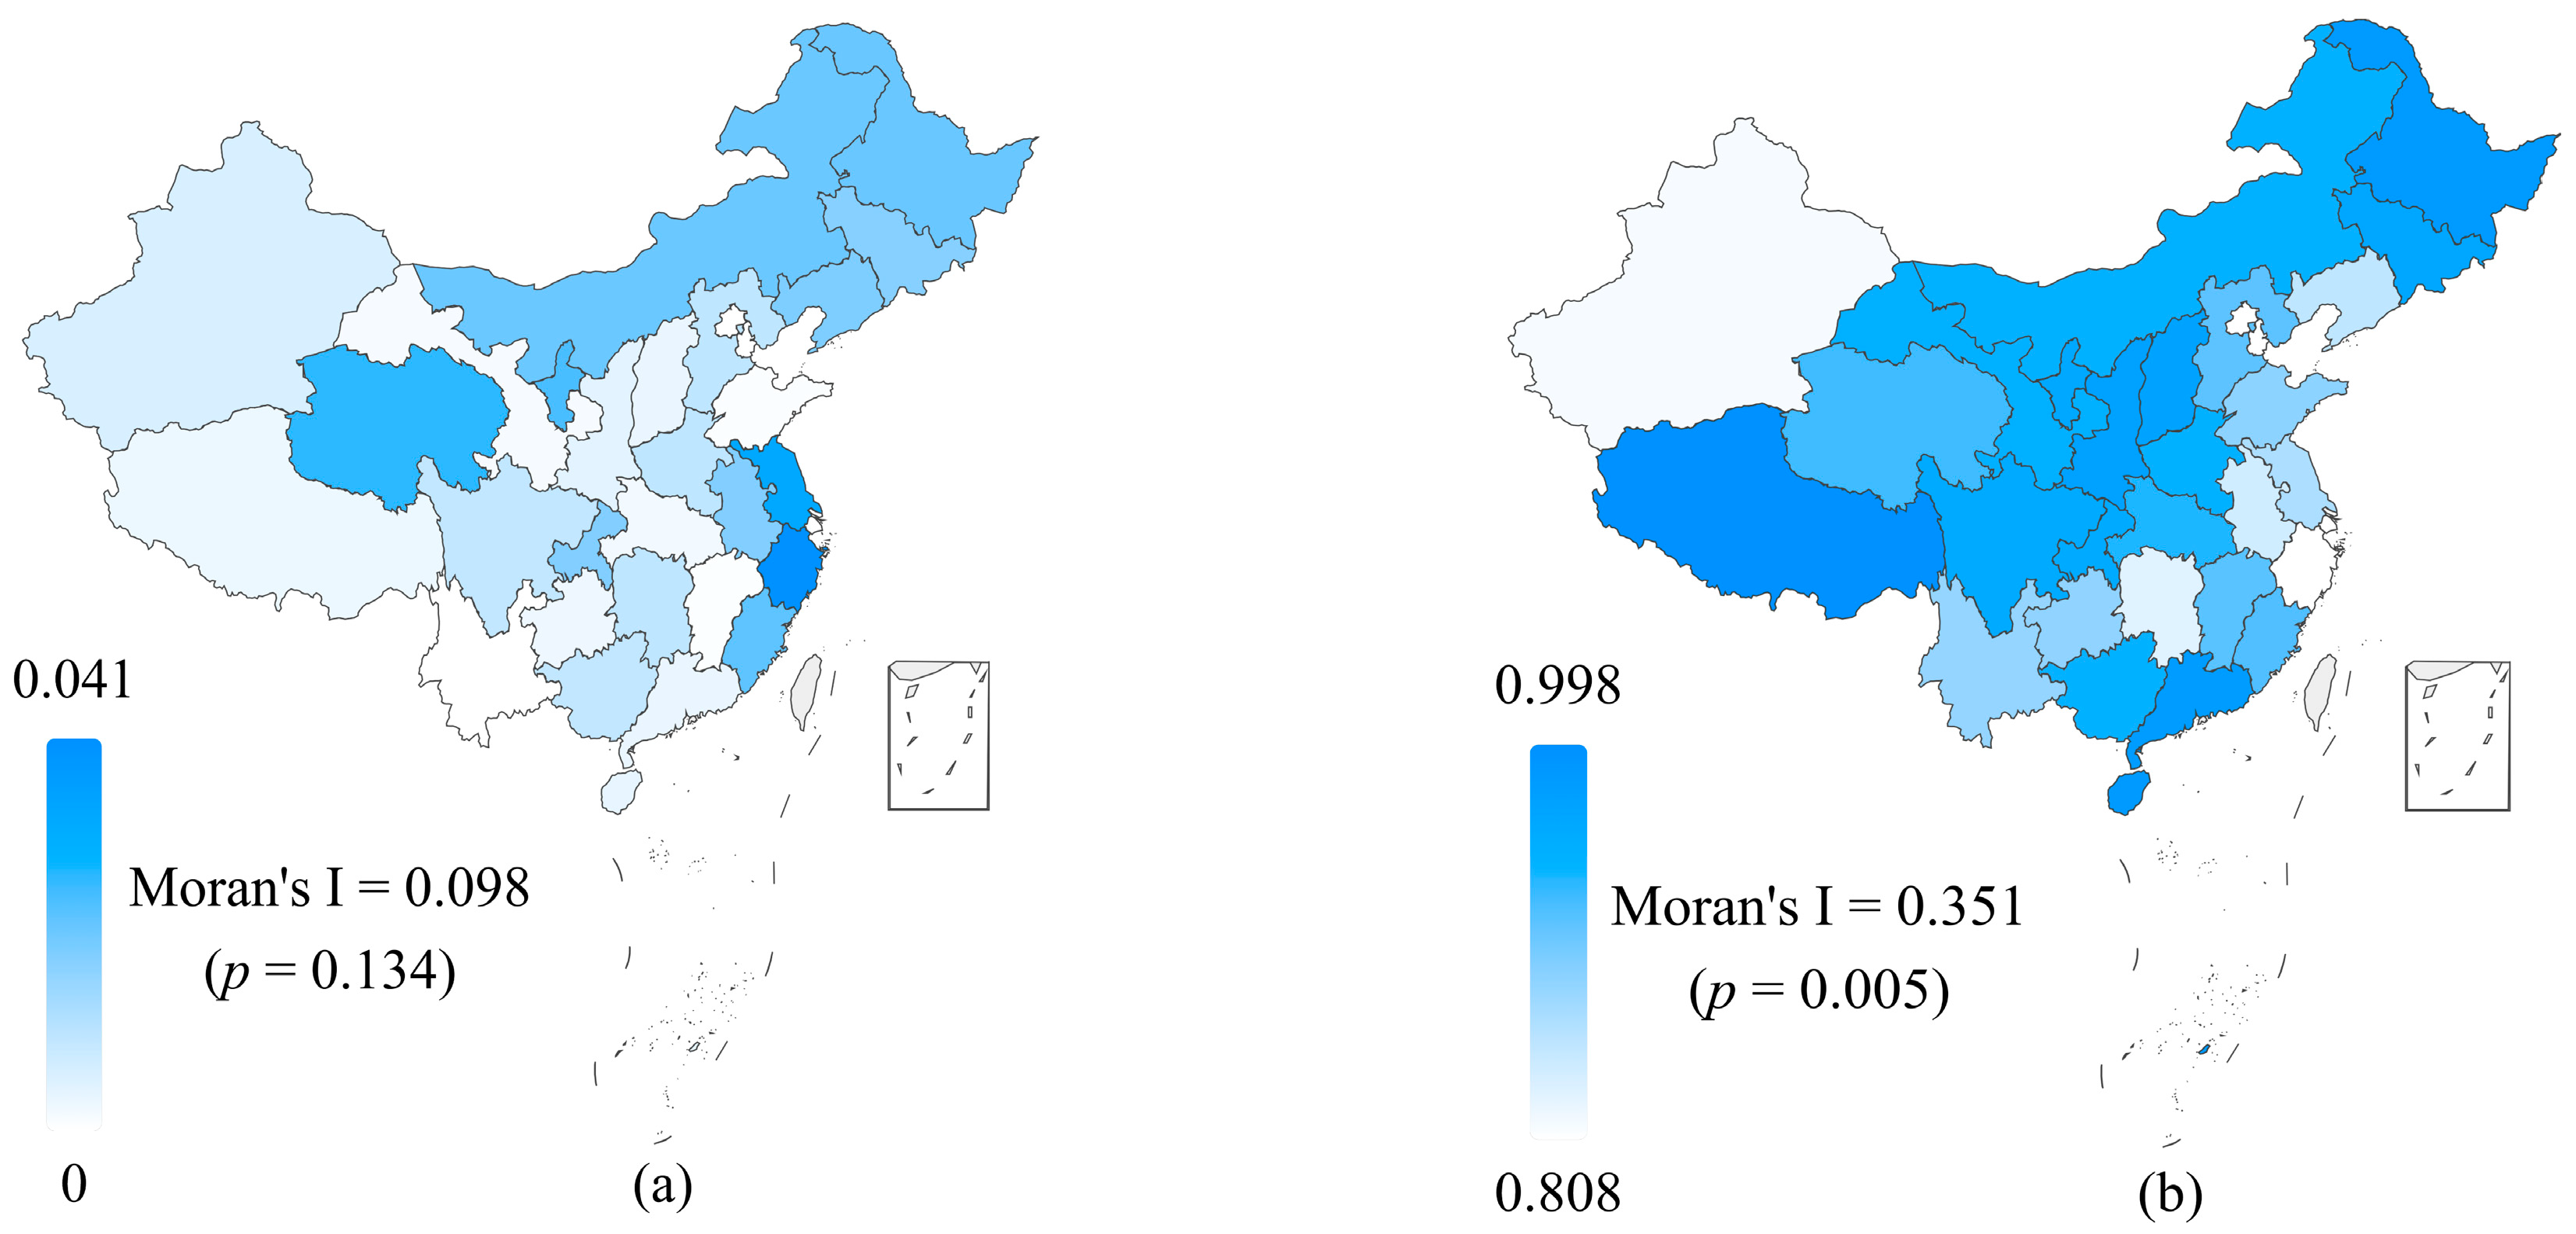
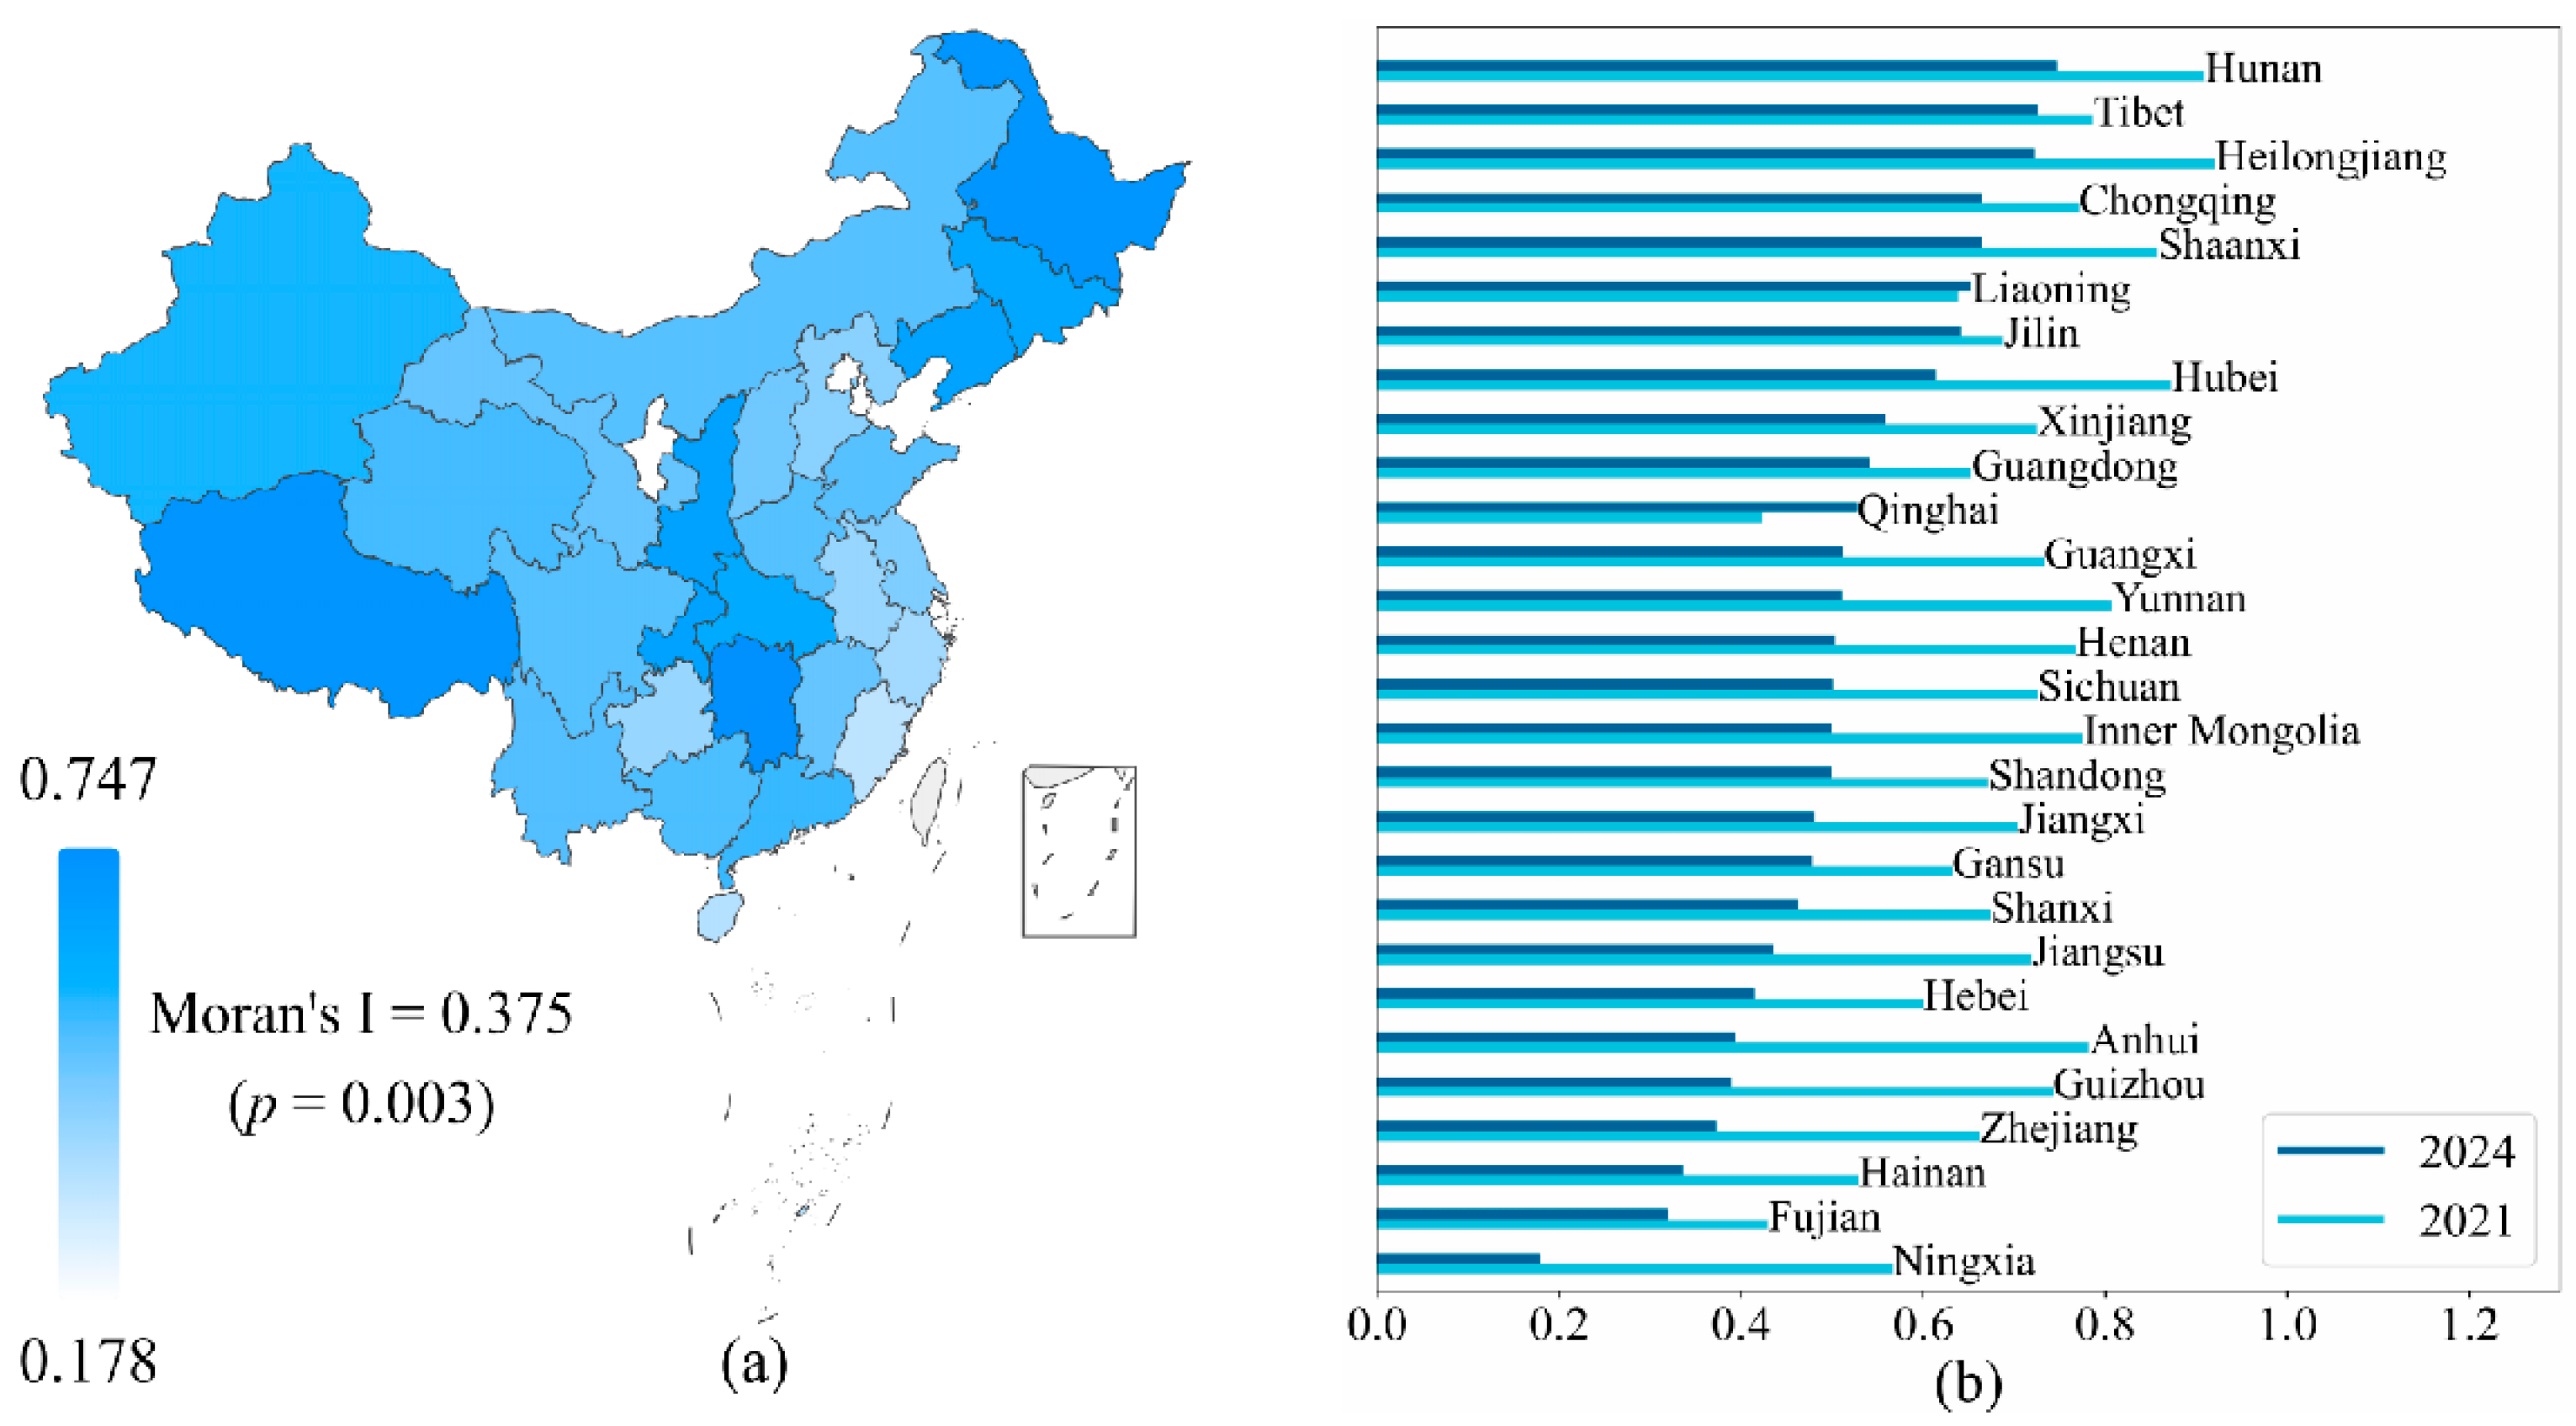
3.2.1. Inter-Provincial Vehicle Electrification Prevalence Analysis
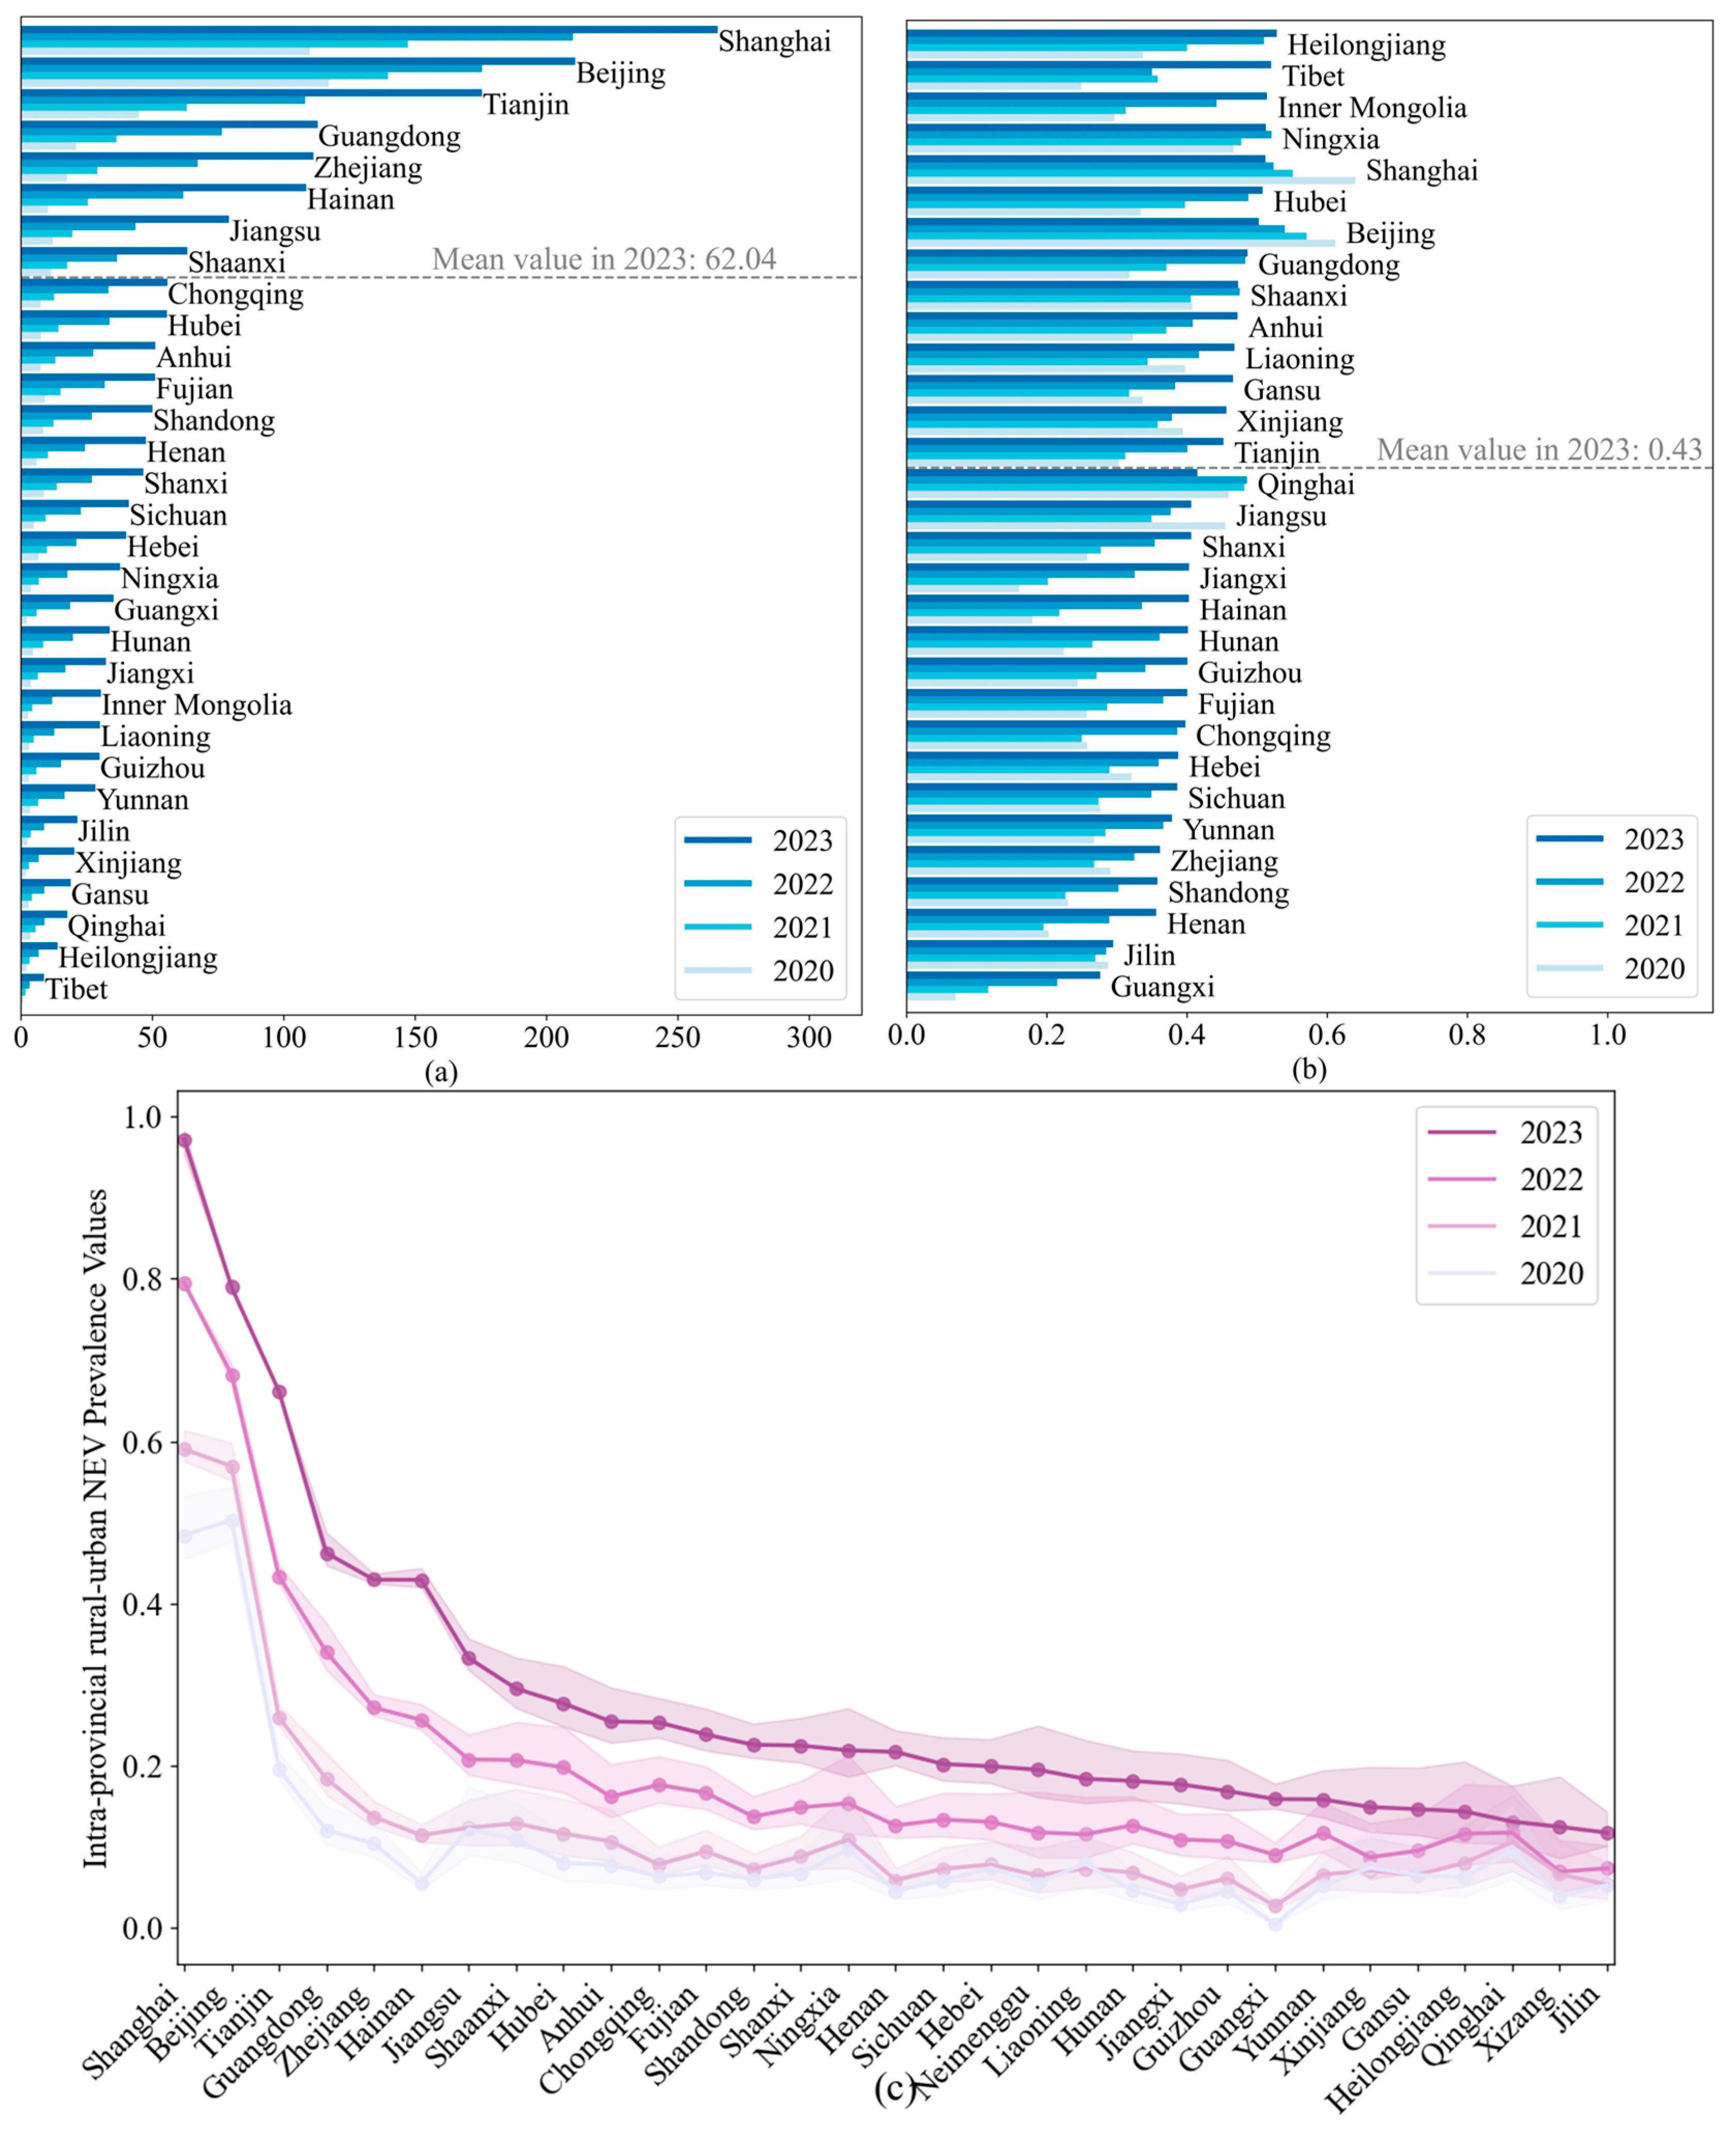
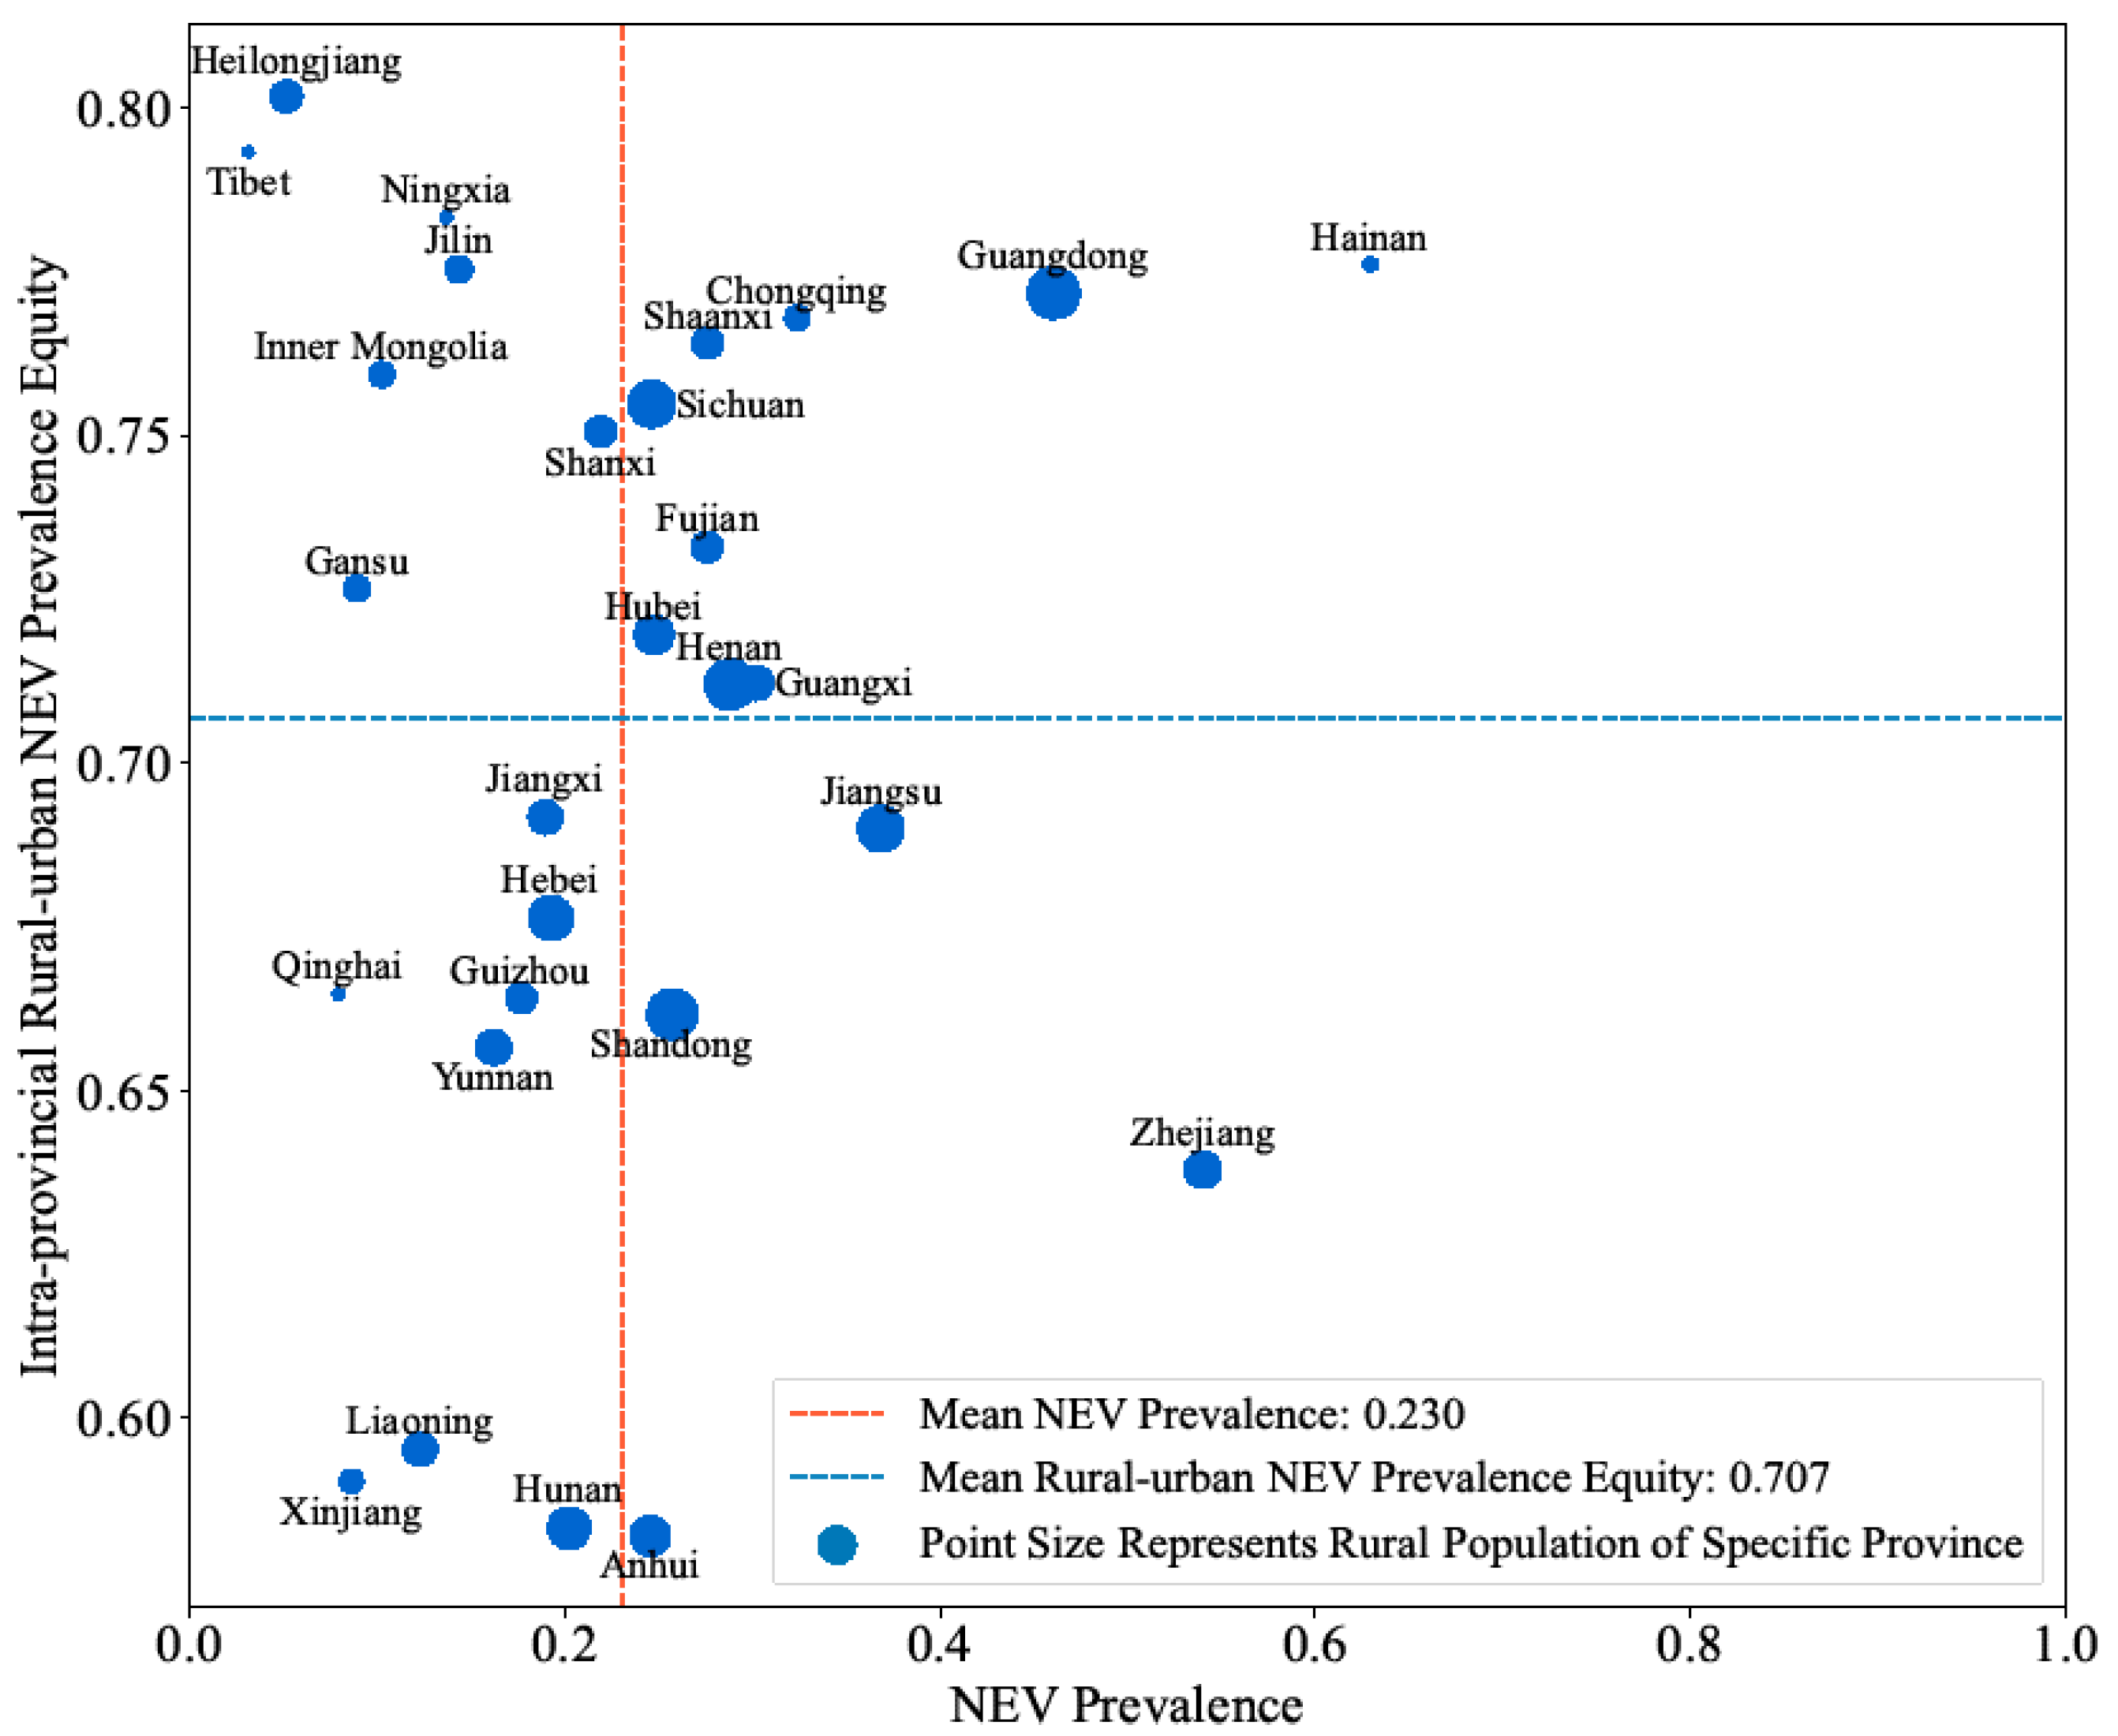
3.2.2. Intra-Provincial Rural–Urban Vehicle Electrification Prevalence Analysis
3.3. Correlation Analysis
4. Conclusions and Policy Implications
Author Contributions
Funding
Institutional Review Board Statement
Informed Consent Statement
Data Availability Statement
Acknowledgments
Conflicts of Interest
References
- Khan, H.A.U.; Price, S.; Avraam, C.; Dvorkin, Y. Inequitable access to EV charging infrastructure. Electr. J. 2022, 35, 107096. [Google Scholar] [CrossRef]
- International Energy Agency (IEA). Global EV Outlook 2024: Moving Towards Increased Affordability. Available online: https://www.iea.org/reports/global-ev-outlook-2024 (accessed on 5 July 2024).
- Totten, S. New England Aims to Ensure Electric Vehicle Rebates Aren’t Just for Wealthy. Available online: https://www.canarymedia.com/articles/enn/new-england-aims-to-ensure-electric-vehicle-rebates-arent-just-for-wealthy (accessed on 5 February 2024).
- California Air Resources Board. CARB Approves $533 Million Funding Plan for Clean Transportation Investment. Available online: https://ww2.arb.ca.gov/news/carb-approves-533-million-funding-plan-clean-transportation-investments (accessed on 5 February 2024).
- The Social Climate Fund. Available online: https://climate.ec.europa.eu/eu-action/eu-emissions-trading-system-eu-ets/social-climate-fund_en (accessed on 5 February 2024).
- Ou, S.; Hao, X.; Lin, Z.; Wang, H.; Bouchard, J.; He, X.; Przesmitzki, S.; Wu, Z.; Zheng, J.; Lv, R.; et al. Light-duty plug-in electric vehicles in China: An overview on the market and its comparisons to the United States. Renew. Sustain. Energy Rev. 2019, 112, 747–761. [Google Scholar] [CrossRef]
- The China project. Mini Electric Cars Are Big in China—Will the Rest of the World Catch on? Available online: https://thechinaproject.com/2023/02/17/mini-electric-cars-are-big-in-china-will-the-rest-of-the-world-catch-on/ (accessed on 13 February 2024).
- Ministry of Industry and Information Technology, Ministry of Agriculture and Rural Affairs, and Ministry of Commerce. Notice on Launching the NEV Promotion Campaign in Rural Areas. Available online: https://m.mofcom.gov.cn/article/gztz/202007/20200702983138.shtml (accessed on 22 May 2025).
- Liu, T.; Meidani, H. Optimizing seismic retrofit of bridges: Integrating efficient graph neural network surrogates and transportation equity. In Proceedings of the Cyber-Physical Systems and Internet of Things Week, San Antonio, TX, USA, 9–12 May 2023; pp. 367–372. [Google Scholar] [CrossRef]
- Li, S.; Zhou, Y. Integrating equity and efficiency into urban logistics resilience under emergency lockdowns. Transp. Res. Part E Logist. Transp. Rev. 2024, 183, 103446. [Google Scholar] [CrossRef]
- Ju, Y.; Cushing, L.J.; Morello-Frosch, R. An equity analysis of clean vehicle rebate programs in California. Clim. Change 2020, 162, 2087–2105. [Google Scholar] [CrossRef]
- Caulfield, B.; Furszyfer, D.; Stefaniec, A.; Foley, A. Measuring the equity impacts of government subsidies for electric vehicles. Energy 2022, 248, 123588. [Google Scholar] [CrossRef]
- Williams, B.D. Assessing progress and equity in the distribution of electric vehicle rebates using appropriate comparisons. Transp. Policy 2023, 137, 141–151. [Google Scholar] [CrossRef]
- Falchetta, G.; Noussan, M. Electric vehicle charging network in Europe: An accessibility and deployment trends analysis. Transp. Res. Part D Transp. Environ. 2021, 94, 102813. [Google Scholar] [CrossRef]
- Hsu, C.W.; Fingerman, K. Public electric vehicle charger access disparities across race and income in California. Transp. Policy 2021, 100, 59–67. [Google Scholar] [CrossRef]
- Roy, A.; Law, M. Examining spatial disparities in electric vehicle charging station placements using machine learning. Sustain. Cities Soc. 2022, 83, 103978. [Google Scholar] [CrossRef]
- Jiao, J.; Choi, S.J.; Nguyen, C. Towards Equitable Transportation Electrification Plan: Measuring Public Electric Vehicle Charging Station Access Disparities in Austin. 2023. Available online: https://ssrn.com/abstract=4458720 (accessed on 22 May 2025).
- Peng, Z.; Wang, M.W.H.; Yang, X.; Chen, A.; Zhuge, C. An analytical framework for assessing equitable access to public electric vehicle chargers. Transp. Res. Part D Transp. Environ. 2024, 126, 103990. [Google Scholar] [CrossRef]
- Tsukiji, T.; Zhang, N.; Jiang, Q.; He, B.Y.; Ma, J. A multifaceted equity metric system for transportation electrification. IEEE Open J. Intell. Transp. Syst. 2023, 4, 690–707. [Google Scholar] [CrossRef]
- Lee, D.Y.; McDermott, M.H.; Sovacool, B.K.; Isaac, R. Toward just and equitable mobility: Socioeconomic and perceptual barriers for electric vehicles and charging infrastructure in the United States. Energy Clim. Change 2024, 5, 100146. [Google Scholar] [CrossRef]
- Ceriani, L.; Verme, P. The origins of the Gini index: Extracts from Variabilità e Mutabilità (1912) by Corrado Gini. J. Econ. Inequal. 2012, 10, 421–443. [Google Scholar] [CrossRef]
- Zhang, M.; Liu, J.; Liu, L.; Zhou, D. Inequality in urban household energy consumption for 30 Chinese provinces. Energy Policy 2023, 172, 113326. [Google Scholar] [CrossRef]
- Arbel, Y.; Fialkoff, C.; Kerner, A.; Kerner, M. Do population density, socio-economic ranking and Gini Index of cities influence infection rates from coronavirus? Israel as a case study. Ann. Reg. Sci. 2022, 68, 181–206. [Google Scholar] [CrossRef]
- Cheng, T.; Liu, C.; Yang, H.; Wang, N.; Liu, Y. From service capacity to spatial equity: Exploring a multi-stage decision-making approach for optimizing elderly-care facility distribution in the city centre of Tianjin, China. Sustain. Cities. Soc. 2022, 85, 104076. [Google Scholar] [CrossRef]
- UNRISD. Inequalities and the Post-2015 Development Agenda: A Concept Note. Geneva. 2013. Available online: https://cdn.unrisd.org/assets/library/briefs/pdf-files/02-inequalities.pdf (accessed on 18 February 2024).
- Lerman, R.I.; Yitzhaki, S. Income inequality effects by income source: A new approach and applications to the United States. Rev. Econ. Stat. 1985, 67, 151–156. [Google Scholar] [CrossRef]
- Shannon, C.E. A mathematical theory of communication. Bell Syst. Tech. J. 1948, 27, 379–423. [Google Scholar] [CrossRef]
- He, X.; He, S.Y. Using mobile phone big data and street view images to explore the mismatch between walkability and walking behavior. Transp. Res. Part A Policy Pract. 2024, 180, 103946. [Google Scholar] [CrossRef]
- China State Council. Hainan to Ban Gasoline Vehicle Sales by 2030. Available online: https://english.www.gov.cn/news/top_news/2019/03/07/content_281476552865938.htm (accessed on 18 February 2024).
- Hainan Government. To Support the Development of the Bo’ao Near-Zero Carbon Demonstration Zone, Gasoline Vehicles Are Restricted from Entering Dongyu Island. Available online: https://www.hainan.gov.cn/hainan/sxian/202503/06ae5822711e439bb5e06384c79e42c6.shtml (accessed on 22 May 2025).
- McCauley, D.; Heffron, R. Just transition: Integrating climate, energy and environmental justice. Energy Policy 2018, 119, 1–7. [Google Scholar] [CrossRef]
- Yaohai District Government. Anhui Province Allocates 170 Million Yuan to Subsidize Rural NEV Purchases in 2024. 2024. Available online: https://www.hfyaohai.gov.cn/zwdt/bmts/11419135.html (accessed on 3 June 2025).
- Jaguemont, J.; Boulon, L.; Dubé, Y. A comprehensive review of lithium-ion batteries used in hybrid and electric vehicles at cold temperatures. Appl. Energy 2016, 164, 99–114. [Google Scholar] [CrossRef]
- Guan, C.; Szeto, H.; Wander, O.; Kumar, V.; Clément, R.; Zhu, Y. Fast internal preheating of 4680 lithium-ion batteries in cold environments. Nano Res. 2024, 17, 8794–8802. [Google Scholar] [CrossRef]
- The Development Research Center of the State Council (DRC). The Pace of Rural Infrastructure Development Accelerates (In Chinese). Available online: https://www.drc.gov.cn/DocView.aspx?chnid=379&leafid=1338&docid=2907061 (accessed on 28 February 2024).
- Luo, T.; Song, Y.; Li, G. An agent-based simulation study for escaping the “chicken-egg” dilemma between electric vehicle penetration and charging infrastructure deployment. Resour. Conserv. Recycl. 2023, 194, 106966. [Google Scholar] [CrossRef]
- State Taxation Administration of China (STAC). Announcement of the Ministry of Finance, State Administration of Taxation, and Ministry of Industry and Information Technology on Continuing and Optimizing the Vehicle Purchase Tax Reduction and Exemption Policy for New Energy Vehicles (In Chinese). Available online: https://www.chinatax.gov.cn/chinatax/n371/c5205526/content.html (accessed on 5 February 2024).
- Hustle. Why Most Gas Stations Don’t Make Money from Selling Gas. Available online: https://thehustle.co/why-most-gas-stations-dont-make-money-from-selling-gas (accessed on 5 February 2024).
- China EV100. Research on the Development of Electric Vehicles in China’s Rural Areas (Version 2.0). Available online: http://www.nrdc.cn/Public/uploads/2020-07-17/5f1125d5ac64d.pdf (accessed on 21 May 2025).
- Bird, S.; Hernández, D. Policy options for the split incentive: Increasing energy efficiency for low-income renters. Energy Policy 2012, 48, 506–514. [Google Scholar] [CrossRef]
- The State Council of the People’s Republic of China. County-Level Charging and Battery Swapping Infrastructure Pilot Project Launched to Achieve “Full Township Coverage”. Available online: https://www.gov.cn/lianbo/bumen/202404/content_6945034.htm (accessed on 21 May 2025).
- Sohu News. Challenges Facing NEV Promotion in Rural Areas: Bottlenecks Lead to Lukewarm Response. Available online: https://news.sohu.com/a/830014150_121777087 (accessed on 21 May 2025).
- Caijing Auto. Why Is It Difficult to Promote NEVs in Rural Areas? Available online: https://mp.weixin.qq.com/s?__biz=MjM5NDU5NTM4MQ==&mid=2653585167&idx=4&sn=e34bfb7b6d463f42a52dd499b80b6f98 (accessed on 23 May 2025).
- Sun, Z.; Yin, H. Market Development Analysis of China’s New Energy Vehicle Charging Pile. Frontiers in Business, Economics and Management. Front. Bus. Econ. Manag. 2024, 15, 248–252. [Google Scholar] [CrossRef]
- Shan, B.; Yang, Y. From pilot projects to large-scale application: Prospects for V2G development. Smart Grid 2024, 14, 11–20. (In Chinese) [Google Scholar] [CrossRef]
- Xia, Z.; Wu, D.; Zhang, L. Economic, Functional, and Social Factors Influencing Electric Vehicles’ Adoption: An Empirical Study Based on the Diffusion of Innovation Theory. Sustainability 2022, 14, 9908. [Google Scholar] [CrossRef]


| Authors | Indicators | Spatial Scale | Equity Concept |
|---|---|---|---|
| Ju et al. (2020) [11] | Income, race, and ethnicity participation in rebate uptake | ZIP code level (CA, USA) | Distributional equity |
| Caulfield et al. (2022) [12] | Income level, vehicle ownership, subsidy distribution | Provinces and small area population statistics (SAPSs) (Ireland) | Distributional equity |
| Williams (2023) [13] | Rebate amount per capita, county rebate rate | County level (CA, USA) | Distributional equity |
| Falchetta & Noussan (2021) [14] | Charger density, accessibility scores | NUTS3 regional level (Europe) | Spatial equity |
| Hsu & Fingerman (2021) [15] | Charger access by race and income | Census block group (CA, USA | Spatial and distributional equity |
| Khan et al. (2022) [1] | Charger station counts per capita | ZIP code level (New York City, NY, USA) | Distributional equity |
| Roy & Law (2022) [16] | Predicted charger locations vs. demographics | Census tract (Orange County, CA, USA) | Spatial equity |
| Jiao et al. (2023) [17] | Charger access index combining proximity and demographics | Census block group (Austin, TX, USA) | Spatial equity |
| Peng et al. (2024) [18] | Charger access index adjusted for population and income | Tertiary population unit (TPU) level (Hong Kong, China) | Spatial and distributional equity |
| Tsukiji et al. (2023) [19] | Composite vulnerability and EV access score | Census tract and metropolitan areas (Los Angeles, CA, USA) | Distributional equity |
| Lee et al. (2024) [20] | Survey of perceptions, EV access by demographics | National (USA) | Perceptual and distributional equity |
| This paper | The per capita NEV ownership, proportion of NEVs in vehicles, per capita charging pile number, charging piles to NEVs ratio | State and urban–rural level (China) | Distributional equity |
| 2020 | 2021 | 2022 | 2023 | |
|---|---|---|---|---|
| Total NEV ownership | [0.2071, 0.4448] | [0.1941, 0.4009] | [0.1622, 0.3592] | [0.1267, 0.2950] |
| Total charging piles | [0.2703, 0.6173] | [0.2388, 0.5519] | [0.1924, 0.4375] | [0.1408, 0.3219] |
| Factors | |
|---|---|
| Technology |
|
| Organization |
|
| Environment |
|
| Total NEV Number | Total Charging Pile Number | Per Capita NEV Number | Proportion of NEVs in Vehicles | Per Capita Charging Pile Number | Charging Piles to NEVs Ratio | |
|---|---|---|---|---|---|---|
| Number of NEV companies | 0.863 *** | 0.859 *** | 0.604 *** | 0.602 *** | 0.579 ** | −0.316 |
| Population | 0.764 *** | 0.729 *** | 0.313 | 0.293 | 0.273 | −0.456 |
| Population density | 0.848 *** | 0.860 *** | 0.869 *** | 0.826 *** | 0.861 *** | −0.161 |
| High-level education ratio | 0.130 | 0.238 | 0.363 | 0.285 | 0.477 * | 0.403 |
| Per capita disposable income | 0.646 *** | 0.699 *** | 0.715 *** | 0.664 *** | 0.791 *** | 0.137 |
| GDP | 0.909 *** | 0.920 *** | 0.579 ** | 0.549 ** | 0.588 ** | −0.263 |
| Per capita GDP | 0.528 ** | 0.615 *** | 0.682 *** | 0.610 *** | 0.781 *** | 0.260 |
| Vehicle ownership | 0.819 *** | 0.798 *** | 0.397 | 0.342 | 0.379 | −0.361 |
| Per capita vehicle ownership | 0.260 | 0.309 | 0.347 | 0.156 | 0.400 * | 0.201 |
| PM2.5 reduction over five years | 0.221 | 0.189 | 0.253 | 0.207 | 0.249 | 0.238 |
| NO2 reduction over five years | 0.534 ** | 0.552 ** | 0.549 ** | 0.501 ** | 0.539 ** | 0.038 |
| Annual average temperature | 0.600 *** | 0.564 ** | 0.663 *** | 0.736 *** | 0.608 *** | −0.283 |
| Total electricity generation | 0.423 * | 0.415 * | 0.046 | −0.043 | 0.078 | −0.215 |
| Wind and solar electricity generation | −0.065 | −0.077 | -0.333 | −0.464 * | −0.310 | −0.039 |
| Total NEV number | 1 | 0.982 *** | 0.794 *** | 0.758 *** | 0.756 *** | −0.342 |
| Total charging pile number | 0.982 *** | 1 | 0.806 *** | 0.761 *** | 0.802 *** | −0.228 |
| Per capita NEV number | 0.794 *** | 0.806 *** | 1 | 0.964 *** | 0.957 *** | −0.212 |
| Proportion of NEVs in vehicles | 0.758 *** | 0.760 *** | 0.964 *** | 1 | 0.924 *** | −0.231 |
| Per capita charging pile number | 0.756 *** | 0.802 *** | 0.957 *** | 0.924 *** | 1 | −0.008 |
| Charging piles to NEVs ratio | −0.342 | −0.228 | −0.213 | −0.231 | −0.008 | 1 |
Disclaimer/Publisher’s Note: The statements, opinions and data contained in all publications are solely those of the individual author(s) and contributor(s) and not of MDPI and/or the editor(s). MDPI and/or the editor(s) disclaim responsibility for any injury to people or property resulting from any ideas, methods, instructions or products referred to in the content. |
© 2025 by the authors. Licensee MDPI, Basel, Switzerland. This article is an open access article distributed under the terms and conditions of the Creative Commons Attribution (CC BY) license (https://creativecommons.org/licenses/by/4.0/).
Share and Cite
Yan, Q.; Lin, Z.; Yin, X.; Ou, S.; Lin, P.; Ren, H. Advancing Equity in China’s Vehicle Electrification. Sustainability 2025, 17, 5378. https://doi.org/10.3390/su17125378
Yan Q, Lin Z, Yin X, Ou S, Lin P, Ren H. Advancing Equity in China’s Vehicle Electrification. Sustainability. 2025; 17(12):5378. https://doi.org/10.3390/su17125378
Chicago/Turabian StyleYan, Qianqian, Zhenhong Lin, Xiaotong Yin, Shiqi Ou, Peiqun Lin, and Huanhuan Ren. 2025. "Advancing Equity in China’s Vehicle Electrification" Sustainability 17, no. 12: 5378. https://doi.org/10.3390/su17125378
APA StyleYan, Q., Lin, Z., Yin, X., Ou, S., Lin, P., & Ren, H. (2025). Advancing Equity in China’s Vehicle Electrification. Sustainability, 17(12), 5378. https://doi.org/10.3390/su17125378