

Spatial Association Networks and Factors Influencing Ecological Security in the Yellow River Basin

Abstract
1. Introduction
2. Materials and Methods
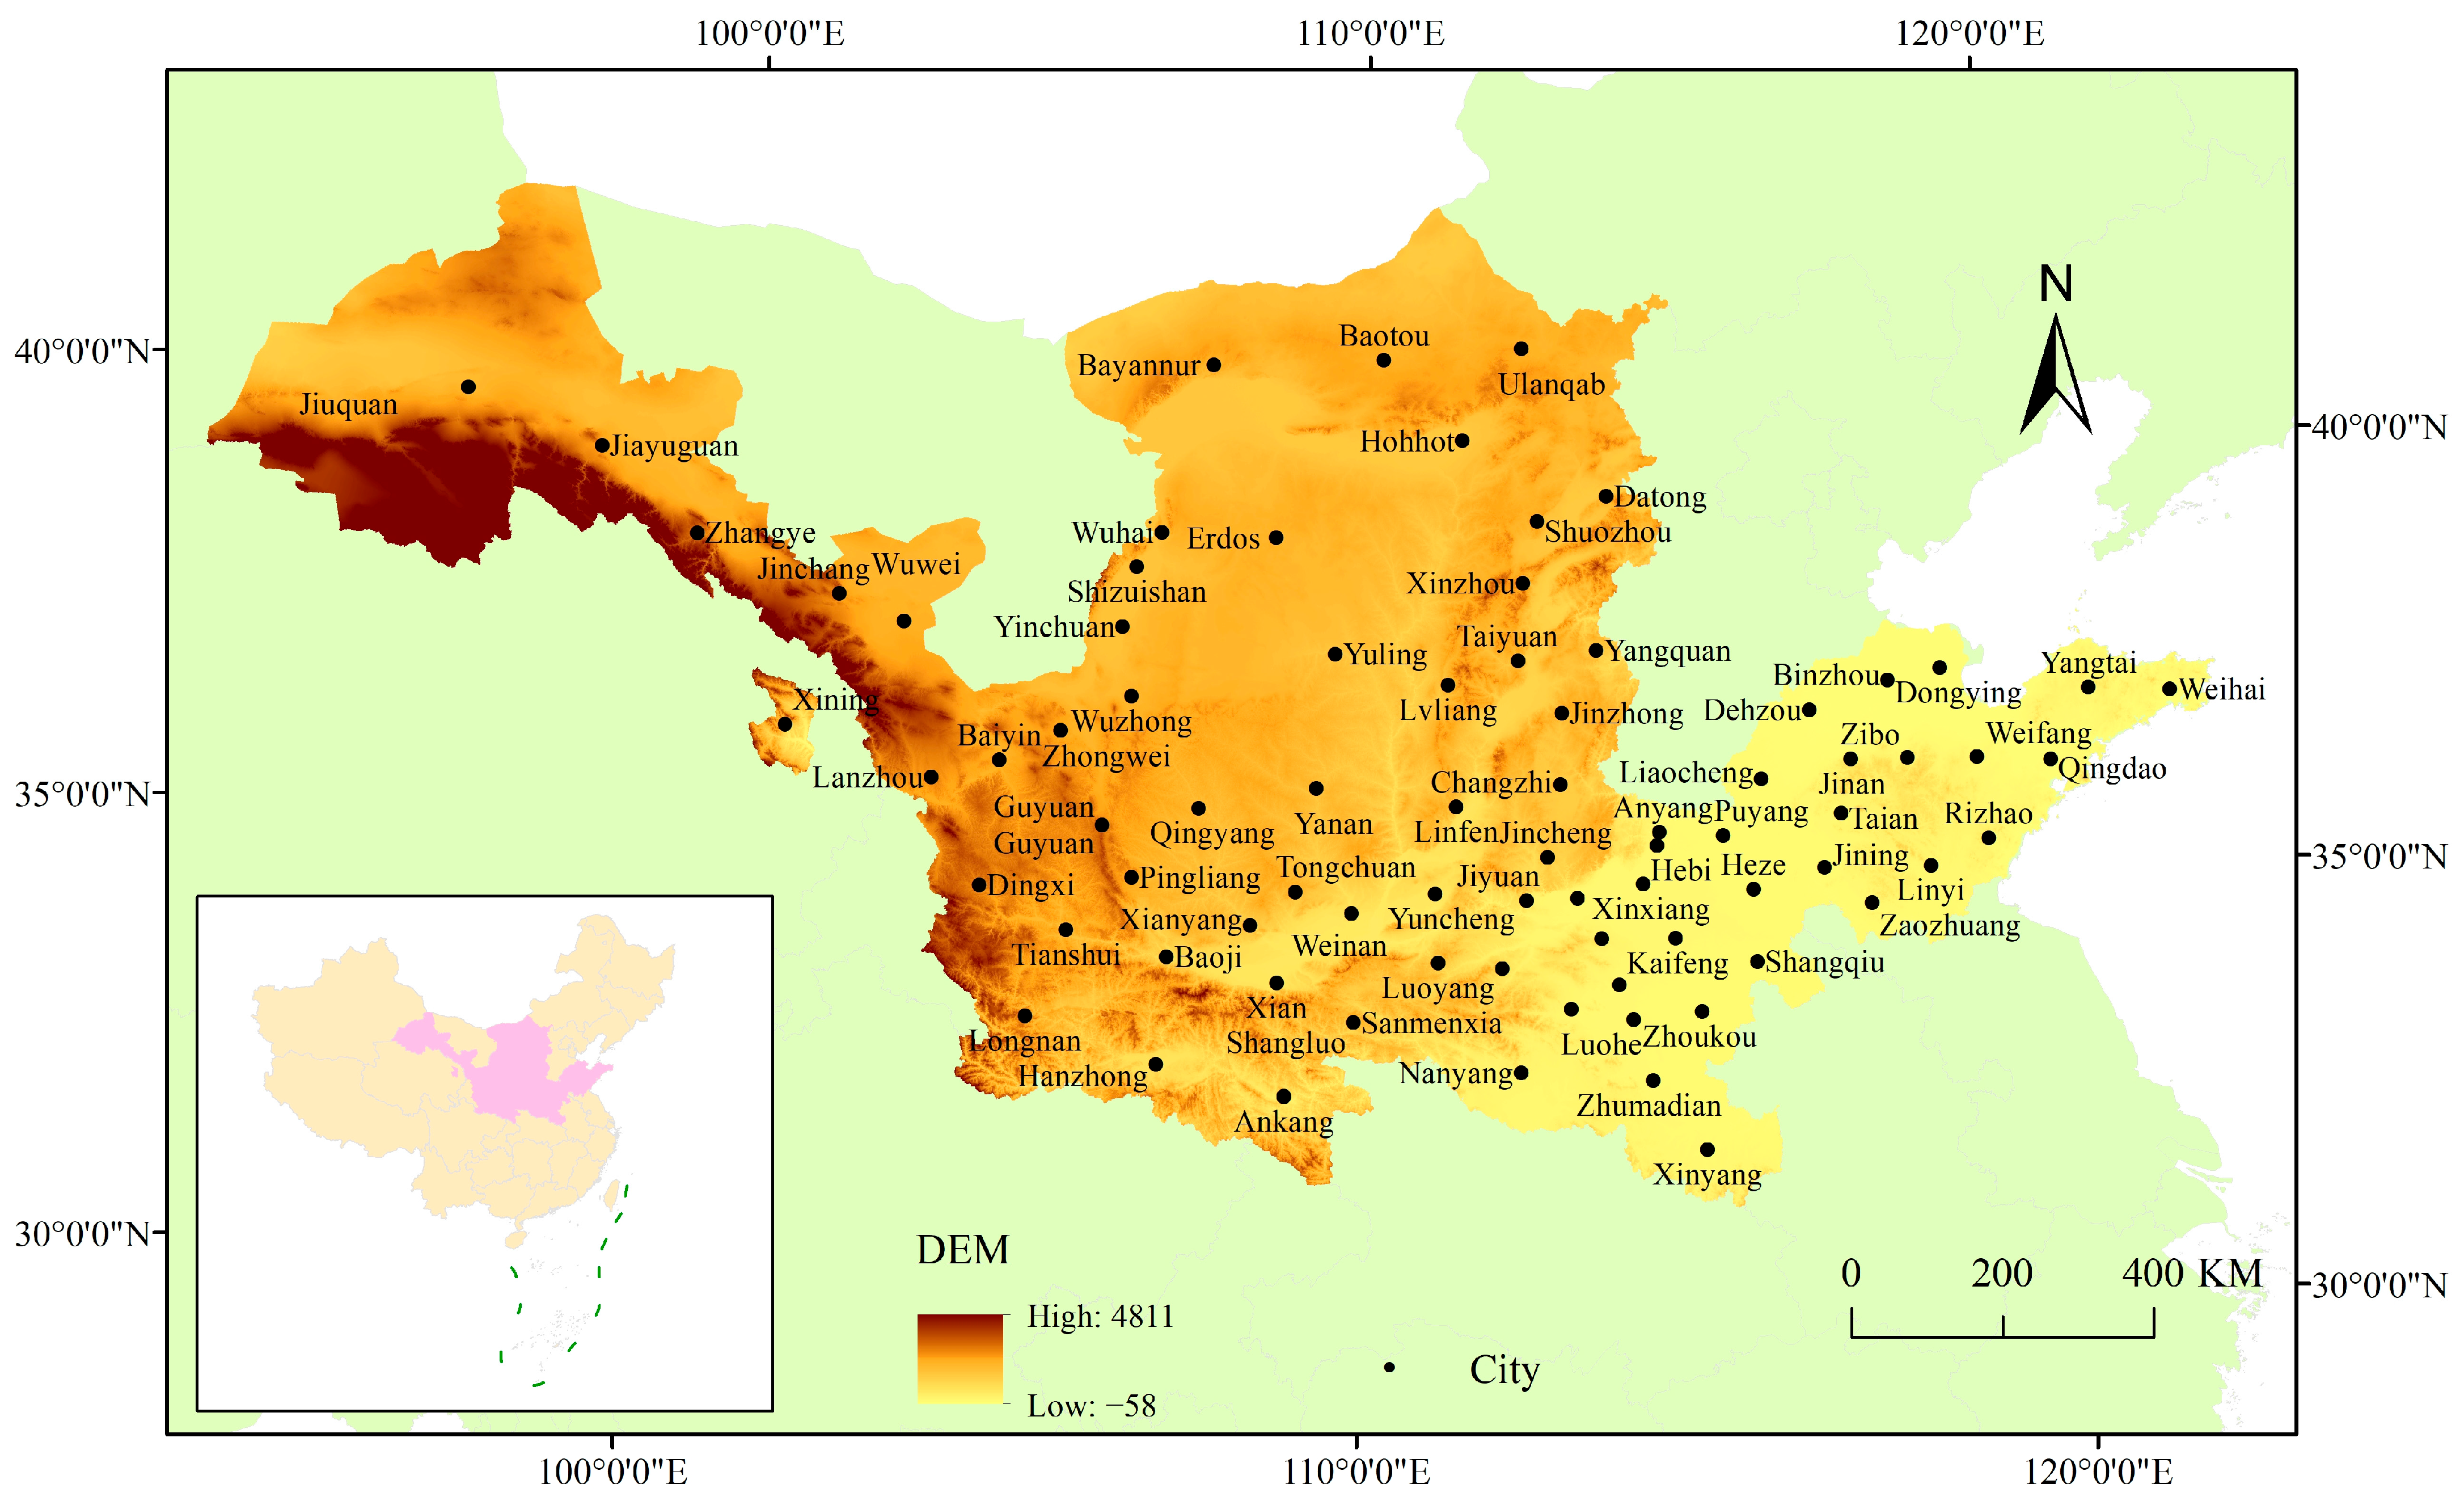
2.1. Overview of the Research Area
2.2. Data Sources
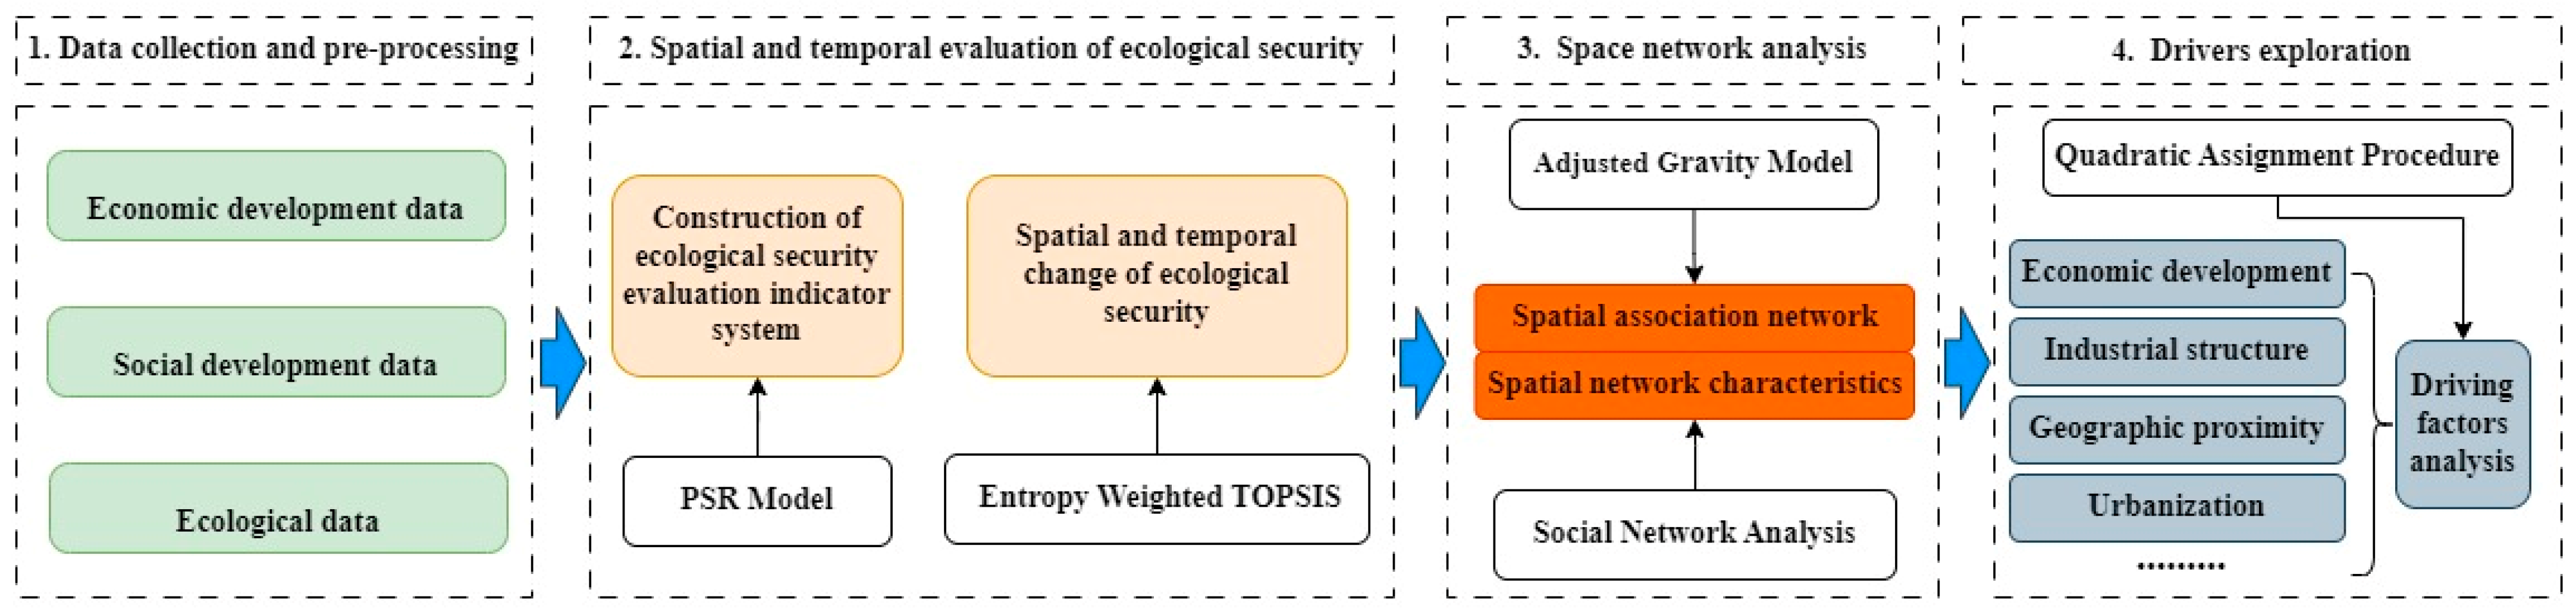
2.3. Methodology
2.3.1. Construction of Assessment System
2.3.2. Entropy Weight–TOPSIS
- (1)
- Normalization—included to mitigate variations due to size and scale disparities among indices. The extremum approach is harnessed for standardization [39].Positive indicator:Negative indicator:where is the raw data value of the index of the city.
- (2)
- Entropy weighting.where is the weight of the index, is the value of index of the city after pre-processing, is the weighted value of the index of the city, is the number of cities, and is the number of evaluation indexes. It should be noted that evaluation indicators will have zero values after standardization. Therefore, in order to avoid the occurrence of zero values that cause errors in the calculation of , a value tending towards zero is added to all evaluation index values.
- (3)
- The TOPSIS technique posits that the most favorable option should not only be in closest proximity, in terms of Euclidean distance, to the optimal solution but should also be the furthest from the least favorable one [40].
2.3.3. Spatial Association Network
2.3.4. Social Network Analysis
- (1)
- Holistic network attributes
- (2)
- Individualistic network features
2.3.5. QAP Analysis
3. Results
3.1. The Descriptive Statistical Characteristic of Ecological Security
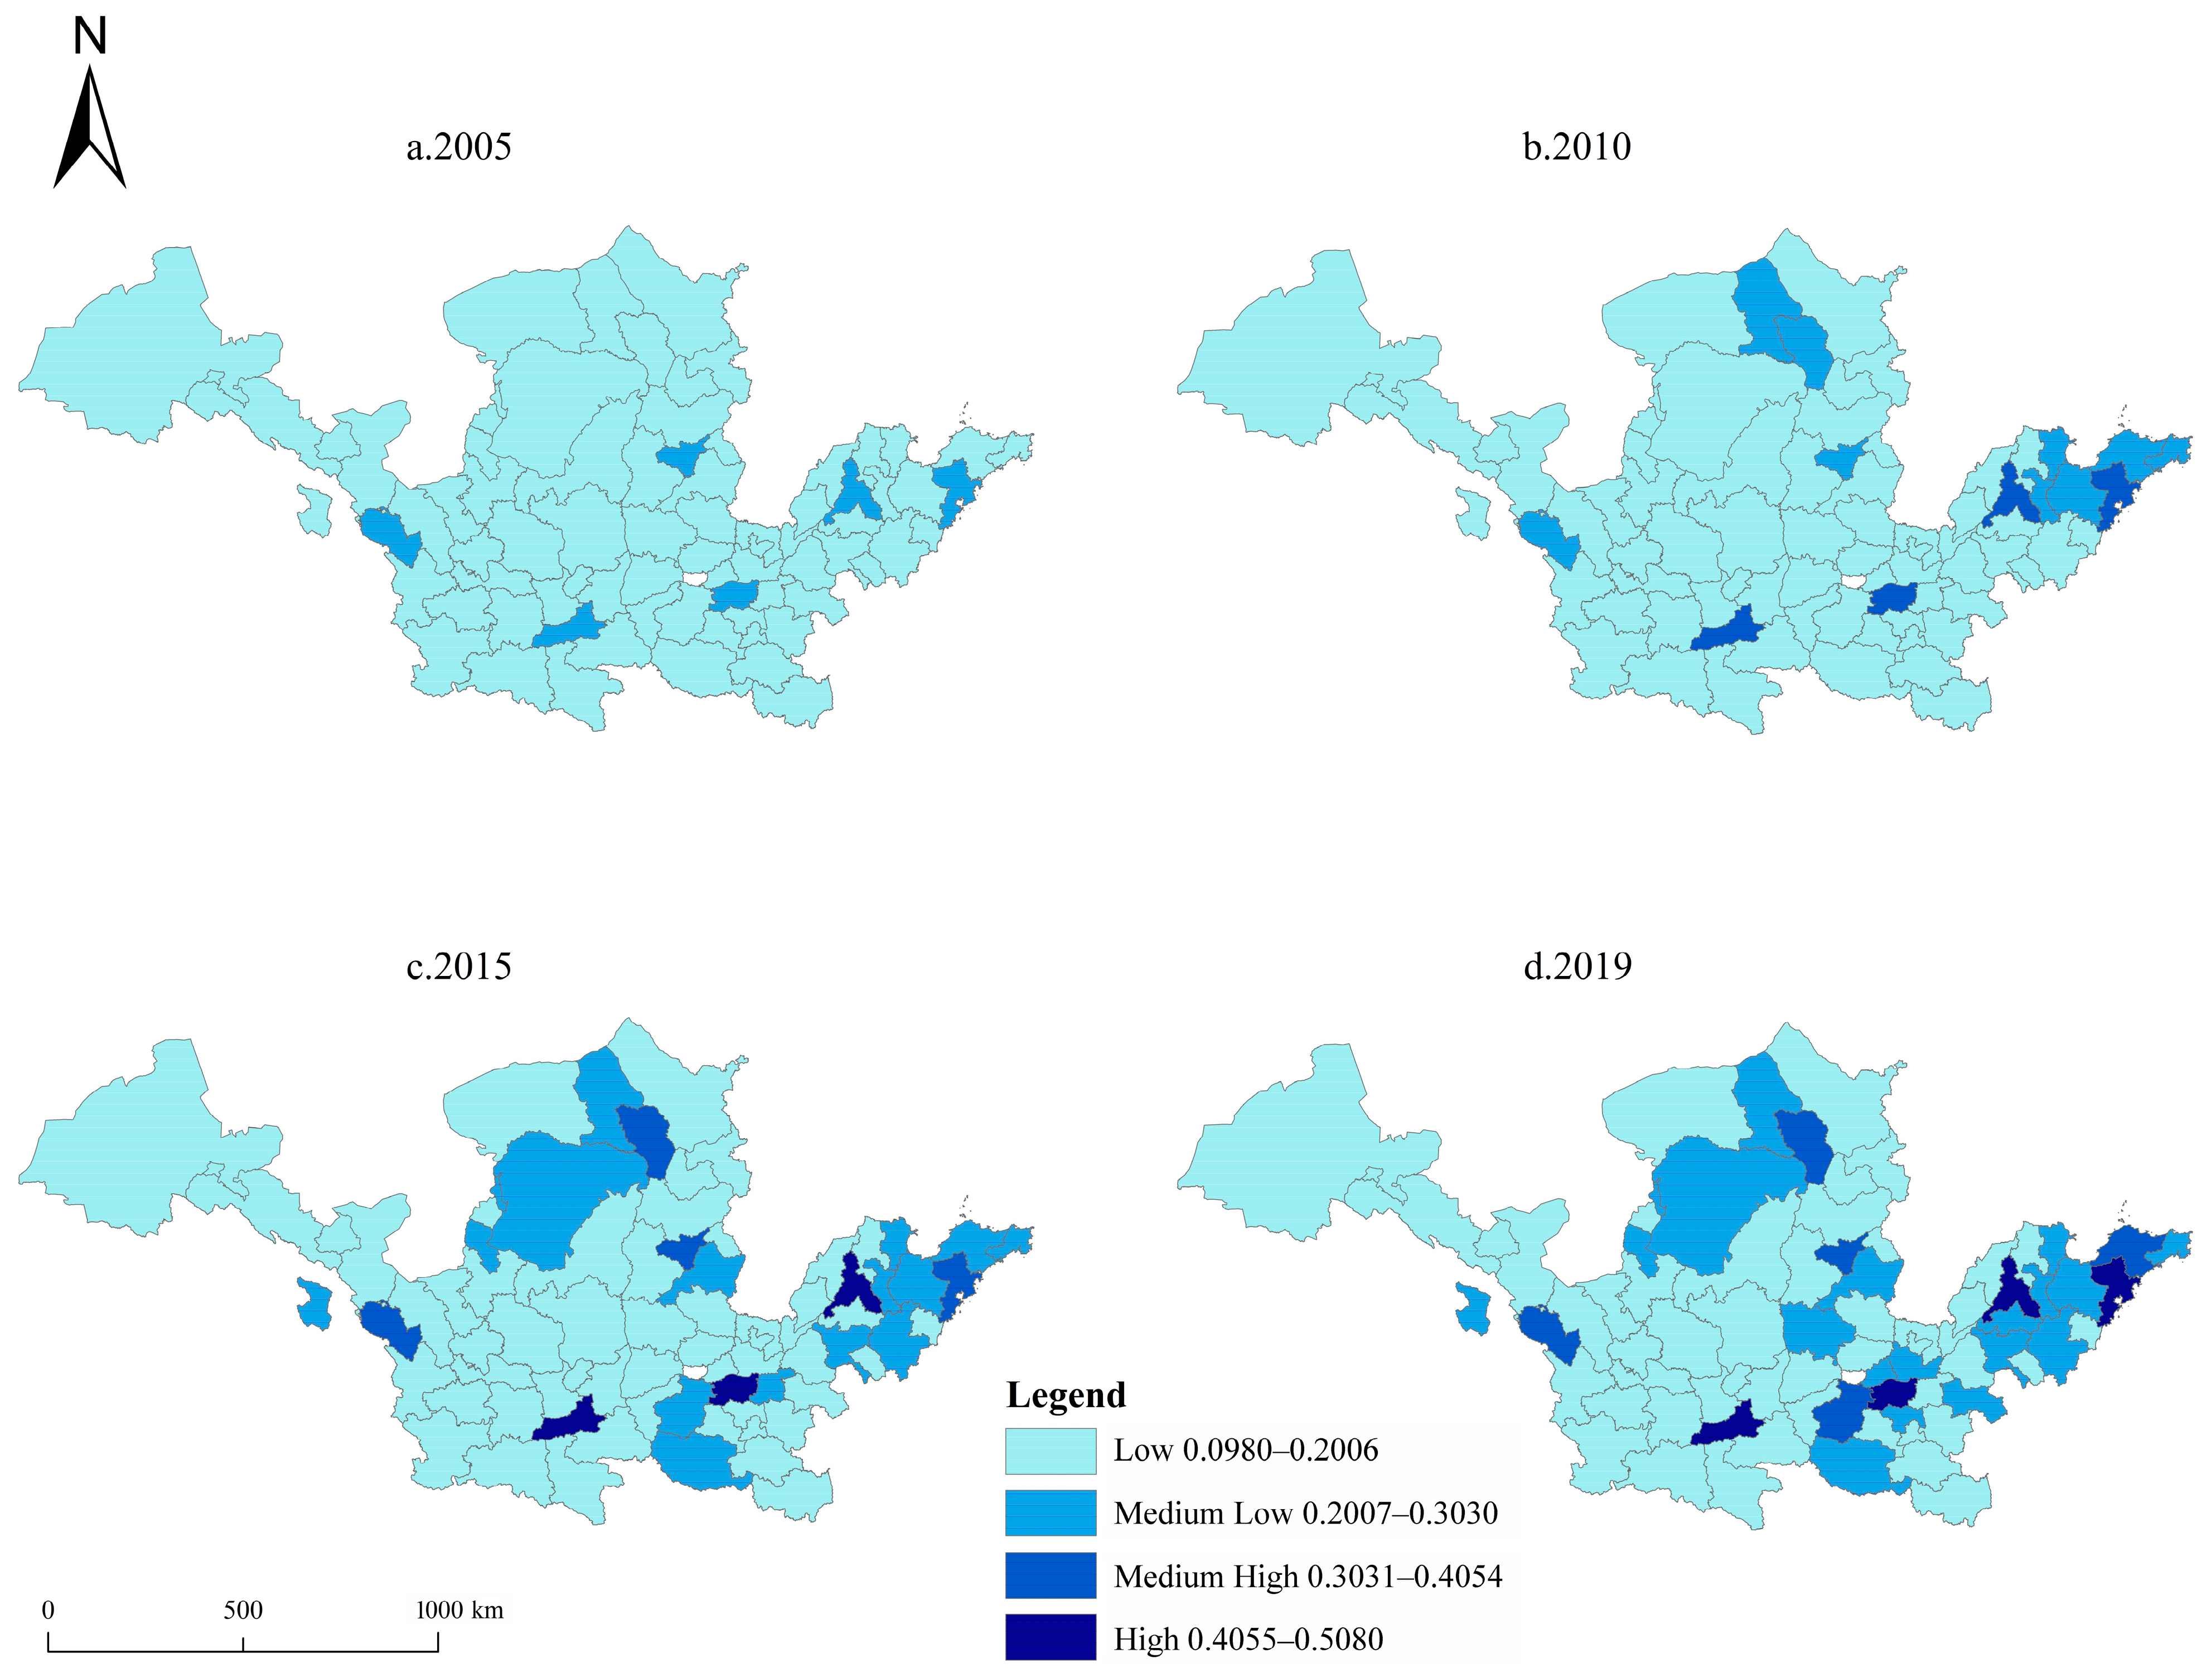
3.2. The Spatiotemporal Evolution Characteristic of Ecological Security
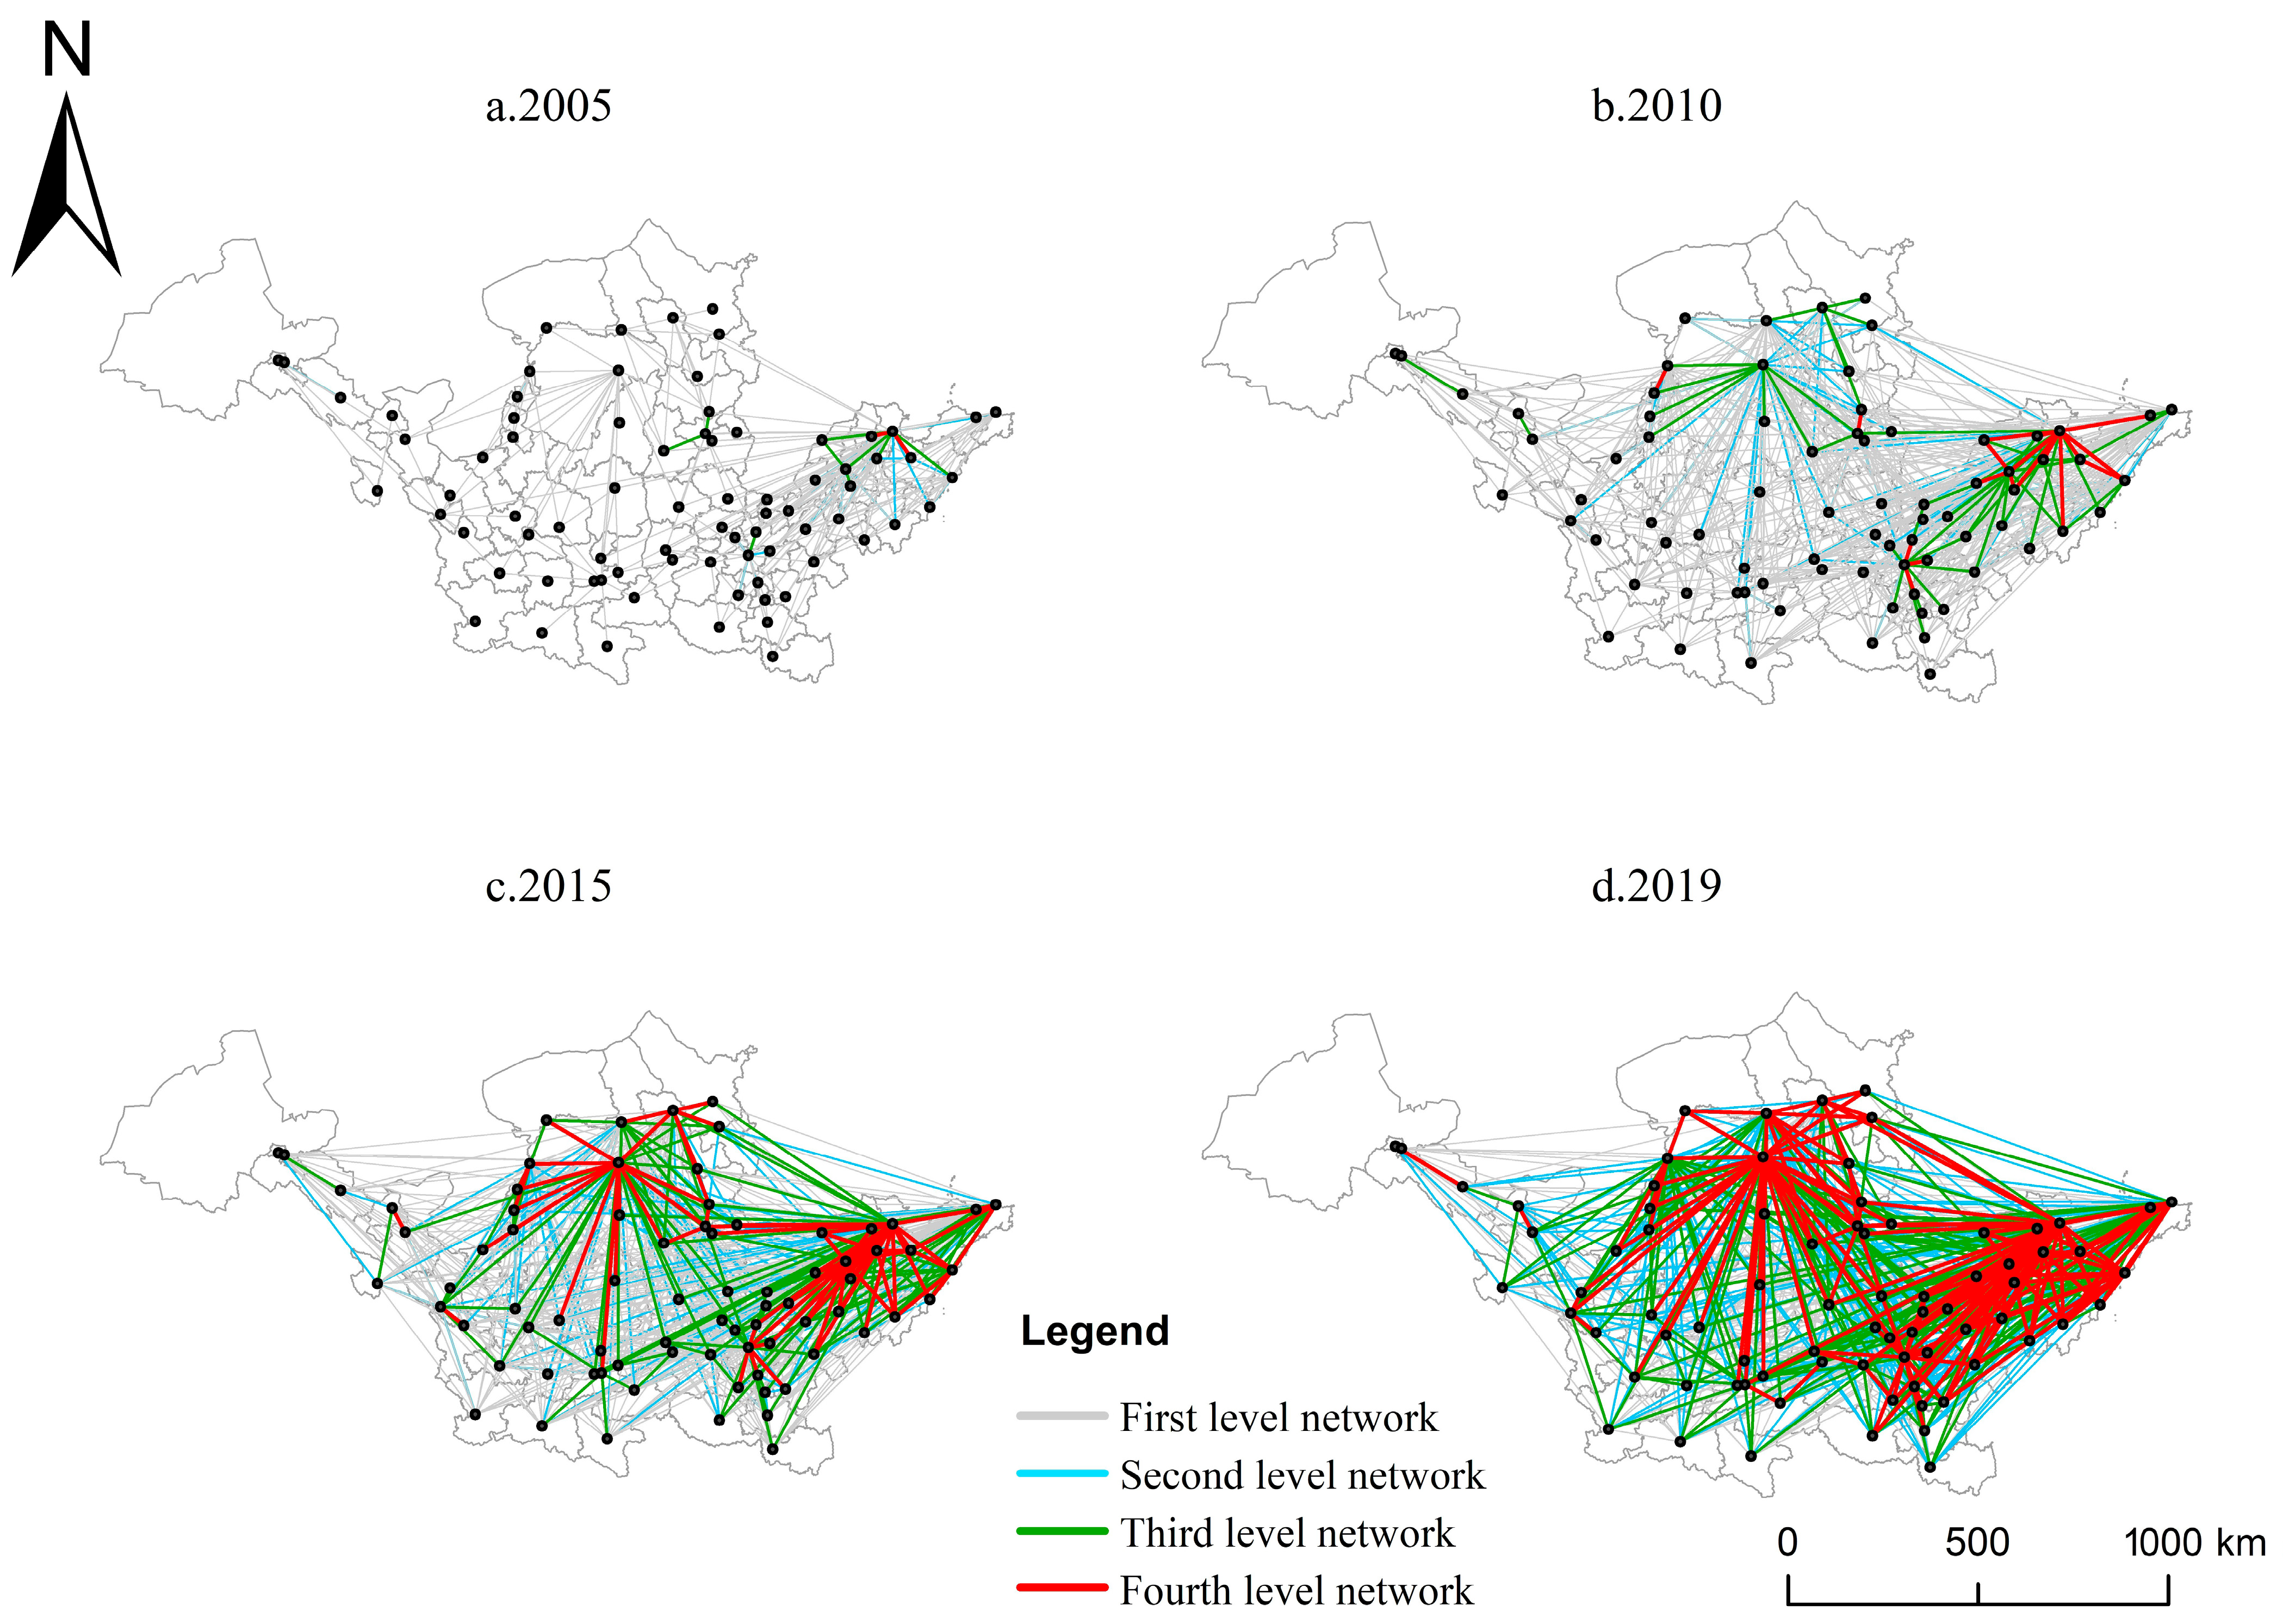
3.3. Characteristic Analysis of Spatial Association Network
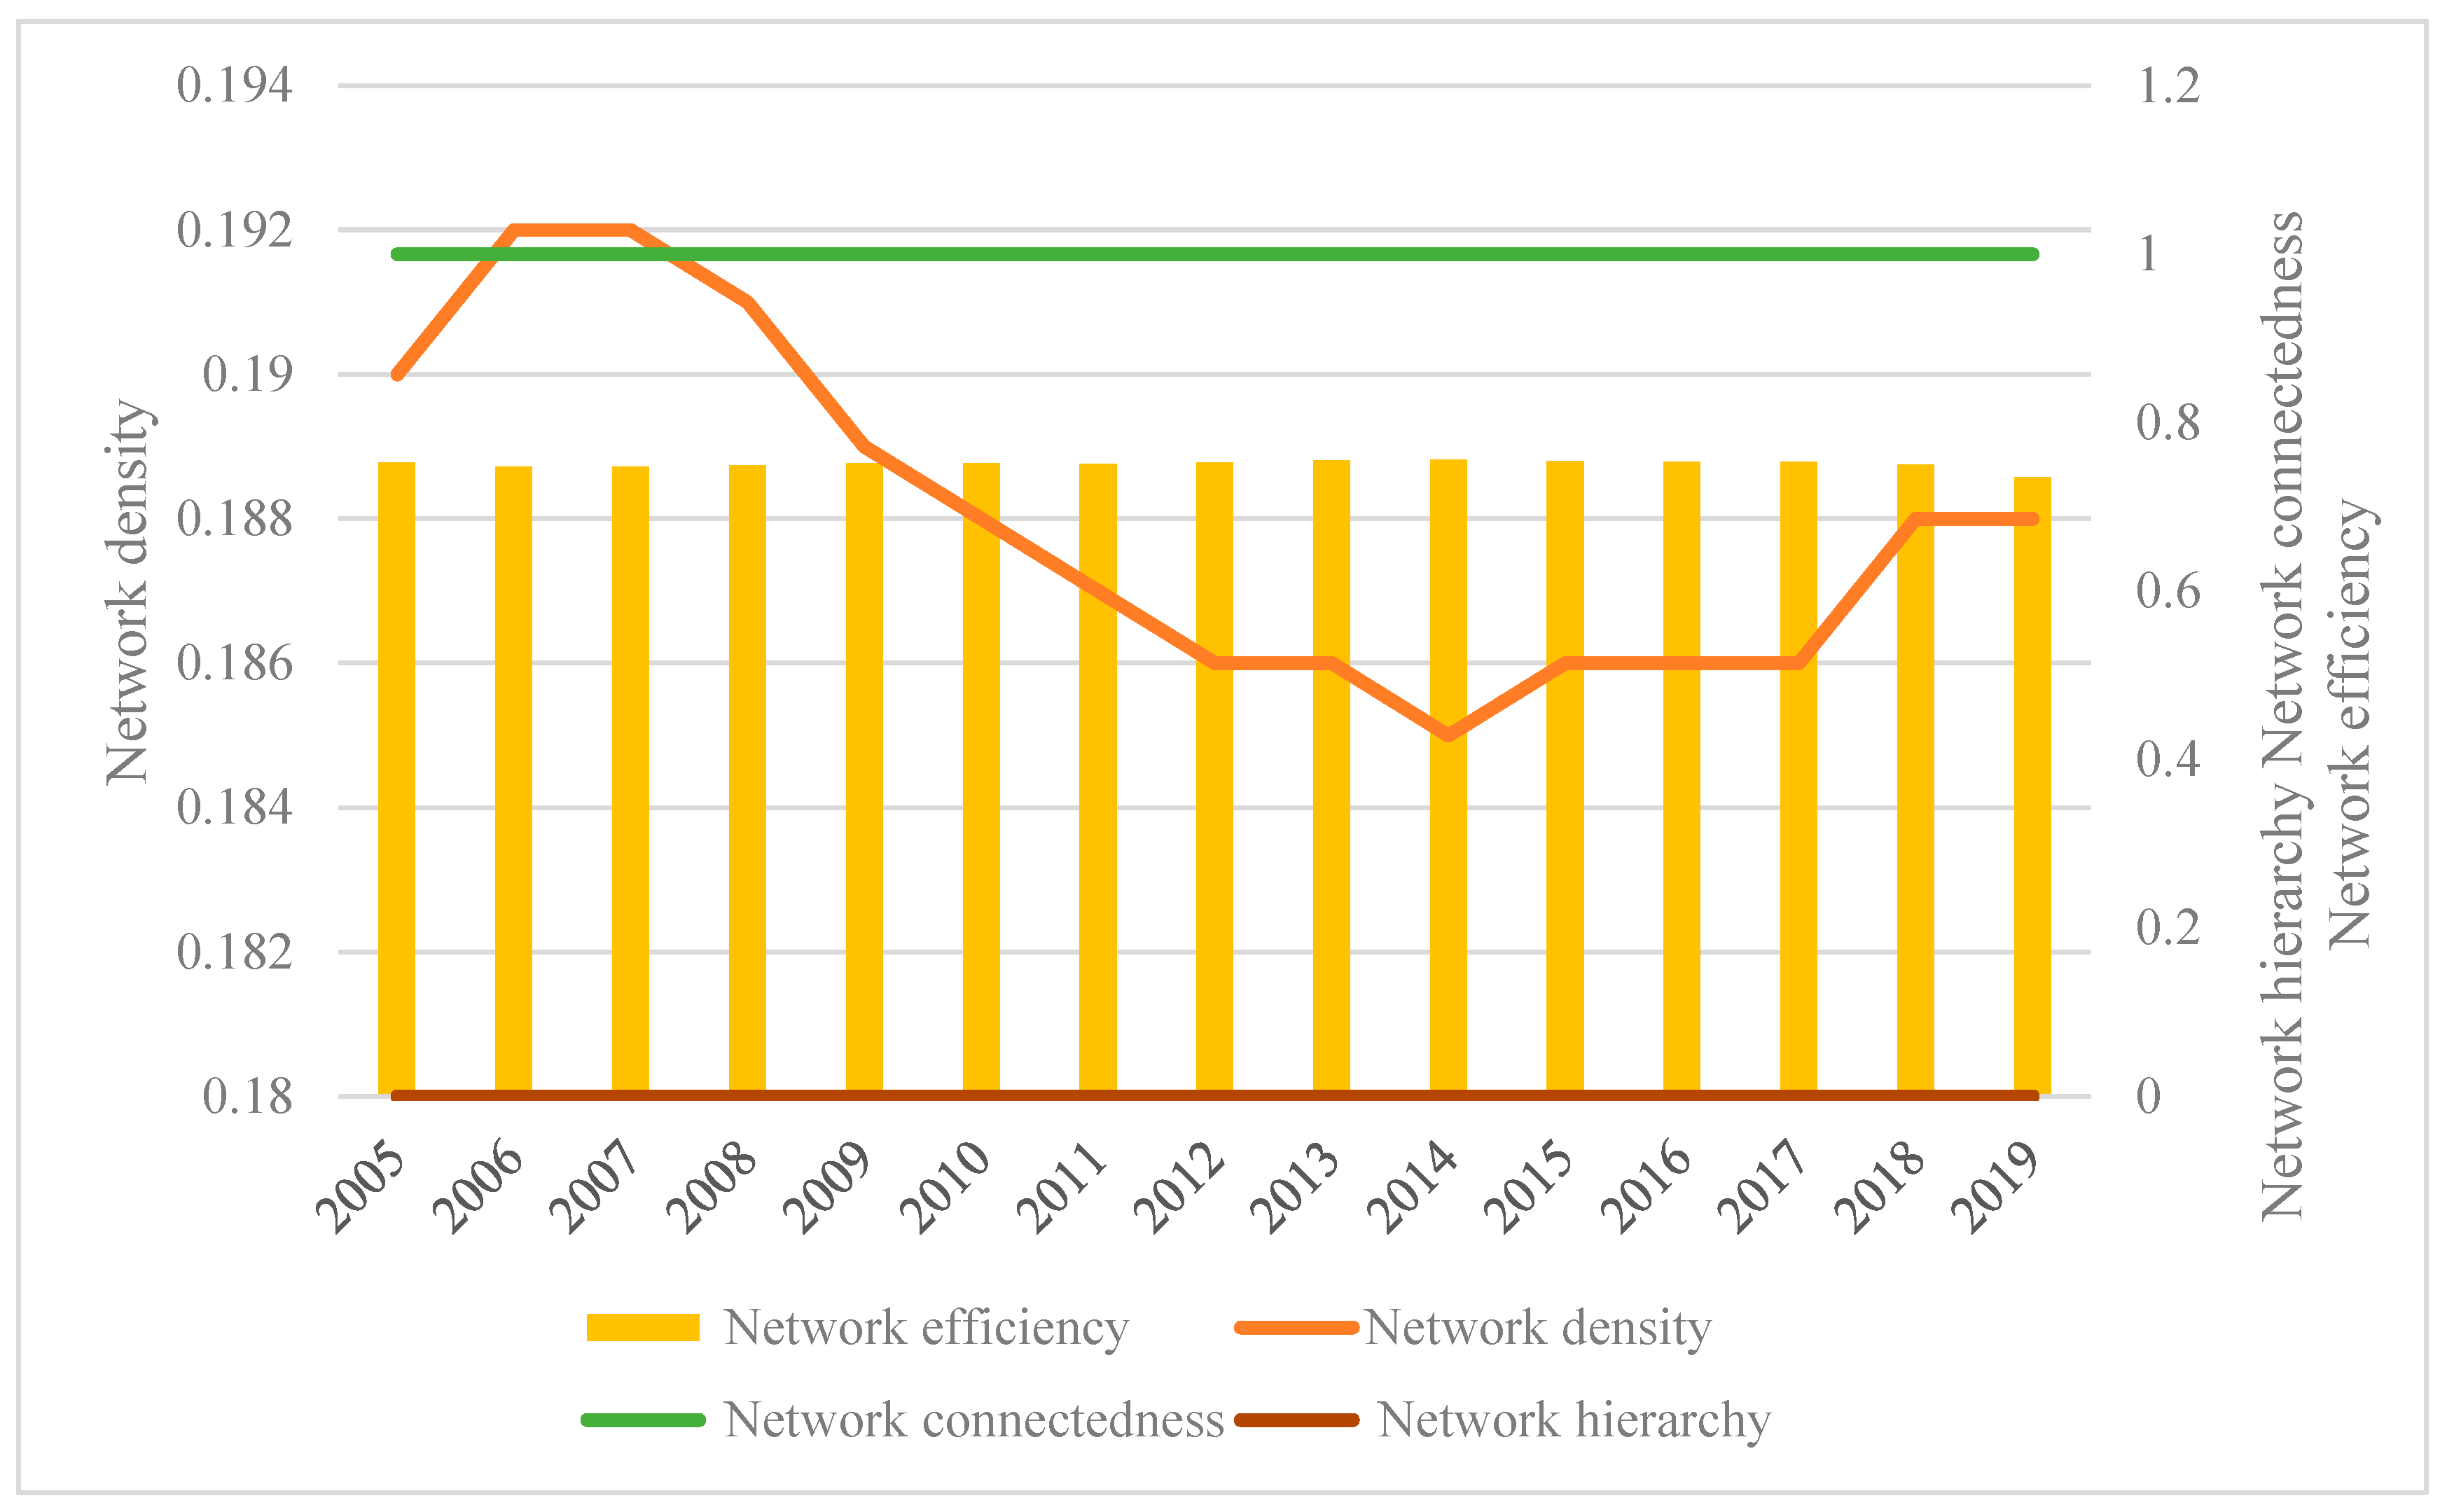
3.3.1. Overall Network Characteristic of Spatial Association Network
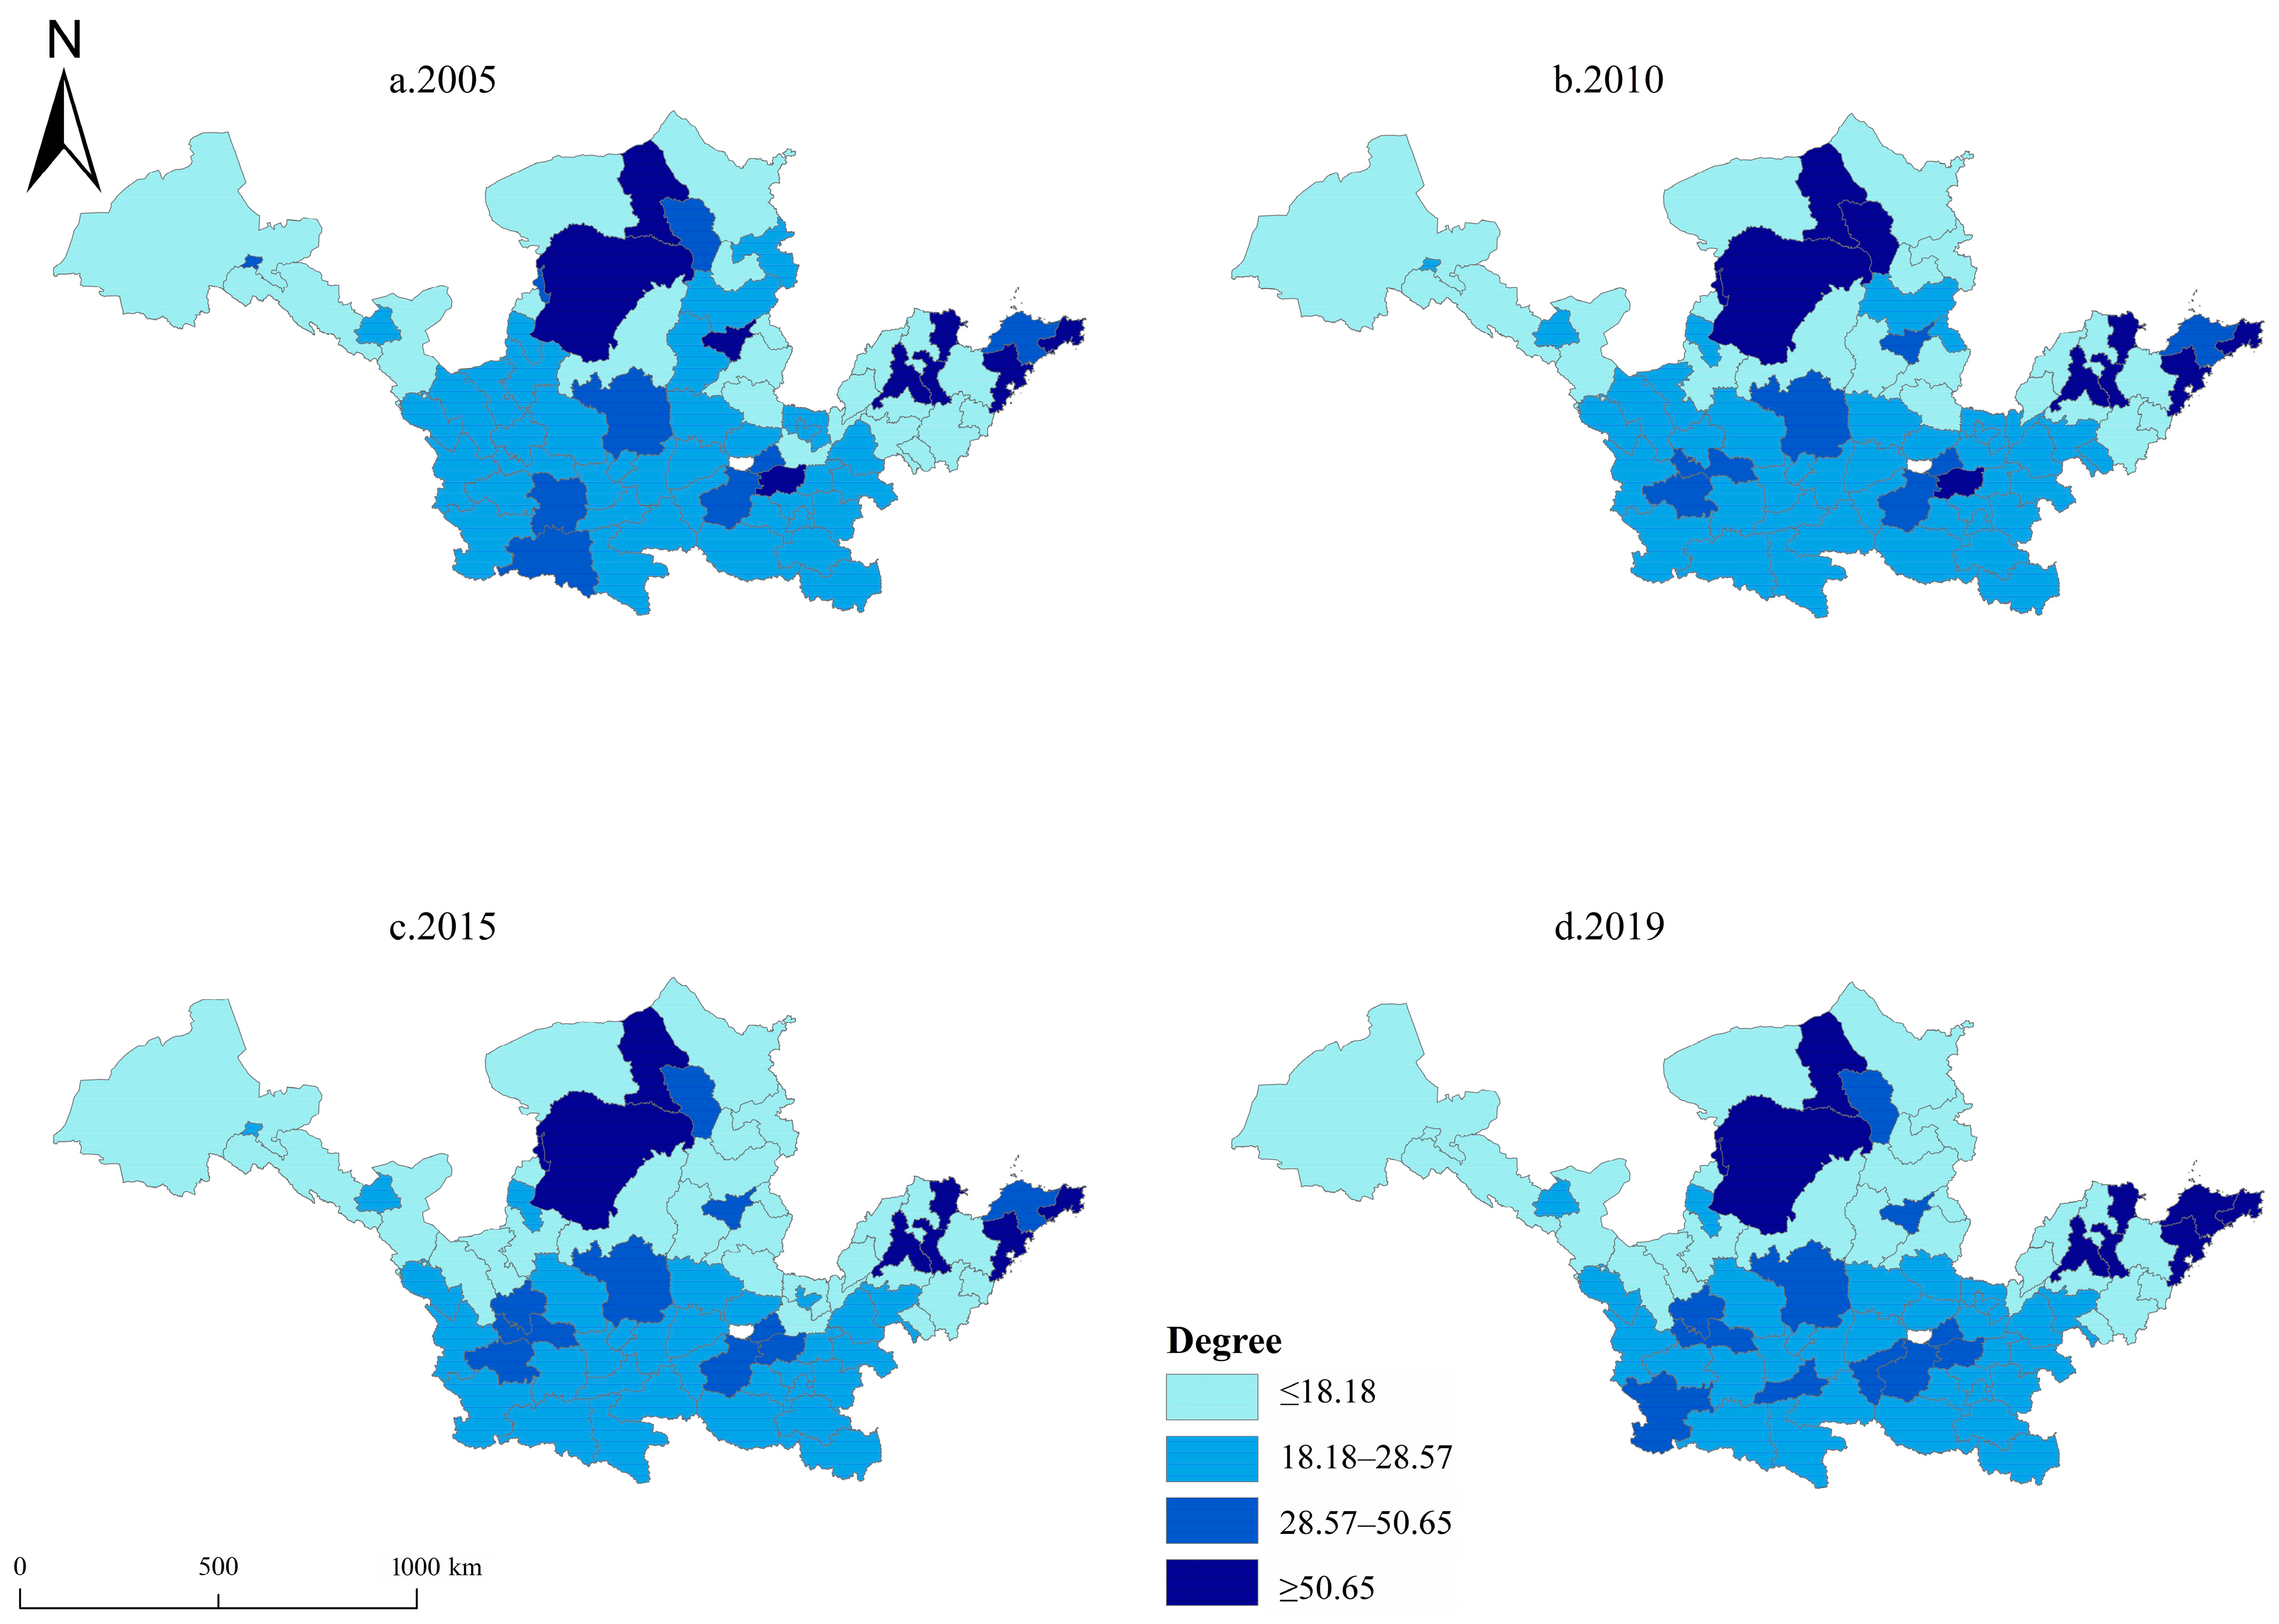
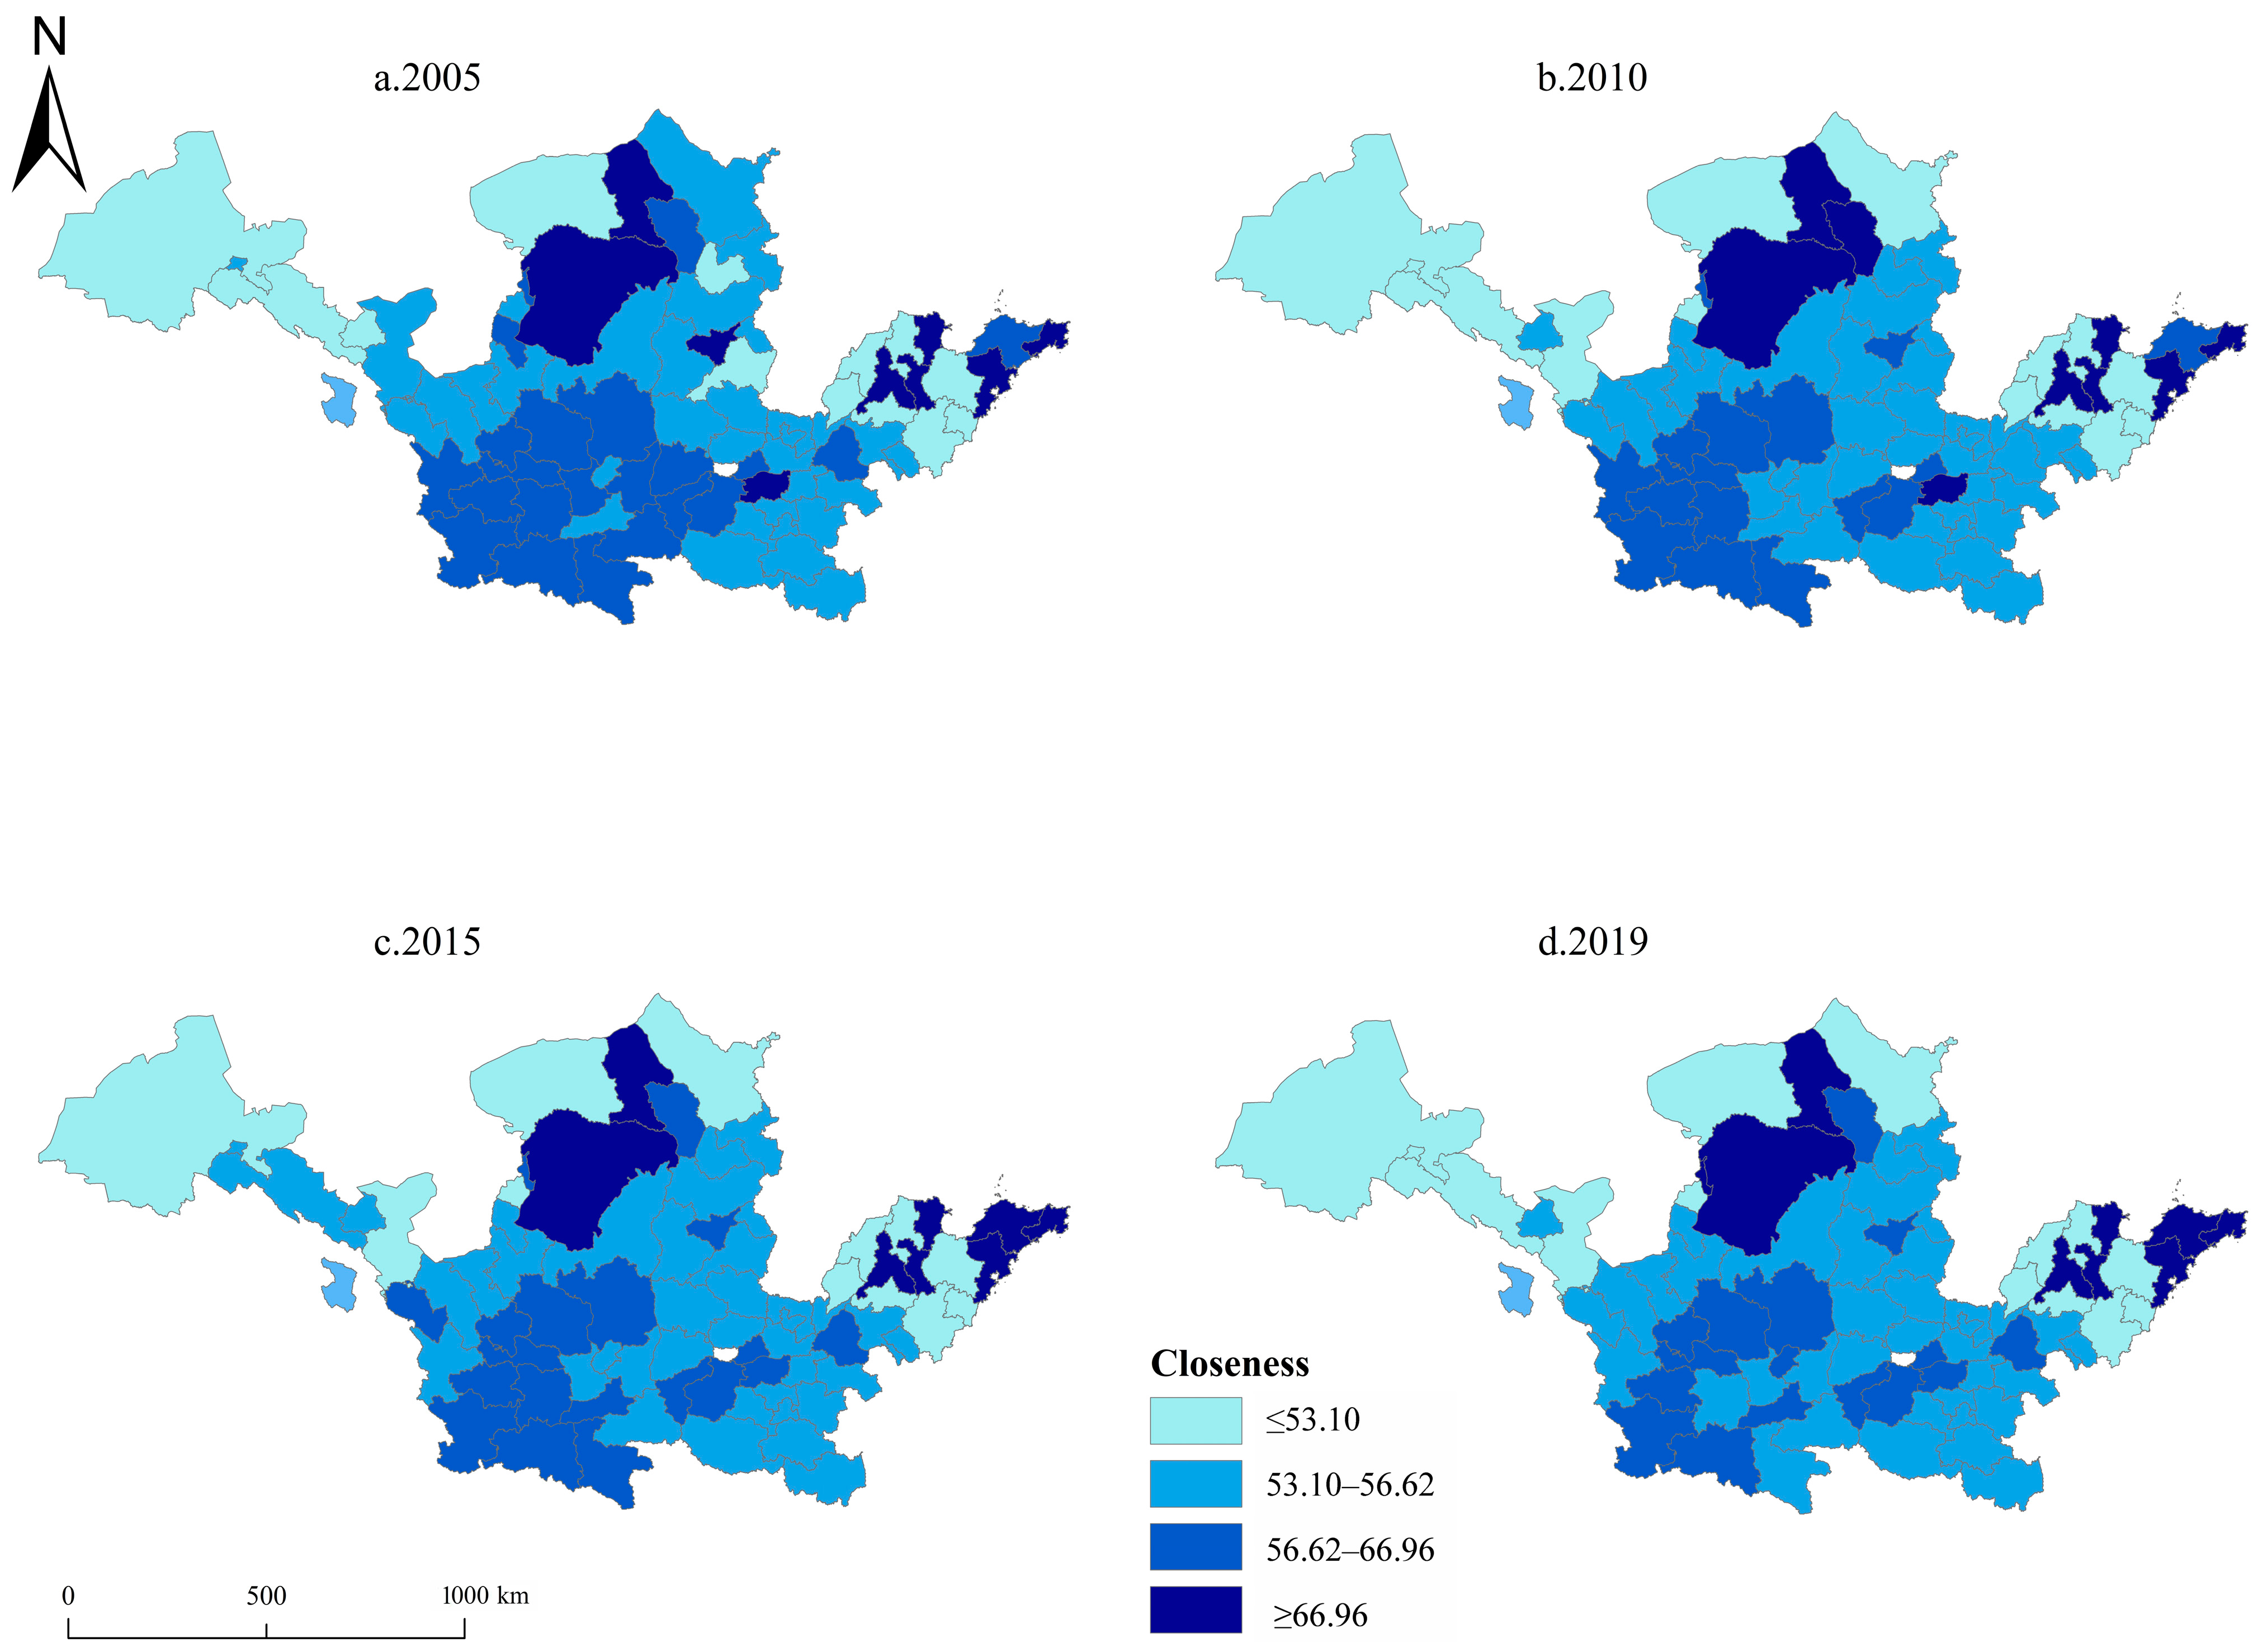
3.3.2. Individual Network Characteristic of Spatial Association Network
3.4. QAP Analysis
3.4.1. QAP Correlation Analysis
3.4.2. QAP Regression Analysis
4. Discussion
4.1. Spatial and Temporal Evolution Characteristics of Ecological Security
4.2. Characterization of Spatial Correlation Network
4.3. Policy Implications
4.4. Research Insufficiency and Prospect
- (1)
- Due to the lack of data on relevant indicators of ecological security evaluation at the county level, this paper only studied the characteristics of spatial correlation of ecological security at the municipal level, and the research scale is too rough for a more precise analysis. Therefore, the data could be further mined in the future research to construct the ecological security evaluation index system at the county level to improve the application value of the research.
- (2)
- The correction of the gravity model needs to be further improved. With the popularization of various modes of transportation, the limitation of spatial distance has been greatly weakened and time costs have been saved. In this paper, only the geospatial distance and the economic distance are considered; the time cost is not considered. Therefore, in the future, the distance measurement should be continuously improved in order to measure the distance more accurately.
5. Conclusions
- (1)
- From 2005 to 2019, the ecological protection of the YRB continued to strengthen, but the difference in the level of ecological security between cities became larger and the spatial difference was obvious. The number of cities with high levels of ecological security remains limited, while cities with medium and low levels are more common.
- (2)
- From 2005 to 2019, all cities in the YRB were in an associated network, and there were no isolated cities. The cities had a balanced position in the network, but the density of the network was low, and the stability of the network needed to be further strengthened. In terms of individual attributes, Shandong Peninsula, Hubao-Eyu, Taiyuan, and Zhengzhou were not only hub nodes, but also had close relationships with neighboring cities, effectively playing the role of hub connection and intermediary. On the contrary, cities such as Gansu, Ningxia, Shanxi, Shaanxi and Henan were marginal in their connections with other cities.
- (3)
- The standardized regression coefficients of economic development level and geospatial proximity are much higher than other factors; these are the main factors contributing to the differences in ecological security associations in the YRB.
Author Contributions
Funding
Institutional Review Board Statement
Informed Consent Statement
Data Availability Statement
Acknowledgments
Conflicts of Interest
References
- Okere, K.I.; Dimnwobi, S.K.; Fasanya, I.O. Do Fintech, Natural Resources and Globalization Matter during Ecological Crises? A Step towards Ecological Sustainability. J. Open Innov. Technol. Mark. Complex. 2024, 10, 100371. [Google Scholar] [CrossRef]
- Zhang, M.; Bao, Y.; Xu, J.; Han, A.; Liu, X.; Zhang, J.; Tong, Z. Ecological Security Evaluation and Ecological Regulation Approach of East-Liao River Basin Based on Ecological Function Area. Ecol. Indic. 2021, 132, 108255. [Google Scholar] [CrossRef]
- Liu, Y.; Hou, X.; Qiao, J.; Zhang, W.; Fang, M.; Lin, M. Evaluation of Soil Erosion Rates in the Hilly-Gully Region of the Loess Plateau in China in the Past 60 Years Using Global Fallout Plutonium. Catena 2023, 220, 106666. [Google Scholar] [CrossRef]
- Cafaro, P.; Hansson, P.; Götmark, F. Overpopulation Is a Major Cause of Biodiversity Loss and Smaller Human Populations Are Necessary to Preserve What Is Left. Biol. Conserv. 2022, 272, 109646. [Google Scholar] [CrossRef]
- Zhou, L.; Dang, X.; Sun, Q.; Wang, S. Multi-Scenario Simulation of Urban Land Change in Shanghai by Random Forest and CA-Markov Model. Sustain. Cities Soc. 2020, 55, 102045. [Google Scholar] [CrossRef]
- Feng, X.; Li, Y.; Wang, X.; Yang, J.; Yu, E.; Wang, S.; Wu, N.; Xiao, F. Impacts of Land Use Transitions on Ecosystem Services: A Research Framework Coupled with Structure, Function, and Dynamics. Sci. Total Environ. 2023, 901, 166366. [Google Scholar] [CrossRef]
- Peng, C.; Li, B.; Nan, B. An Analysis Framework for the Ecological Security of Urban Agglomeration: A Case Study of the Beijing-Tianjin-Hebei Urban Agglomeration. J. Clean. Prod. 2021, 315, 128111. [Google Scholar] [CrossRef]
- Peng, J.; Zhao, S.; Dong, J.; Liu, Y.; Meersmans, J.; Li, H.; Wu, J. Applying Ant Colony Algorithm to Identify Ecological Security Patterns in Megacities. Environ. Model. Softw. 2019, 117, 214–222. [Google Scholar] [CrossRef]
- Jiang, Y.; Tian, S.; Xu, Z.; Gao, L.; Xiao, L.; Chen, S.; Xu, K.; Chang, J.; Luo, Z.; Shi, Z. Decoupling Environmental Impact from Economic Growth to Achieve Sustainable Development Goals in China. J. Environ. Manag. 2022, 312, 114978. [Google Scholar] [CrossRef]
- Tian, Y.; Wen, Z.; Zhang, X.; Cheng, M.; Xu, M. Exploring a Multisource-Data Framework for Assessing Ecological Environment Conditions in the Yellow River Basin, China. Sci. Total Environ. 2022, 848, 157730. [Google Scholar] [CrossRef]
- Zhang, M.; Ao, Y.; Liu, M.; Zhao, Y.; Lin, K.; Cheng, T. Ecological Security Assessment Based on Ecosystem Service Value and Ecological Footprint in the Pearl River Delta Urban Agglomeration, China. Ecol. Indic. 2022, 144, 109528. [Google Scholar] [CrossRef]
- Sun, M.; Zhang, L.; Yang, R.; Li, X.; Zhang, Y.; Lu, Y. Construction of an Integrated Framework for Assessing Ecological Security and Its Application in Southwest China. Ecol. Indic. 2023, 148, 110074. [Google Scholar] [CrossRef]
- Du, L.; Dong, C.; Kang, X.; Qian, X.; Gu, L. Spatiotemporal Evolution of Land Cover Changes and Landscape Ecological Risk Assessment in the Yellow River Basin, 2015–2020. J. Environ. Manag. 2023, 332, 117149. [Google Scholar] [CrossRef]
- Zou, S.; Zhang, L.; Huang, X.; Osei, F.B.; Ou, G. Early Ecological Security Warning of Cultivated Lands Using RF-MLP Integration Model: A Case Study on China’s Main Grain-Producing Areas. Ecol. Indic. 2022, 141, 109059. [Google Scholar] [CrossRef]
- Jiao, M.; Yue, W.; Suo, A.; Zhang, L.; Li, H.; Xu, P.; Ding, D. Construction and Influencing Factors of an Early Warning System for Marine Ranching Ecological Security: Experience from China’s Coastal Areas. J. Environ. Manag. 2023, 335, 117515. [Google Scholar] [CrossRef]
- Zhang, R.; Li, P.; Xu, L. Evaluation and Analysis of Ecological Security Based on the Improved Three-Dimensional Ecological Footprint in Shaanxi Province, China. Ecol. Indic. 2022, 144, 109483. [Google Scholar] [CrossRef]
- Liu, D.; Yin, Z. Spatial-Temporal Pattern Evolution and Mechanism Model of Tourism Ecological Security in China. Ecol. Indic. 2022, 139, 108933. [Google Scholar] [CrossRef]
- Ke, X.; Wang, X.; Guo, H.; Yang, C.; Zhou, Q.; Mougharbel, A. Urban Ecological Security Evaluation and Spatial Correlation Research—Based on Data Analysis of 16 Cities in Hubei Province of China. J. Clean. Prod. 2021, 311, 127613. [Google Scholar] [CrossRef]
- Dong, Z.; Zhang, J.; Tong, Z.; Han, A.; Zhi, F. Ecological Security Assessment of Xilingol Grassland in China Using DPSIRM Model. Ecol. Indic. 2022, 143, 109336. [Google Scholar] [CrossRef]
- Zhu, T.; Zhang, S.; Wang, Y.; Wang, C.; Wang, H. Integrated Assessment and Restoration Pathways for Holistic Ecosystem Health in Anxi County, China. Sustainability 2023, 15, 15932. [Google Scholar] [CrossRef]
- He, N.; Zhou, Y.; Wang, L.; Li, Q.; Zuo, Q.; Liu, J.; Li, M. Spatiotemporal Evaluation and Analysis of Cultivated Land Ecological Security Based on the DPSIR Model in Enshi Autonomous Prefecture, China. Ecol. Indic. 2022, 145, 109619. [Google Scholar] [CrossRef]
- Gao, X.; Wang, G.; Innes, J.L.; Zhao, Y.; Zhang, X.; Zhang, D.; Mi, F. Forest Ecological Security in China: A Quantitative Analysis of Twenty Five Years. Glob. Ecol. Conserv. 2021, 32, e01821. [Google Scholar] [CrossRef]
- Wang, C.; Yu, C.; Chen, T.; Feng, Z.; Hu, Y.; Wu, K. Can the Establishment of Ecological Security Patterns Improve Ecological Protection? An Example of Nanchang, China. Sci. Total Environ. 2020, 740, 140051. [Google Scholar] [CrossRef] [PubMed]
- Zheng, X.; Yang, Z.; Zhang, X.; Wang, T.; Chen, X.; Wang, C. Spatiotemporal Evolution and Influencing Factors of Provincial Tourism Ecological Security in China. Ecol. Indic. 2023, 148, 110114. [Google Scholar] [CrossRef]
- Li, W.; Kang, J.; Wang, Y. Spatiotemporal Changes and Driving Forces of Ecological Security in the Chengdu-Chongqing Urban Agglomeration, China: Quantification Using Health-Services-Risk Framework. J. Clean. Prod. 2023, 389, 136135. [Google Scholar] [CrossRef]
- Wu, R.; Liu, Q.; Wang, H. Spatial Spillover Effects of Ecosystem Service Values in Northeast China Tiger and Leopard National Park Based on Spatial Durbin Model. Ecol. Indic. 2024, 166, 112509. [Google Scholar] [CrossRef]
- Li, S.; Zhao, Y.; Xiao, W.; Yue, W.; Wu, T. Optimizing Ecological Security Pattern in the Coal Resource-Based City: A Case Study in Shuozhou City, China. Ecol. Indic. 2021, 130, 108026. [Google Scholar] [CrossRef]
- Xu, D.; Guo, X.; Watanabe, T.; Liang, K.; Kou, J.; Jiang, X. Ecological Security Pattern Construction in Rural Settlements Based on Importance and Vulnerability of Ecosystem Services: A Case Study of the Southeast Region of Chongqing, China. Sustainability 2023, 15, 7477. [Google Scholar] [CrossRef]
- Lin, Y.; Zhang, F.; Cai, G.; Jin, Y.; Zhang, L.; Ge, Y. Spatio-Temporal Pattern and Driving Factors of Tourism Ecological Security in Fujian Province. Ecol. Indic. 2023, 157, 111255. [Google Scholar] [CrossRef]
- Fan, H.; Zhang, X.; Zhou, X.; Sun, Z.; He, Y.; Wan, W.; Lv, T. Comprehensive Evaluation of Land-Use Carbon Emissions Integrating Social Network Analysis and a Zone-Based Machine Learning Approach. Environ. Impact Assess. Rev. 2025, 112, 107775. [Google Scholar] [CrossRef]
- Xia, M.; Li, J. Assessment of Ecological Well-Being Performance and Its Spatial Correlation Analysis in the Beijing-Tianjin-Hebei Urban Agglomeration. J. Clean. Prod. 2022, 362, 132621. [Google Scholar] [CrossRef]
- Wang, Y.; Zhou, X.; Ding, C.; Li, W.; Huang, L.; Ge, B.; Song, Y. Construction and Optimization of the Watershed-Scale Ecological Network Based on Network Characteristic Analysis: A Case Study of the Lancang River Basin. Ecol. Indic. 2025, 171, 113164. [Google Scholar] [CrossRef]
- Zhu, B.; Hashimoto, S.; Cushman, S.A. Navigating Ecological Security Research over the Last 30 Years: A Scoping Review. Sustain. Sci. 2023, 18, 2485–2498. [Google Scholar] [CrossRef]
- Neri, A.C.; Dupin, P.; Sánchez, L.E. A Pressure–State–Response Approach to Cumulative Impact Assessment. J. Clean. Prod. 2016, 126, 288–298. [Google Scholar] [CrossRef]
- Xiao, Y.; Tang, X.; Wang, J.; Huang, H.; Liu, L. Assessment of Coordinated Development between Tourism Development and Resource Environment Carrying Capacity: A Case Study of Yangtze River Economic Belt in China. Ecol. Indic. 2022, 141, 109125. [Google Scholar] [CrossRef]
- Wang, Z.; Xie, W.; Zhang, C. Towards COP26 Targets: Characteristics and Influencing Factors of Spatial Correlation Network Structure on U.S. Carbon Emission. Resour. Policy 2023, 81, 103285. [Google Scholar] [CrossRef]
- Alao, M.A.; Ayodele, T.R.; Ogunjuyigbe, A.S.O.; Popoola, O.M. Multi-Criteria Decision Based Waste to Energy Technology Selection Using Entropy-Weighted TOPSIS Technique: The Case Study of Lagos, Nigeria. Energy 2020, 201, 117675. [Google Scholar] [CrossRef]
- Li, Z.; Luo, Z.; Wang, Y.; Fan, G.; Zhang, J. Suitability Evaluation System for the Shallow Geothermal Energy Implementation in Region by Entropy Weight Method and TOPSIS Method. Renew. Energy 2022, 184, 564–576. [Google Scholar] [CrossRef]
- Li, J.; Chen, Y.; Yao, X.; Chen, A. Risk Management Priority Assessment of Heritage Sites in China Based on Entropy Weight and TOPSIS. J. Cult. Herit. 2021, 49, 10–18. [Google Scholar] [CrossRef]
- Oluah, C.; Akinlabi, E.T.; Njoku, H.O. Selection of Phase Change Material for Improved Performance of Trombe Wall Systems Using the Entropy Weight and TOPSIS Methodology. Energy Build. 2020, 217, 109967. [Google Scholar] [CrossRef]
- Mirli, A.; Bakas, T.; Latinopoulos, D.; Kagalou, I.; Spiliotis, M. Participatory Management of a Mediterranean Lagoon Complex Social-Ecological System Using Intuitionistic Fuzzy TOPSIS. Sustainability 2024, 16, 10647. [Google Scholar] [CrossRef]
- Chen, Z.; Sarkar, A.; Rahman, A.; Li, X.; Xia, X. Exploring the Drivers of Green Agricultural Development (GAD) in China: A Spatial Association Network Structure Approaches. Land Use Policy 2022, 112, 105827. [Google Scholar] [CrossRef]
- Bai, C.; Zhou, L.; Xia, M.; Feng, C. Analysis of the Spatial Association Network Structure of China’s Transportation Carbon Emissions and Its Driving Factors. J. Environ. Manag. 2020, 253, 109765. [Google Scholar] [CrossRef] [PubMed]
- Dong, J.; Li, C. Structure Characteristics and Influencing Factors of China’s Carbon Emission Spatial Correlation Network: A Study Based on the Dimension of Urban Agglomerations. Sci. Total Environ. 2022, 853, 158613. [Google Scholar] [CrossRef]
- Tang, L.; Lu, B.; Tian, T. Spatial Correlation Network and Regional Differences for the Development of Digital Economy in China. Entropy 2021, 23, 1575. [Google Scholar] [CrossRef]
- Spiliotis, K.; Voudouris, K.; Vangelis, H.; Spiliotis, M. Analysis of Annual Drought Episodes Using Complex Networks. Sustainability 2025, 17, 1441. [Google Scholar] [CrossRef]
- Gan, C.; Voda, M.; Wang, K.; Chen, L.; Ye, J. Spatial Network Structure of the Tourism Economy in Urban Agglomeration: A Social Network Analysis. J. Hosp. Tour. Manag. 2021, 47, 124–133. [Google Scholar] [CrossRef]
- Dong, S.; Ren, G.; Xue, Y.; Liu, K. Urban Green Innovation’s Spatial Association Networks in China and Their Mechanisms. Sustain. Cities Soc. 2023, 93, 104536. [Google Scholar] [CrossRef]
- Wang, Z.; Liu, B.; Wang, L.; Shao, Q. Measurement and Temporal & Spatial Variation of Urban Eco-Efficiency in the Yellow River Basin. Phys. Chem. Earth Parts A/B/C 2021, 122, 102981. [Google Scholar] [CrossRef]
- Hao, Z.; Ye, D.; Hui, W.; Zenglin, H.; Hongye, W. An Empirical Analysis of Tourism Eco-Efficiency in Ecological Protection Priority Areas Based on the DPSIR-SBM Model: A Case Study of the Yellow River Basin, China. Ecol. Inform. 2022, 70, 101720. [Google Scholar] [CrossRef]
- Chen, Y.; Zhu, M.; Lu, J.; Zhou, Q.; Ma, W. Evaluation of Ecological City and Analysis of Obstacle Factors under the Background of High-Quality Development: Taking Cities in the Yellow River Basin as Examples. Ecol. Indic. 2020, 118, 106771. [Google Scholar] [CrossRef]
- Zhao, K.; Zhang, R.; Liu, H.; Wang, G.; Sun, X. Resource Endowment, Industrial Structure, and Green Development of the Yellow River Basin. Sustainability 2021, 13, 4530. [Google Scholar] [CrossRef]
- Xu, J.-J.; Wang, H.-J.; Tang, K. The Sustainability of Industrial Structure on Green Eco-Efficiency in the Yellow River Basin. Econ. Anal. Policy 2022, 74, 775–788. [Google Scholar] [CrossRef]
- Tian, S.; Zhang, Y.; Xu, Y.; Wang, Q.; Yuan, X.; Ma, Q.; Chen, L.; Ma, H.; Xu, Y.; Yang, S.; et al. Urban Ecological Security Assessment and Path Regulation for Ecological Protection—A Case Study of Shenzhen, China. Ecol. Indic. 2022, 145, 109717. [Google Scholar] [CrossRef]
- Zhang, Z.; Wang, Q.; Yan, F.; Sun, Y.; Yan, S. Revealing Spatio-Temporal Differentiations of Ecological Supply-Demand Mismatch among Cities Using Ecological Network: A Case Study of Typical Cities in the “Upstream-Midstream-Downstream” of the Yellow River Basin. Ecol. Indic. 2024, 166, 112468. [Google Scholar] [CrossRef]
- Li, L.; Fu, M.; Zhu, Y.; Kang, H.; Wen, H. The Current Situation and Trend of Land Ecological Security Evaluation from the Perspective of Global Change. Ecol. Indic. 2024, 167, 112608. [Google Scholar] [CrossRef]
- Zhang, M.; Wang, H. Evolution of Industrial Ecology and Analysis of Influencing Factors: The Yellow River Basin in China. Land 2023, 12, 1277. [Google Scholar] [CrossRef]


| First-Level Indicator | Second-Level Indicator | Third-Level Indicator | Measurement Units and Type | Weight |
|---|---|---|---|---|
| Pressure | Social pressure | Population growth rate | % (−) | 0.0015 |
| Population density | person/km2 (+) | 0.0511 | ||
| Number of registered urban unemployed at the end of the year | person (−) | 0.0032 | ||
| Economic pressure | GDP growth rate | % (−) | 0.0033 | |
| GDP | CNY 108 (−) | 0.0786 | ||
| Environmental pressure | Industrial sulfur dioxide emissions | t (−) | 0.0044 | |
| Industrial wastewater discharge | 104 t (−) | 0.0033 | ||
| Industrial smoke (dust) emissions | t (−) | 0.0002 | ||
| Total carbon emissions | 104 t (−) | 0.0461 | ||
| State | Social state | Road area per capita | m2 (+) | 0.0306 |
| Urbanization rate | % (+) | 0.0192 | ||
| Economic state | GDP per capita | CNY (+) | 0.0659 | |
| Total Social Retail Goods | CNY 108 (+) | 0.1075 | ||
| Urban disposable income per capita | CNY (+) | 0.0320 | ||
| Environmental state | Total water resources | 108 m3 (+) | 0.1430 | |
| The area of construction land | km2 (+) | 0.0658 | ||
| Greenery coverage in built-up areas | % (+) | 0.0078 | ||
| Response | Social response | Number of college students per 10,000 people | person (+) | 0.1088 |
| Number of doctors per 1000 people | person (+) | 0.0169 | ||
| Number of hospital beds per 10,000 people | (+) | 0.0216 | ||
| Number of public electric bus per 10,000 people | (+) | 0.0715 | ||
| Economic response | Proportion of fiscal expenditure on education | % (+) | 0.0063 | |
| Proportion of fiscal expenditure on science and technology | % (+) | 0.0603 | ||
| Proportion of tertiary industry in GDP | % (+) | 0.0141 | ||
| Environmental response | Centralized treatment rate of urban sewage | % (+) | 0.0095 | |
| Harmless treatment rate of household garbage | % (+) | 0.0126 | ||
| General industrial solid waste comprehensive utilization rate | % (+) | 0.0151 |
| Value | 2005 | 2010 | 2015 | 2019 |
|---|---|---|---|---|
| average value | 0.1253 | 0.1600 | 0.1869 | 0.2088 |
| standard deviation | 0.0497 | 0.0673 | 0.0777 | 0.0853 |
| kurtosis coefficient | 1.843 | 2.883 | 2.943 | 3.508 |
| skew coefficient | 1.306 | 1.656 | 1.742 | 1.865 |
| 2005 | 2007 | 2009 | 2011 | 2013 | 2015 | 2017 | 2019 | |
|---|---|---|---|---|---|---|---|---|
| Geographical proximity | 0.231 *** | 0.226 *** | 0.221 *** | 0.226 *** | 0.232 *** | 0.232 *** | 0.220 *** | 0.225 *** |
| Difference in economic development | 0.454 *** | 0.452 *** | 0.459 *** | 0.456 *** | 0.453 *** | 0.455 *** | 0.460 *** | 0.459 *** |
| Difference in environmental regulation | 0.047 * | 0.023 | 0.018 | 0.069 ** | 0.031 | 0.043 | 0.064 ** | 0.055 * |
| Difference in industrial structure | 0.077 ** | 0.088 ** | 0.058 * | 0.098 *** | 0.090 ** | 0.055 * | 0.056 * | 0.062 * |
| Difference in intellectual capital | 0.243 *** | 0.240 *** | 0.238 *** | 0.212 *** | 0.164 *** | 0.163 *** | 0.159 *** | 0.157 *** |
| Difference in government regulation | −0.012 | 0.040 | 0.015 | 0.017 | 0.032 | 0.025 | 0.008 | 0.030 |
| Difference in population density | −0.048 ** | −0.021 | −0.047 ** | −0.034 | −0.018 | 0.005 | −0.010 | −0.022 |
| Difference in urbanization | 0.242 *** | 0.221 *** | 0.211 *** | 0.203 *** | 0.244 *** | 0.234 *** | 0.231 *** | 0.246 *** |
| Difference in high-tech | 0.164 *** | 0.150 *** | 0.167 *** | 0.165 *** | 0.165 *** | 0.182 *** | 0.151 *** | 0.156 *** |
| 2005 | 2007 | 2009 | 2011 | 2013 | 2015 | 2017 | 2019 | |
|---|---|---|---|---|---|---|---|---|
| Geographical proximity | 0.2546 *** | 0.2534 *** | 0.2476 *** | 0.2551 *** | 0.2615 *** | 0.2620 *** | 0.2489 *** | 0.2582 *** |
| Difference in economic development | 0.5202 *** | 0.4365 *** | 0.4322 *** | 0.4459 *** | 0.4512 *** | 0.4464 *** | 0.4601 *** | 0.4465 *** |
| Difference in environmental regulation | −0.0476 *** | −0.0596 *** | −0.0580 *** | −0.0678 *** | −0.0571 *** | −0.0432 *** | −0.0237 | −0.0337 ** |
| Difference in industrial structure | −0.0555 *** | −0.0405 ** | −0.0279 * | 0.0079 | 0.0183 | −0.0182 | −0.0116 | −0.0141 |
| Difference in intellectual capital | 0.1373 *** | 0.1478 *** | 0.1464 *** | 0.1210 *** | 0.1120 *** | 0.1171 *** | 0.1186 *** | 0.0973 *** |
| Difference in government regulation | −0.0313 * | −0.0034 | −0.0074 | −0.0131 | −0.0121 | −0.0221 | −0.0263 | −0.0189 |
| Difference in population density | −0.0005 | −0.0027 | −0.0270 ** | −0.0180 | 0.0004 | −0.0035 | −0.0200 | −0.0307 ** |
| Difference in urbanization | 0.0149 | 0.0408 ** | 0.0421 ** | 0.0382 ** | 0.0421 ** | 0.0503 ** | 0.0506 *** | 0.0605 *** |
| Difference in high−tech | −0.1238 *** | 0.0075 | 0.0308 * | 0.0470 ** | 0.0145 | 0.0263 | −0.0146 | 0.0392 ** |
| R2 | 0.305 | 0.295 | 0.300 | 0.299 | 0.296 | 0.296 | 0.292 | 0.297 |
| Adj−R2 | 0.304 | 0.294 | 0.299 | 0.298 | 0.295 | 0.295 | 0.291 | 0.296 |
Disclaimer/Publisher’s Note: The statements, opinions and data contained in all publications are solely those of the individual author(s) and contributor(s) and not of MDPI and/or the editor(s). MDPI and/or the editor(s) disclaim responsibility for any injury to people or property resulting from any ideas, methods, instructions or products referred to in the content. |
© 2025 by the authors. Licensee MDPI, Basel, Switzerland. This article is an open access article distributed under the terms and conditions of the Creative Commons Attribution (CC BY) license (https://creativecommons.org/licenses/by/4.0/).
Share and Cite
Liu, S.; Lv, W.; Xu, Z.; Qi, Q.; Jia, M.; Wang, J.; Li, T. Spatial Association Networks and Factors Influencing Ecological Security in the Yellow River Basin. Sustainability 2025, 17, 5364. https://doi.org/10.3390/su17125364
Liu S, Lv W, Xu Z, Qi Q, Jia M, Wang J, Li T. Spatial Association Networks and Factors Influencing Ecological Security in the Yellow River Basin. Sustainability. 2025; 17(12):5364. https://doi.org/10.3390/su17125364
Chicago/Turabian StyleLiu, Shu, Wenbao Lv, Zhanjun Xu, Qiangqiang Qi, Mingxuan Jia, Jiakang Wang, and Tingliang Li. 2025. "Spatial Association Networks and Factors Influencing Ecological Security in the Yellow River Basin" Sustainability 17, no. 12: 5364. https://doi.org/10.3390/su17125364
APA StyleLiu, S., Lv, W., Xu, Z., Qi, Q., Jia, M., Wang, J., & Li, T. (2025). Spatial Association Networks and Factors Influencing Ecological Security in the Yellow River Basin. Sustainability, 17(12), 5364. https://doi.org/10.3390/su17125364