Navigating the Convergence of Global Competitiveness and Sustainable Development: A Multi-Level Analysis
Abstract
1. Introduction
2. Literature Review
2.1. Global Competitiveness (GC)
2.2. Institutions
2.3. Infrastructure
2.4. Education
2.5. Technology
2.6. Business Sophistication
2.7. Innovation
2.8. Macroeconomic Environment
2.9. Sustainable Development (SD)
2.9.1. Economic Dimension
2.9.2. Social Dimension
2.9.3. Environmental Dimension
2.10. Hypothesis Development
3. Methodology
3.1. Measure Selection and Data Sources
3.2. Country, Country Cluster, and Outlier Determination
3.3. Statistical Method
3.4. Data Analysis
4. Results
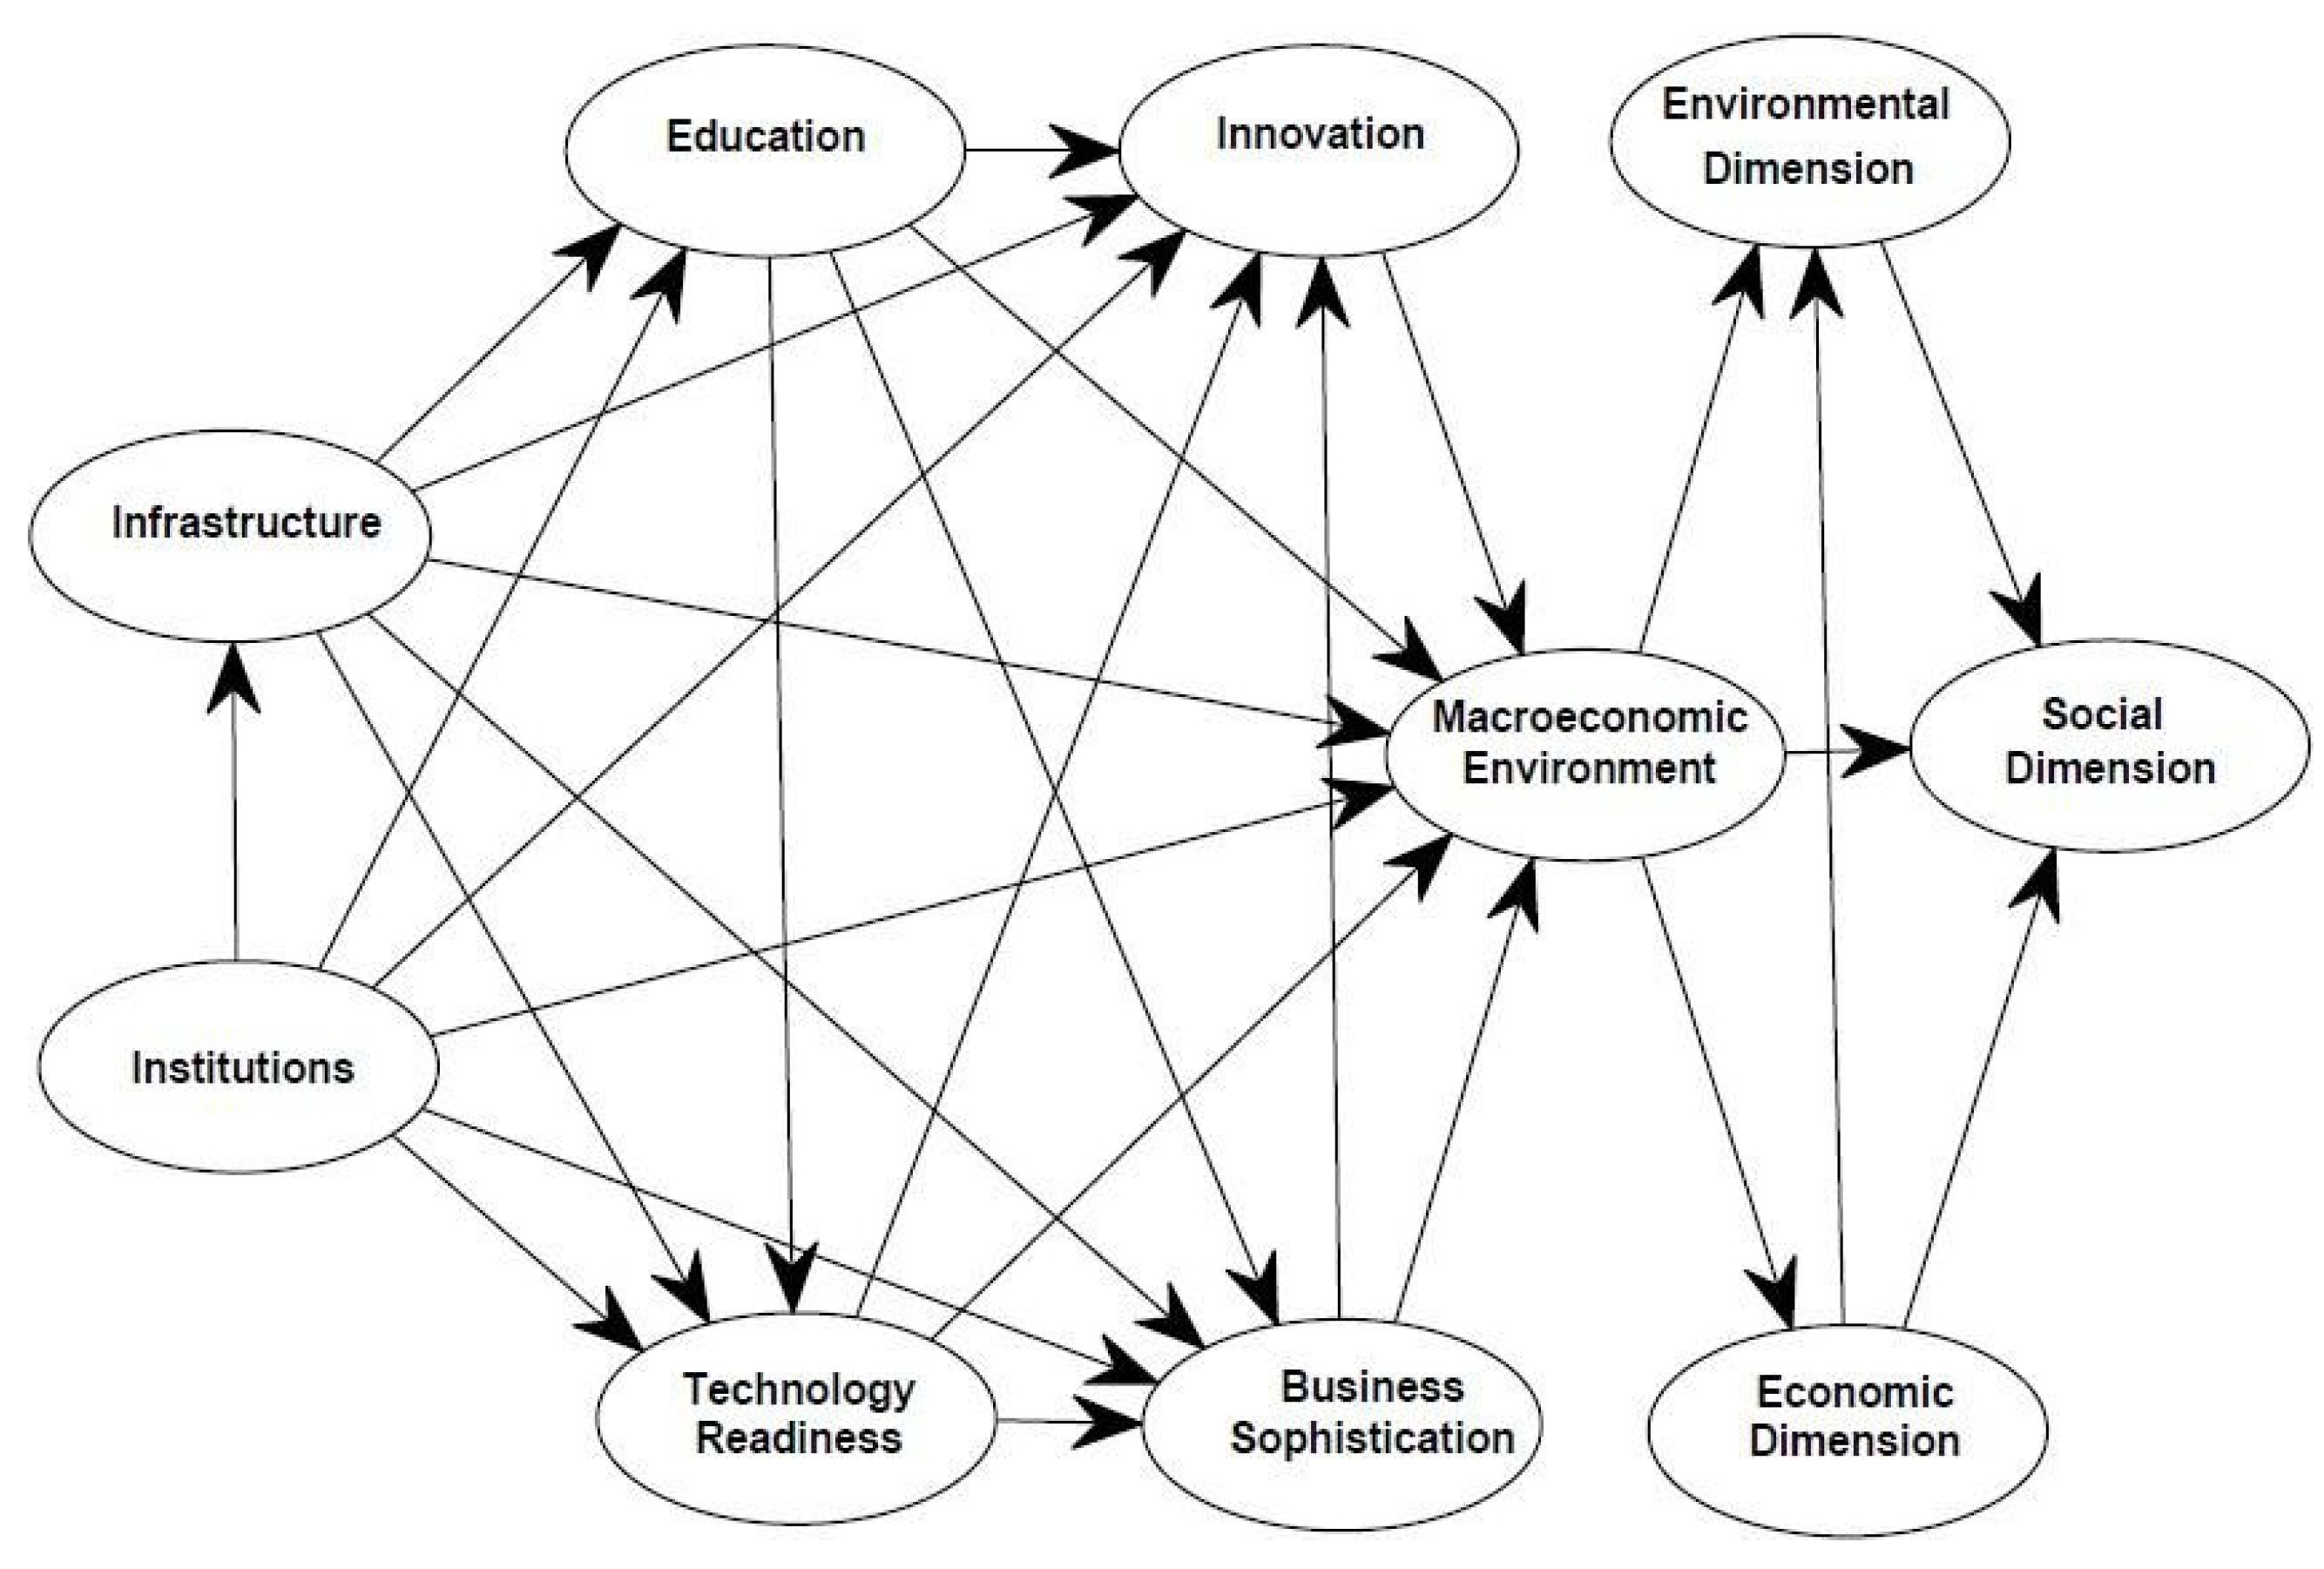
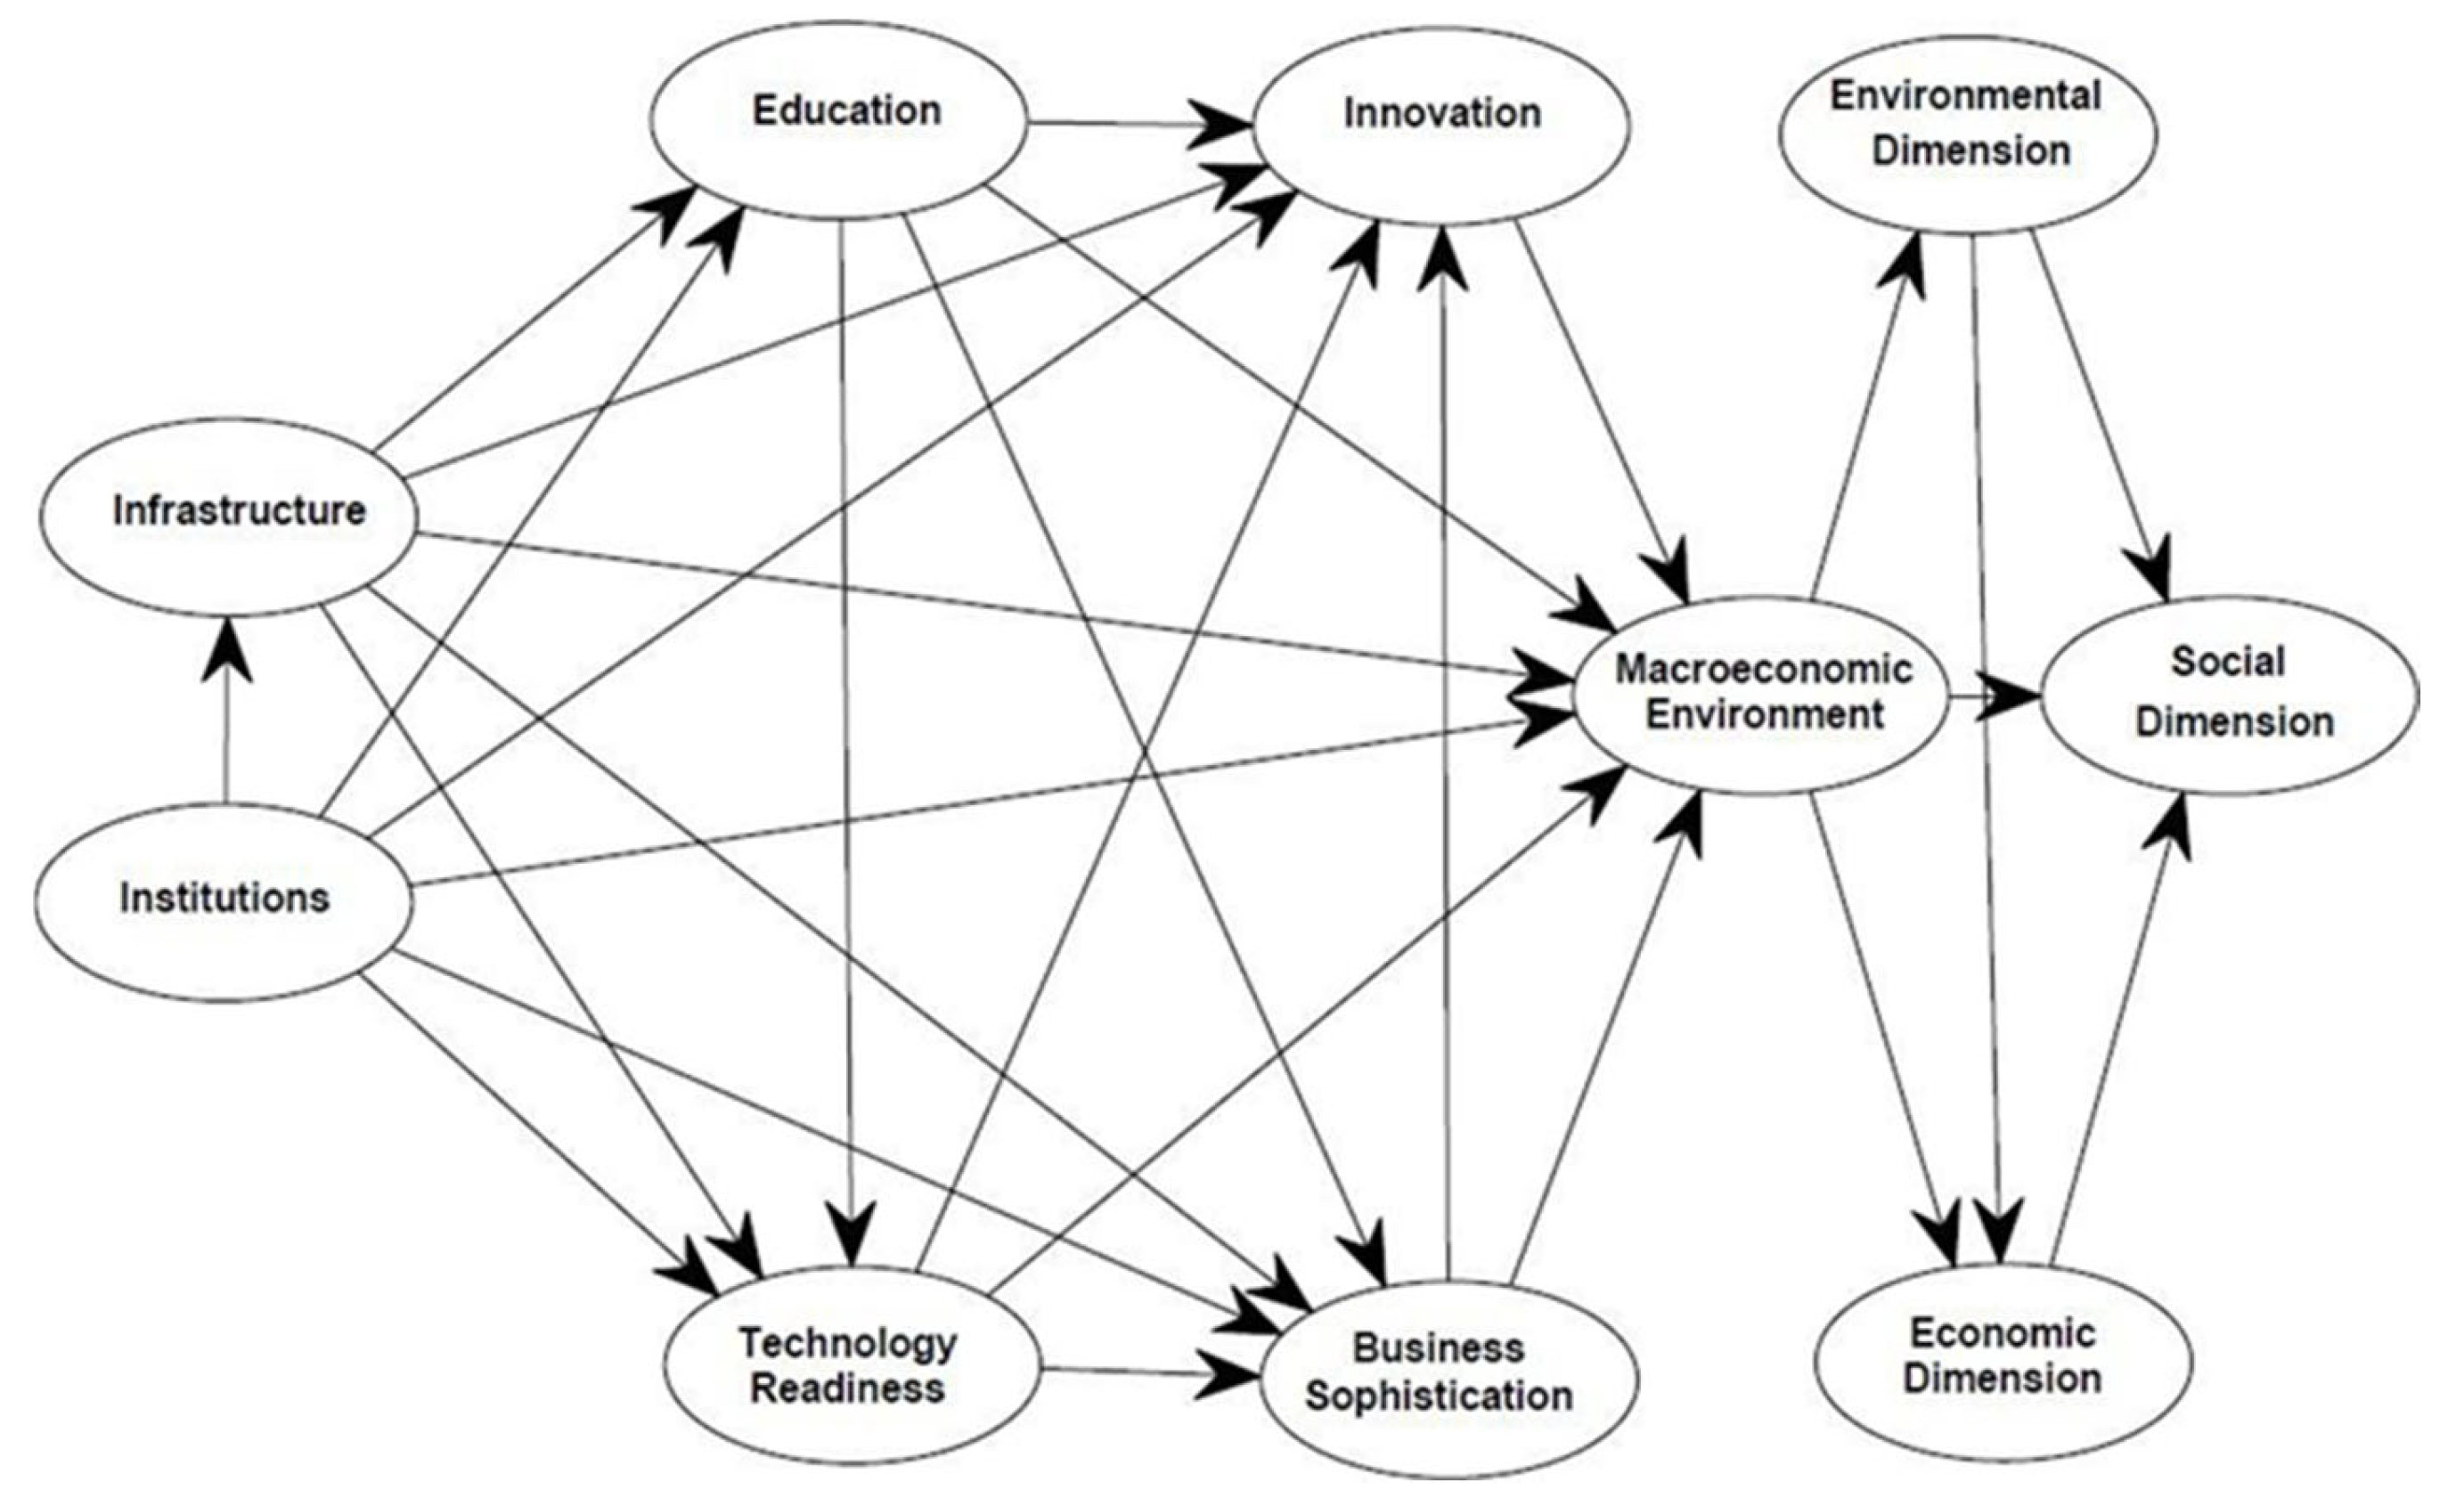
4.1. Interactions Among GC Pillars and Their Relationships with the Macroeconomic Environment (Global and Country Cluster Level)
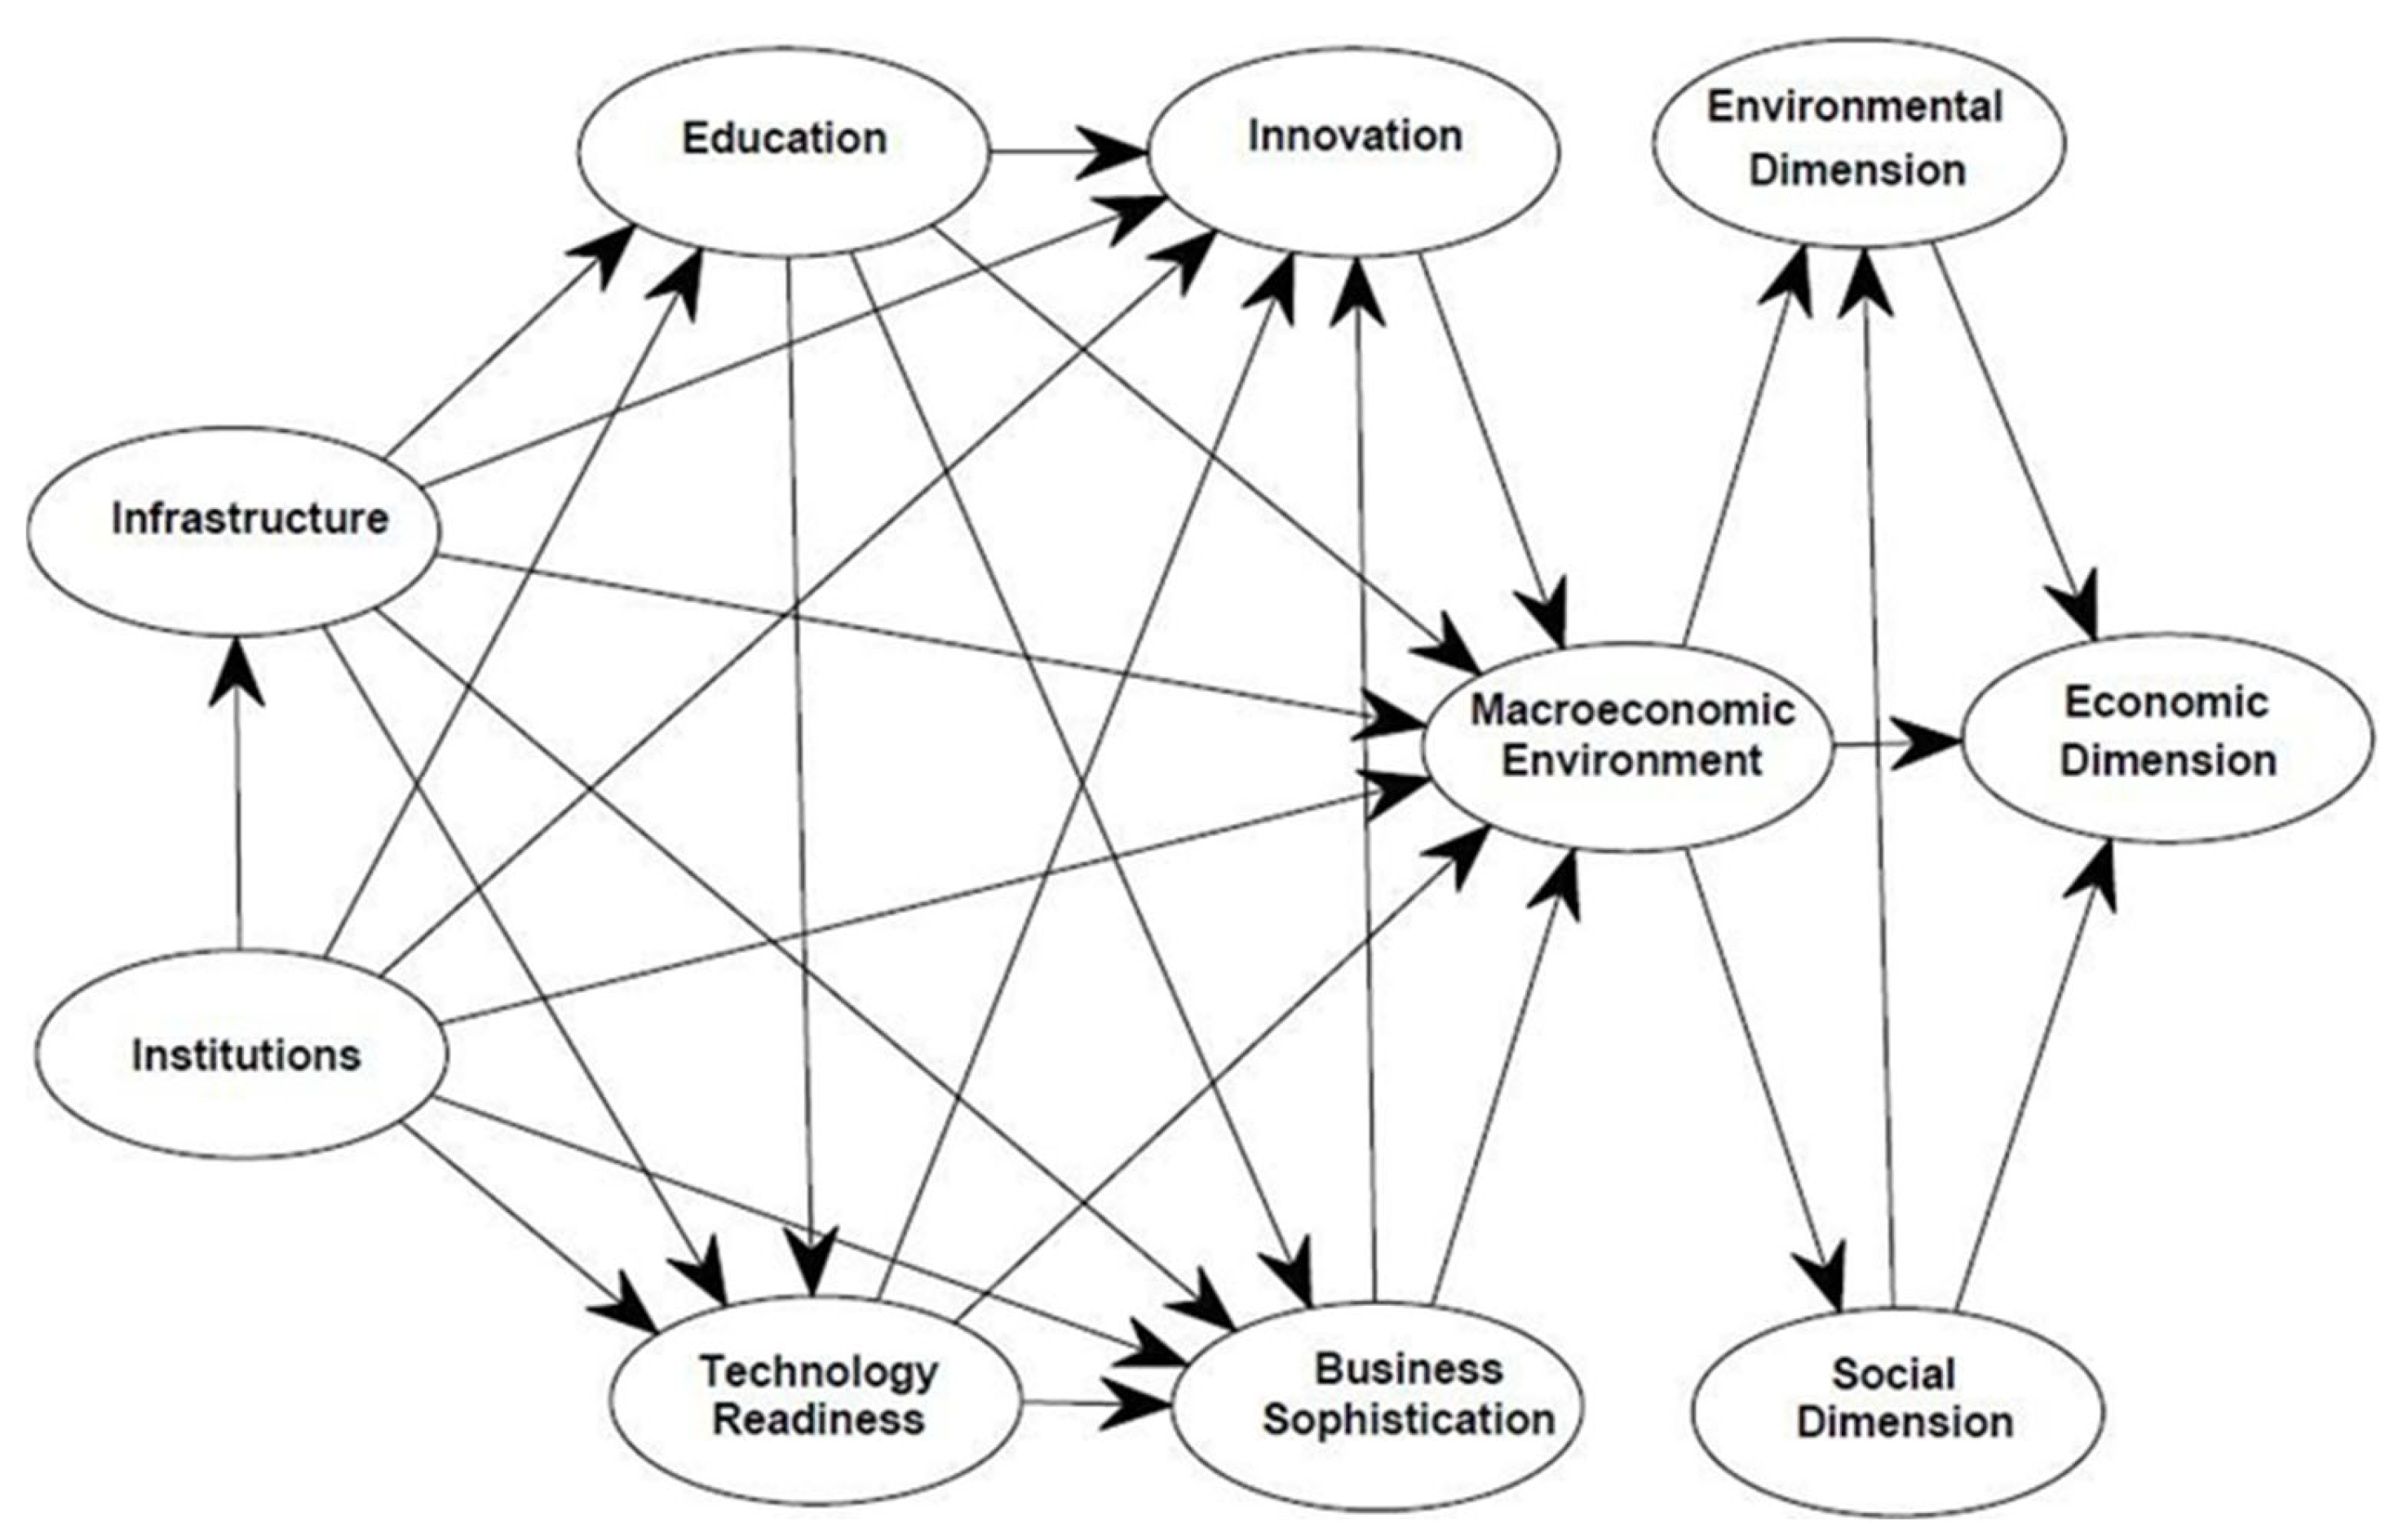
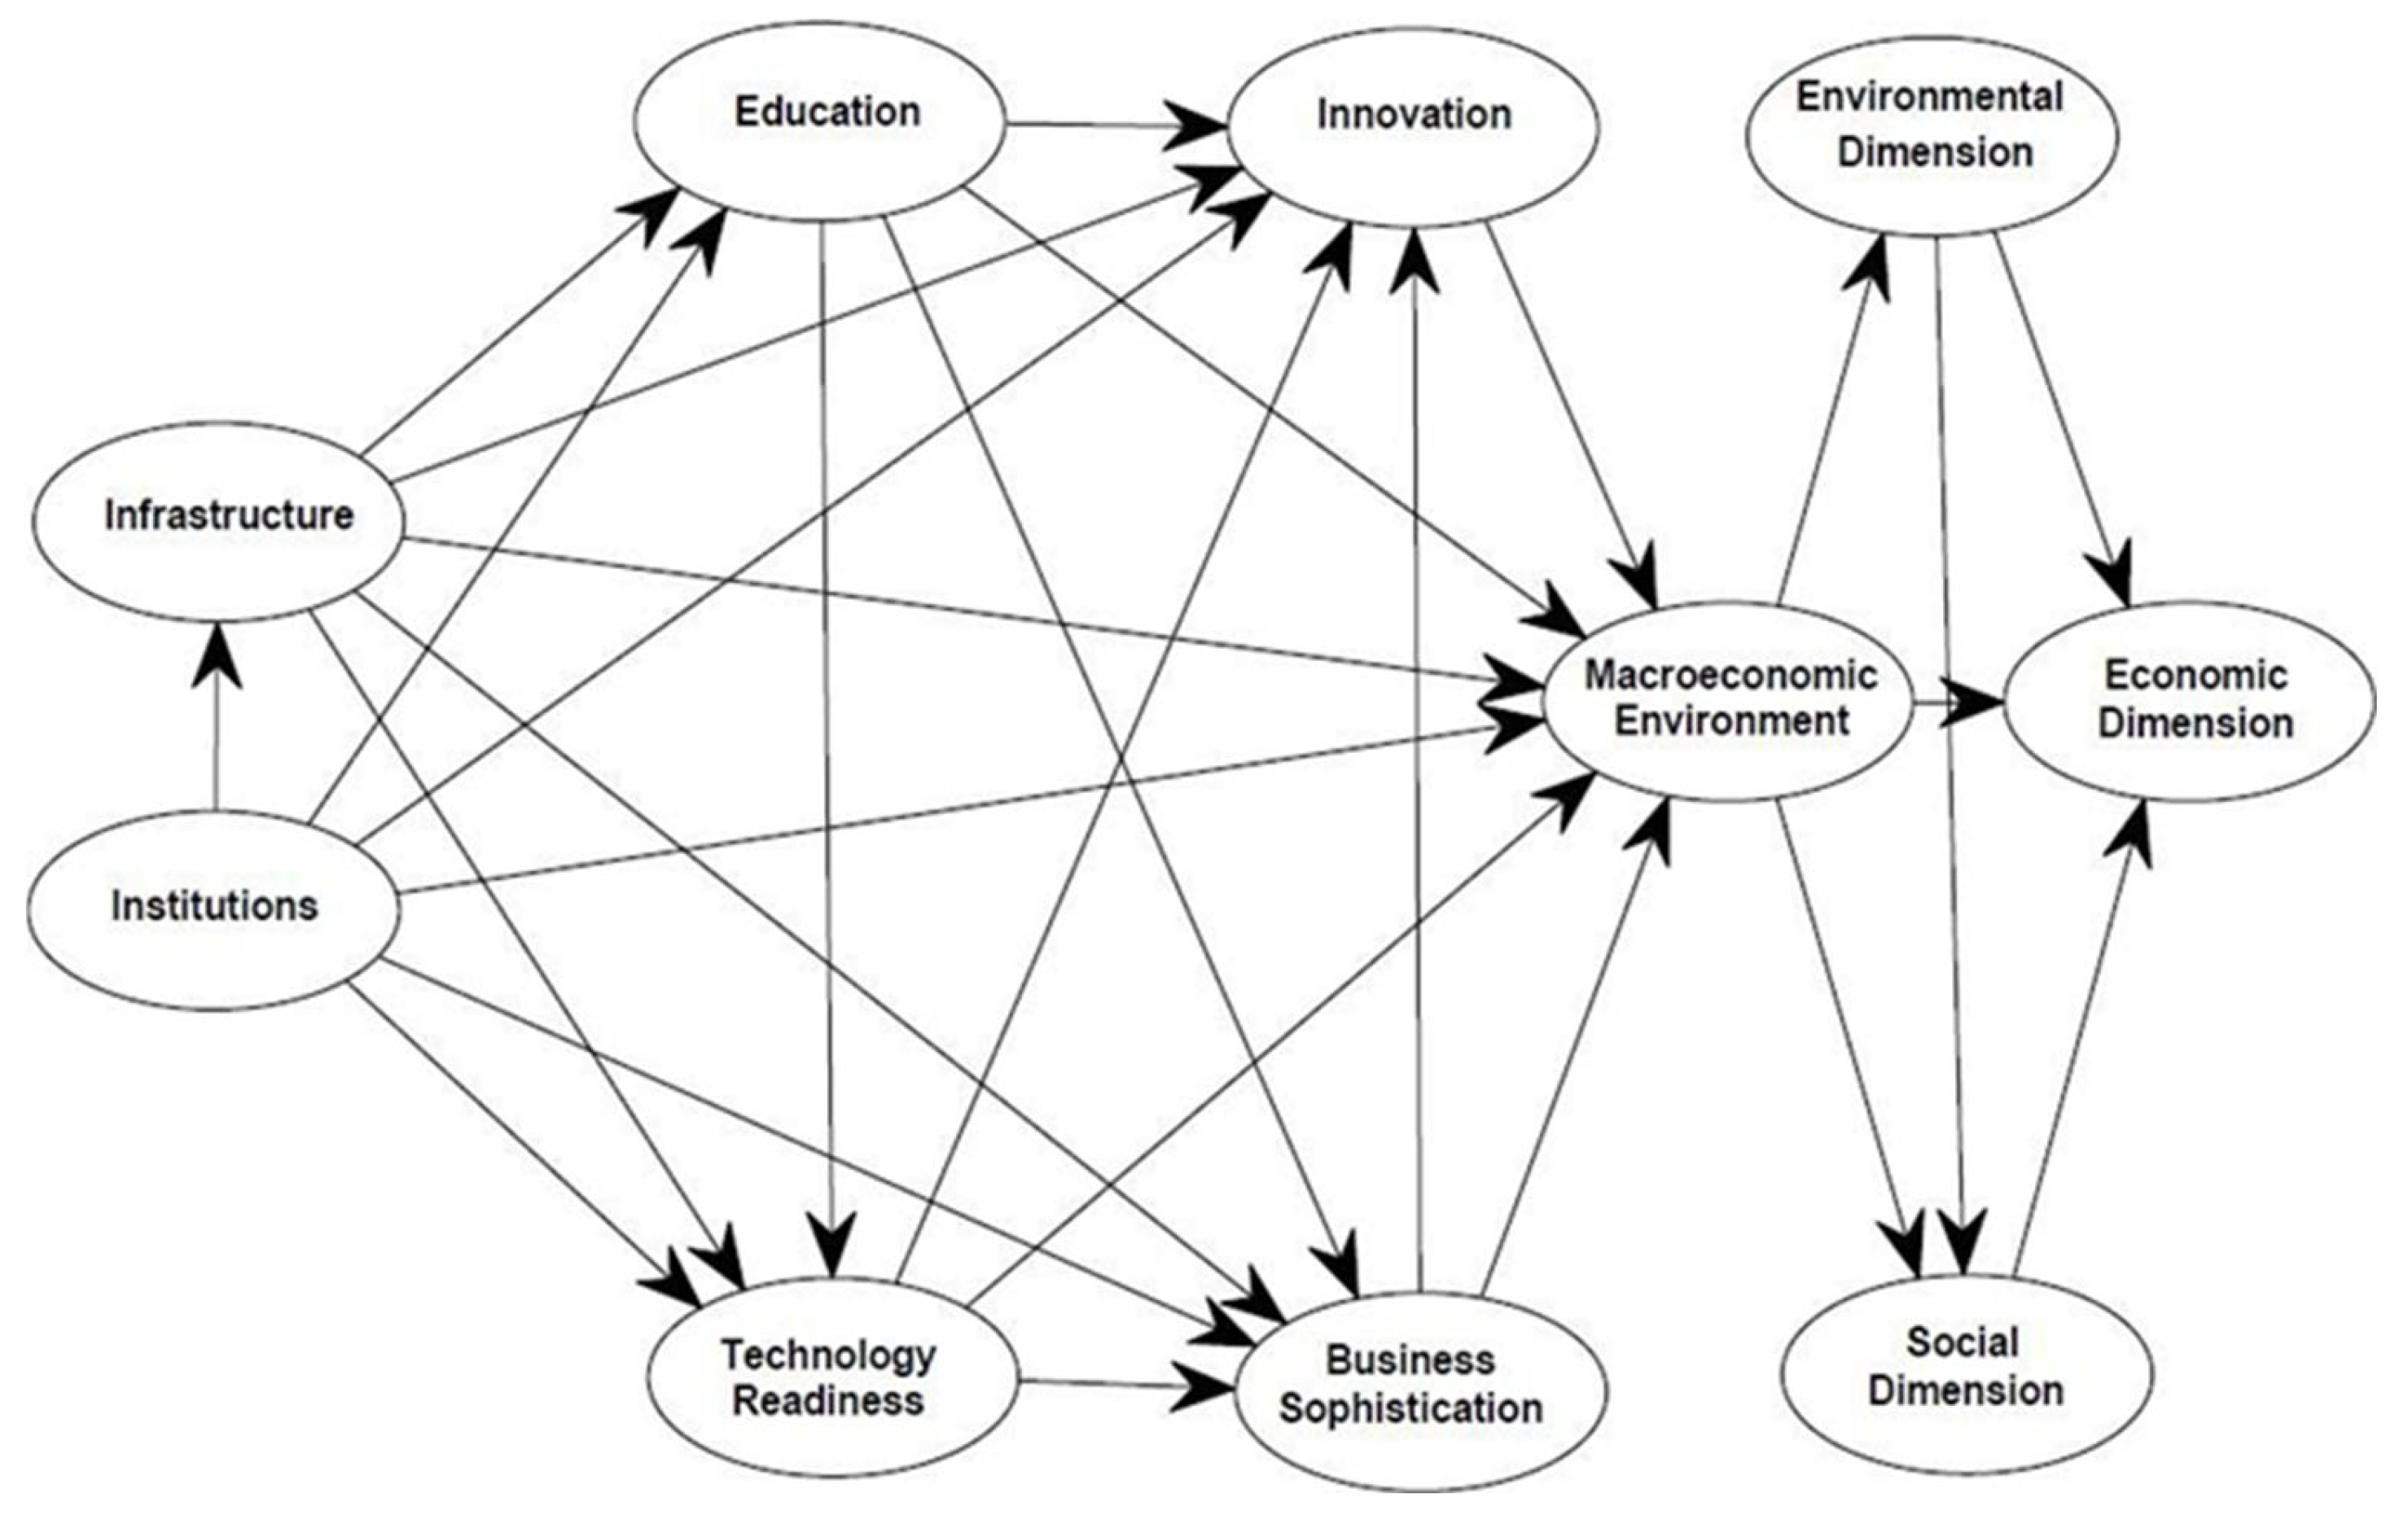
4.2. Relationships Between Macroeconomic Environment and SD Dimensions (Global and Country Cluster Level) (Models 1.1–1.6)
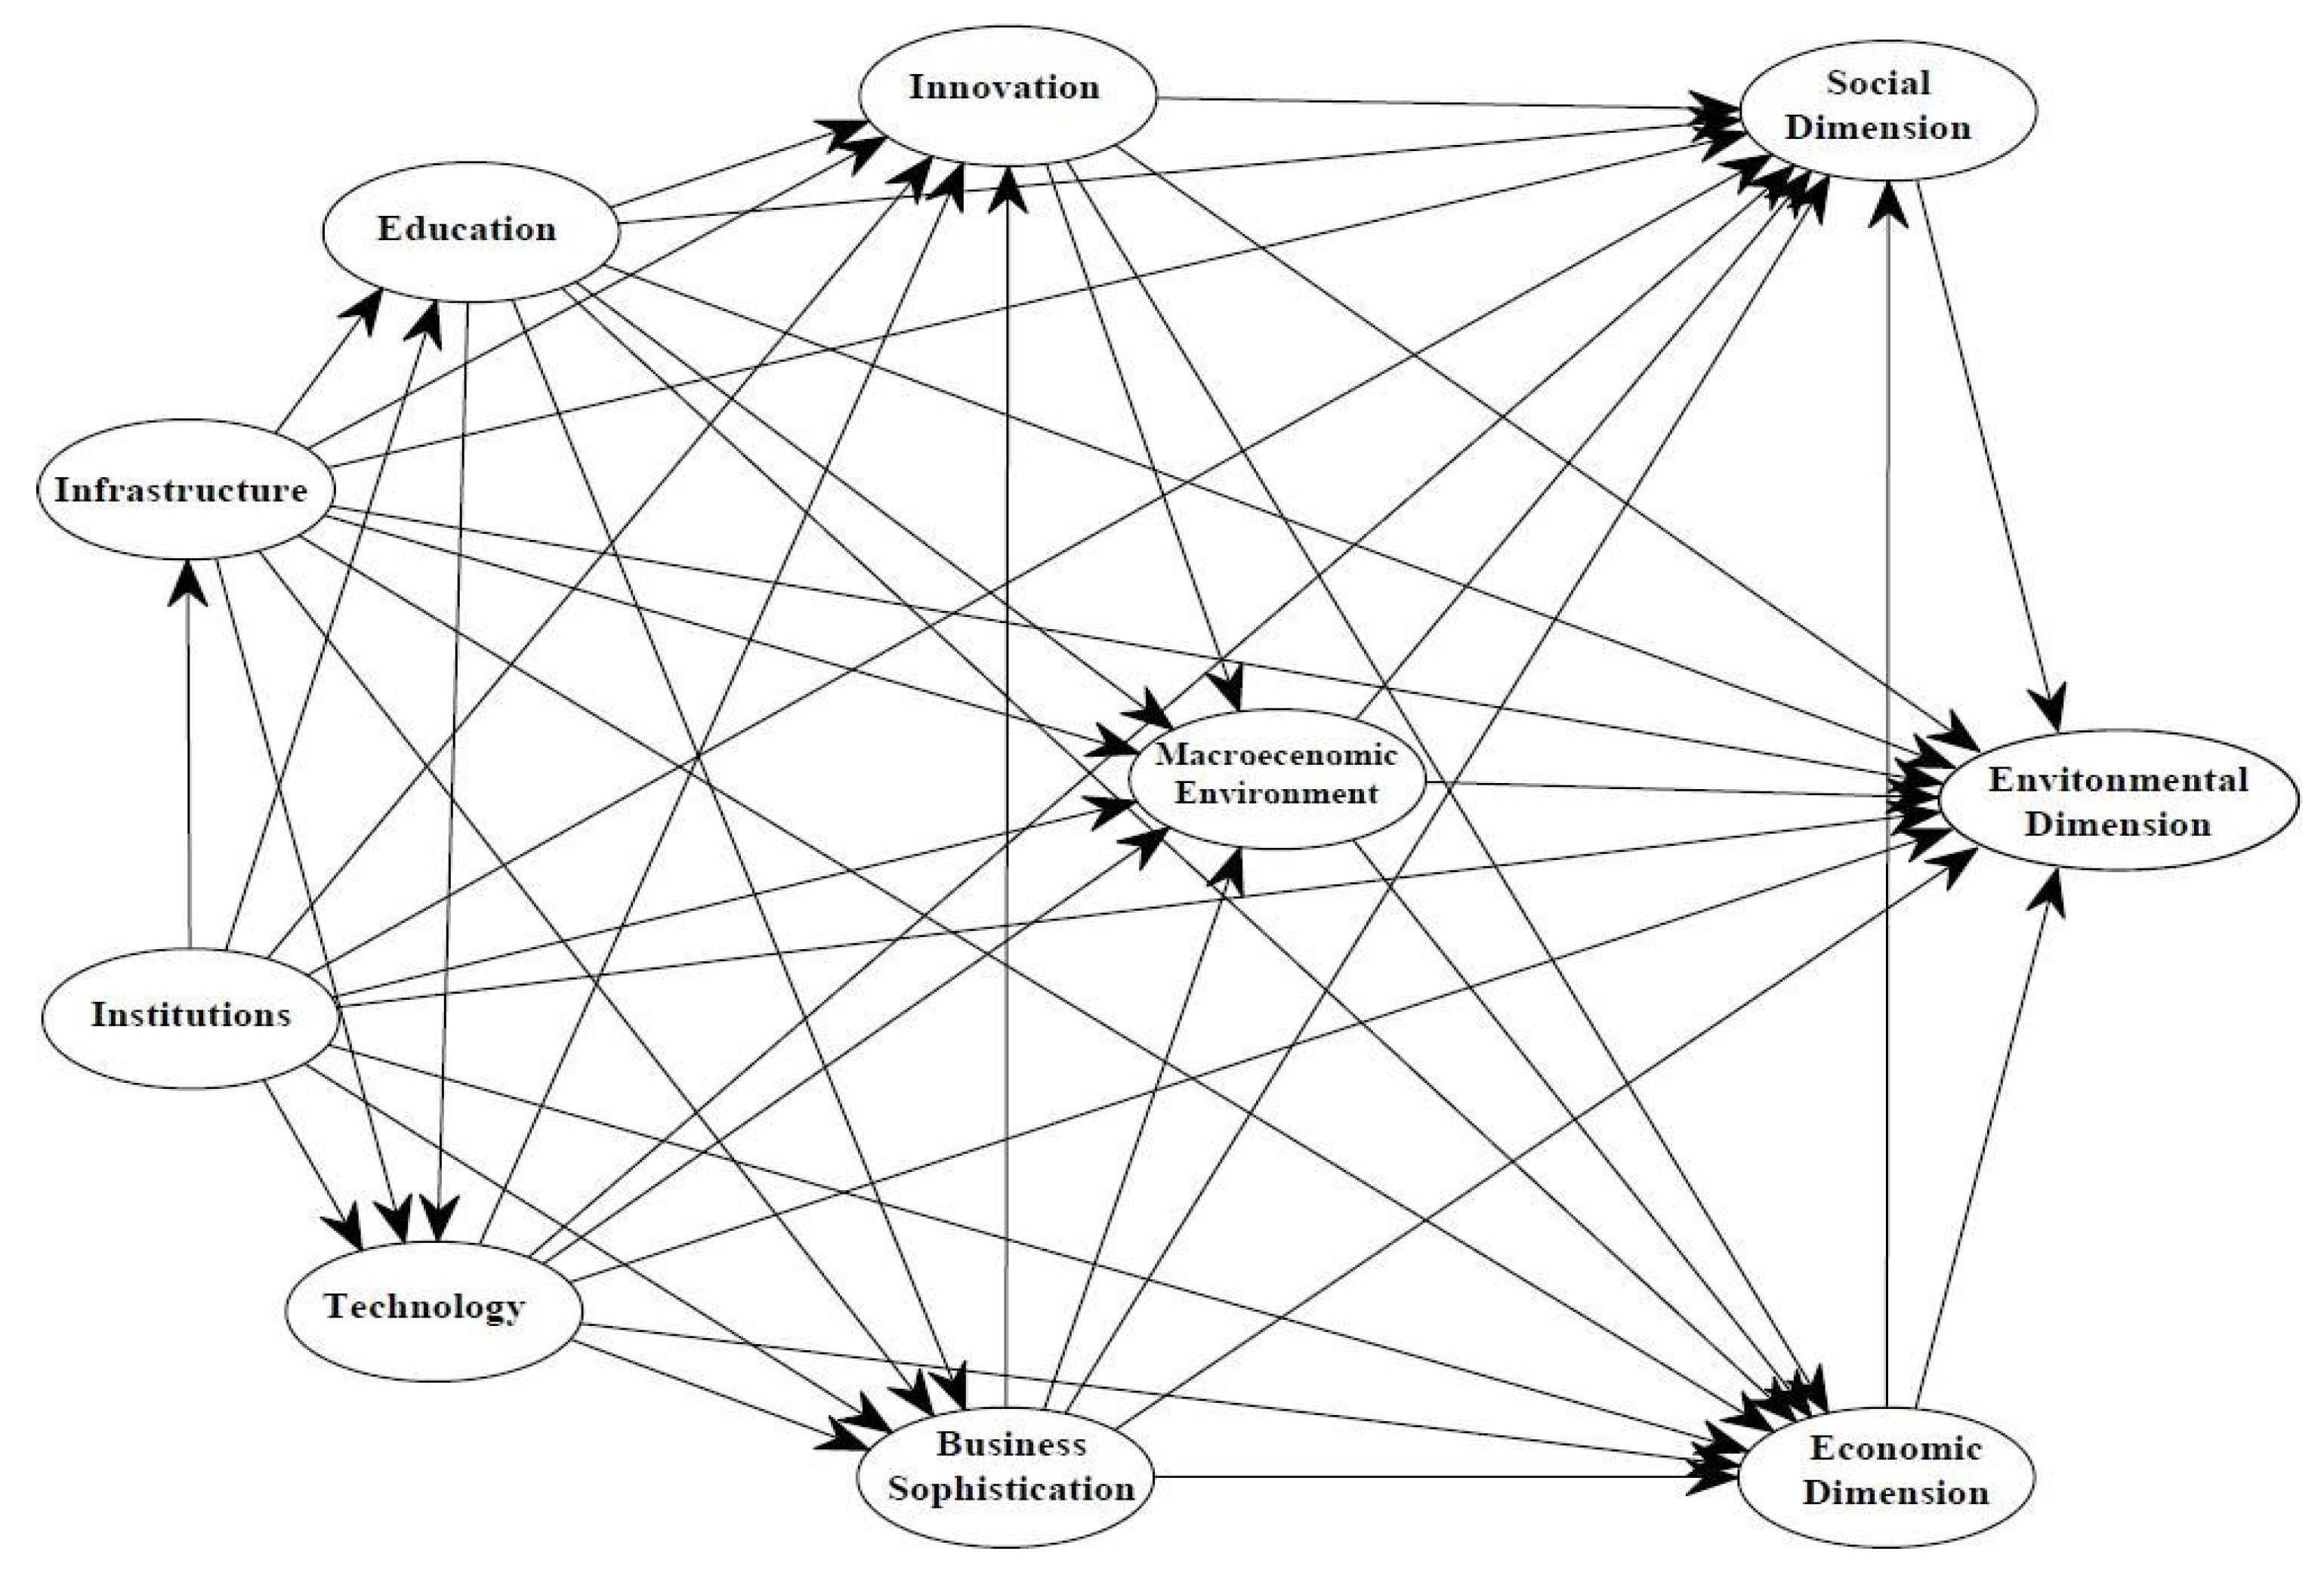
4.3. Sustainable Development Dimensions and Country Outliers (Global) (Model 2)
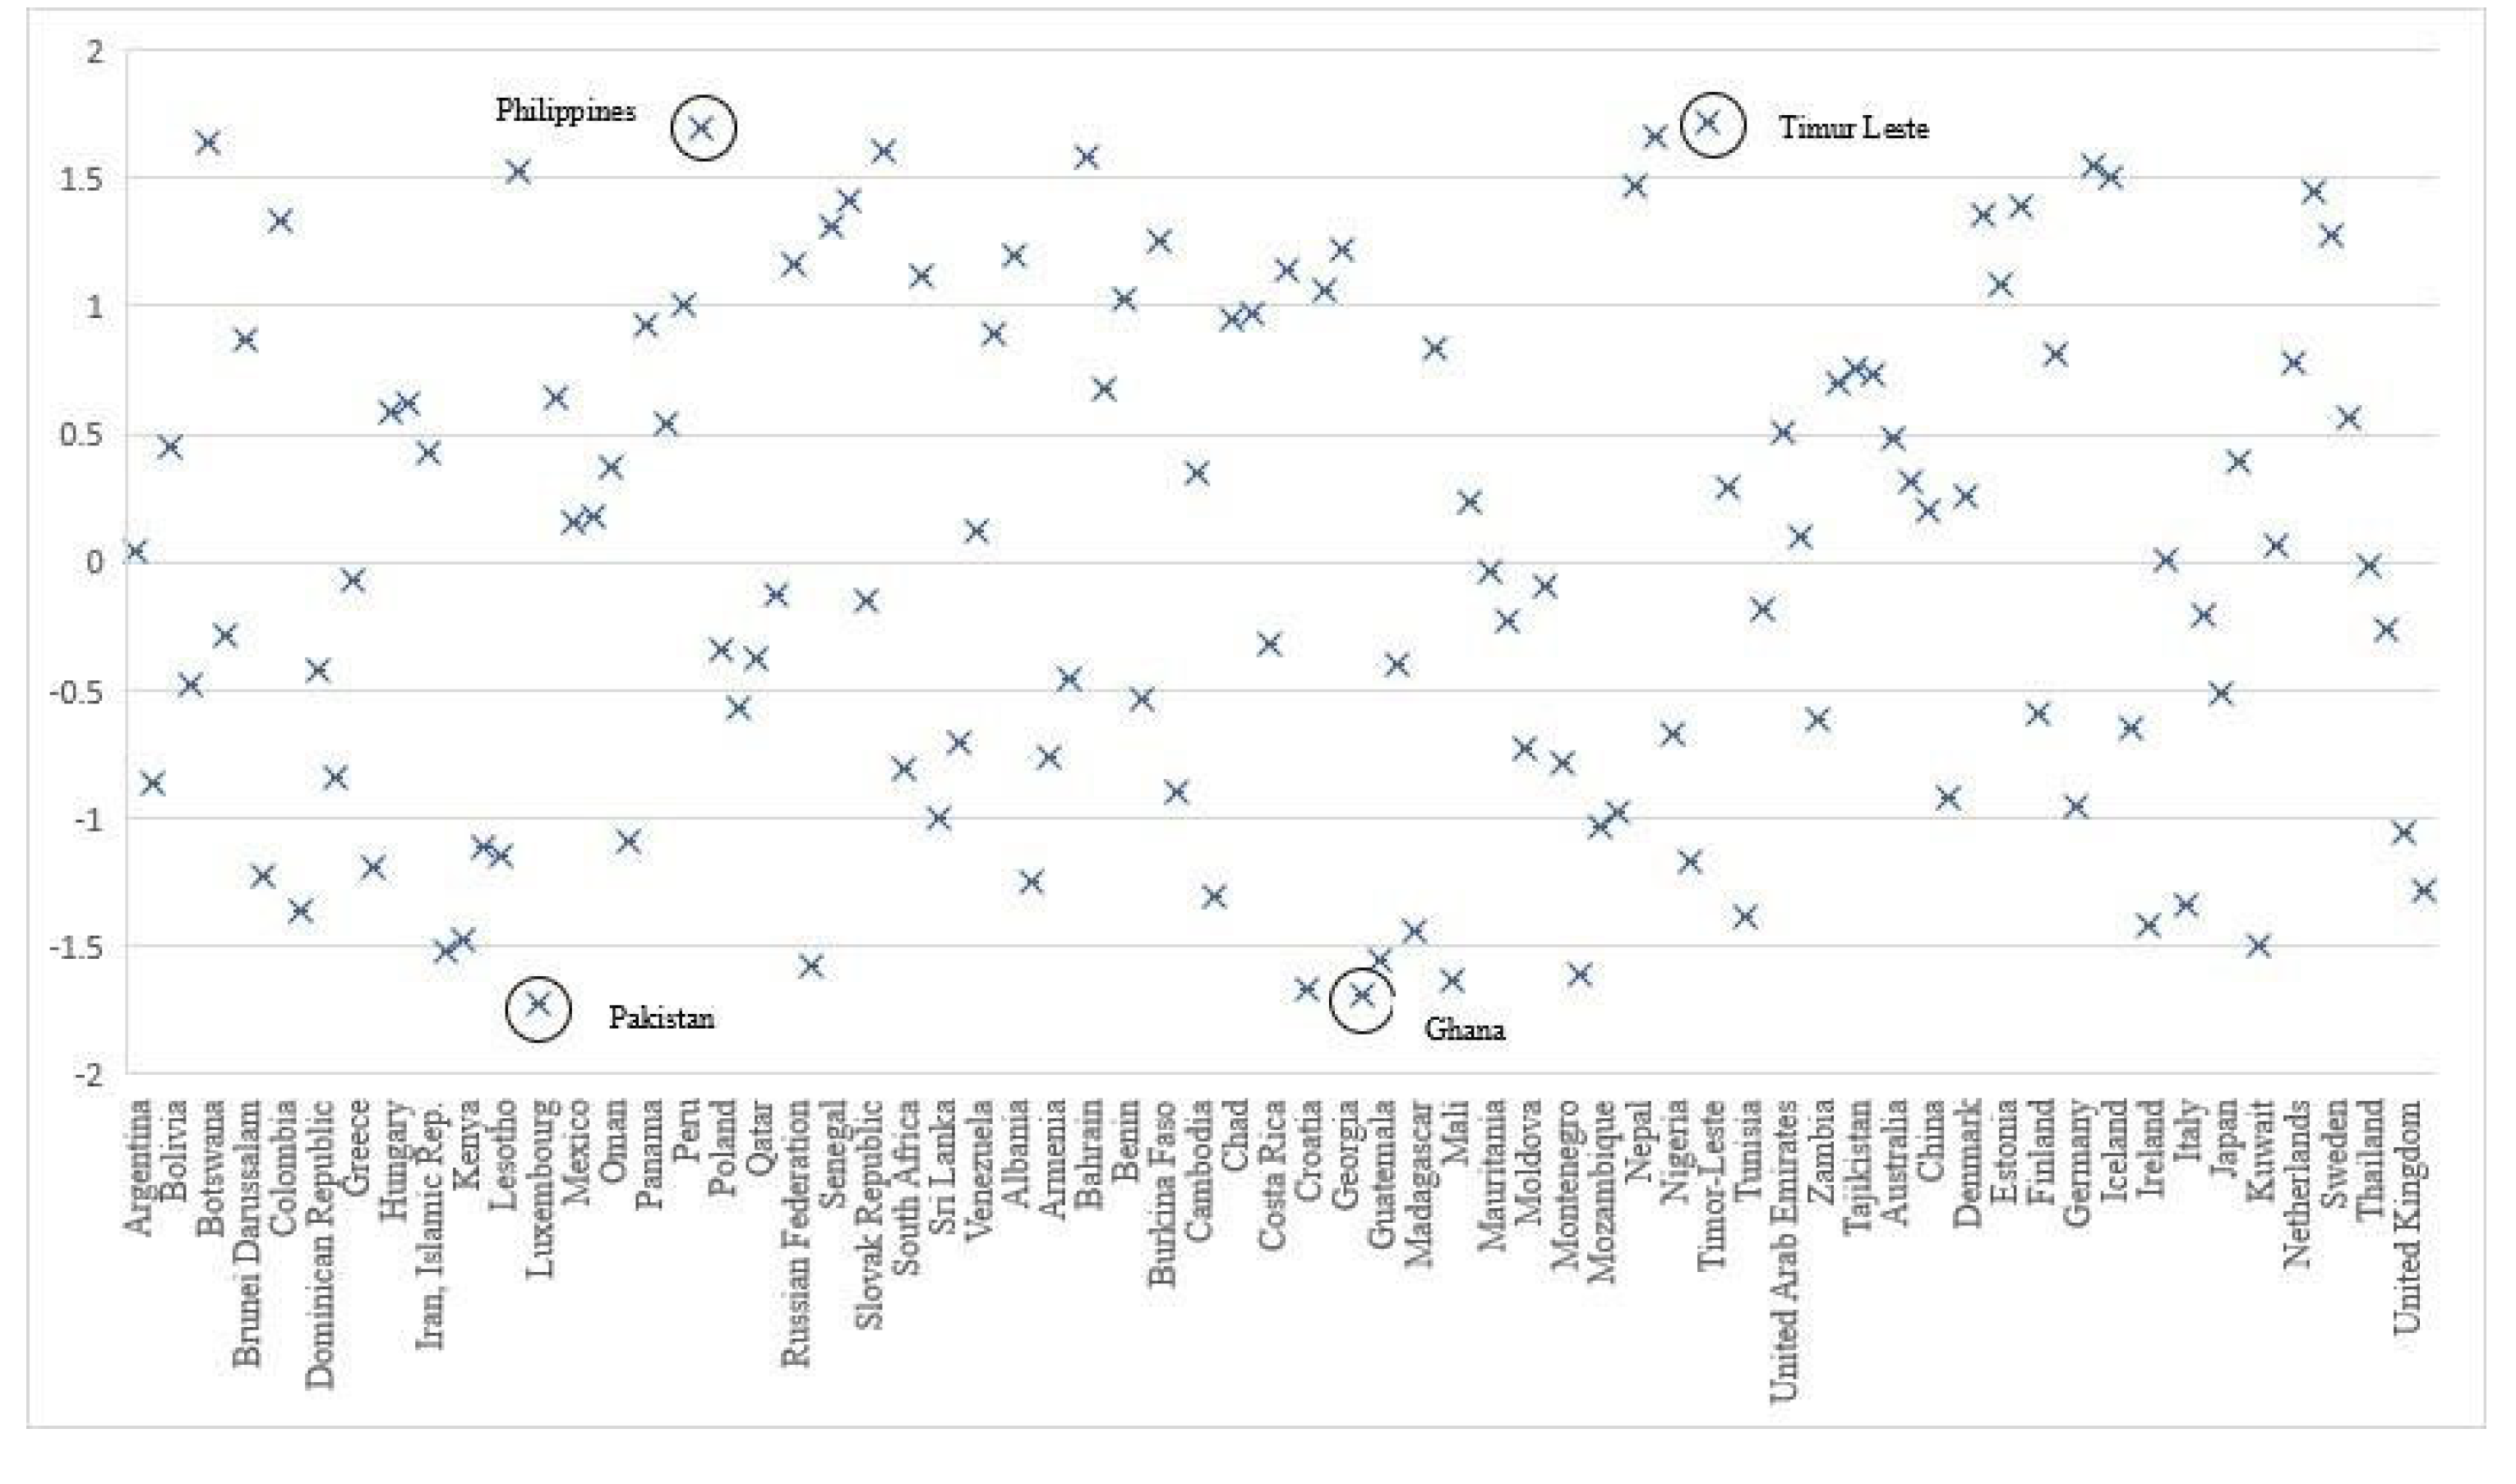
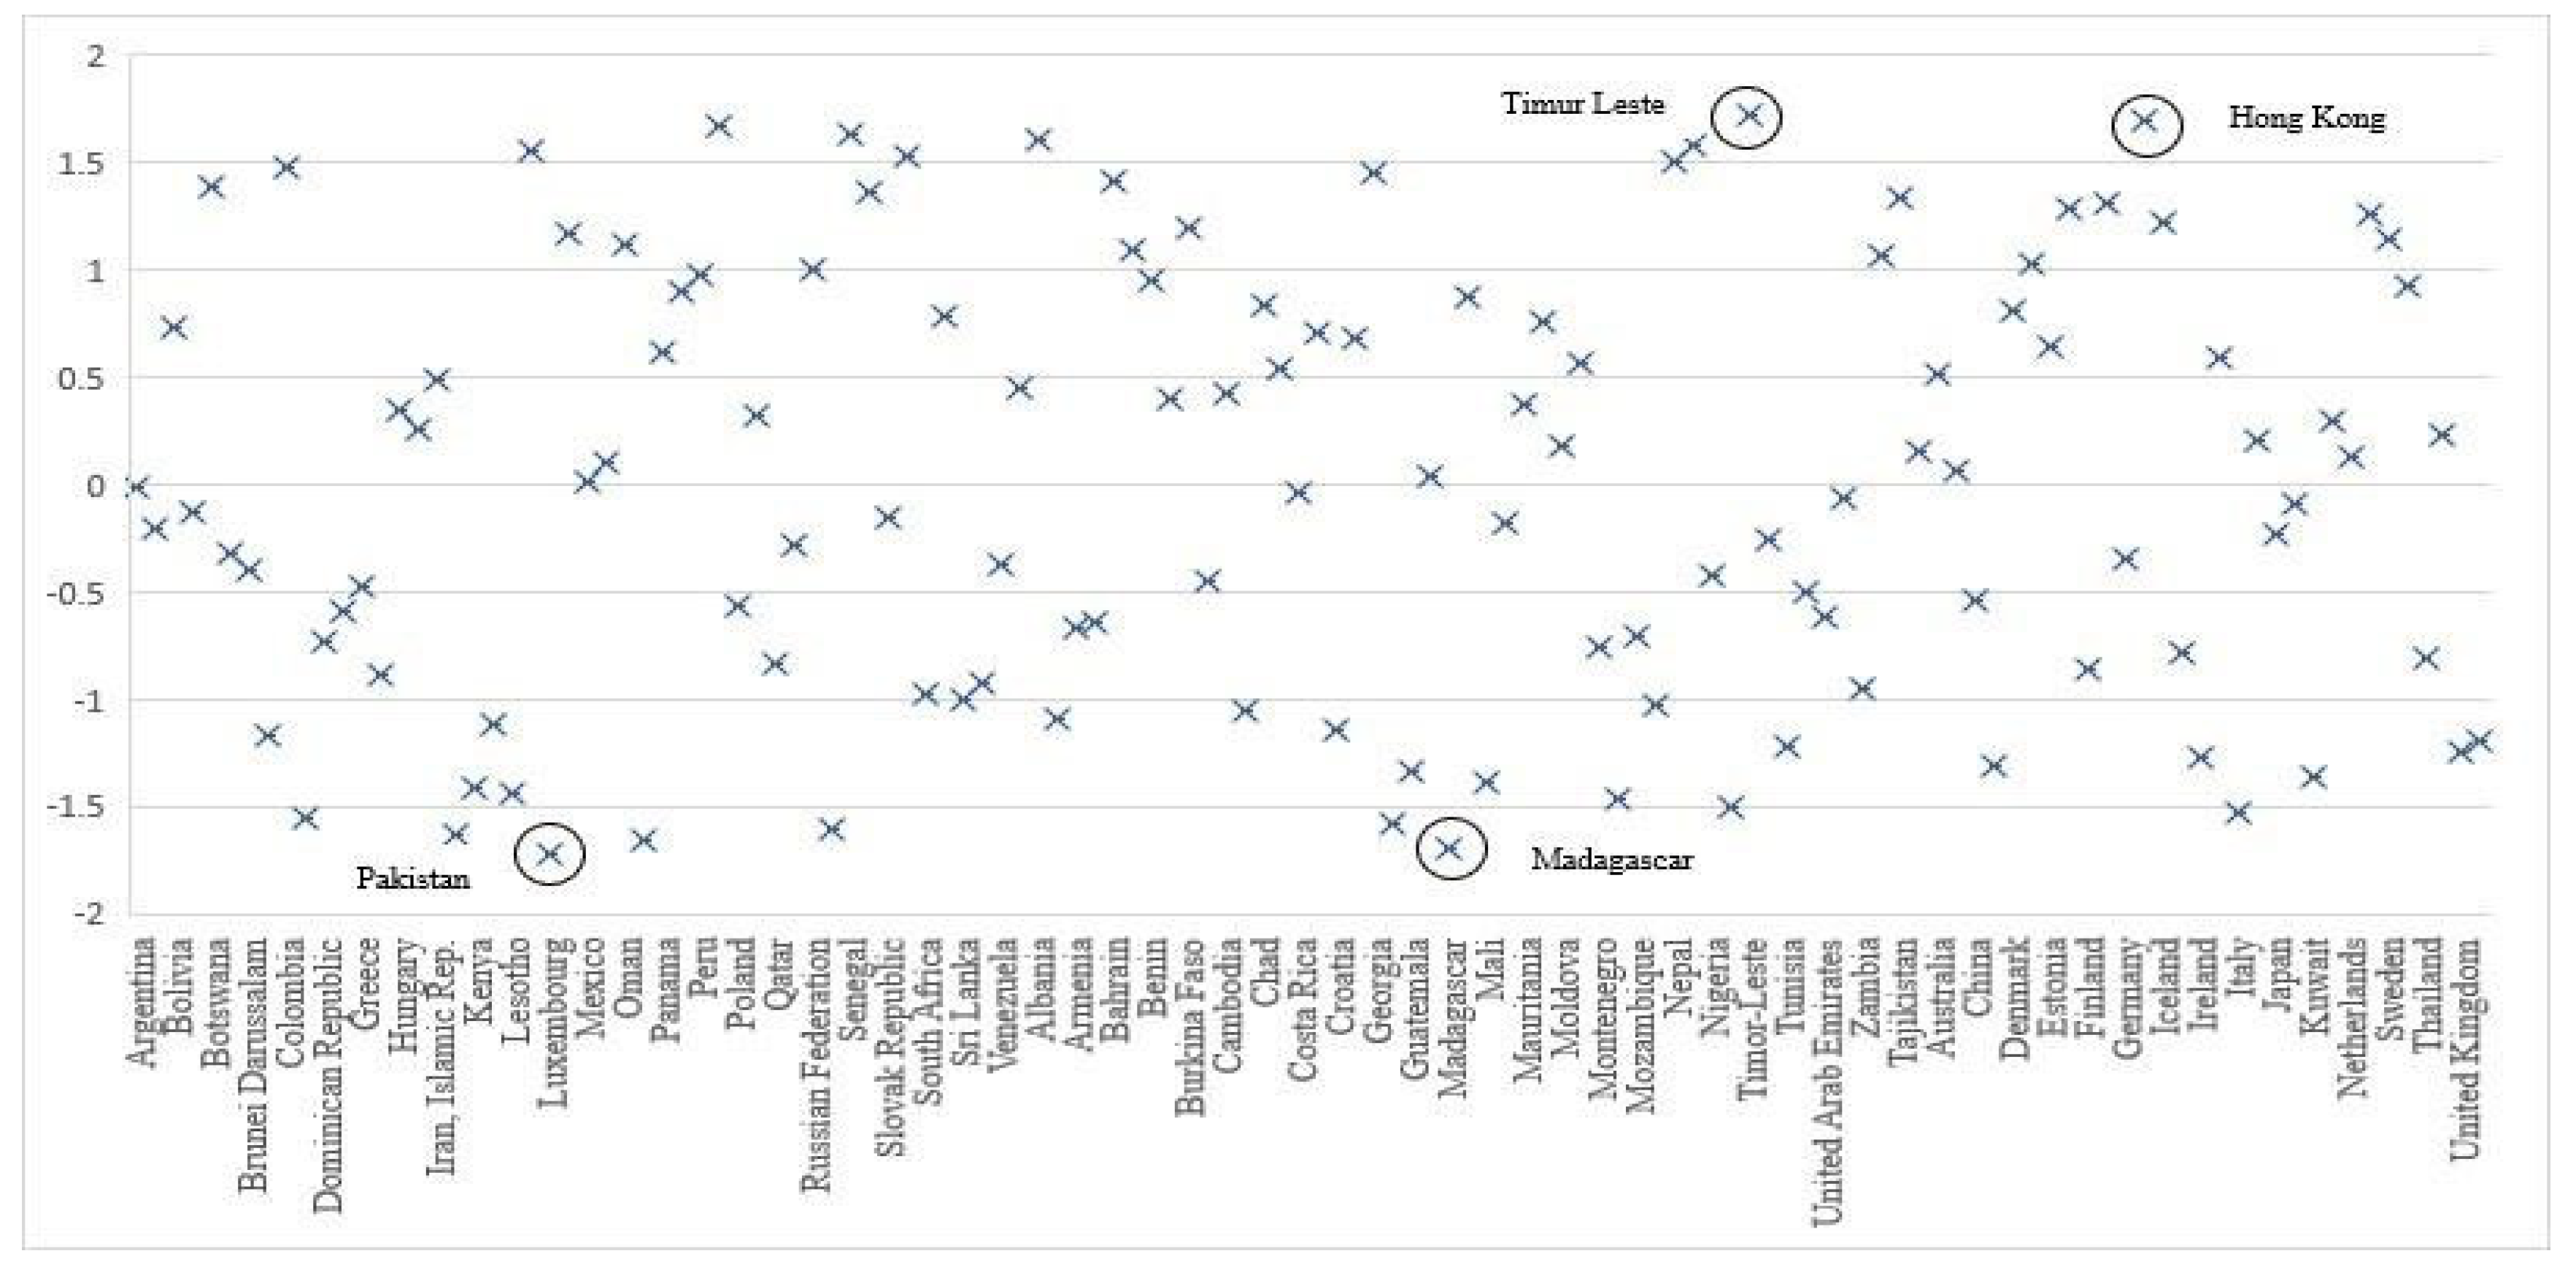
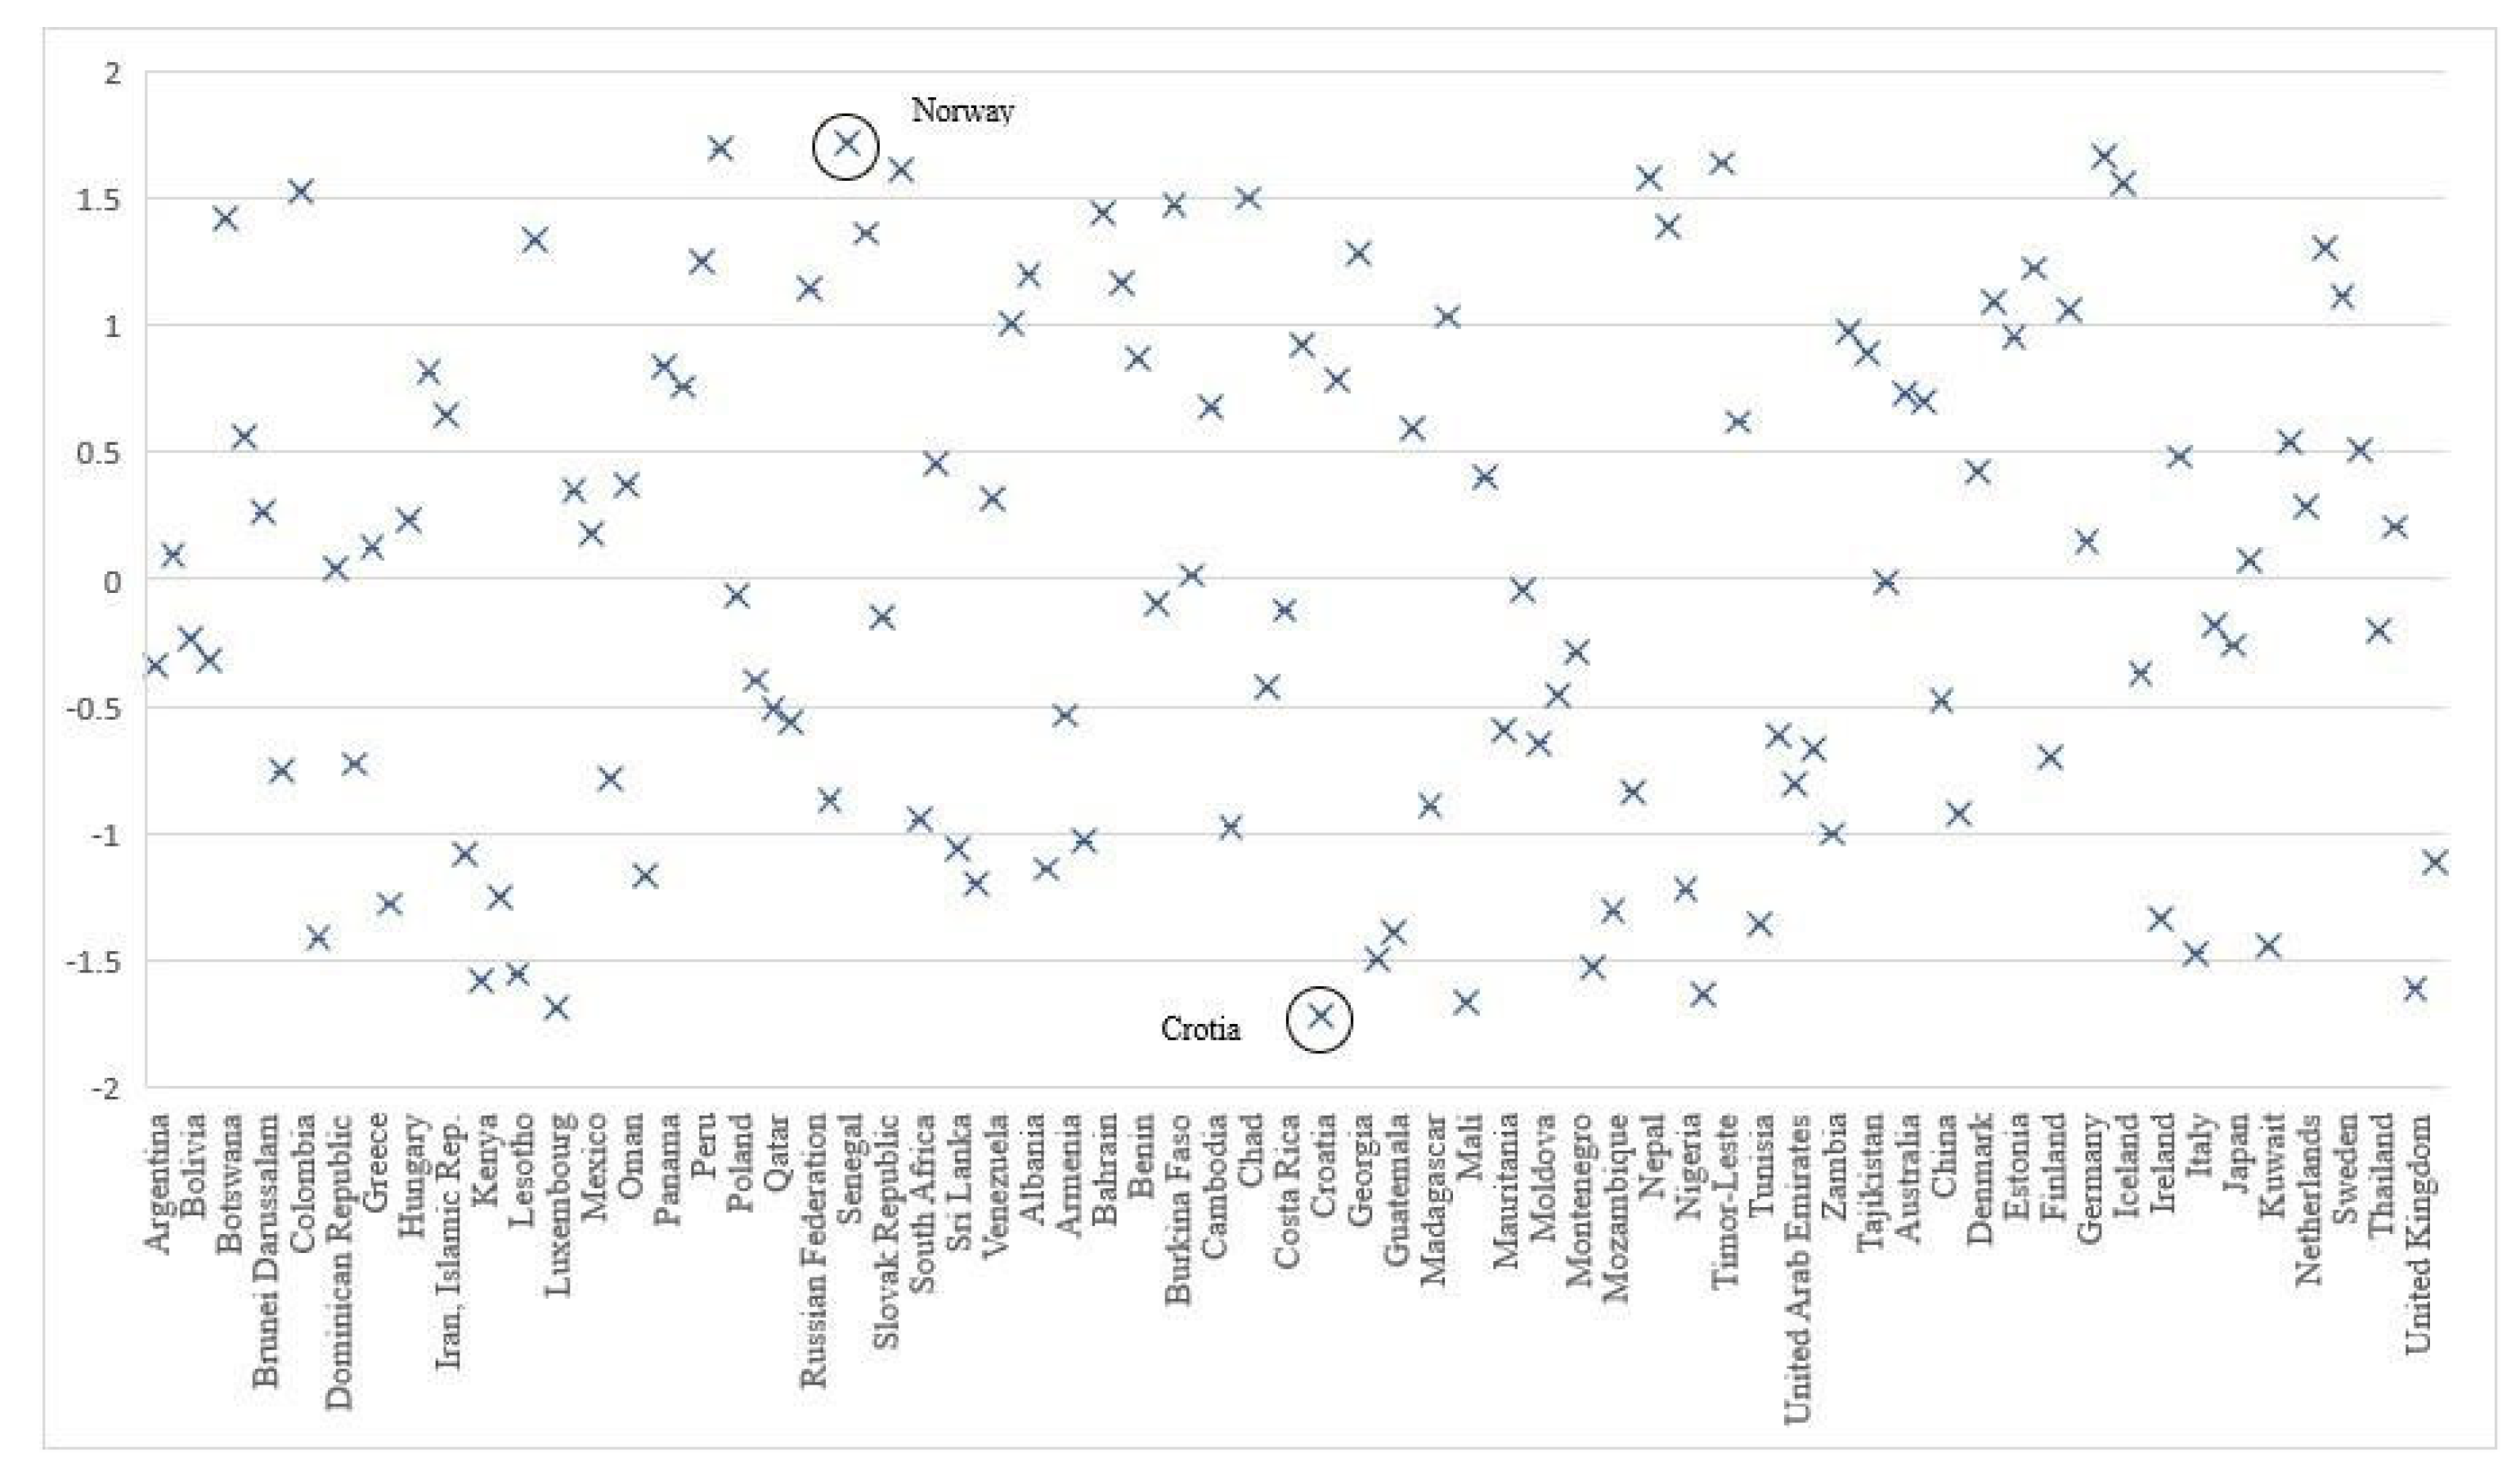
4.3.1. SD Dimensions and Country Outliers (Very Competitive) (Model 2)
4.3.2. SD Dimensions and Country Outliers (Competitive) (Model 2)
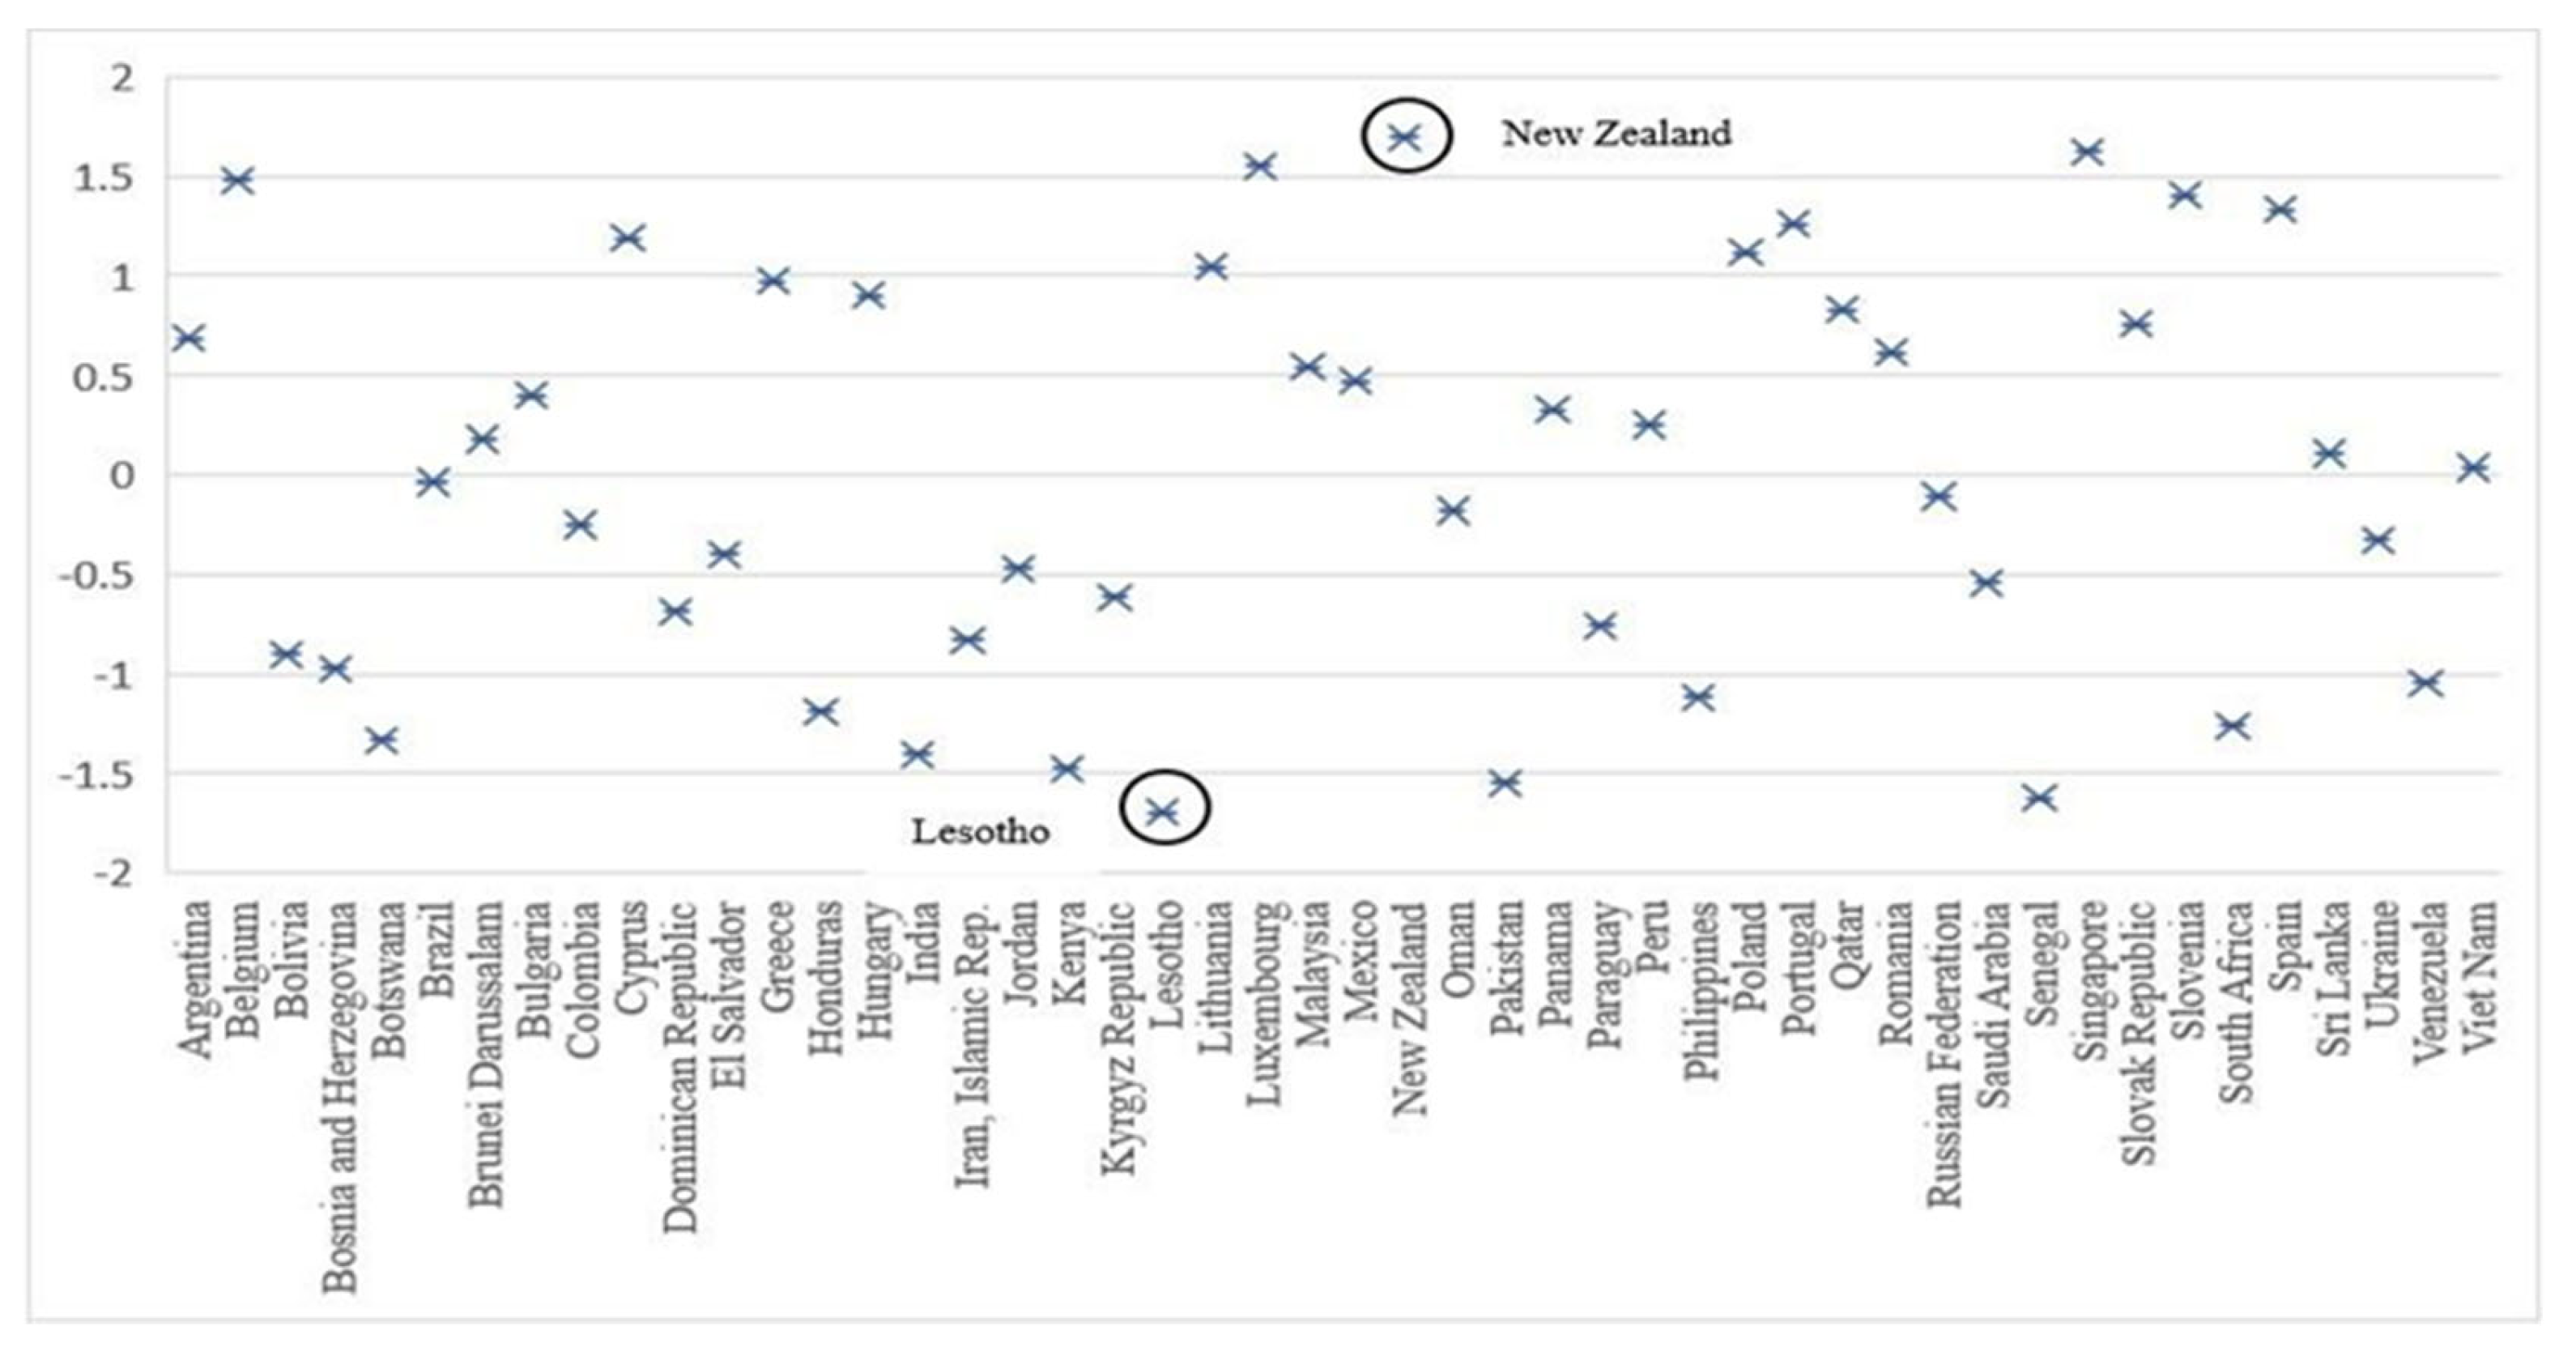
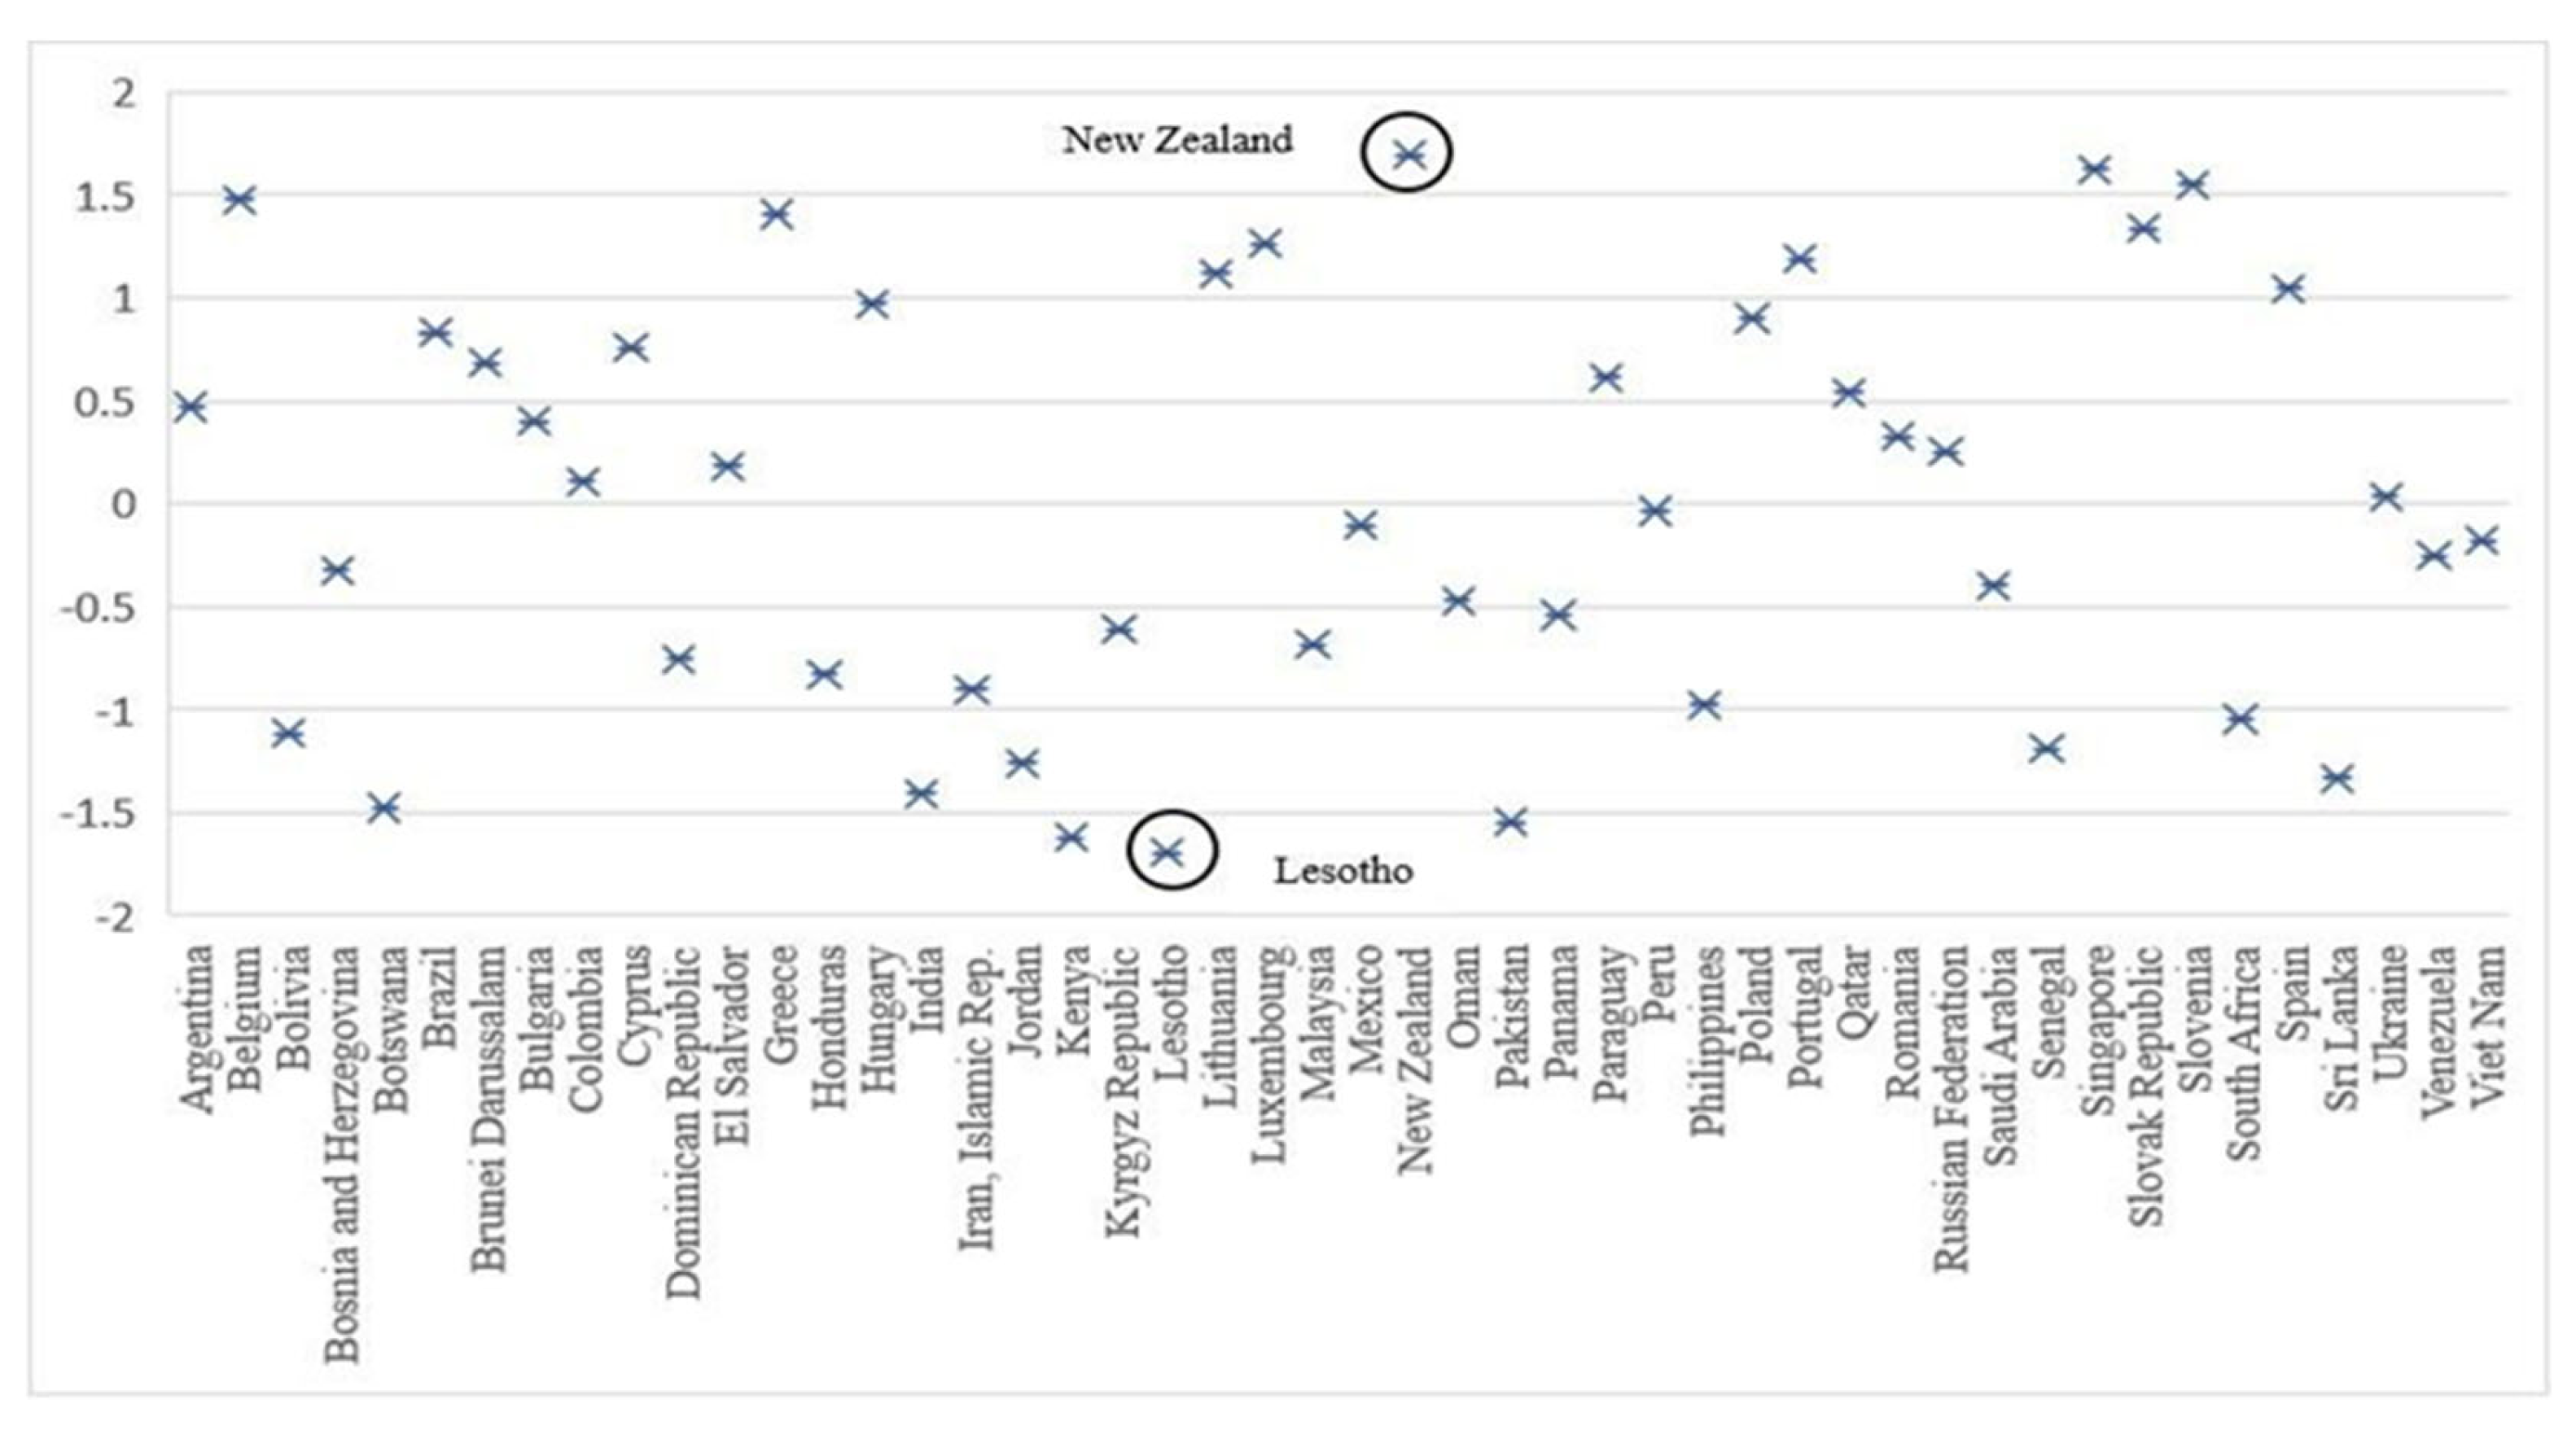
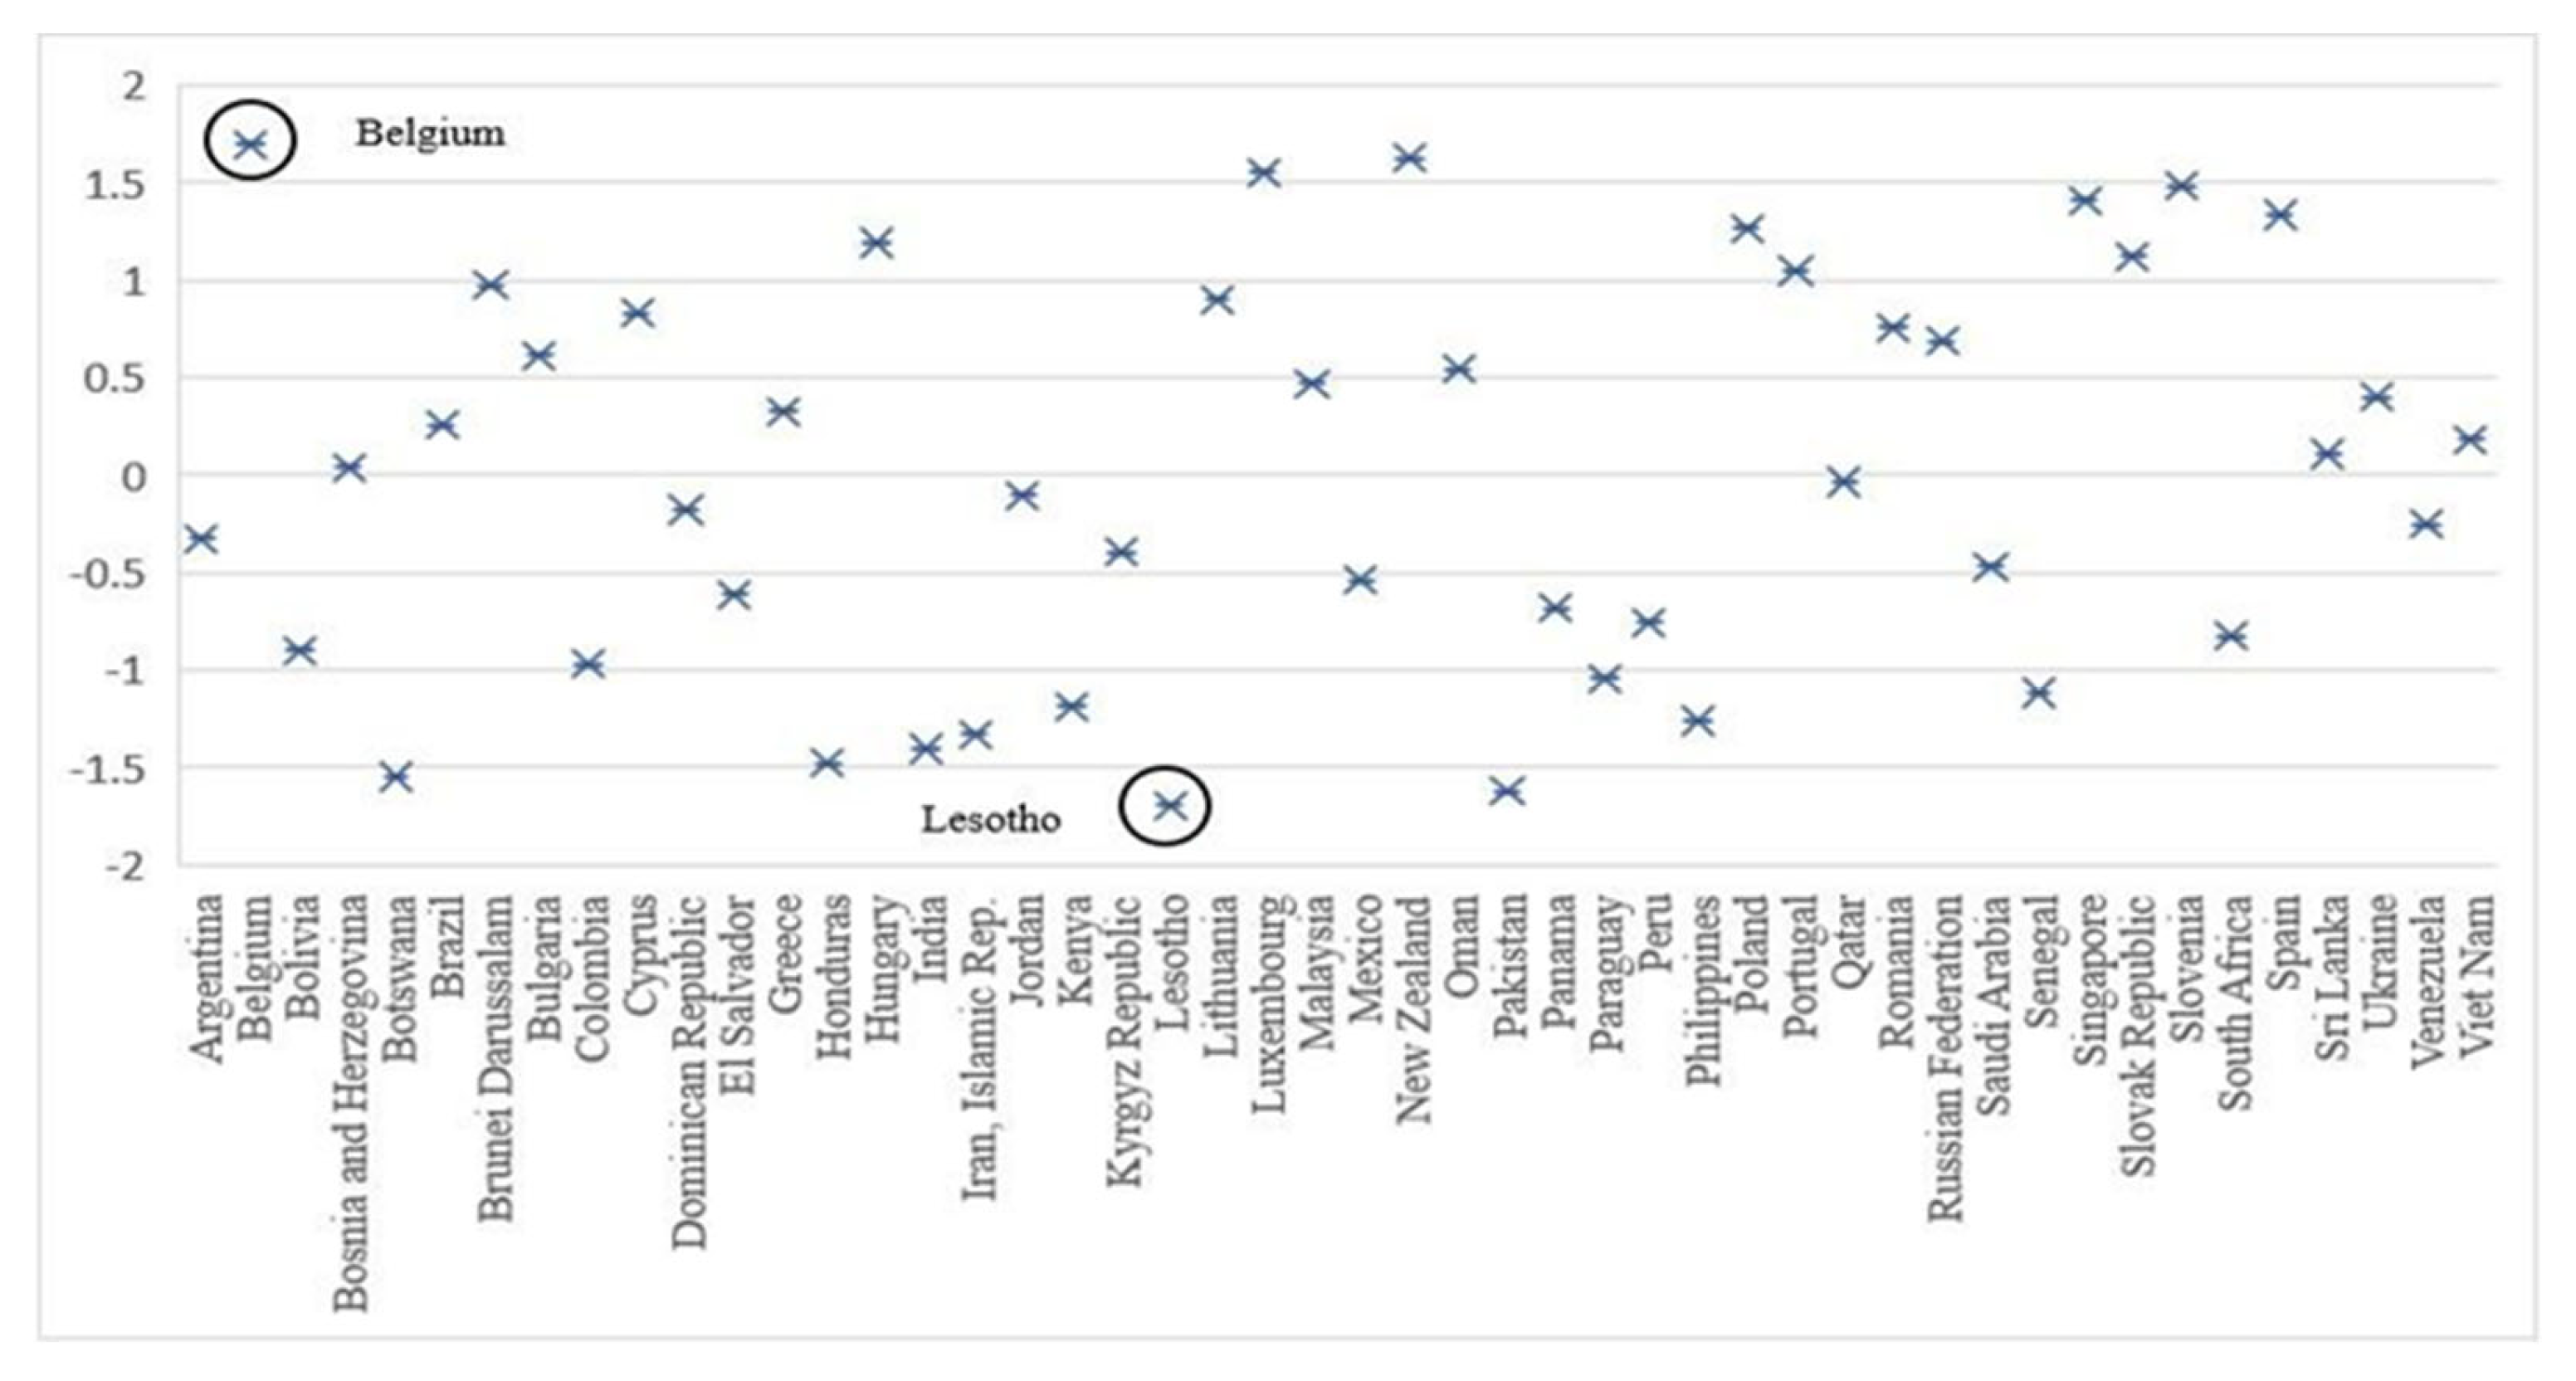
4.3.3. SD Dimensions and Country Outliers (Less Competitive) (Model 2)

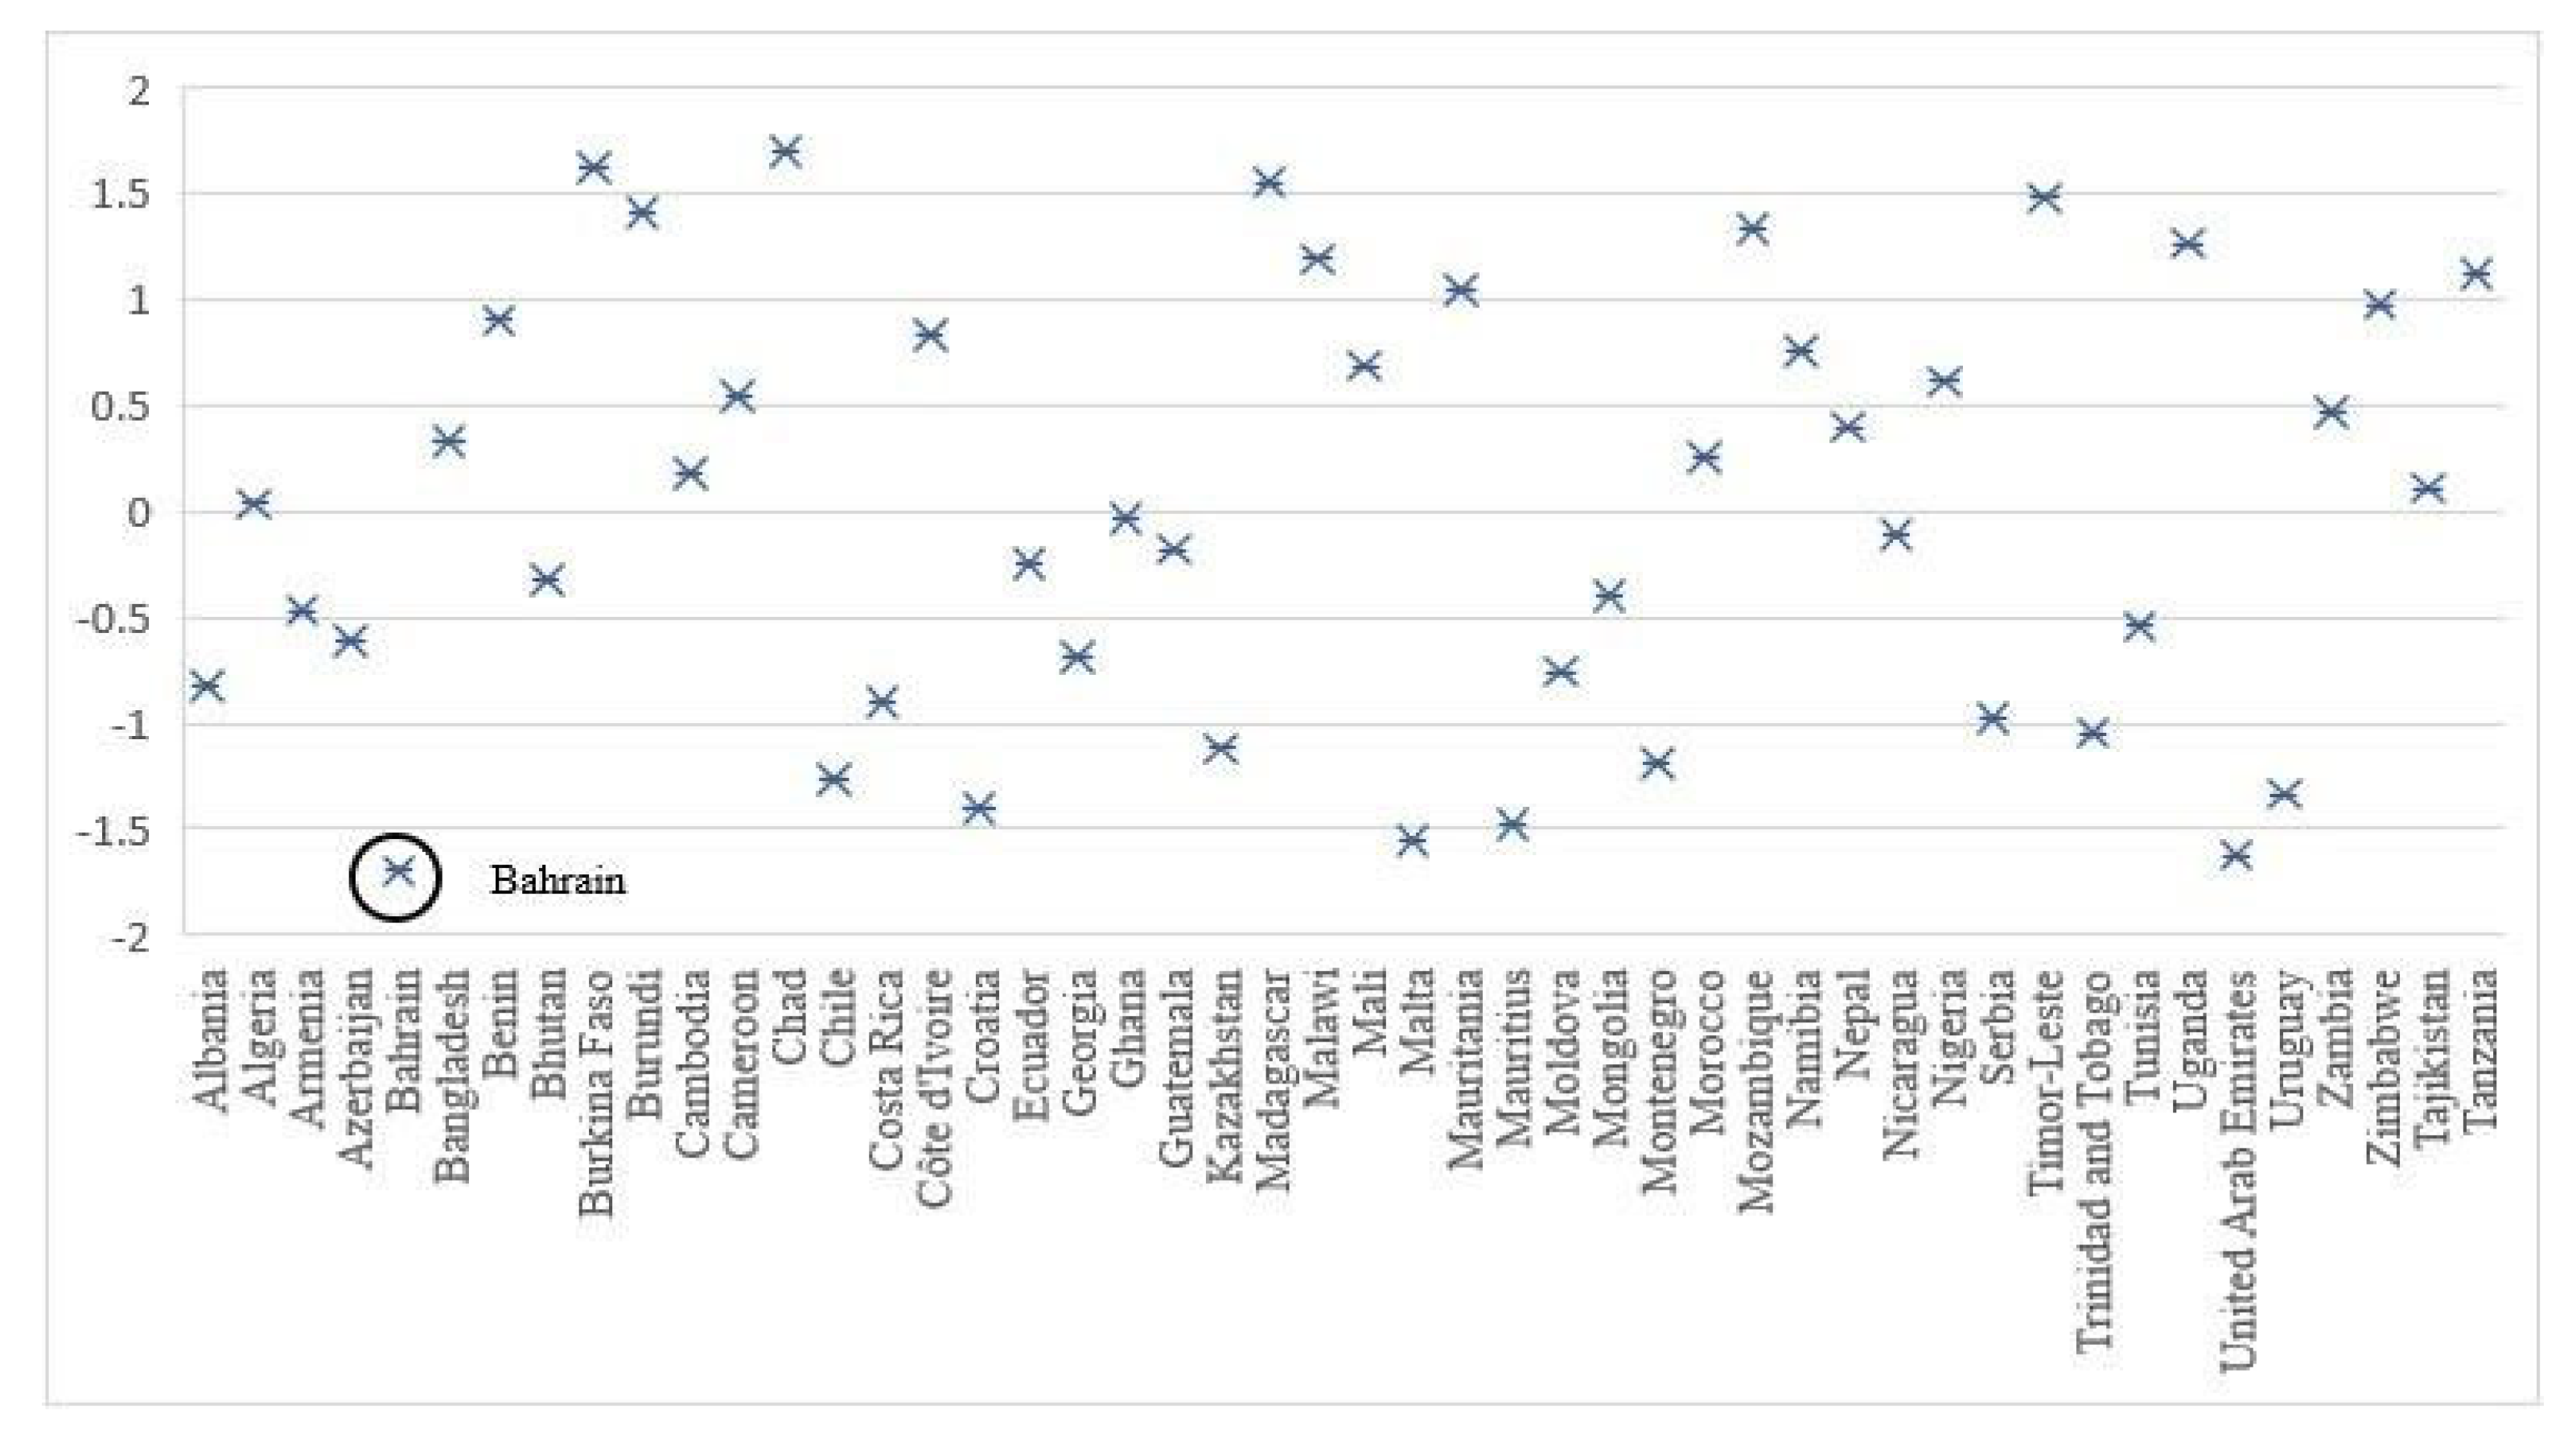

5. Discussion
5.1. Theoretical Implications
5.2. Practical Implications
6. Limitations and Future Research
7. Conclusions
Author Contributions
Funding
Informed Consent Statement
Data Availability Statement
Conflicts of Interest
Appendix A
| INSTITUTIONS (18 Indicators) | |
|---|---|
| INST1 | Property rights, 1–7 (best) |
| INST2 | Intellectual property protection, 1–7 (best) |
| INST3 | Diversion of public funds, 1–7 (best) |
| INST4 | Public trust in politicians, 1–7 (best) |
| INST5 | Judicial independence, 1–7 (best) |
| INST6 | Favoritism in decisions of government officials, 1–7 (best) |
| INST7 | Wastefulness of government spending, 1–7 (best) |
| INST8 | Burden of government regulation, 1–7 (best) |
| INST9 | Transparency of government policymaking, 1–7 (best) |
| INST10 | Business costs of terrorism, 1–7 (best) |
| INST11 | Business costs of crime and violence, 1–7 (best) |
| INST12 | Organized crime, 1–7 (best) |
| INST13 | Reliability of police services, 1–7 (best) |
| INST14 | Ethical behavior of firms, 1–7 (best) |
| INST15 | Strength of auditing and reporting standards, 1–7 (best) |
| INST16 | Efficacy of corporate boards, 1–7 (best) |
| INST17 | Protection of minority shareholders’ interests, 1–7 (best) |
| INST18 | Strength of investor protection, 0–10 (best) |
| INFRASTRUCTURE (5 indicators) | |
| INFRA1 | Quality of overall infrastructure, 1–7 (best) |
| INFRA2 | Quality of roads, 1–7 (best) |
| INFRA3 | Quality of port infrastructure, 1–7 (best) |
| INFRA4 | Quality of air transport infrastructure, 1–7 (best) |
| INFRA6 | Quality of electricity supply, 1–7 (best) |
| EDUCATION (9 indicators) | |
| HEALTHEDU1 | Business impact of malaria, 1–7 (best) |
| HEALTHEDU3 | Business impact of tuberculosis, 1–7 (best) |
| HEALTHEDU5 | Business impact of HIV/AIDS, 1–7 (best) |
| HIGHEDU3 | Quality of the education system, 1–7 (best) |
| HIGHEDU4 | Quality of math and science education, 1–7 (best) |
| HIGHEDU5 | Quality of management schools, 1–7 (best) |
| HIGHEDU6 | Internet access in schools, 1–7 (best) |
| TRAIN1 | Availability of research and training services, 1–7 (best) |
| TRAIN2 | Extent of staff training, 1–7 (best) |
| TECHNOLOGY (3 indicators) | |
| TECH1 | Availability of latest technologies, 1–7 (best) |
| TECH2 | Firm-level technology absorption, 1–7 (best) |
| TECH3 | FDI and technology transfer, 1–7 (best) |
| INNOVATION (6 indicators) | |
| INNOVA1 | Capacity for innovation, 1–7 (best) |
| INNOVA2 | Quality of scientific research institutions, 1–7 (best) |
| INNOVA3 | Company spending on R&D, 1–7 (best) |
| INNOVA4 | University–industry collaboration in R&D, 1–7 (best) |
| INNOVA5 | Gov’t procurement of advanced tech products, 1–7 (best) |
| INNOVA6 | Availability of scientists and engineers, 1–7 (best) |
| BUSINESS SOPHISTICATION (8 indicators) | |
| BUSSOPHIS1 | Local supplier quantity, 1–7 (best) |
| BUSSOPHIS2 | Local supplier quality, 1–7 (best) |
| BUSSOPHIS3 | State of cluster development, 1–7 (best) |
| BUSSOPHIS4 | Nature of competitive advantage, 1–7 (best) |
| BUSSOPHIS5 | Production process sophistication, 1–7 (best) |
| BUSSOPHIS6 | Control of international distribution, 1–7 (best) |
| BUSSOPHIS7 | Extent of marketing, 1–7 (best) |
| BUSSOPHIS8 | Value chain breadth, 1–7 (best) |
| MACROECONOMIC ENVIRONMENT (27 indicators) | |
| MACROENV1 | Government budget balance, % GDP |
| MACROENV2 | Gross national savings, % GDP |
| MACROENV3 | Inflation, annual % change |
| MACROENV4 | General government debt, % GDP |
| DOMCOMP1 | Extent of market dominance, 1–7 (best) |
| DOMCOMP2 | Effectiveness of anti-monopoly policy, 1–7 (best) |
| DOMCOMP3 | No. of procedures to start a business |
| DOMCOMP6 | Agricultural policy costs, 1–7 (best) |
| FORECOMP1 | Prevalence of trade barriers, 1–7 (best) |
| FORECOMP2 | Prevalence of foreign ownership, 1–7 (best) |
| FORECOMP3 | Business impact of rules on FDI, 1–7 (best) |
| FORECOMP4 | Burden of customs procedures, 1–7 (best) |
| QUALDEM1 | Degree of customer orientation, 1–7 (best) |
| QUALDEM2 | Buyer sophistication, 1–7 (best) |
| FLEXI1 | Cooperation in labor–employer relations, 1–7 (best) |
| FLEXI2 | Hiring and firing practices, 1–7 (best) |
| FLEXI3 | Flexibility of wage determination, 1–7 (best) |
| TALENT1 | Pay and productivity, 1–7 (best) |
| TALENT2 | Reliance on professional management, 1–7 (best) |
| EFFICNY1 | Financing through local equity market, 1–7 (best) |
| EFFICNY2 | Ease of access to loans, 1–7 (best) |
| EFFICNY3 | Venture capital availability, 1–7 (best) |
| TRUST1 | The soundness of banks, 1–7 (best) |
| TRUST2 | Regulation of securities exchanges, 1–7 (best) |
| TRUST3 | Legal rights index, 0–10 (best) |
| DOMMARKET3 | Domestic market size index, 1–7 (best) |
| FORMARKET1 | Foreign market size index, 1–7 (best) |
| SUSTAINABLE DEVELOPMENT GOALS | |
| SDG1 | Sustainable Development Score 1 No poverty |
| SDG2 | Sustainable Development Score 2 Zero hunger |
| SDG3 | Sustainable Development Score 3 Good health and well-being |
| SDG4 | Sustainable Development Score 4 Quality education |
| SDG5 | Sustainable Development Score 5 Gender equality |
| SDG6 | Sustainable Development Score 6 Clean water and sanitation |
| SDG7 | Sustainable Development Score 7 Affordable and clean energy |
| SDG8 | Sustainable Development Score 8 Decent work and economic growth |
| SDG9 | Sustainable Development Score 9 Sustainable development: Infrastructure, industrialization, and innovation |
| SDG10 | Sustainable Development Score 10 Reduced inequalities |
| SDG11 | Sustainable Development Score 11 Sustainable cities and communities |
| SDG12 | Sustainable Development Score 12 Responsible consumption and production |
| SDG13 | Sustainable Development Score 13 Climate change action |
| SDG14 | Sustainable Development Score 14 Conserve seas, oceans, and marine life |
| SDG15 | Sustainable Development Score 15 Life below water and life on land |
| SDG16 | Sustainable Development Score 16 Peace, justice, and strong institutions |
| SDG17 | Sustainable Development Score 17 The power of partnership |
| INST | INFRA | EDU | TECH | INNO | BUSSO | MACR | SOCIAL | ECONO | ENVIRON | |
|---|---|---|---|---|---|---|---|---|---|---|
| INST | 0.840 | |||||||||
| INFRA | 0.837 | 0.918 | ||||||||
| EDU | 0.808 | 0.837 | 0.898 | |||||||
| TECH | 0.805 | 0.856 | 0.828 | 0.918 | ||||||
| INNO | 0.807 | 0.791 | 0.861 | 0.824 | 0.925 | |||||
| BUSSO | 0.788 | 0.855 | 0.876 | 0.872 | 0.815 | 0.898 | ||||
| MACR | 0.835 | 0.824 | 0.837 | 0.888 | 0.847 | 0.891 | 0.893 | |||
| SOCIAL | 0.487 | 0.613 | 0.706 | 0.539 | 0.528 | 0.610 | 0.530 | 0.928 | ||
| ECONO | 0.580 | 0.674 | 0.775 | 0.610 | 0.661 | 0.685 | 0.597 | 0.864 | 0.924 | |
| ENVIRON | 0.538 | 0.656 | 0.757 | 0.612 | 0.598 | 0.681 | 0.593 | 0.906 | 0.910 | 0.920 |
| INST | INFRA | EDU | TECH | INNO | BUSSO | MACR | SOCIAL | ECONO | ENVIRON | |
|---|---|---|---|---|---|---|---|---|---|---|
| Composite reliability | 0.973 | 0.964 | 0.943 | 0.941 | 0.955 | 0.971 | 0.944 | 0.916 | 0.876 | 0.804 |
| Cronbach’s alpha | 0.969 | 0.953 | 0.931 | 0.905 | 0.942 | 0.965 | 0.932 | 0.885 | 0.807 | 0.827 |
| Dijkstra’s PLSc reliability | 0.981 | 0.954 | 0.95 | 0.93 | 0.948 | 0.969 | 0.966 | 0.925 | 0.845 | 0.853 |
| Model 1.1 | Model 1.2 | Model 1.3 | Model 1.4 | Model 1.5 | Model 1.6 | Model 2 | |
|---|---|---|---|---|---|---|---|
| Average path coefficient (APC) | 0.336 p < 0.001 | 0.337 p < 0.001 | 0.338 p < 0.001 | 0.338 p < 0.001 | 0.336 p < 0.001 | 0.370 p < 0.001 | 0.368 p < 0.001 |
| Average R-squared (ARS) | 0.759 p < 0.001 | 0.754 p < 0.001 | 0.762 p < 0.001 | 0.762 p < 0.001 | 0.756 p < 0.001 | 0.762 p < 0.001 | 0.760 p < 0.001 |
| Average full collinearity VIF (AFVIF) | 4.642 | 4.629 | 4.789 | 4.788 | 4.767 | 4.779 | 4.767 |
| Average block VIF (AVIF) | 5.412 | 5.412 | 5.412 | 5.412 | 5.412 | 5.412 | 5.382 |
| Tenenhaus Goodness of Fit (GoF) | 0.718 | 0.715 | 0.719 | 0.719 | 0.716 | 0.719 | 0.719 |
| Environmental Dimension | |
|---|---|
| Sustainable Development Goal 2 | Zero hunger |
| Sustainable Development Goal 6 | Clean water and sanitation |
| Sustainable Development Goal 7 | Affordable and clean energy |
| Sustainable Development Goal 12 | Responsible consumption and production |
| Sustainable Development Goal 13 | Climate change action |
| Sustainable Development Goal 14 | Life below water |
| Sustainable Development Goal 15 | Life on land |
| Social Dimension | |
| Sustainable Development Goal 1 | Poverty |
| Sustainable Development Goal 3 | Good health and well-being |
| Sustainable Development Goal 4 | Quality education |
| Sustainable Development Goal 5 | Gender equality |
| Sustainable Development Goal 16 | Peace, justice, and strong institutions |
| Sustainable Development Goal 17 | Partnership for the goals |
| Economic Dimension | |
| Sustainable Development Goal 8 | Decent work and economic growth |
| Sustainable Development Goal 9 | Build resilient infrastructure, promote and foster innovation |
| Sustainable Development Goal 10 | Reduced inequalities |
| Sustainable Development Goal 11 | Sustainable cities and community |

References
- Allen, C.; Reid, M.; Thwaites, J.; Glover, R.; Kestin, T. Assessing national progress and priorities for the Sustainable Development Goals (SDGs): Experience from Australia. Sustain. Sci. 2020, 15, 521–538. [Google Scholar] [CrossRef]
- Eisenmenger, N.; Pichler, M.; Krenmayr, N.; Noll, D.; Plank, B.; Schalmann, E.; Wandl, M.-T.; Gingrich, S. The Sustainable Development Goals prioritize economic growth over sustainable resource use: A critical reflection on the SDGs from a socio-ecological perspective. Sustain. Sci. 2020, 15, 1101–1110. [Google Scholar] [CrossRef]
- United Nations. Transforming Our World: The 2030 Agenda for Sustainable Development; Adoption Resolution, 70th Session; United Nations: New York, NY, USA, 2015. [Google Scholar]
- Luukkanen, J.; Kaivo-oja, J.; Vähäkari, N.; O’Mahony, T.; Korkeakoski, M.; Panula-Ontto, J.; Phonhalathb, K.; Nanthavongb, K.; Reinckec, K.; Vehmasa, J.; et al. Green economic development in Lao PDR: A sustainability window analysis of green growth productivity and the efficiency gap. J. Clean. Prod. 2019, 211, 818–829. [Google Scholar] [CrossRef]
- Solarin, S.A.; Bello, M.O. Interfuel substitution, biomass consumption, economic growth, and sustainable development: Evidence from Brazil. J. Clean. Prod. 2018, 211, 1357–1366. [Google Scholar] [CrossRef]
- De Neve, J.; Sachs, J.D. World Happiness Report 2020. Chapter 6: Sustainable Development and Human Well-Being. 2020. Available online: https://worldhappiness.report/ed/2020/ (accessed on 10 December 2022).
- Balkytė, A.; Tvaronavičienė, M. Perception of competitiveness in the context of sustainable development: Facets of “sustainable competitiveness”. J. Bus. Econ. Manag. 2010, 11, 341–365. [Google Scholar] [CrossRef]
- Garrido, E.; Gomez, J.; Maicas, J.P.; Orcos, R. The institution-based view of strategy: How to measure it. BRQ Bus. Res. Q. 2014, 17, 82–101. [Google Scholar] [CrossRef]
- Peng, M.W.; Khoury, T.A. Unbundling the institution-based view of international business strategy. In The Oxford Handbook of International Business, 2nd ed.; Oxford Academic: Oxford, UK, 2009. [Google Scholar]
- Barney, J. Firm resources and sustained competitive advantage. J. Manag. 1991, 17, 99–120. [Google Scholar] [CrossRef]
- Wernerfelt, B. A resource-based view of the firm. Strateg. Manag. J. 1984, 5, 171–180. [Google Scholar] [CrossRef]
- Fischer, C.; Heutel, G. Environmental macroeconomics: Environmental policy, business cycles, and directed technical change. Annu. Rev. Resour. Econ. 2013, 5, 197–210. [Google Scholar] [CrossRef]
- Folke, C.; Chapin, F.S., III; Olsson, P. Transformations in ecosystem stewardship. In Principles of Ecosystem Stewardship: Resilience-Based Natural Resource Management in a Changing World; Chapin, F.S., III, Kofinas, G.P., Folke, C., Eds.; Springer: New York, NY, USA, 2009; pp. 103–125. [Google Scholar]
- Arthur, W.B. Increasing Returns and Path Dependence in the Economy; University of Michigan Press: Ann Arbor, MI, USA, 1994. [Google Scholar] [CrossRef]
- Abson, D.J.; Fischer, J.; Leventon, J.; Newig, J.; Schomerus, T.; Vilsmaier, U.; von Wehrden, H.; Abernethy, P.; Ives, C.D.; Jager, N.W.; et al. Leverage points for sustainability transformation. Ambio 2017, 406, 30–39. [Google Scholar] [CrossRef]
- Kickert, R.N.; Tonella, G.; Simonov, A.; Krupa, S.V. Predictive modeling of effects under global change. Environ. Pollut. 1999, 100, 87–132. [Google Scholar] [CrossRef] [PubMed]
- Pahl-Wostl, C. Transitions towards adaptive management of water facing climate and global change. Water Resour. Manag. 2007, 21, 49–62. [Google Scholar] [CrossRef]
- Nilsson, M.; Costanza, R. Overall framework for the sustainable development goals. Rev. Targets Sustain. Dev. Goals Sci. Perspect. 2015, 7, 65–82. [Google Scholar]
- Ban, N.C.; Bax, N.J.; Gjerde, K.M.; Devillers, R.; Dunn, D.C.; Dunstan, P.K.; Hobday, A.J.; Maxwell, S.M.; Kaplan, D.M.; Pressey, R.L.; et al. Systematic conservation planning: A better recipe for managing the high seas for biodiversity conservation and sustainable use. Conserv. Lett. 2014, 7, 41–54. [Google Scholar] [CrossRef]
- Costanza, R.; McGlade, J.; Lovins, H.; Kubiszewski, I. An overarching goal for the UN sustainable development goals. Solutions 2015, 5, 13–16. [Google Scholar]
- Stafford-Smith, M.; Griggs, D.; Gaffney, O.; Ullah, F.; Reyers, B.; Kanie, N.; Stigson, B.; Shrivastava, P.; Leach, M.; O’Connell, D. Integration: The key to implementing the Sustainable Development Goals. Sustain. Sci. 2017, 12, 911–919. [Google Scholar] [CrossRef]
- Camargo, M.I.B. Institutions, institutional quality, and international competitiveness: Review and examination of future research directions. J. Bus. Res. 2021, 128, 423–435. [Google Scholar]
- Haseeb, M.; Hussain, H.I.; Kot, S.; Androniceanu, A.; Jermsittiparsert, K. Role of social and technological challenges in achieving a sustainable competitive advantage and sustainable business performance. Sustainability 2019, 11, 3811. [Google Scholar] [CrossRef]
- Baumann, C.; Winzar, H. The role of secondary education in explaining competitiveness. Asia Pac. J. Educ. 2016, 36, 13–30. [Google Scholar] [CrossRef]
- Miotto, G.; Del-Castillo-Feito, C.; Blanco-González, A. Reputation and legitimacy: Key factors for Higher Education Institutions’ sustained competitive advantage. J. Bus. Res. 2020, 112, 342–353. [Google Scholar] [CrossRef]
- Dyr, T.; Ziółkowska, K. Economic infrastructure as factor of the region’s competitiveness. Cent. Eur. Rev. Econ. Financ. 2014, 6, 5–19. [Google Scholar]
- Raeskyesa, D.G.S.; Suryandaru, R.A. Competitiveness and FDI inflows in ASEAN member countries. Int. J. Bus. Econ. Sci. Appl. Res. 2020, 13, 14–20. [Google Scholar] [CrossRef]
- Lollar, J.G.; Beheshti, H.M.; Whitlow, B.J. The role of integrative technology in competitiveness. Compet. Rev. Int. Bus. J. 2010, 20, 423–433. [Google Scholar] [CrossRef]
- Hermundsdottir, F.; Aspelund, A. Sustainability innovations and firm competitiveness: A review. J. Clean. Prod. 2021, 280, 124715. [Google Scholar] [CrossRef]
- Romer, P. Endogenous technological change. J. Political Econ. 1990, 99, S71–S102. [Google Scholar] [CrossRef]
- Porter, M.E. The value chain and competitive advantage. Underst. Bus. Process. 2001, 2, 50–66. [Google Scholar]
- Russo, M.V.; Fouts, P.A. A Resource-Based Perspective on Corporate Environmental Performance and Profitability. Acad. Manag. J. 1997, 40, 534–559. [Google Scholar] [CrossRef]
- Teece, D.J.; Pisano, G.; Shuen, A. Dynamic capabilities and strategic management. Strateg. Manag. J. 1998, 18, 509–533. [Google Scholar] [CrossRef]
- Mulder, P.; van den Bergh, J.C.J.M. Evolutionary economic theories of sustainable development. Growth Change 2001, 32, 110–134. [Google Scholar] [CrossRef]
- Sunny, F.A.; Jeronen, E.; Lan, J. Influential Theories of Economics in Shaping Sustainable Development Concepts. Adm. Sci. 2025, 15, 6. [Google Scholar] [CrossRef]
- Peter, C.; Swilling, M. Linking Complexity and Sustainability Theories: Implications for Modeling Sustainability Transitions. Sustainability 2014, 6, 1594–1622. [Google Scholar] [CrossRef]
- World Economic Forum. Introduction. In Global Competitiveness Index 2017–2018; World Economic Forum: Geneva, Switzerland, 2018; p. 4. [Google Scholar]
- Bowen, H.P.; Moesen, W. Composite competitiveness indicators with endogenous versus predetermined weights: An application to the World Economic Forum’s global competitiveness index. Compet. Rev. Int. Bus. J. 2011, 21, 129–151. [Google Scholar]
- Dima, A.M.; Begu, L.; Vasilescu, M.D.; Maassen, M.A. The relationship between the knowledge economy and global competitiveness in the European Union. Sustainability 2018, 10, 1706. [Google Scholar] [CrossRef]
- Ahmed, T.; Bhatti, A.A. Measurement and determinants of multi-factor productivity: A survey of literature. J. Econ. Surv. 2020, 34, 293–319. [Google Scholar] [CrossRef]
- Katz, Y. The Role of Government in Institutional Enhancement of Innovation and Competition. Athens J. Politics Int. Aff. 2025, 1, 1–16. Available online: https://www.athensjournals.gr/politics/2024-5986-AJPIA-Katz-02.pdf (accessed on 9 August 2024).
- Hiep, T.D.; Trung, B.H. Quantifying productivity gains from foreign direct investment: The mediating role of provincial institutional quality. Financ. Res. Lett. 2022, 49, 103174. [Google Scholar] [CrossRef]
- Zou, C.; Gao, W.; Ai, F. Strategic Mineral Policies for Indonesia: Enhancing Global Competitiveness, Economic Growth, and Environmental Sustainability Through Innovation and Renewable Energy. Renew. Energy 2025, 244, 122593. [Google Scholar] [CrossRef]
- Kowal, J.; Paliwoda-Pękosz, G. ICT for global competitiveness and economic growth in emerging economies: Economic, cultural, and social innovations for human capital in transition economies. Inf. Syst. Manag. 2017, 34, 304–307. [Google Scholar] [CrossRef]
- Bucher, S. The Global Competitiveness Index as an indicator of sustainable development. Her. Russ. Acad. Sci. 2018, 88, 44–57. [Google Scholar] [CrossRef]
- Lins, M.A.D.T. Instability in Latin America. In Finance, Growth and Democracy: Connections and Challenges in Europe and Latin America in the Era of Permacrisis: Democracy, Finance, and Growth; Springer: Berlin/Heidelberg, Germany, 2025; Volume 33, p. 151. [Google Scholar]
- Kjaer, A.M. Governance; Polity Press: Cambrigde, UK, 2004. [Google Scholar]
- Podvorica, N.; Hoti, A.; Gashi, P. FDI drivers in central Europe, the Baltics, and the Western Balkans: The role of macroeconomic and institutional factors. Ekon. Misao I Praksa 2025, 8, 65–82. [Google Scholar] [CrossRef]
- Rizk, R.; Slimane, M.B. Modelling the relationship between poverty, environment, and institutions: A panel data study. Environ. Sci. Pollut. Res. 2018, 25, 31459–31473. [Google Scholar] [CrossRef] [PubMed]
- Asongu, S.A.; Odhiambo, N.M. Inclusive development in environmental sustainability in sub-Saharan Africa: Insights from governance mechanisms. Sustain. Dev. 2019, 27, 713–724. [Google Scholar] [CrossRef]
- Guscina, A. Impact of Macroeconomic, Political, and Institutional Factors on the Structure of Government Debt in Emerging Market Countries; IMF Publications: Washington, DC, USA, 2008. [Google Scholar]
- Mavragani, A.; Nikolaou, I.E.; Tsagarakis, K.P. Open economy, institutional quality, and environmental performance: A macroeconomic approach. Sustainability 2016, 8, 601. [Google Scholar] [CrossRef]
- Chong, A.; Calderon, C. Causality and feedback between institutional measures and economic growth. Econ. Politics 2000, 12, 69–81. [Google Scholar] [CrossRef]
- Glaeser, E.L.; La Porta, R.; Lopez-de-Silanes, F.; Shleifer, A. Do institutions cause growth? J. Econ. Growth 2004, 9, 271–303. [Google Scholar] [CrossRef]
- Salman, M.; Long, X.; Dauda, L.; Mensah, C.N. The impact of institutional quality on economic growth and carbon emissions: Evidence from Indonesia, South Korea and Thailand. J. Clean. Prod. 2019, 241, 118331. [Google Scholar] [CrossRef]
- Lau, L.S.; Choong, C.K.; Eng, Y.K. Carbon dioxide emission, institutional quality, and economic growth: Empirical evidence in Malaysia. Renew. Energy 2014, 68, 276–281. [Google Scholar] [CrossRef]
- Danish Zhang, B.; Wang, Z.; Wang, B. Energy production, economic growth and CO2 emission: Evidence from Pakistan. Natural Hazards 2018, 90, 27–50. [Google Scholar] [CrossRef]
- Acemoglu, D.; Aghion, P.; Griffith, R.; Zilibotti, F. Technology, Hold-Up, and Vertical Integration: What Do We Learn from Micro Data; Mimeo, IFS: London, UK, 2003. [Google Scholar]
- Sherani, S. Institutional Reform in Pakistan; Friedrich Ebert Stiftung (FES): Washington, DC, USA, 2017. [Google Scholar]
- Álvarez, I.C.; Barbero, J.; Rodríguez-Pose, A.; Zofío, J.L. Does institutional quality matter for trade? Institutional conditions in a sectoral trade framework. World Dev. 2018, 103, 72–87. [Google Scholar] [CrossRef]
- Khan, M.A.; Khan, J.A.; Ali, Z.; Ahmad, I.; Ahmad, M.N. The challenge of climate change and policy response in Pakistan. Environ. Earth Sci. 2016, 75, 1–16. [Google Scholar] [CrossRef]
- Tang, C.F.; Abosedra, S.; Naghavi, N. Does the quality of institutions and education strengthen the quality of the environment? Evidence from a global perspective. Energy 2021, 218, 119303. [Google Scholar] [CrossRef]
- Sinha, A.; Gupta, M.; Shahbaz, M.; Sengupta, T. Impact of corruption in public sector on environmental quality: Implications for sustainability in BRICS and next 11 countries. J. Clean. Prod. 2019, 232, 1379–1393. [Google Scholar] [CrossRef]
- Kugelman, M.; Husain, I. Pakistan’s Institutions: We Know They Matter, But How Can They Work Better? 2018. Available online: https://ir.iba.edu.pk/faculty-research-books/19 (accessed on 31 May 2025).
- Danish; Wang, Z. Dynamic relationship between tourism, economic growth, and environmental quality. J. Sustain. Tour. 2018, 26, 1928–1943. [Google Scholar] [CrossRef]
- Haldar, A.; Sethi, N. Effect of institutional quality and renewable energy consumption on CO2 emissions—An empirical investigation for developing countries. Environ. Sci. Pollut. Res. 2021, 28, 15485–15503. [Google Scholar] [CrossRef]
- Wang, Z. Does biomass energy consumption help to control environmental pollution? Evidence from BRICS countries. Sci. Total Environ. 2019, 670, 1075–1083. [Google Scholar]
- Waheed, R.; Chang, D.; Sarwar, S.; Chen, W. Forest, agriculture, renewable energy, and CO2 emission. J. Clean. Prod. 2018, 172, 4231–4238. [Google Scholar] [CrossRef]
- Balsalobre-Lorente, D.; Shahbaz, M.; Roubaud, D.; Farhani, S. How economic growth, renewable electricity and natural resources contribute to CO2 emissions? Energy Policy 2018, 113, 356–367. [Google Scholar] [CrossRef]
- Mehlum, H.; Moene, K.; Torvik, R. Cursed by resources or institutions? World Econ. 2006, 29, 1117–1131. [Google Scholar] [CrossRef]
- Acemoglu, D.; Gallego, F.A.; Robinson, J.A. Institutions, human capital, and development. Annu. Rev. Econ. 2014, 6, 875–912. [Google Scholar] [CrossRef]
- Bano, S.; Zhao, Y.; Ahmad, A.; Wang, S.; Liu, Y. Identifying the impacts of human capital on carbon emissions in Pakistan. J. Clean. Prod. 2018, 183, 1082–1092. [Google Scholar] [CrossRef]
- Rahman, M.M. Do population density, economic growth, energy use and exports adversely affect environmental quality in Asian populous countries? Renew. Sustain. Energy Rev. 2017, 77, 506–514. [Google Scholar] [CrossRef]
- Chen, C.; Pinar, M.; Stengos, T. Determinants of renewable energy consumption: Importance of democratic institutions. Renew. Energy 2021, 179, 75–83. [Google Scholar] [CrossRef]
- Zhang, B.; Wang, B.; Wang, Z. Role of renewable energy and non-renewable energy consumption on EKC: Evidence from Pakistan. J. Clean. Prod. 2017, 156, 855–864. [Google Scholar]
- Cao, H.; Khan, M.K.; Rehman, A.; Dagar, V.; Oryani, B.; Tanveer, A. Impact of globalization, institutional quality, economic growth, electricity and renewable energy consumption on Carbon Dioxide Emission in OECD countries. Environ. Sci. Pollut. Res. 2022, 29, 24191–24202. [Google Scholar] [CrossRef]
- Shahbaz, M.; Sbia, R.; Hamdi, H.; Ozturk, I. Economic growth, electricity consumption, urbanization and environmental degradation relationship in United Arab Emirates. Ecol. Indic. 2014, 45, 622–631. [Google Scholar] [CrossRef]
- Fergusson, L. Institutions for financial development: What are they and where do they come from? J. Econ. Surv. 2006, 20, 27–70. [Google Scholar] [CrossRef]
- Salahuddin, M.; Alam, K.; Ozturk, I.; Sohag, K. The effects of electricity consumption, economic growth, financial development and foreign direct investment on CO2 emissions in Kuwait. Renew. Sustain. Energy Rev. 2018, 81, 2002–2010. [Google Scholar] [CrossRef]
- Shahbaz, M.; Mallick, H.; Mahalik, M.K.; Loganathan, N. Does globalization impede environmental quality in India? Ecol. Indic. 2015, 52, 379–393. [Google Scholar] [CrossRef]
- Le, T.H.; Kim, J.; Lee, M. Institutional quality, trade openness, and financial sector development in Asia: An empirical investigation. Emerg. Mark. Financ. Trade 2016, 52, 1047–1059. [Google Scholar] [CrossRef]
- Shahbaz, M.; Loganathan, N.; Muzaffar, A.T.; Ahmed, K.; Jabran, M.A. How urbanization affects CO2 emissions in Malaysia? The application of STIRPAT model. Renew. Sustain. Energy Rev. 2016, 57, 83–93. [Google Scholar] [CrossRef]
- Abeka, M.J.; Amoah, E.K.; Owusu Appiah, M.; Gatsi, J.G.; Obuobi, N.K.; Boateng, E. Economic institutions, political institutions and renewable energy production in Africa. J. Afr. Bus. 2022, 23, 1049–1066. [Google Scholar] [CrossRef]
- Liu, J.; Mooney, H.; Hull, V.; Davis, S.J.; Gaskell, J.; Hertel, T.; Lubchenco, J.; Seto, K.C.; Gleick, P.; Kremen, C.; et al. Systems integration for global sustainability. Science 2015, 347, 1258832. [Google Scholar] [CrossRef]
- Wang, B.; Wang, Z. Imported technology and CO2 emission in China: Collecting evidence through bound testing and VECM approach. Renew. Sustain. Energy Rev. 2018, 82, 4204–4214. [Google Scholar]
- Bougheas, S.; Demetriades, P.O.; Mamuneas, T.P. Infrastructure, specialization, and economic growth. Can. J. Econ./Rev. Can. D’économique 2000, 33, 506–522. [Google Scholar] [CrossRef]
- Pereira, A.M.; Andraz, J.M. Public investment in transportation infrastructure and economic performance in Portugal. Rev. Dev. Econ. 2005, 9, 177–196. [Google Scholar] [CrossRef]
- Hooper, E.; Peters, S.; Pintus, P. To What Extent Can Long-Term Investment in Infrastructure Reduce Inequality? 2017. Available online: https://publications.banque-france.fr/sites/default/files/medias/documents/wp_624.pdf (accessed on 31 May 2025).
- Röller, L.H.; Waverman, L. Telecommunications infrastructure and economic development: A simultaneous approach. Am. Econ. Rev. 2001, 91, 909–923. [Google Scholar] [CrossRef]
- Fedderke, J.W.; Bogetić, Ž. Infrastructure and growth in South Africa: Direct and indirect productivity impacts of 19 infrastructure measures. World Dev. 2009, 37, 1522–1539. [Google Scholar] [CrossRef]
- Datta, A.; Agarwal, S. Telecommunications and economic growth: A panel data approach. Appl. Econ. 2004, 36, 1649–1654. [Google Scholar] [CrossRef]
- Niininen, P. Computers and Economic Growth in Finland. 1998. Available online: https://www.wider.unu.edu/sites/default/files/wp148.pdf (accessed on 31 May 2025).
- Poh, K.W. Globalization and e-Commerce: Growth and Impacts in Singapore. CRITO Working Paper. 2001. Available online: https://escholarship.org/content/qt1k3982mp/qt1k3982mp_noSplash_d99ba6e8edec907cfae6495e5b381e48.pdf (accessed on 31 May 2025).
- Pilat, D.; Lee, F. Productivity Growth in ICT-Producing and ICT-Using Industries: A Source of Growth Differentials in the OECD? (No. 2001/4); OECD Publishing: Paris, France, 2001. [Google Scholar]
- Dash, R.K.; Sahoo, P. Economic growth in India: The role of physical and social infrastructure. J. Econ. Policy Reform 2010, 13, 373–385. [Google Scholar] [CrossRef]
- Coşar, A.K.; Demir, B. Domestic road infrastructure and international trade: Evidence from Turkey. J. Dev. Econ. 2016, 118, 232–244. [Google Scholar] [CrossRef]
- Herranz-Loncán, A. Infrastructure investment and Spanish economic growth, 1850–1935. Explor. Econ. Hist. 2007, 44, 452–468. [Google Scholar] [CrossRef]
- Maparu, T.S.; Mazumder, T.N. Transport infrastructure, economic development and urbanization in India (1990–2011): Is there any causal relationship? Transp. Res. Part A Policy Pract. 2017, 100, 319–336. [Google Scholar] [CrossRef]
- Canning, D.; Pedroni, P. The effect of infrastructure on long-run economic growth. Harv. Univ. 2004, 99, 1–30. [Google Scholar]
- Warner, M.A.M. Public Investment as an Engine of Growth; International Monetary Fund: Washington, DC, USA, 2014. [Google Scholar]
- Pradhan, R.P.; Bagchi, T.P. Effect of transportation infrastructure on economic growth in India: The VECM approach. Res. Transp. Econ. 2013, 38, 139–148. [Google Scholar] [CrossRef]
- Liddle, B. Population, affluence, and environmental impact across development: Evidence from panel cointegration modeling. Environ. Model. Softw. 2013, 40, 255–266. [Google Scholar] [CrossRef]
- Zhang, C.; Nian, J. Panel estimation for transport sector CO2 emissions and its affecting factors: A regional analysis in China. Energy Policy 2013, 63, 918–926. [Google Scholar] [CrossRef]
- Saidi, S.; Hammami, S. Modeling the causal linkages between transport, economic growth and environmental degradation for 75 countries. Transp. Res. Part D Transp. Environ. 2017, 53, 415–427. [Google Scholar] [CrossRef]
- Kharbach, M.; Chfadi, T. CO2 emissions in Moroccan road transport sector: Divisia, Cointegration, and EKC analyses. Sustain. Cities Soc. 2017, 35, 396–401. [Google Scholar] [CrossRef]
- Hafeez, M.; Yuan, C.; Shah, W.U.H.; Mahmood, M.T.; Li, X.; Iqbal, K. Evaluating the relationship among agriculture, energy demand, finance and environmental degradation in one belt and one road economies. Carbon Manag. 2020, 11, 139–154. [Google Scholar] [CrossRef]
- Yang, L.; Hui, P.; Yasmeen, R.; Ullah, S.; Hafeez, M. Energy consumption and financial development indicators nexuses in Asian economies: A dynamic seemingly unrelated regression approach. Environ. Sci. Pollut. Res. 2020, 27, 16472–16483. [Google Scholar] [CrossRef]
- Schultz, T.W. Investment in human capital. Am. Econ. Rev. 1961, 51, 1–17. [Google Scholar]
- Hanushek, E.A.; Wößmann, L. The Role of Education Quality in Economic Growth. 2007. Available online: https://documents1.worldbank.org/curated/en/260461468324885735/pdf/wps4122.pdf (accessed on 31 May 2025).
- Stromquist, N.P. Education in a Globalized World: The Connectivity of Economic Power, Technology, and Knowledge; Rowman & Littlefield: Lanham, MD, USA, 2002. [Google Scholar]
- Bradshaw, T.K. Theories of poverty and anti-poverty programs in community development. Community Dev. 2007, 38, 7–25. [Google Scholar] [CrossRef]
- Panayotou, T. Empirical Tests and Policy Analysis of Environmental Degradation at Different Stages of Economic Development; International Labour Office: Geneva, Switzerland, 1993. [Google Scholar]
- Qureshi, S.A.; Shah, S.M.A.; Raza, S.H. An Investigation of Pakistan’s Manufacturing Sector Corporate Investment Under Financial Liberalization. JSSH 2018, 26. [Google Scholar]
- Nelson, R.R.; Phelps, E.S. Investment in humans, technological diffusion, and economic growth. Am. Econ. Rev. 1966, 56, 69–75. [Google Scholar]
- Alam, A. Mapping a sustainable future through conceptualization of transformative learning framework, education for sustainable development, critical reflection, and responsible citizenship: An exploration of pedagogies for twenty-first century learning. ECS Trans. 2022, 107, 9827. [Google Scholar] [CrossRef]
- Hallinger, P.; Chatpinyakoop, C. A bibliometric review of research on higher education for sustainable development, 1998–2018. Sustainability 2019, 11, 2401. [Google Scholar] [CrossRef]
- Azariadis, C.; Drazen, A. Threshold externalities in economic development. Q. J. Econ. 1990, 105, 501–526. [Google Scholar] [CrossRef]
- Romer, P.M. Increasing returns and long-run growth. J. Political Econ. 1986, 94, 1002–1037. [Google Scholar] [CrossRef]
- Grossman, G.; Helpman, E. Innovation and Growth in the Global Economy; MIT Press: Cambridge, MA, USA, 1991. [Google Scholar]
- Brynjolfsson, E.; Hitt, L.M. Beyond the productivity paradox. Commun. ACM 1998, 41, 49–55. [Google Scholar] [CrossRef]
- Dedrick, J.; Gurbaxani, V.; Kraemer, K.L. Information technology and economic performance: A critical review of the empirical evidence. ACM Comput. Surv. (CSUR) 2003, 35, 1–28. [Google Scholar] [CrossRef]
- Murphy, J. Governing Technology for Sustainability; Routledge: Abingdon, UK, 2012. [Google Scholar]
- Khuntia, J.; Saldanha, T.J.; Mithas, S.; Sambamurthy, V. Information technology and sustainability: Evidence from an emerging economy. Prod. Oper. Manag. 2018, 27, 756–773. [Google Scholar] [CrossRef]
- Schumpeter, J.A. Change and the Entrepreneur. Essays JA Schumpeter 1934, 4, 45–91. [Google Scholar]
- Pyka, A.; Andersen, E.S. Introduction: Long term economic development–demand, finance, organization, policy and innovation in a Schumpeterian perspective. J. Evol. Econ. 2012, 22, 621–625. [Google Scholar] [CrossRef]
- Solow, R.M. A contribution to the theory of economic growth. Q. J. Econ. 1956, 70, 65–94. [Google Scholar] [CrossRef]
- Aghaei, M.; Rezagholizadeh, M. The impact of information and communication technology (ICT) on economic growth in the OIC Countries. Econ. Environ. Stud. 2017, 17, 257–278. [Google Scholar] [CrossRef]
- Quah, D. Technology dissemination and economic growth: Some lessons for the new economy. Technol. New Econ. 2002, 3, 95–156. [Google Scholar]
- Gruber, H.; Koutroumpis, P. Mobile communications: Diffusion facts and prospects. Commun. Strateg. 2010, 77, 133–145. [Google Scholar]
- Vu, K.M. ICT as a source of economic growth in the information age: Empirical evidence from the 1996–2005 period. Telecommun. Policy 2011, 35, 357–372. [Google Scholar] [CrossRef]
- Pradhan, R.P.; Arvin, M.B.; Norman, N.R. The dynamics of information and communications technologies infrastructure, economic growth, and financial development: Evidence from Asian countries. Technol. Soc. 2015, 42, 135–149. [Google Scholar] [CrossRef]
- Pradhan, R.P.; Mallik, G.; Bagchi, T.P. Information communication technology (ICT) infrastructure and economic growth: A causality evinced by cross-country panel data. IIMB Manag. Rev. 2018, 30, 91–103. [Google Scholar] [CrossRef]
- Sepehrdoust, H.; Ghorbanseresht, M. Impact of information and communication technology and financial development on economic growth of OPEC developing economies. Kasetsart J. Soc. Sci. 2019, 40, 546–551. [Google Scholar] [CrossRef]
- Aghion, P.; Howitt, P. A Schumpeterian perspective on growth and competition. In New Theories in Growth and Development; Palgrave Macmillan: London, UK, 1998; pp. 9–49. [Google Scholar]
- Dewan, S.; Kraemer, K.L. Information technology and productivity: Evidence from country-level data. Manag. Sci. 2000, 46, 548–562. [Google Scholar] [CrossRef]
- Pohjola, M. The New Economy: Facts, impacts and policies. Inf. Econ. Policy 2002, 14, 133–144. [Google Scholar] [CrossRef]
- Achtenhagen, L.; Melin, L.; Naldi, L. Dynamics of business models–strategizing, critical capabilities and activities for sustained value creation. Long Range Plan. 2013, 46, 427–442. [Google Scholar] [CrossRef]
- Mason, C.; Brown, R. Entrepreneurial ecosystems and growth oriented entrepreneurship. Final Rep. OECD 2014, 30, 77–102. [Google Scholar]
- Kirikkaleli, D.; Ozun, A. Innovation capacity, business sophistication and macroeconomic stability: Empirical evidence from OECD countries. J. Bus. Econ. Manag. 2019, 20, 351–367. [Google Scholar] [CrossRef]
- Paun, C.V.; Musetescu, R.C.; Topan, V.M.; Danuletiu, D.C. The impact of financial sector development and sophistication on sustainable economic growth. Sustainability 2019, 11, 1713. [Google Scholar] [CrossRef]
- Kienzle, R.; Shadur, M. Developments in business networks in East Asia. Manag. Decis. 1997, 35, 23–32. [Google Scholar] [CrossRef]
- Todeva, E. Business Networks: Strategy and Structure; Routledge: Abingdon, UK, 2006. [Google Scholar]
- Chetty, S.; Eriksson, K. Mutual commitment and experiential knowledge in mature international business relationship. Int. Bus. Rev. 2002, 11, 305–332. [Google Scholar] [CrossRef]
- Laage-Hellman, J. Business Networks in Japan: Supplier-Customer Interaction in Product Development; Routledge: Abingdon, UK, 2002. [Google Scholar]
- Porter, M.E.; Schwab, K.; Sala-i-Martin, X.; Lopez-Claros, A. The Global Competitiveness Report 2008–2009; World Economic Forum: Geneva, Switzerland, 2004; Volume 441. [Google Scholar]
- Agnihotri, P.; Santhanam, H. International marketing strategies for global competitiveness. In Proceedings of the Seventh International Conference in Global Business and Economic Development, Bangkok, Thailand, 22–25 May 2002. [Google Scholar]
- White, D.S.; Griffith, D.A. Combining corporate and marketing strategy for global competitiveness. Mark. Intell. Plan. 1997, 15, 173–178. [Google Scholar] [CrossRef][Green Version]
- Schwab, K. The Global Competitiveness Report 2010–2011; World Economic Forum: Geneva, Switzerland, 2010. [Google Scholar]
- Joseph, R.A.; Johnston, R. Market Failure and Government Support for Science and Technology: Economic Theory Versus Political Practice. Prometheus 1985, 3, 138–155. [Google Scholar] [CrossRef]
- Sala-i-Martin, X.; Bilbao-Osorio, B.; Blanke, J.; Hanouz, M.D.; Geiger, T. The Global Competitiveness Index 2011–2012: Setting the Foundations for Strong Productivity. In The Global Competitiveness Report; World Economic Forum: Geneva, Switzerland, 2011; pp. 3–49. [Google Scholar]
- Spencer, J.W. The impact of multinational enterprise strategy on indigenous enterprises: Horizontal spillovers and crowding out in developing countries. Acad. Manag. Rev. 2008, 33, 341–361. [Google Scholar] [CrossRef]
- Acemoglu, D.; Aghion, P.; Zilibotti, F. Growth, Development, and Appropriate Versus Inappropriate Institutions; EBRD-Japan Research Programme Papers; Banque Européenne Pour la Reconstruction et le Développement: London, UK, 2006. [Google Scholar]
- Dosi, G. Sources, procedures, and microeconomic effects of innovation. J. Econ. Lit. 1988, 1120–1171. [Google Scholar]
- Evangelista, R.; Perani, G.; Rapiti, F.; Archibugi, D. Nature and impact of innovation in manufacturing industry: Some evidence from the Italia innovation survey. Res. Policy 1997, 26, 521–536. [Google Scholar] [CrossRef]
- Griliches, Z.; Mairesse, J. Productivity and R and D at the Firm Level. In R&D, Patents, and Productivity; University of Chicago Press: Chicago, IL, USA, 1981; pp. 339–374. [Google Scholar]
- Antweiler, W.; Copeland, B.R.; Taylor, M.S. Is free trade good for the Environment? Am. Econ. Rev. 2001, 91, 877–908. [Google Scholar] [CrossRef]
- Hübler, M.; Baumstark, L.; Leimbach, M.; Edenhofer, O.; Bauer, N. An integrated assessment model with endogenous growth. Ecol. Econ. 2012, 83, 118–131. [Google Scholar] [CrossRef]
- Solomon, S.D. Contribution of Working Group I to the Fourth Assessment Report of the Intergovernmental Panel on Climate Change; Cambridge University Press: Cambridge, UK, 2007. [Google Scholar]
- Foxon, T.J. A coevolutionary framework for analysing a transition to a sustainable low carbon economy. Ecol. Econ. 2011, 70, 2258–2267. [Google Scholar] [CrossRef]
- Ertugrul, H.M.; Cetin, M.; Seker, F.; Dogan, E. The impact of trade openness on global carbon dioxide emissions: Evidence from the top ten emitters among developing countries. Ecol. Indic. 2016, 67, 543–555. [Google Scholar] [CrossRef]
- Andreoni, J.; Levinson, A. The simple analytics of the environmental Kuznets curve. J. Public Econ. 2001, 80, 269–286. [Google Scholar] [CrossRef]
- Fernández, Y.F.; López, M.F.; Blanco, B.O. Innovation for sustainability: The impact of R&D spending on CO2 emissions. J. Clean. Prod. 2018, 172, 3459–3467. [Google Scholar]
- Ibragimov, Z.; Vasylieva, T.A.; Liulov, O.V. The National Economy Competitiveness: Effect of Macroeconomic Stability, Renewable Energy on Economic Growth. Doctoral Dissertation, Varazdin Development & Entrepreneurship Agency, Varazdin, Croatia, 2019. [Google Scholar]
- Flachenecker, F. The causal impact of material productivity on macroeconomic competitiveness in the European Union. Environ. Econ. Policy Stud. 2018, 20, 17–46. [Google Scholar] [CrossRef]
- Gonzalez-Vega, C. Deepening rural financial markets: Macroeconomic, policy and political dimensions. In Proceedings of the Paving the Way Forward for Rural Finance: An International Conference on Best Practices, Washington, DC, USA, 2–4 June 2003; pp. 2–4. [Google Scholar]
- Persson, T.; Tabellini, G. Macroeconomic Policy, Credibility and Politics; Routledge: Abingdon, UK, 2012. [Google Scholar]
- Shah, A. New issues in macroeconomic policy (No. 51); NIPFP Working Paper; National Institute of Public Finance and Policy: New Delhi, India, 2008. [Google Scholar]
- Khorrami, Z.; Mirzaee, M.; Davarani, M.M.F.; Khanjani, N. Measuring Liveability in Iranian Cities Using the Global Liveable City Index (GLCI). Health Scope 2021, 10, e112409. [Google Scholar] [CrossRef]
- Valcárcel-Aguiar, B.; Murias, P.; Rodríguez-González, D. Sustainable urban liveability: A practical proposal based on a composite indicator. Sustainability 2018, 11, 86. [Google Scholar] [CrossRef]
- Bibri, S.E. A novel model for data-driven smart sustainable cities of the future: The institutional transformations required for balancing and advancing the three goals of sustainability. Energy Inform. 2021, 4, 1–37. [Google Scholar] [CrossRef]
- Shaw, K.; Kennedy, C.; Dorea, C.C. Non-sewered sanitation systems’ global greenhouse gas emissions: Balancing sustainable development goal tradeoffs to end open defecation. Sustainability 2021, 13, 11884. [Google Scholar] [CrossRef]
- Ekins, P. Eco-innovation for environmental sustainability: Concepts, progress and policies. Int. Econ. Econ. Policy 2010, 7, 267–290. [Google Scholar] [CrossRef]
- Toniolo, S.; Mazzi, A.; Mazzarotto, G.; Scipioni, A. International standards with a life cycle perspective: Which dimension of sustainability is addressed? Int. J. Life Cycle Assess. 2019, 24, 1765–1777. [Google Scholar] [CrossRef]
- Bende-Nabende, A. Globalization, FDI, Regional Integration and Sustainable Development: Theory, Evidence and Policy; Routledge: Abingdon, UK, 2017. [Google Scholar]
- Talan, A.; Tyagi, R.D.; Surampalli, R.Y. Social dimensions of sustainability. Sustain. Fundam. Appl. 2020, 9, 183–206. [Google Scholar]
- Pata, U.K.; Yilanci, V. Financial development, globalization and ecological footprint in G7: Further evidence from threshold cointegration and fractional frequency causality tests. Environ. Ecol. Stat. 2020, 27, 803–825. [Google Scholar] [CrossRef]
- Taylor, P.J.; Buttel, F.H. How do we know we have global environmental problems? Science and the globalization of environmental discourse. Geoforum 1992, 23, 405–416. [Google Scholar] [CrossRef]
- Hjorth, P.; Bagheri, A. Navigating towards sustainable development: A systems dynamics approach. Futures 2006, 38, 74–92. [Google Scholar] [CrossRef]
- Holden, P. Finding common ground? European Union and European civil society framing of the role of trade in the sustainable development goals. JCMS J. Common Mark. Stud. 2019, 57, 956–976. [Google Scholar] [CrossRef]
- Gazzola, P.; Pavione, E.; Pezzetti, R.; Grechi, D. Trends in the fashion industry. Percept. Sustain. Circ. Econ. A Gend./Gener. Quant. approach. Sustain. 2020, 12, 2809. [Google Scholar]
- Kalimeris, P.; Bithas, K.; Richardson, C.; Nijkamp, P. Hidden linkage between resources and economy: A “Beyond-GDP “approach using alternative welfare indicators. Ecol. Econ. 2020, 169, 106508. [Google Scholar] [CrossRef]
- Nasir, M.A.; Huynh, T.L.D.; Tram, H.T.X. Role of financial development, economic growth & foreign direct investment in driving climate change: A case of emerging ASEAN. J. Environ. Manag. 2019, 242, 131–141. [Google Scholar] [CrossRef]
- Wang, M.; Feng, C. The win-win ability of environmental protection and economic development during China’s transition. Technol. Forecast. Soc. Change 2021, 166, 120617. [Google Scholar] [CrossRef]
- Fauzi, H.; Svensson, G.; Rahman, A. Triple bottom line as “Sustainable corporate performance”: A proposition for the future. Sustainability 2010, 2, 145–160. [Google Scholar] [CrossRef]
- van Vuuren, D.P.; Zimm, C.; Busch, S.; Kriegler, E.; Leininger, J.; Messner, D.; Nakicenovic, N.; Rockstrom, J.; Riahi, K.; Sperling, F.; et al. Defining a sustainable development target space for 2030 and 2050. One Earth 2022, 5, 142–156. [Google Scholar] [CrossRef]
- Canatay, A.; Prieto, L.; Amin, M.R. Integrating “Neoliberal-turn” and “Social-turn” constructs in examining sustainable development and happiness and life satisfaction: A global-, country cluster-, and country-level study. Sustainability 2023, 15, 10010. [Google Scholar] [CrossRef]
- Lim, M.M.L.; Jørgensen, P.S.; Wyborn, C.A. Reframing the sustainable development goals to achieve sustainable development in the Anthropocene—A systems approach. Ecol. Soc. 2018, 23, 22. [Google Scholar] [CrossRef]
- Gefen, D.; Straub, D.; Boudreau, M.C. Structural equation modeling and regression: Guidelines for research practice. Commun. Assoc. Inf. Syst. 2000, 4, 7. [Google Scholar] [CrossRef]
- Fornell, C.; Larcker, D.F. Evaluating structural equation models with unobservable variables and measurement error. J. Mark. Res. 1981, 18, 39–50. [Google Scholar] [CrossRef]
- Nunnally, J.C.; Bernstein, I.H. Psychometric Theory; McGraw-Hill: New York, NY, USA, 1994. [Google Scholar]

| Very Competitive Countries | Competitive Countries | Less Competitive Countries | ||
|---|---|---|---|---|
| Australia | Argentina | New Zealand | Albania | Malta |
| Canada | Belgium | Oman | Algeria | Mauritania |
| China | Bolivia | Pakistan | Algeria | Mauritius |
| Czech Republic | Bosnia and | Panama | Armenia | Moldova |
| Denmark | Herzegovina | Paraguay | Azerbaijan | Mongolia |
| Egypt | Botswana | Peru | Bahrain | Montenegro |
| Estonia | Brazil | Philippines | Bangladesh | Morocco |
| Finland | Brunei Darussalam | Poland | Benin | Mozambique |
| France | Bulgaria | Portugal | Bhutan | Namibia |
| Germany | Colombia | Qatar | Burkina Faso | Nepal |
| Iceland | Cyprus | Romania | Burundi | Nicaragua |
| Indonesia | Dominican Republic | Russian | Cambodia | Nigeria |
| Ireland | El Salvador | Federation | Cameroon | Serbia |
| Israel | Greece | Saudi Arabia | Chad | Timor-Leste |
| Italy | Honduras | Senegal | Chile | Trinidad and Tobago |
| Jamaica | Hungary | Singapore | Costa Rica | Tunisia |
| Japan | India | Slovak Republic | Côte d’Ivoire | Uganda |
| Korea, Rep. | Iran, Islamic Rep. | Slovenia | Croatia | U.A Emirates |
| Kuwait | Jordan | South Africa | Ecuador | Uruguay |
| Latvia | Kenya | Spain | Georgia | Zambia |
| Netherlands | Kyrgyz Republic | Sri Lanka | Ghana | Zimbabwe |
| Norway | Lesotho | Ukraine | Guatemala | Tajikistan |
| Sweden | Lithuania | Venezuela | Kazakhstan | |
| Switzerland | Luxembourg | Madagascar | ||
| Thailand | Malaysia | Malawi | ||
| United Kingdom | Viet Nam | Tanzania | ||
| United States | Mexico | Mali | ||
| Global | Very Competitive Countries | Competitive Countries | Less Competitive Countries | |
|---|---|---|---|---|
| Relationships | Path Coefficients Confidence Intervals Total Effects/Effect Sizes | Path Coefficients Confidence Intervals Total Effects/Effect Sizes | Path Coefficients Confidence Intervals Total Effects/Effect Sizes | Path Coefficients Confidence Intervals Total Effects/Effect Sizes |
| Institutions → Infrastructure | 0.837 *** 0.787 to 0.886 N/A | 0.799 *** 0.704 to 0.895 N/A | 0.833 *** 0.756 to 0.911 N/A | 0.775 *** 0.697 to 0.853 N/A |
| Institutions → Education | 0.360 *** 0.309 to 0.412 0.808/0.653 ^^^ | 0.525 *** 0.426 to 0.625 0.859/0.737 ^^^ | 0.349 *** 0.268 to 0.431 0.786/0.617 ^^^ | 0.327 *** 0.245 to 0.409 0.679/0.461 ^^^ |
| Institutions → Technology | 0.186 *** 0.134 to 0.237 0.805/0.648 ^^^ | 0.145 ** 0.040 to 0.251 0.788/0.620 ^^^ | 0.162 *** 0.079 to 0.246 0.774/0.600 ^^^ | 0.236 *** 0.153 to 0.319 0.743/0.552 ^^^ |
| Institutions → Innovation | 0.238 *** 0.186 to 0.290 0.807/0.651 ^^^ | 0.200 *** 0.095 to 0.305 0.760/0.578 ^^^ | 0.178 *** 0.095 to 0.262 0.812/0.659 ^^^ | 0.246 *** 0.163 to 0.329 0.663/0.439 ^^^ |
| Institutions → Business Sophistication | 0.010 0.063 to 0.043 0.788/0.621 ^^^ | 0.344 *** 0.447 to 0.242 0.624/0.390 ^^^ | 0.123 ** 0.039 to 0.207 0.827/0.684 ^^^ | 0.142 *** 0.058 to 0.226 0.747/0.558 ^^^ |
| Institutions → Macroeconomic Environment | 0.488 *** 0.438 to 0.539 0.885/0.783 ^^^ | 0.552 *** 0.453 to 0.651 0.864/0.746 ^^^ | 0.605 *** 0.526 to 0.684 0.893/0.797 ^^^ | 0.411 *** 0.330 to 0.492 0.847/0.717 ^^^ |
| Infrastructure → Education | 0.535 *** 0.485 to 0.586 N/A | 0.417 *** 0.316 to 0.518 N/A | 0.524 *** 0.443 to 0.604 N/A | 0.454 *** 0.373 to 0.535 N/A |
| Infrastructure → Technology | 0.445 *** 0.394 to 0.496 0.609/0.521 ^^^ | 0.104 * 0.002 to 0.211 0.376/0.287 ^^ | 0.617 *** 0.538 to 0.696 0.682/0.583 ^^^ | 0.399 *** 0.318 to 0.481 0.532/0.419 ^^^ |
| Infrastructure → Innovation | −0.187 *** −0.239 to −0.135 0.386/0.305 ^^ | 0.045 −0.062 to 0.152 0.528/0.422 ^^^ | −0.138 *** −0.222 to −0.055 0.406/0.325 ^^ | −0.336 *** −0.418 to −0.254 0.044/0.023 ^ |
| Infrastructure → Business Sophistication | 0.219 *** 0.167 to 0.271 0.653/0.559 ^^^ | 0.399 *** 0.297 to 0.501 0.712/0.538 ^^^ | 0.249 *** 0.167 to 0.332 0.632/0.558 ^^^ | −0.046 −0.130 to 0.039 0.400/0.298 ^^ |
| Infrastructure → Macroeconomic Environment | −0.198 *** −0.250 to −0.146 0.278/0.229 ^^ | −0.221 *** −0.325 to −0.116 0.112/0.082 ^ | −0.215 *** −0.298 to −0.132 0.214/0.173 ^^ | −0.150 *** −0.233 to −0.066 0.183/0.134 ^ |
| Education → Technology | 0.306 *** 0.254 to 0.357 N/A | 0.651 *** 0.553 to 0.749 N/A | 0.124 ** 0.040 to 0.208 N/A | 0.292 *** 0.209 to 0.374 N/A |
| Education → Innovation | 0.198 *** 0.146 to 0.249 0.562/0.484 ^^^ | −0.004 −0.112 to 0.104 0.520/0.435 ^^^ | 0.360 *** 0.279 to 0.442 0.564/0.491 ^^^ | 0.120 ** 0.036 to 0.204 0.541/0.382 ^^^ |
| Education → Business Sophistication | 0.408 *** 0.357 to 0.459 0.516/0.452 ^^^ | 0.462 *** 0.362 to 0.563 0.671/0.521 ^^^ | 0.322 *** 0.240 to 0.404 0.361/0.310 ^^ | 0.399 *** 0.318 to 0.480 0.544/0.450 ^^^ |
| Education → Macroeconomic Environment | 0.008 −0.045 to 0.060 0.296/0.248 ^^ | 0.070 0.037 to 0.177 0.437/0.370 ^^^ | −0.121 ** −0.205 to −0.037 0.039/0.029 ^ | −0.032 −0.117 to 0.053 0.306/0.229 ^^ |
| Technology → Innovation | 0.027 −0.026 to 0.080 N/A | 0.224*** 0.120 to 0.329 N/A | 0.002 −0.083 to 0.087 N/A | 0.050 −0.035 to 0.135 N/A |
| Technology → Business Sophistication | 0.355 *** 0.304 to 0.406 N/A | 0.320 *** 0.217 to 0.423 N/A | 0.313 *** 0.231 to 0.395 0.313/0.271 ^^ | 0.497 *** 0.416 to 0.577 0.497/0.427 ^^^ |
| Technology → Macroeconomic Environment | 0.323 *** 0.272 to 0.375 0.466/0.413 ^^^ | 0.263 *** 0.159 to 0.366 0.378/0.319 ^^ | 0.194 *** 0.110 to 0.277 0.377/0.314 ^^ | 0.324 *** 0.241 to 0.406 0.545/0.474 ^^^ |
| Business Sophistication → Innovation | 0.690 *** 0.640 to 0.740 N/A | 0.563 *** 0.464 to 0.602 N/A | 0.561 *** 0.481 to 0.641 N/A | 0.748 *** 0.670 to 0.827 N/A |
| Business Sophistication → Macroeconomic Environment | 0.484 *** 0.433 to 0.534 0.410/0.365 ^^^ | 0.185 *** 0.080 to 0.290 0.263/0.194 ^^ | 0.705 *** 0.627 to 0.784 0.586/0.522 ^^^ | 0.438 *** 0.357 to 0.519 0.445/0.398 ^^^ |
| Innovation → Macroeconomic Environment | −0.107 *** −0.159 to −0.054 N/A | 0.139 ** 0.034 to 0.245 N/A | −0.212 *** −0.295 to −0.128 N/A | 0.010 −0.075 to 0.095 N/A |
| Model 1.1 | Model 1.2 | Model 1.3 | Model 1.4 | Model 1.5 | Model 1.6 | ||
|---|---|---|---|---|---|---|---|
| Sustainable Development Dimensions’ Interactions | Competitive Levels | Path Coefficients Confidence Intervals Total Effects/Effect Sizes | Path Coefficients Confidence Intervals Total Effects/Effect Sizes | Path Coefficients Confidence Intervals Total Effects/Effect Sizes | Path Coefficients Confidence Intervals Total Effects/Effect Sizes | Path Coefficients Confidence Intervals Total Effects/Effect Sizes | Path Coefficients Confidence Intervals Total Effects/Effect Sizes |
| Macroeconomic Environment → Environmental Dimension | Global | 0.066 ** 0.013 to 0.118 0.243/0.351 ^^^ | 0.066 ** 0.013 to 0.118 0.243/0.351 ^^^ | 0.076 ** 0.024 to 0.128 0.593/0.351 ^^^ | 0.593 *** 0.214 to 0.776 N/A | 0.156 *** 0.104 to 0.208 N/A | 0.593 *** 0.542 to 0.643 N/A |
| Very Competitive | −0.051 −0.062 to −0.003 0.571/0.326 ^^ | −0.051 −0.062 to −0.003 0.571/0.326 ^^ | 0.043 0.024 to 0.150 0.571/0.326 ^^ | 0.571 *** 0.472 to 0.670 N/A | 0.020 0.012 to 0.128 0.571/0.326 ^^ | 0.571 *** 0.472 to 0.670 N/A | |
| Competitive | 0.024 0.012 to 0.108 0.347/0.121 ^ | 0.024 0.012 to 0.108 0.347/0.121 ^ | 0.037 0.012 to 0.121 0.347/0.121 ^ | 0.348 *** 0.265 to 0.429 N/A | 0.061 0.042 to 0.146 0.347/0.121 ^ | 0.348 *** 0.265 to 0.429 N/A | |
| Less Competitive | −0.111 ** −0.196 to −0.027 −0.390/0.152 ^^ | −0.111 ** −0.196 to −0.027 −0.390/0.152 ^^ | −0.116 ** −0.200 to −0.032 −0.390/0.152 ^^ | −0.390 *** −0.471 to −0.308 N/A | −0.151 *** −0.234 to −0.067 −0.390/0.152 ^^ | −0.382 *** −0.471 to −0.308 N/A | |
| Macroeconomic Environment → Social Dimension | Global | 0.530 *** 0.480 to 0.581 N/A | 0.530 *** 0.480 to 0.581 N/A | −0.032 −0.085 to 0.021 0.530/0.281 ^^ | −0.032 −0.085 to 0.021 0.530/0.281 ^^ | 0.530 *** 0.480 to 0.581 N/A | −0.011 −0.064 to 0.042 0.281 ^^ |
| Very Competitive | 0.647 *** 0.254 to 0.885 N/A | 0.647 *** 0.254 to 0.885 N/A | 0.171 *** 0.066 to 0.276 0.647/0.419 ^^^ | 0.171 *** 0.066 to 0.276 0.647/0.419 ^^^ | 0.647 *** 0.549 to 0.745 N/A | 0.229 *** 0.125 to 0.334 0.647/0.419 ^^^ | |
| Competitive | 0.336 *** 0.254 to 0.418 N/A | 0.336 *** 0.254 to 0.418 N/A | 0.003 0.000 to 0.089 0.336/0.113 ^ | 0.003 0.001 to 0.089 0.336/0.113 ^ | 0.336 *** 0.254 to 0.418 N/A | 0.037 * 0.028 to 0.122 0.336/0.136 ^ | |
| Less Competitive | 0.289 *** 0.207 to 0.372 N/A | 0.289 *** 0.207 to 0.372 N/A | −0.060 −0.144 to −0.030 0.289/0.084 ^ | −0.060 −0.144 to −0.056 0.289/0.084 ^ | 0.289 *** 0.207 to 0.372 N/A | −0.059 −0.120 to −0.042 0.289/0.084 ^ | |
| Macroeconomic Environment → Economic Dimension | Global | 0.194 *** 0.142 to 0.246 0.245/0.357 ^^^ | 0.194 *** 0.142 to 0.246 0.245/0.357 ^^^ | 0.597 *** 0.547 to 0.648 N/A | 0.089 *** 0.037 to 0.141 0.597/0.357 ^^^ | 0.091 *** 0.039 to 0.144 0.597/0.357 ^^^ | 0.091 *** 0.039 to 0.144 0.357 ^^^ |
| Very Competitive | 0.147 ** 0.017 to 0.223 0.630/0.397 ^^^ | 0.147 ** 0.017 to 0.223 0.630/0.397 ^^^ | 0.630 *** 0.532 to 0.729 N/A | 0.748 *** 0.651 to 0.844 N/A | 0.136 ** 0.030 to 0.241 0.630/0.397 ^^^ | 0.136 ** 0.030 to 0.241 0.630/0.397 ^^^ | |
| Competitive | 0.102 *** 0.017 to 0.186 0.374/0.140 ^ | 0.102 *** 0.017 to 0.186 0.374/0.140 ^ | 0.374 *** 0.292 to 0.455 N/A | 0.814 *** 0.736 to 0.891 N/A | 0.075 * 0.025 to 0.159 0.374/0.140 ^ | 0.075 * 0.038 to 0.159 0.374/0.140 ^ | |
| Less Competitive | 0.101 ** 0.016 to 0.185 0.335/0.112 ^ | 0.101 ** 0.016 to 0.185 0.335/0.112 ^ | 0.335 *** 0.253 to 0.417 N/A | 0.002 0.000 to 0.008 0.335/0.112 ^ | 0.025 0.012 to 0.110 0.335/0.112 ^ | 0.023 0.018 to 0.110 0.335/0.112 ^ | |
| Social Dimension → Economic Dimension | Global | 0.761 *** 0.711 to 0.811 N/A | 0.219 *** 0.167 to 0.271 0.761/0.657 ^^^ | 0.219 *** 0.167 to 0.271 N/A | |||
| Very Competitive | 0.748 *** 0.732 to 0.887 N/A | 0.296 *** 0.193 to 0.399 0.748/0.630 ^^^ | 0.296 *** 0.193 to 0.399 N/A | ||||
| Competitive | 0.810 *** 0.732 to 0.887 N/A | 0.434 *** 0.353 to 0.515 0.810/0.683 ^^^ | 0.434 *** 0.353 to 0.515 N/A | ||||
| Less Competitive | 0.811 *** 0.733 to 0.888 N/A | 0.385 *** 0.313 to 0.476 0.811/0.681 ^^^ | 0.385 *** 0.313 to 0.476 N/A | ||||
| Social Dimension → Environmental Dimension | Global | 0.469 *** 0.418 to 0.520 N/A | 0.469 *** 0.418 to 0. 0.761/0.747 ^^^ | 0.824 *** 0.774 to 0.873 N/A | |||
| Very Competitive | 0.487 *** 0.474 to 0.633 N/A | 0.487 *** 0.474 to 0.633 0.850/0.734 ^^^ | 0.850 *** 0.755 to 0.945 N/A | ||||
| Competitive | 0.554 *** 0.474 to 0.633 N/A | 0.554 *** 0.474 to 0.633 0.853/0.683 ^^^ | 0.853 *** 0.776 to 0.930 N/A | ||||
| Less Competitive | −0.511 *** −0.591 to −0.430 N/A | −0.511 *** −0.591 to −0.430 −0.827/0.720 ^^^ | −0.828 *** −0.904 to −0.750 N/A | ||||
| Economic Dimension → Social Dimension | Global | 0.851 *** 0.801 to 0.900 N/A | 0.235 *** 0.184 to 0.287 0.851/0.735 ^^^ | 0.235 *** 0.124 to 0.289 N/A | |||
| Very Competitive | 0.721 *** 0.452 to 0.852 N/A | 0.288 *** 0.185 to 0.391 0.721/0.607 ^^^ | 0.288 *** 0.185 to 0.391 N/A | ||||
| Competitive | 0.835 *** 0.758 to 0.912 N/A | 0.369 *** 0.287 to 0.451 0.835/0.705 ^^^ | 0.369 *** 0.287 to 0.451 N/A | ||||
| Less Competitive | 0.837 0.759 to 0.914 N/A | 0.354 *** 0.272 to 0.436 0.837/0.702 ^^^ | 0.354 *** 0.272 to 0.436 N/A | ||||
| Economic Dimension → Environmental Dimension | Global | 0.466 *** 0.415 to 0.517 0.865/0.788 ^^^ | 0.466 *** 0.415 to 0.517 N/A | 0.865 *** 0.816 to 0.914 N/A | |||
| Very Competitive | 0.486 *** 0.328 to 0.685 0.837/0.723 ^^^ | 0.489 *** 0.288 to 0.529 N/A | 0.837 *** 0.742 to 0.932 N/A | ||||
| Competitive | 0.370 *** 0.288 to 0.451 0.832/0.703 ^^^ | 0.370 *** 0.288 to 0.451 N/A | 0.832 *** 0.755 to 0.909 N/A | ||||
| Less Competitive | −0.390 −0.472 to −0.309 −0.817/0.700 ^^^ | −0.390 *** −0.472 to −0.309 N/A | −0.817 *** −0.895 to −0.740 N/A | ||||
| Environmental Dimension → Social Dimension | Global | 0.711 *** 0.661 to 0.761 N/A | 0.711 *** 0.184 to 0.809 0.913/0.828 ^^^ | 0.913 *** 0.864 to 0.962 N/A | |||
| Very Competitive | 0.517 *** 0.417 to 0.617 N/A | 0.517 *** 0.417 to 0.617 0.732/0.632 ^^^ | 0.732 *** 0.636 to 0.829 N/A | ||||
| Competitive | 0.560 *** 0.480 to 0.640 N/A | 0.560 *** 0.480 to 0.640 0.861/0.752 ^^^ | 0.861 *** 0.784 to 0.938 N/A | ||||
| Less Competitive | −0.591 *** −0.670 to −0.511 N/A | −0.591 *** −0.670 to −0.511 −0.893/0.778 ^^^ | −0.893 *** −0.970 to −0.817 N/A | ||||
| Environmental Dimension → Economic Dimension | Global | 0.858 *** 0.729 to 0.895 N/A | 0.658 *** 0.607 to 0.708 N/A | 0.658 *** 0.607 to 0.962 0.781 ^^^ | |||
| Very Competitive | 0.748 *** 0.651 to 0.844 N/A | 0.531 *** 0.431 to 0.631 N/A | 0.531 *** 0.431 to 0.631 0.748/0.646 ^^^ | ||||
| Competitive | 0.814 *** 0.736 to 0.891 N/A | 0.440 *** 0.359 to 0.521 N/A | 0.440 *** 0.359 to 0.521 0.814/0.688 ^^^ | ||||
| Less Competitive | −0.857 *** −0.933 to −0.778 N/A | −0.503 *** −0.583 to −0.423 N/A | −0.513 *** −0.583 to −0.423 −0.856/0.733 ^^^ |
| Global | Very Competitive Countries | Competitive Countries | Less Competitive Countries | |
|---|---|---|---|---|
| Relationships | Path Coefficients Confidence Intervals Total Effects/Effect Sizes | Path Coefficients Confidence Intervals Total Effects/Effect Sizes | Path Coefficients Confidence Intervals Total Effects/Effect Sizes | Path Coefficients Confidence Intervals Total Effects/Effect Sizes |
| Institutions → Environmental Dimension | −0.040 −0.093 to 0.012 0.538/0.289 ^^ | −0.067 −0.174 to 0.040 0.552/0.305 ^^ | −0.167 *** −0.250 to −0.083 0.259/0.067 ^ | −0.060 −0.145 to 0.024 −0.438/0.192 ^^ |
| Institutions → Social Dimension | 0.120 *** 0.068 to 0.180 0.487/0.237 ^^ | −0.387 *** −0.489 to −0.285 0.593/0.352 ^^^ | 0.355 *** 0.273 to 0.437 0.267/0.071 ^ | 0.043 −0.042 to 0.128 0.377/0.142 ^ |
| Institutions → Economic Dimension | 0.128 *** 0.076 to 0.180 0.580/0.336 ^^ | −0.060 −0.167 to 0.047 0.660/0.435 ^^^ | 0.647 *** 0.563 to 0.726 0.344/0.118 ^ | 0.315 *** 0.233 to 0.397 0.442/0.195 ^^ |
| Infrastructure → Environmental Dimension | −0.057 −0.109 to −0.005 0.687/0.451 ^^^ | 0.038 −0.070 to 0.1445 0.517/0.325 ^^ | −0.166 *** −0.250 to −0.083 0.749/0.333 ^^ | −0.247 *** 0.164 to 0.330 −0.416/0.211 ^^ |
| Infrastructure → Social Dimension | 0.087 *** 0.034 to 0.139 0.0.684/0.419 ^^^ | 0.189 *** 0.084 to 0.293 0.576/0.393 ^^^ | 0.239 *** 0.156 to 0.322 0.829/0.395 ^^^ | −0.060 −0.145 to 0.025 0.451/0.213 ^^ |
| Infrastructure → Economic Dimension | 0.238 *** 0.187 to 0.290 0.0.630/0.424 ^^^ | 0.083 −0.023 to 0.190 0.453/0.313 ^^ | 0.379 *** 0.298 to 0.461 0.672/0.331 ^^ | 0.310 *** 0.228 to 0.392 0.490/0.264 ^^ |
| Education → Environmental Dimension | 0.093 *** 0.040 to 0.145 0.813/0.615 ^^^ | 0.115 * 0.009 to 0.221 0.896/0.655 ^^^ | 0.230 *** 0.147 to 0.313 0.953/0.591 ^^^ | −0.093 * −0.177 to −0.008 −0.490/0.293 ^^ |
| Education → Social Dimension | 0.289 *** 0.22237 to 0.340 0.0.776/0.548 ^^^ | 0.323 *** 0.220 to 0.425 0.951/0.745 ^^^ | 0.396 *** 0.314 to 0.477 0.857/0.513 ^^^ | 0.146 *** 0.062 to 0.230 0.410/0.215 ^^ |
| Education → Economic Dimension | 0.796 *** 0.746 to 0.845 0.786/0.609 ^^^ | 0.927 *** 0.833 to 0.956 0.866/0.700 ^^^ | 0.869 *** 0.899 to 0.995 0.910/0.591 ^^^ | 0.529 *** 0.449 to 0.609 0.442/0.261 ^^ |
| Technology → Environmental Dimension | 0.079 ** 0.026 to 0.131 −0.052/0.032 ^ | −0.218 *** −0.322 to −0.113 −0.141/0.083 ^ | 0.047 0.038 to 0.132 0.051/0.0019 | −0.231 *** −0.314 to −0.148 0.084/0.038 ^ |
| Technology → Social Dimension | −0.058 ** −0.111 to −0.006 −0.183/0.099 ^ | 0.207 *** 0.005 to 0.218 0.165/0.117 ^ | −0.148 *** −0.232 to −0.064 −0.219/0.078 ^ | −0.001 −0.087 to 0.084 −0.324/0.134 ^ |
| Technology → Economic Dimension | 0.131 *** 0.079 to 0.183 0.052/0.097 ^ | 0.033 −0.074 to 0.141 −0.044/0.001 | 0.223 *** 0.140 to 0.306 0.193/0.089 ^ | 0.084 −0.168 to 0.001 −0.043/0.014 |
| Business Sophistication → Environmental Dimension | 0.211 *** 0.159 to 0.263 0.112/0.077 ^ | 0.075 −0.032 to 0.182 −0.001/0.001 | 0.405 *** 0.324 to 0.486 0.228/0.111 ^ | −0.215 *** −0.298 to −0.132 0.077/0.038 ^ |
| Business Sophistication → Social Dimension | 0.179 *** 0.137 to 0.241 0.008/0.005 | 0.112 * 0.005 to 0.218 0.054/0.034 ^ | 0.289 *** 0.206 to 0.371 0.0556/0.026 ^ | 0.131 ** 0.047 to 0.215 −0.116/0.012 |
| Business Sophistication → Economic Dimension | 0.124 *** 0.072 to 0.176 0.075/0.052 ^ | 0.038 −0.070 to 0.145 −0.045/0.018 | 0.210 *** 0.127 to 0.293 0.095/0.046 ^ | 0.310 *** 0.228 to 0.393 −0.026/0.011 |
| Innovation → Environmental Dimension | −0.204 *** −0.256 to −0.153 −0.330/0.197 ^^ | −0.091 −0.197 to 0.016 −0.309/0.173 ^^ | −0.277 *** −0.360 to −0195 −0.594/0.232 ^^ | 0.326 *** 0.244 to 0.409 0.468/0.125 ^ |
| Innovation → Social Dimension | −0.394 *** −0.445 to −0.343 −0.363/0.192 ^^ | −0.365 *** 0.467 to −0.263 −0.309/0.237 ^^ | -−0.417 *** −0.498 to −0.335 −0.565/0.212 ^^ | −0.338 *** −0.420 to −0.256 −0.341/0.071 ^ |
| Innovation → Economic Dimension | 0.032 −0.0020 to 0.085 0.051/0.034 ^ | −0.074 −0.180 to 0.033 −0.090/0.001 | 0.122 ** 0.038 to 0.206 0.188/0.089 ^ | 0.003 −0.082 to 0.088 −0.026/0.002 |
| Macroeconomic Environment → Environmental Dimension | 0.006 0.001 to 0.118 0.100/0.059 ^ | 0.087 −0.019 to 0.194 0.086/0.049 ^ | −0.014 −0.099 to 0.071 0.246/0.085 ^ | −0.026 −0.111 to 0.059 0.569/0.222 ^^ |
| Macroeconomic Environment → Social Dimension | 0.081 *** 0.031 to 0.095 0.053/0.028 ^ | 0.252 *** 0.148 to 0.356 0.161/0.104 ^ | 0.109 ** 0.024 to 0.093 0.317/0.106 ^ | 0.059 −0.025 to 0.144 −0.006/0.002 |
| Macroeconomic Environment → Economic Dimension | 0.173 *** 0.047 to 0.248 0.173/0.104 ^ | 0.158 ** 0.052 to 0.263 0.158/0.099 ^ | 0.313 *** 0.231 to 0.395 0.313/0.117 ^ | 0.760 *** 0.682 to 0.838 0.760/0.255 |
| Social Dimension → Environmental Dimension | 0.411 *** 0.347 to 0.548 0.411/0.372 ^^^ | 0.477 *** 0.377 to 0.578 0.477/0.412 ^^^ | 0.435 *** 0.354 to 0.516 0.4335/0.380 ^^^ | −0.409 *** −0.490 to −0.327 −0.409/0.356 ^^^ |
| Economic Dimension → Social Dimension | 0.770 *** 0.547 to 0.812 0.770/0.665 ^^^ | 0.575 *** 0.476 to 0.674 0.575/0.484 ^^^ | 0.390 *** 0.309 to 0.472 0.679/0.574 ^^^ | 0.809 *** 0.732 to 0.887 0.809/0.679 ^^^ |
| Economic Dimension → Environmental Dimension | 0.485 *** 0.347 to 0.648 0.801/0.729 ^^^ | 0.493 *** 0.393 to 0.594 0.768/0.663 ^^^ | 0.665 *** 0.587 to 0.744 0.66/0.562 ^^^ | −0.485 −0.656 to −0.404 −0.815/0.698 ^^^ |
Disclaimer/Publisher’s Note: The statements, opinions and data contained in all publications are solely those of the individual author(s) and contributor(s) and not of MDPI and/or the editor(s). MDPI and/or the editor(s) disclaim responsibility for any injury to people or property resulting from any ideas, methods, instructions or products referred to in the content. |
© 2025 by the authors. Licensee MDPI, Basel, Switzerland. This article is an open access article distributed under the terms and conditions of the Creative Commons Attribution (CC BY) license (https://creativecommons.org/licenses/by/4.0/).
Share and Cite
Canatay, A.; Prieto, L.; Amin, M.R. Navigating the Convergence of Global Competitiveness and Sustainable Development: A Multi-Level Analysis. Sustainability 2025, 17, 5361. https://doi.org/10.3390/su17125361
Canatay A, Prieto L, Amin MR. Navigating the Convergence of Global Competitiveness and Sustainable Development: A Multi-Level Analysis. Sustainability. 2025; 17(12):5361. https://doi.org/10.3390/su17125361
Chicago/Turabian StyleCanatay, Arman, Leonel Prieto, and Muhammad Ruhul Amin. 2025. "Navigating the Convergence of Global Competitiveness and Sustainable Development: A Multi-Level Analysis" Sustainability 17, no. 12: 5361. https://doi.org/10.3390/su17125361
APA StyleCanatay, A., Prieto, L., & Amin, M. R. (2025). Navigating the Convergence of Global Competitiveness and Sustainable Development: A Multi-Level Analysis. Sustainability, 17(12), 5361. https://doi.org/10.3390/su17125361


