Article

Risk Assessment of Heavy Metal Pollution in Agricultural Soils Around Industrial Enterprises in Lanzhou, China: A Multi-Industry Perspective Promoting Land Sustainability

1
School of Environmental and Municipal Engineering, Lanzhou Jiaotong University, Lanzhou 730070, China
2
Gansu Province Dust Control and Environmental Friendliness Technology Innovation Center, Lanzhou 730070, China
*
Author to whom correspondence should be addressed.
Sustainability 2025, 17(12), 5343; https://doi.org/10.3390/su17125343 (registering DOI)
Submission received: 6 May 2025 / Revised: 1 June 2025 / Accepted: 6 June 2025 / Published: 10 June 2025

Abstract

:
Systematic assessment of heavy metal contamination in agricultural soils is critical for addressing ecological and public health risks in industrial-intensive cities like Lanzhou, with direct implications for achieving UN Sustainable Development Goals (SDGs) 2 (Zero Hunger), 15 (Life on Land), and 3 (Good Health). The present study evaluates farmland soils around six industrial sectors: waste disposal (WDZ), pharmaceutical manufacturing (PMZ), chemical manufacturing (CMZ), petrochemical industry (PIZ), metal smelting (MSZ), mining (MZ) and one sewage-irrigated zone (SIZ) using geo-accumulation index, Nemerow composite pollution index, potential ecological risk index, and health risk models. The following are the major findings: (1) SIZ and PMZ emerged as primary contamination clusters, with Hg (Igeo = 1.89) and Cd (Igeo = 0.61) showing marked accumulation. Chronic wastewater irrigation caused severe Hg contamination (0.97 mg·kg−1) in SIZ, where 100% of the samples reached strong polluted levels according to the Nemerow composite pollution index; (2) Hg and Cd dominated the ecological risks, with 41.32% of the samples exhibiting critical Hg risks (100% in PMZ and SIZ) and 32.63% showing strong Cd risks; and (3) oral ingestion constituted the dominant exposure pathway. Children faced carcinogenic risks (CR = 1.33 × 10⁻⁴) exceeding safety thresholds, while adult risks remained acceptable. Notably, high Hg and Cd levels did not translate to proportionally higher health risks due to differential toxicological parameters. The study recommends prioritizing Hg and Cd control in PMZ and SIZ, with targeted exposure prevention measures for children.

1. Introduction

Against the backdrop of rapid urbanization, industrialization, and intensive agriculture, emissions of pollutants associated with human activities have been on the rise. These pollutants infiltrate the soil system, causing varying degrees of contamination that impair its structural integrity and functional capacity, posing threats to ecological health and human well-being [1]. Heavy metal pollution stands as a major type of soil contamination, characterized by toxicity and persistence, and now ranks among the most pressing environmental threats worldwide [2], attracting extensive research and regulatory attention [3]. Previous studies revealed that industrial discharges from enterprises dealing with heavy metals are the primary sources of this contamination. Activities such as mining, metal processing, transportation, and chemical manufacturing generate heavy metal-laden waste streams, including effluents, wastewater, and solid waste, which enter the soil via atmospheric deposition and surface runoff, exacerbating heavy metal pollution around these facilities [4]. The irregular spatial distribution of polluting enterprises further contributes to pronounced spatial variations in heavy metal pollution. Understanding the current status of soil heavy metal pollution around enterprises, accurately identifying high-risk areas for heavy metal contamination, and effectively curbing the worsening trend of soil pollution are the scientific basis for authorities to implement heavy metal control measures. This has become a focal point for governments, businesses, and the public alike.
Agricultural soils are vital natural resources for human life, but croplands across China’s diverse geographic settings, from urban centers to rural villages, have been found to be contaminated by heavy metals to varying degrees [5]. The 2014 “National Soil Pollution Survey Bulletin” revealed that nearly one-fifth of cropland soil points were polluted, with Cd, As, Hg, and Pb being the principal contaminants. Due to the toxicity, persistence, bio-accumulative nature, and irreversibility of heavy metals, contamination in agricultural fields poses severe environmental hazards and can accumulate in organisms through multiple exposure pathways, including soil ingestion, skin contact, vapor inhalation, and dietary intake, thereby threatening human health [6]. For example, Pb and Hg act as neurotoxins that harm the nervous system, and Cr and Cd are associated with various cancers, while As can lead to severe health issues [2]. The accurate assessment of heavy metal pollution and linked eco-health risks is critical to developing effective remediation strategies for contaminated agricultural soils.
Extensive research has been conducted on heavy metal pollution in soils, focusing on the current pollution status, source analysis, and risk assessment, yielding substantial findings. Methods such as correlation analysis, principal component analysis, and cluster analysis are widely employed to decipher the sources of heavy metals [7]. Commonly used pollution assessment techniques include the single-factor pollution index, Nemerow’s comprehensive pollution index, geo-accumulation index, and potential ecological risk index [8]. Health risk assessment models, including exposure assessment and risk characterization models recommended by the USEPA, can quantify food chain-mediated health risks from soil heavy metal exposure [9]. Although significant progress has been made in heavy metal contamination research both domestically and internationally, studies focusing on economically underdeveloped or remote regions remain relatively limited.
Scholars have analyzed heavy metal contamination across industrial sectors. For instance, Jiang et al. tracing sources and health risks in farmland near multi-mineral mining/smelting zones [10], Sun et al. assessing long-term accumulation dynamics under organic fertilization [11], and Zeng et al. proposed a method to identify contamination distribution patterns and primary contributing factors at smelting sites [12]. However, existing studies predominantly focus on the impact of individual industries on surrounding soils, with insufficient systematic research addressing heavy metal contamination in agricultural soils across diverse industrial zones.
Lanzhou City boasts a robust industrial foundation with a comprehensive range of sectors, each exhibiting distinct spatial distribution patterns. The waste disposal industry is primarily located in suburban areas, distant from densely populated zones to minimize the impacts on residents’ lives, yet often adjacent to farmlands, posing potential threats to soil environments. The pharmaceutical manufacturing sector clusters into zones like the Lanzhou High-Tech Industrial Development Zone and its Economic and Technological Development Zone, benefiting from advanced infrastructure but potentially polluting nearby agricultural soil through industrial effluents. Chemical manufacturing is situated in dedicated industrial parks and scattered around the city outskirts, with production processes releasing heavy metals and toxic substances, heightening pollution risks for the surrounding croplands. The petrochemical industry, a key pillar of Lanzhou’s economy, is concentrated in Xigu District, housing major petrochemical facilities; their operations release pollutants that significantly affect local soil environments due to the nature of petrochemical production. Metal smelting and mining activities are concentrated in the mountainous areas around Lanzhou, such as Yongdeng and Gaolan Counties, where abundant mineral resources lead to substantial waste, including tailings and slag rich in heavy metals. Mismanagement of these can severely contaminate nearby farmlands. Furthermore, water scarcity forces some farms to use untreated or inadequately treated wastewater for irrigation, gradually increasing the soil’s heavy metal content.
Given the research gaps and the diverse industrial landscape of Lanzhou, this study adopts a comprehensive multi-industry perspective, examining soil heavy metal pollution across various sectors, including waste management, pharmaceutical manufacturing, chemical production, petrochemical industry, wastewater irrigation, and metal smelting and mining. By comparing and analyzing the heavy metal pollution in cropland soils surrounding different industries, it reveals the variations in the impact of pollution sources from these industries on agricultural soil environments. The present research provides a more comprehensive understanding of the overall pattern and complex causes of heavy metal pollution in Lanzhou’s soils, furnishing strong evidence for formulating targeted pollution control measures. At the same time, it integrates industrial pollution with sustainable development to respond to indicators 2 (Zero Hunger), 3 (Good Health), and 15 (Life on Land) of the Sustainable Development Goals.

2. Materials and Methods

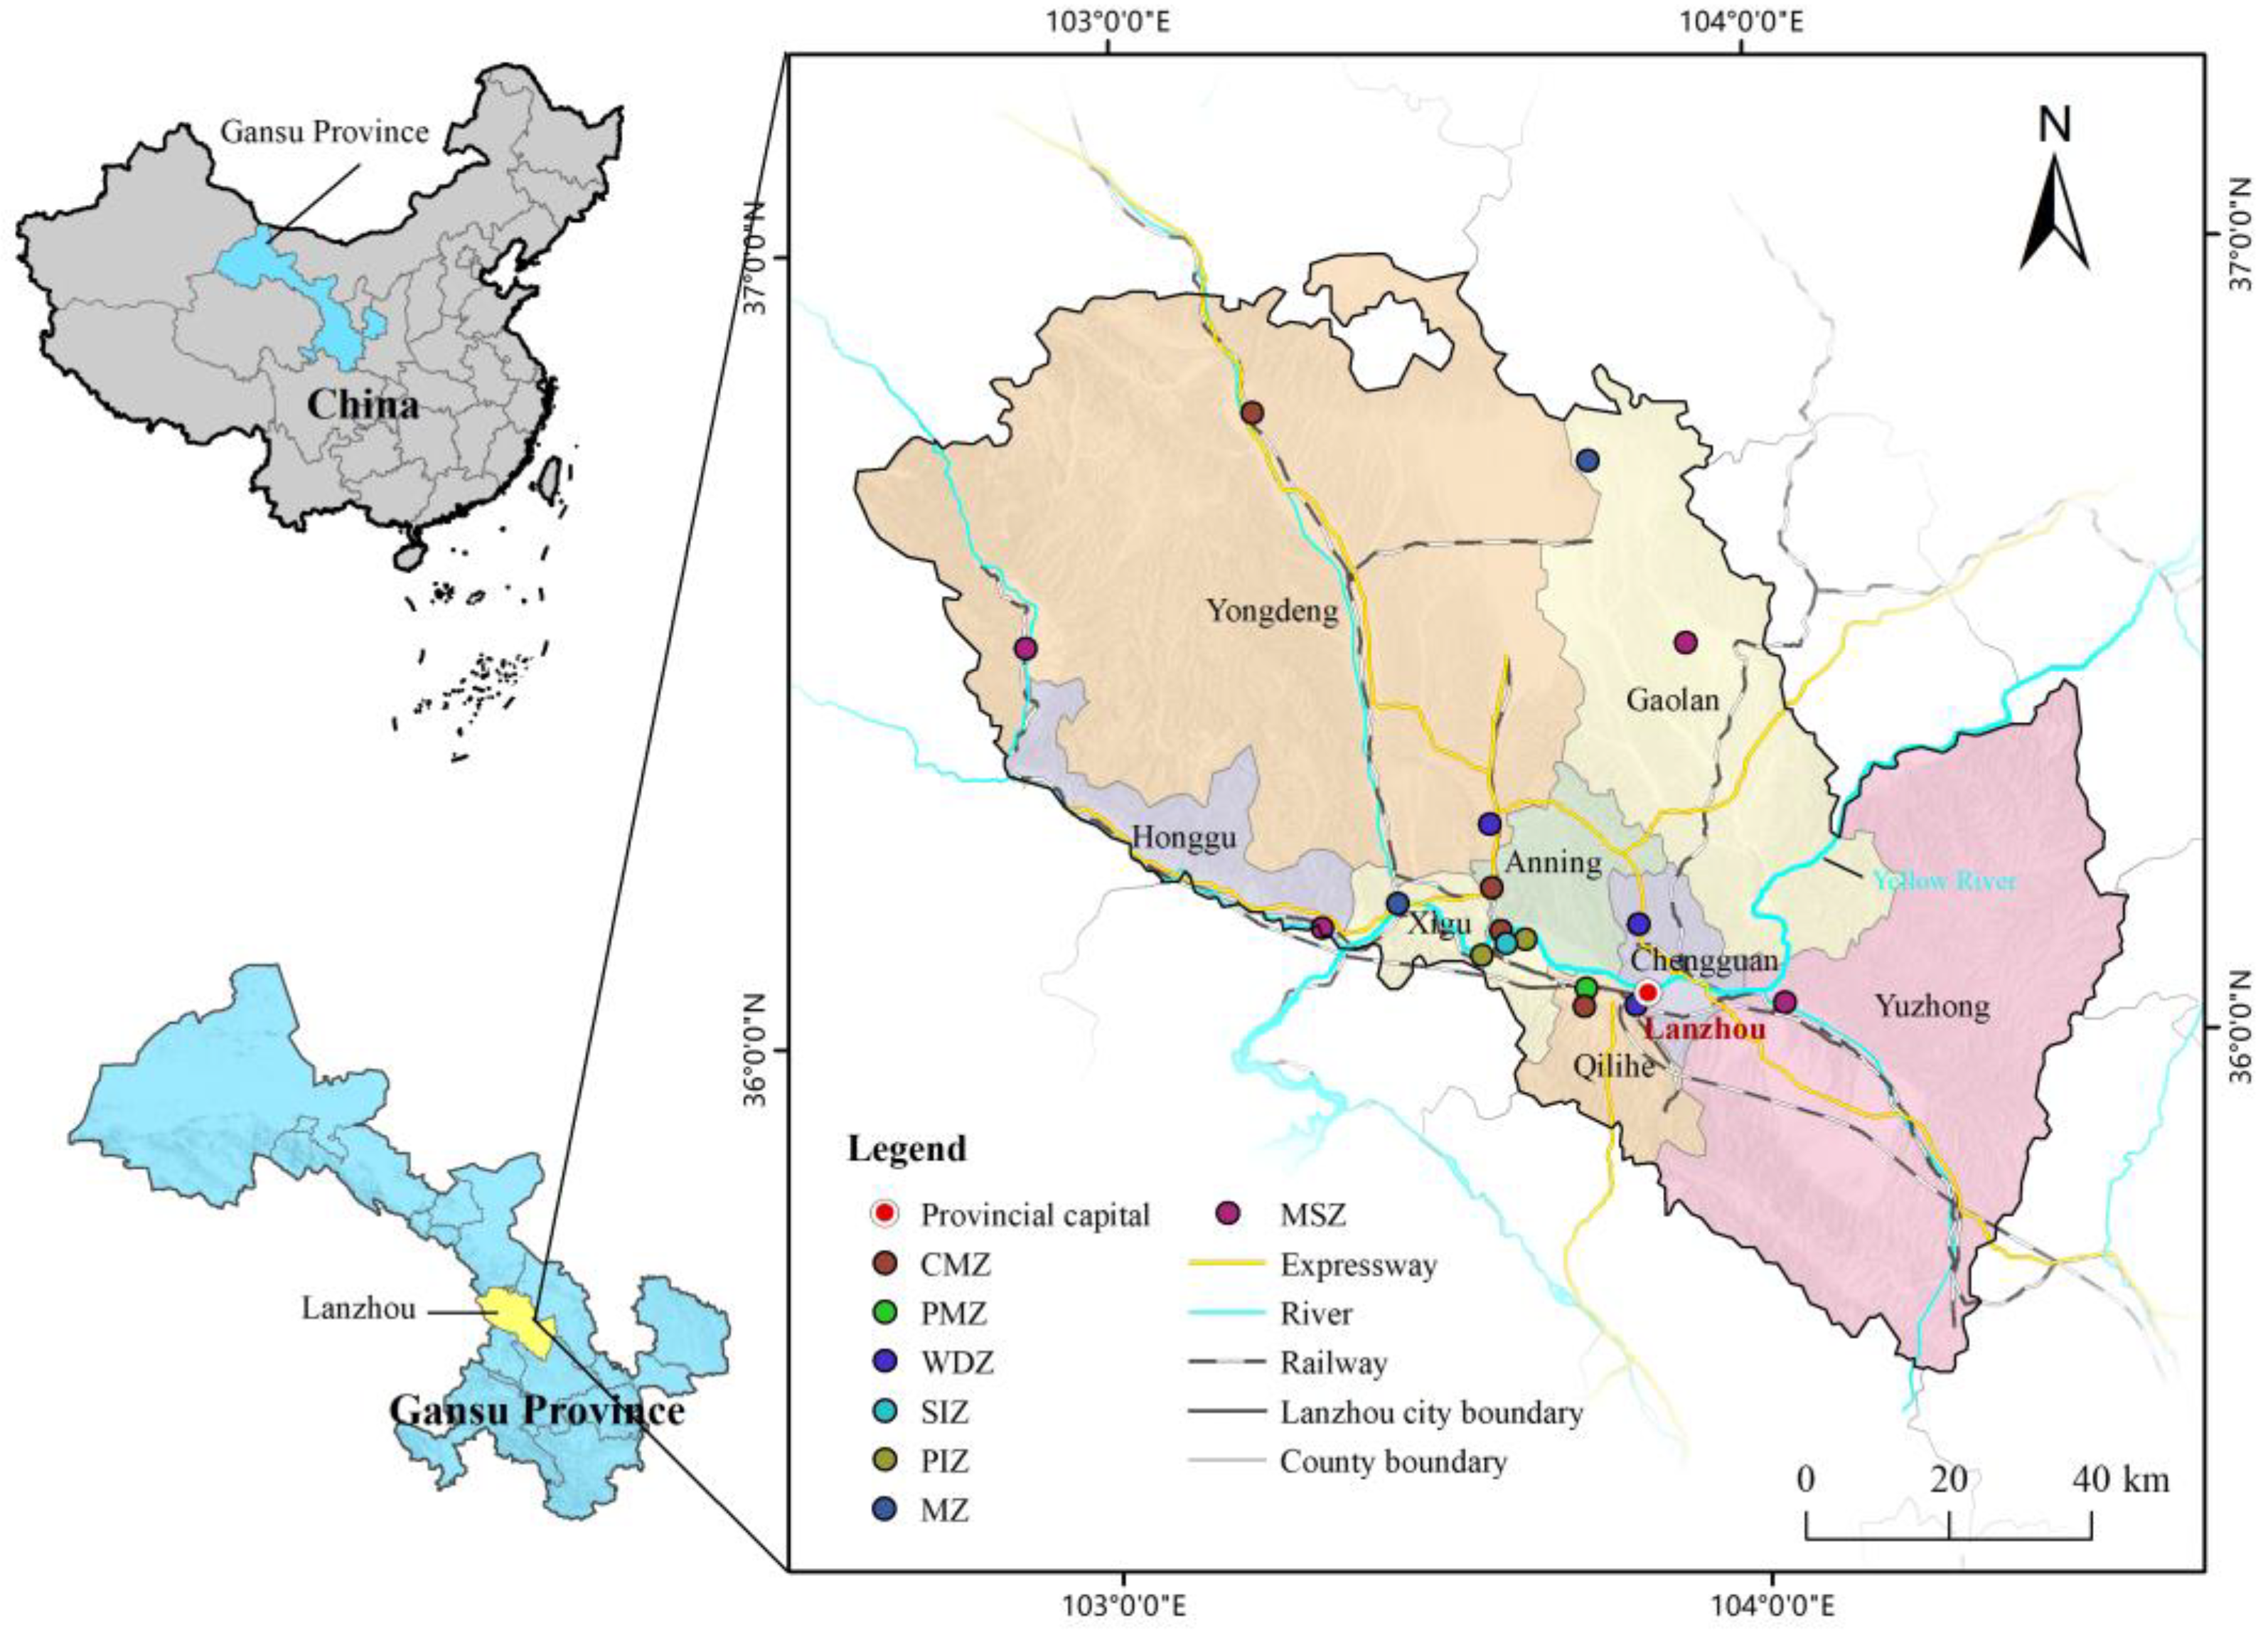
2.1. Overview of the Study Area

Straddling the Qinghai–Tibet and Loess Plateaus, Lanzhou occupies a critical transition belt and serves as a significant industrial hub and comprehensive transportation node. Its topography is remarkably diverse, featuring a mix of mountains, plateaus, plains, valleys, deserts, and gobi, with terrain sloping from southwest to northeast. The Yellow River flows northeastward, traversing the city, carving canyons and forming a string of pearl-like river valleys alternating with basins. These unique valley geography and geomorphology contribute to the scarcity of agriculture in Lanzhou, with farmlands predominantly situated in river valley plains and intermountain basins—areas characterized by level terrain, fertile soil, and ample water resources.

2.2. Sample Collection

The present study, based on the distribution characteristics of various industries, the spatial location of farmlands, and potential pathways of pollution dispersion, adheres to the principles of comprehensiveness, representativeness, objectivity, feasibility, and continuity. Following the guidelines of the “Investigation Plan for Soil Pollution around Typical Industrial Enterprises and Their Surroundings” [13], it utilizes the land use situation, remote sensing imagery, topography, hydrological, and pollution source distribution data. Sampling points are established considering pollutant diffusion patterns, within atmospheric dispersion ranges and areas influenced by surface runoff, with increased density downstream of prevailing winds and industrial facilities. A total of 334 surface soil sampling points were set up, involving 16 enterprises and 1 sewage-irrigated area (Figure 1). The study area was divided into waste disposal (WDZ), pharmaceutical manufacturing (PMZ), chemical manufacturing (CMZ), the petrochemical industry (PIZ), metal smelting (MSZ), and mining (MZ) zones, with respective enterprise counts of 3, 1, 4, 2, 4, and 2 and sampling points of 27, 5, 66, 38, 161, and 33, plus 4 sampling points in the sewage-irrigated zone (SIZ). GPS was used to accurately record the latitude and longitude of each point, ensuring accuracy and reproducibility. At each site, soil samples were collected using augers or wooden shovels. Surface soil samples, reflecting recent pollution, were taken from a depth of 0–20 cm. Sampling areas were demarcated, typically 20 m × 20 m, adaptable to 100 m × 100 m in complex terrain, using a diagonal five-point sampling method, with a total sample weight of at least 2000 g per site. Additional sampling was done if the soil contained high amounts of debris or had high moisture. Samples were placed in clean polyethylene bags, labeled with details such as sampling point number, time, location, depth, and sample type, then dried, ground, and sieved through a 2 mm mesh in the laboratory.

2.3. Sample Determination

In this study, a total of 8 heavy metal indices were detected: Cu, Zn, Pb, Cd, Cr, Ni, Hg, and As. Specific analysis was carried out in accordance with the relevant Chinese standards (HJ 491-2019 [14], GB/T 17141-1997 [15], and HJ 680-2013 [16]).

2.4. Quality Control

Simultaneously with each batch of sample analysis, blank samples were processed. For quantitative analysis using calibration curves, five or seven concentrations of standard solutions were employed, covering the range of concentrations in the tested samples, with all calibration curve correlation coefficients exceeding r > 0.999. During continuous injection analysis, every tenth sample was followed by measuring a mid-concentration point on the calibration curve, confirming that there was no significant change in the instrument’s calibration curve and the instrument remained relatively stable, meeting the detection requirements. In each batch, 10% duplicate samples were analyzed for every testing item, achieving a 100% pass rate for the test qualifications. Additionally, synchronous analysis was conducted using a national standard reference material for soil (GBW07405), with standard material samples inserted at a rate of 10% of the total sample number for each batch of similar analyses. When the number of samples in a batch was less than 20, at least two standard material samples were included. The accuracy control pass rate was 100%. Furthermore, the final result was derived from the average of three parallel measurements for each sample.

2.5. Pollution Assessment Methods

2.5.1. Geo-Accumulation Index (Igeo)

The Igeo offers a robust approach to evaluate the level of heavy metal pollution in soils, effectively highlighting the degree of heavy metal accumulation relative to regional background concentrations, providing insights into natural variations and the impact of environmental interventions by anthropogenic activities [17], calculated using Equation (1):
I geo = log 2 ( C i 1.5 × B i )
where Ci represents the measured concentration of heavy metal element i (mg·kg−1), Bi is the background value of heavy metal element i in Lanzhou’s soils (mg·kg−1) [18], and the constant 1.5 serves as a conversion factor to account for potential geological fluctuations affecting heavy metal concentrations [19]. The pollution grading standards for Igeo are presented in Table 1.

2.5.2. Single Factor Pollution Index (Pi)

The Pi reflects the contamination characteristics of individual heavy metal elements, with the degree of pollution indicated by the fold excess of a single heavy metal content over its threshold, as shown in Equation (2) [20]. The pollution grading standards for Pi are also presented in Table 1.
P i = C i B i

2.5.3. Nemerow Composite Pollution Index (PN)

PN can comprehensively reflect the overall pollution status of heavy metals [20,21], as shown in Formula (3):
P N = ( P i a 2 + P i m 2 ) 2
where Pim and Pia denote the maximum and average values of the single factor pollution indices for all heavy metal elements in the same sample, respectively. The pollution grading standards for PN are presented in Table 1.

2.6. Risk Assessment Methods

2.6.1. Potential Ecological Risk Index (RI)

The RI was proposed by Hakanson in 1980. It comprehensively considers the content of heavy metals in soil and their toxicity, ecological sensitivity, and migration and transformation behaviors in the environment to evaluate the ecological threats posed by heavy metals in soil [22]. The RI is calculated using Equation (4):
R I = i = 1 n E r i = i = 1 n T r i × C i B i
In the formula, RI denotes the comprehensive potential ecological risk index of all total metals; Eri represents the single-element ecological risk index; and Tri is the toxicity coefficient, with the values for Cu, Zn, Pb, Cd, Cr, Ni, Hg, and As being 5, 1, 5, 30, 2, 5, 40, and 10, respectively [23]. Given that the risk classification standards for Eri and RI are based on the maximum toxicity coefficient and the total toxicity coefficients of the eight pollutants, Hakanson’s ecological risk assessment criteria may not be universally applicable to all soil pollution evaluations. Variations in the quantity and types of heavy metals can lead to different assessment standards, implying that applying a fixed standard may result in inaccurate outcomes. Our previous research has summarized the method for adjusting the classification of potential ecological risks [24], and this study applies that method for calculation, with the adjusted results presented in Table 2.

2.6.2. Health Risk Assessment Methods

Based on the US EPA’s health risk assessment model, considering three exposure pathways—oral ingestion, inhalation, and dermal contact, it evaluates the hazards of heavy metal pollution to human health in terms of non-carcinogenic and carcinogenic risks using the following formulas:
ADI ing = C i × IR ing × CF × EF × ED BW × AT
ADI der = C i × ABS d × SA × AF × CF × EF × ED BW × AT
ADI inh = C i × TR inh × EF × ED PEF × BW × AT
HI = HQ i = i = 1 n ADI i RfD i
CR = R i = i = 1 n ADI i × SF i
In the formulas, ADIing, ADIder, and ADIinh represent the average daily intake for oral, dermal, and inhalation exposure pathways, respectively, in mg·(kg·d)−1; HQ and HI denote the non-carcinogenic risk of a single heavy metal and the total non-carcinogenic risk, both dimensionless; Ri and CR are the carcinogenic risks of a single heavy metal and the total carcinogenic risk, also dimensionless; RfD is the reference dose for different exposure pathways, dimensionless; and SF is the slope factor for carcinogenicity, dimensionless. Generally, HI ≤ 1 indicates no non-carcinogenic risk; if 1 < HI ≤ 10, there is a non-carcinogenic risk present [25]; when HI > 10, it suggests a potential chronic poisoning risk. A carcinogenic risk is considered absent if CR < 10−6, a risk exists but is within an acceptable range if 10−6 ≤ CR < 10−4, and CR ≥ 10−4 indicates a higher carcinogenic risk [26]. The health risk assessment parameters, along with RfD and SF values used in this study, are shown in Table 3 and Table 4 [18,27].

3. Results and Discussion

3.1. Descriptive Statistics

The measurement results of heavy metals in farmland soils around different industries in Lanzhou City are shown in Table 5. The industries and regions with the highest average concentrations for Cu, Zn, Pb, Cd, Cr, Ni, Hg, and As are as follows: SIZ (33.95 mg·kg−1), PMZ (105.80 mg·kg−1), SIZ (25.50 mg·kg−1), PMZ (0.65 mg·kg−1), WDZ (99.33 mg·kg−1), MZ (47.33 mg·kg−1), SIZ (0.97 mg·kg−1), and SIZ (23.40 mg·kg−1), respectively. Compared to the background values of soil elements in Lanzhou City [18], the average concentrations of Pb in WDZ, PIZ, MSZ, and MZ, along with Cr and Ni in PMZ, are below the background values. However, the average concentrations of other heavy metals are higher, indicating a certain degree of heavy metal accumulation in farmlands around these industries. When compared to the screening values for agricultural land [28], only Cd in PMZ exceeds the limit, suggesting that, overall, heavy metal pollution is not severe, but there are still instances where the concentration of heavy metals in some samples exceeds the standards. A comparison of the average heavy metal concentrations in all agricultural soils with those in European Union (EU) agricultural soils [29,30,31] revealed that all heavy metal concentrations exceeded the EU levels. The average concentrations of Cu, Zn, Pb, Cd, Cr, Ni, Hg, and As were 1.99, 2.05, 1.33, 2.44, 3.79, 2.15, 8.00, and 2.87 times higher than the corresponding EU averages, respectively, while all metals except Pb exceed China’s farmland average concentrations [32]. This crisis stems from a tripartite convergence of industrial structural imbalance, lagging environmental governance, and ecological fragility: traditional heavy industries relying on pollution-intensive processes drive heavy metals-specific enrichment, the poor self-purification capacity of arid soils amplifies accumulation, and substandard wastewater treatment rates exacerbate exposure risks.
Generally, regions sharing the same geological background under natural conditions exhibit minimal variations in the soil heavy metal content. However, human activities like mining and agricultural production significantly alter elemental concentrations. Consequently, the mean values here inadequately represent individual sample characteristics, serving instead as relative indicators against background values to characterize Lanzhou’s agricultural soils. The coefficient of variation (CV) effectively eliminates the mean value distortions, providing a robust measure of heavy metal dispersion patterns [33]. The CV serves to assess the variability and spatial uniformity of heavy metals in soil. Variability can be categorized as weak (0–15%), moderate (15–35%), and high (>35%) based on CV values, with a higher CV indicating a less uniform distribution and greater influence from human activities [27]. As shown in Table 6, the WDZ exhibits high variability for Cd and Hg, while other metals show moderate variability. In the PMZ, Hg is highly variable, and Cd, Ni, and As are weakly variable; other metals are moderately variable. The CMZ has high variability for Cr and Hg, with others being moderately variable. The PIZ displays moderate variability for Cu, Pb, and Cd, with the rest being highly variable. In the MSZ, Cd, Hg, and As are highly variable, and others are moderately variable. The MZ has high variability for Cd and Hg; moderate for Pb, Cr, and As, and weak for Cu, Zn, and Ni. For the SIZ, Pb and Cr are highly variable, Cd and Hg are moderately variable, and the rest are weakly variable. Generally, Cd, Cr, Hg, and As demonstrate high variability in the study area, with Hg’s CV reaching 97.09%, indicating significant spatial differences and substantial human impact. Cu, Zn, Pb, and Ni exhibit moderate variability, suggesting they also show spatial differentiation potentially influenced by human activities [34]. In view of this, we recommend intensifying monitoring in high CV areas and establishing a remediation priority classification system (e.g., Priority Level I and Level II Control Zones) based on both the magnitude of CV values and the extent of exceedance standards. Concurrently, human-induced disturbance points should be identified via CV analysis to implement targeted remediation at these specific sites.

3.2. Pollution Assessment

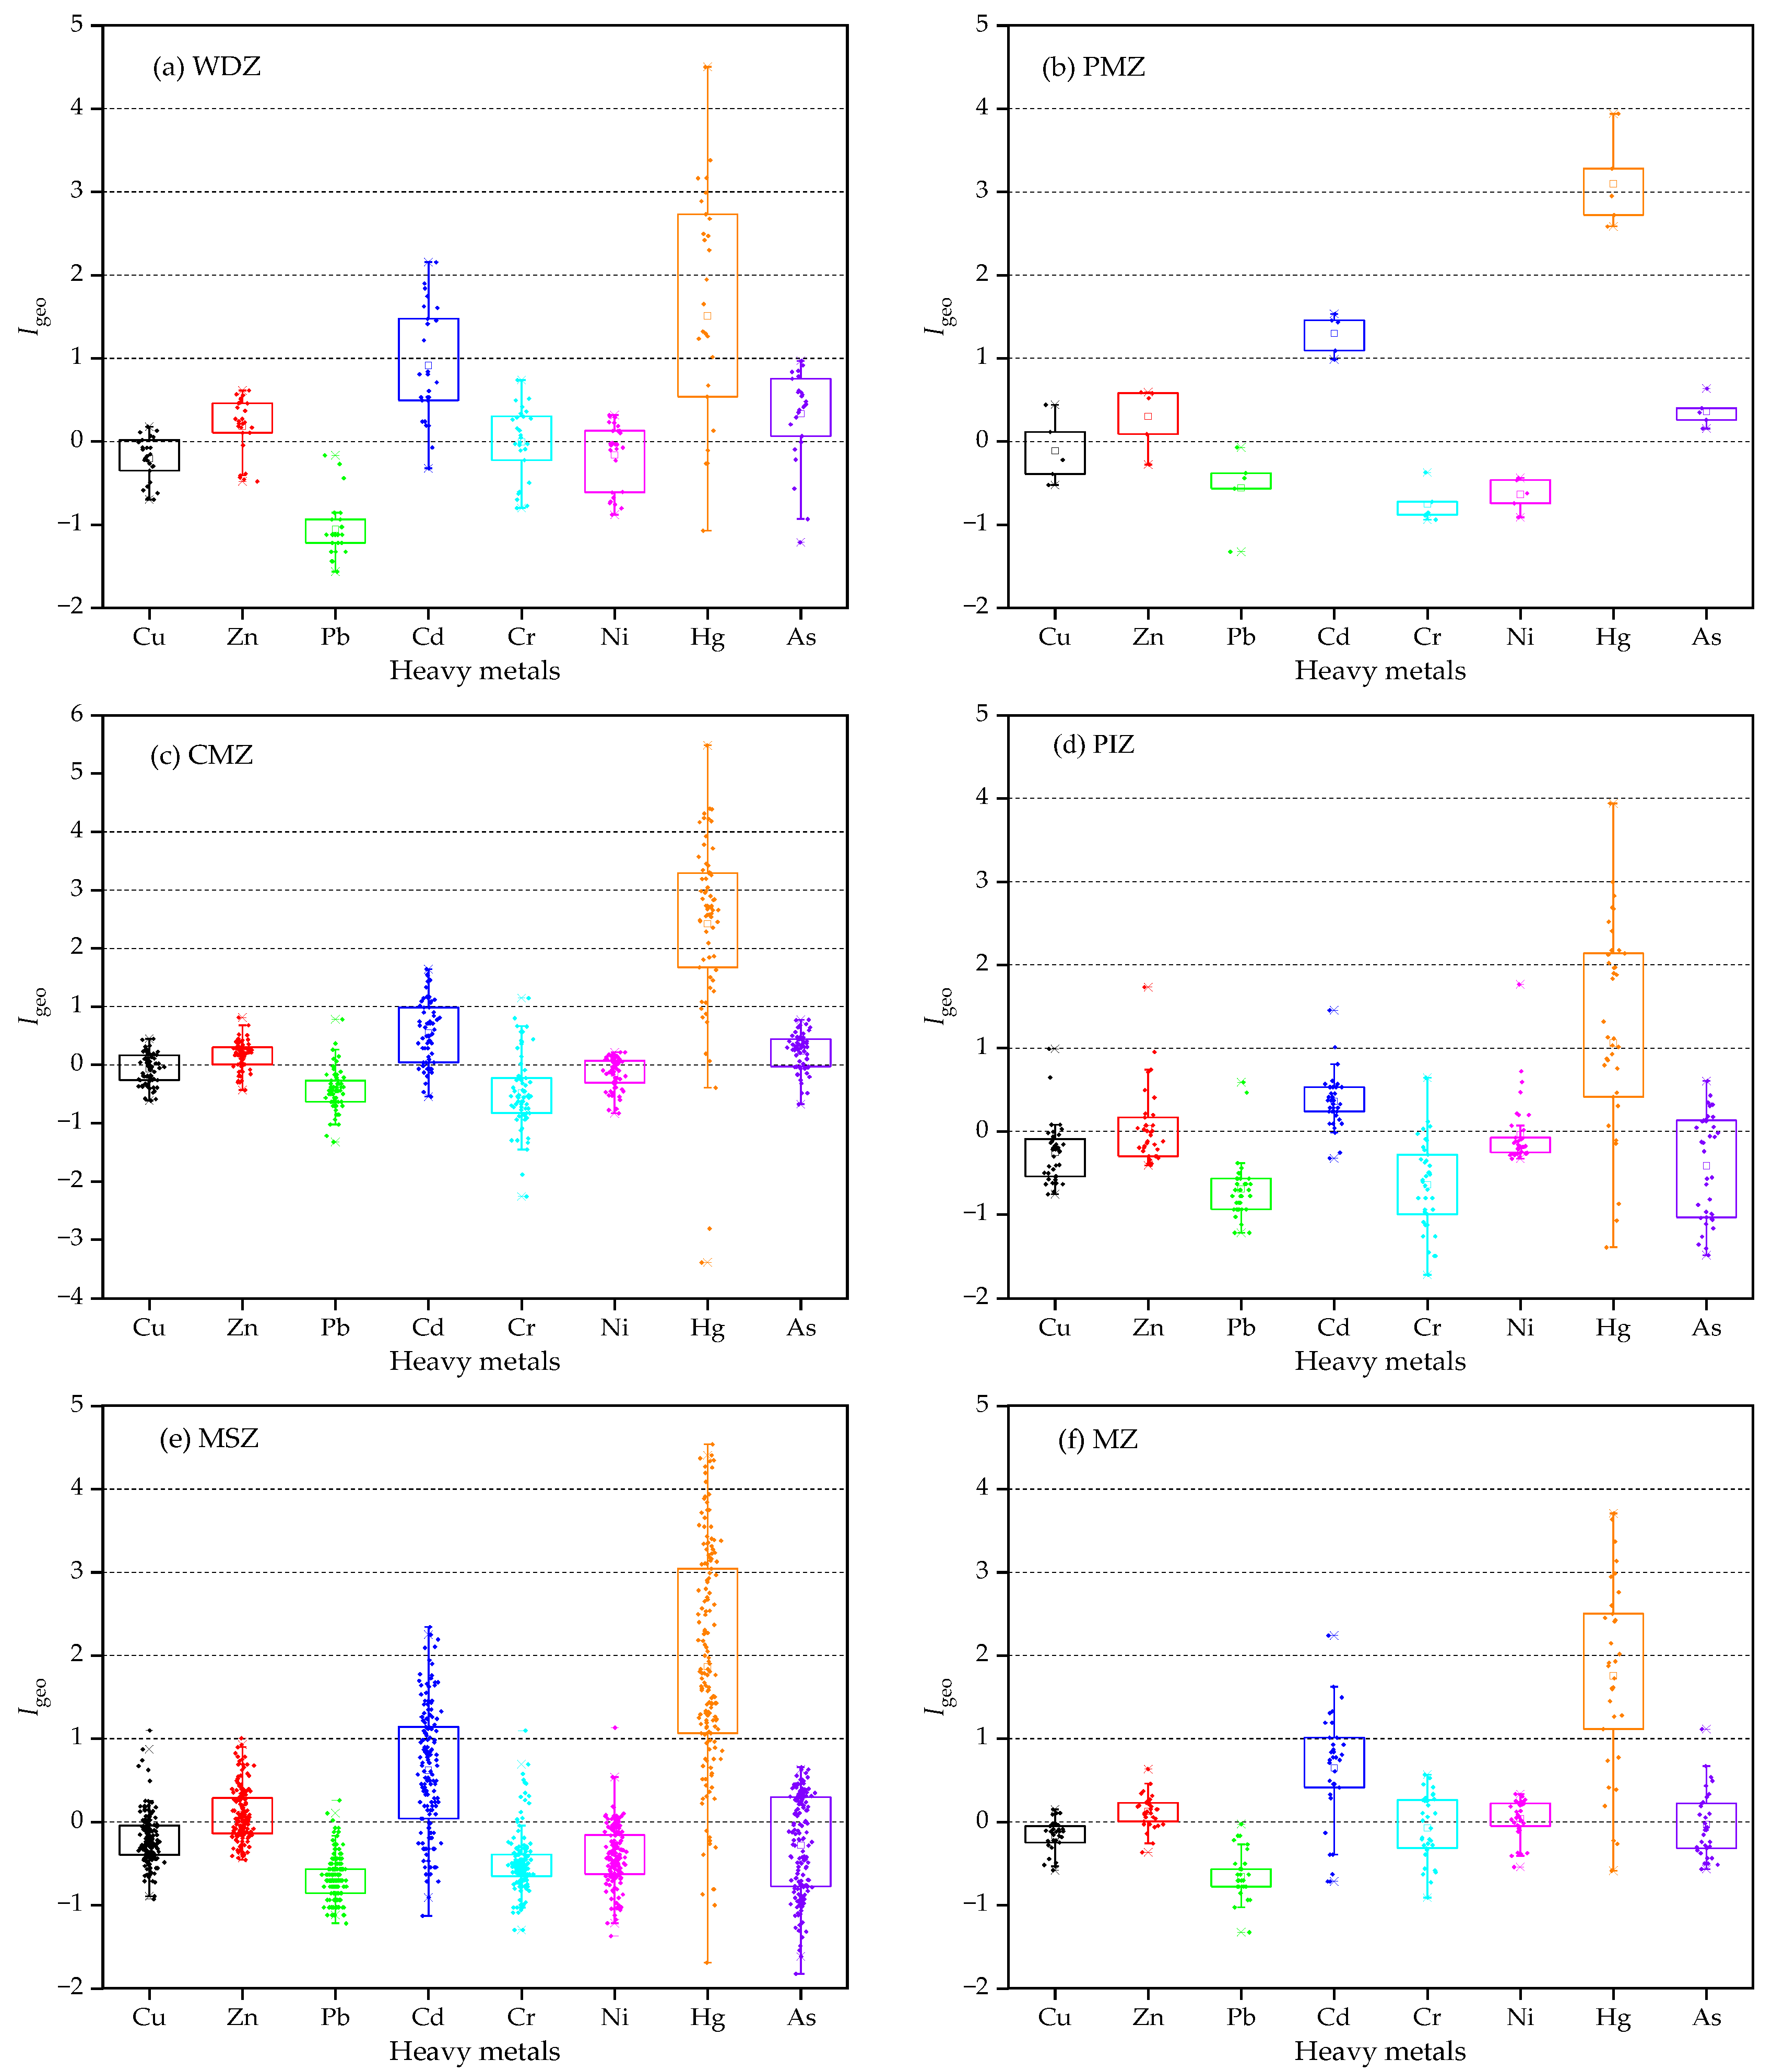
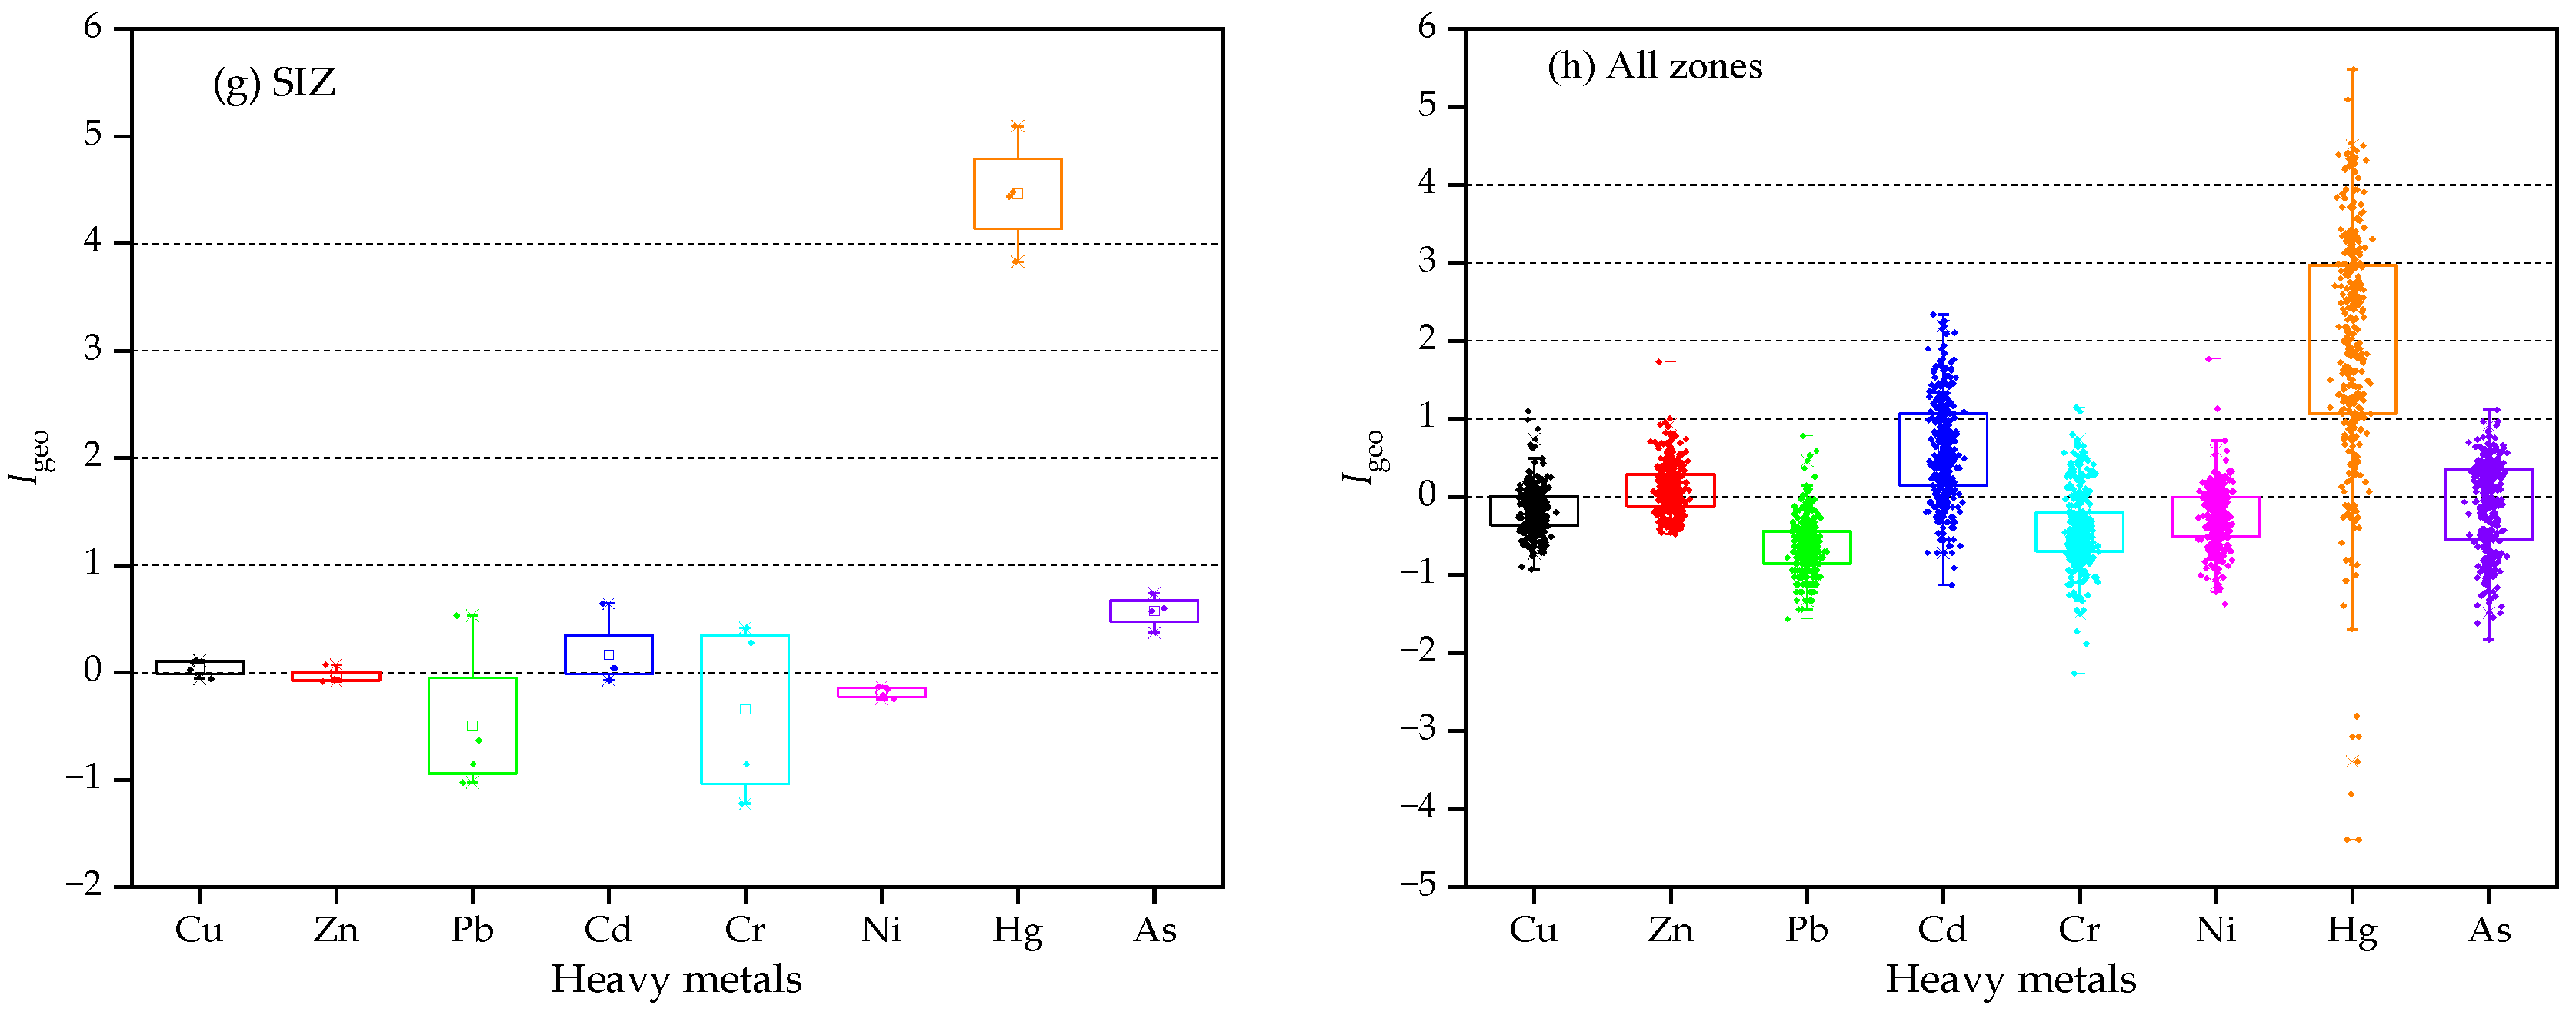
3.2.1. Evaluation of Igeo

The Igeo for heavy metals in farmland soils around different industries is illustrated in Figure 2. On average, Cu shows slight accumulation only in the SIZ, with no accumulation elsewhere; Zn accumulates slightly in all regions except for the PIZ and SIZ; Pb does not accumulate in any region; Cd accumulates in all the areas, with severe accumulation in farmlands near the PMZ and slight accumulation elsewhere; Cr accumulates slightly only in the WDZ, with no accumulation in other regions; Ni accumulates slightly only around the MZ; Hg accumulates in all the regions, with critical accumulation in the SIZ, severe accumulation in the PMZ, bordering on severe accumulation in the CMZ, and moderate accumulation elsewhere; As does not accumulate in the PIZ, MSZ, and MZ but shows slight accumulation in all the other regions.
Generally, Zn, Cd, and Hg exhibit higher accumulation levels, with their Igeo average values in descending order: Hg (1.89) > Cd (0.61) > Zn (0.11). Hg is moderately accumulated, while Cd and Zn are lightly accumulated. The other heavy metals remain largely in a non-accumulation state. Cai et al. compared heavy metal concentrations in Yuzhong County, Lanzhou City, with those in other countries and regions, revealing notably higher levels of Hg, Cd, and Zn in Yuzhong County compared to selected reference areas—a finding fully aligned with the results of this study [35]. Chen et al. also reported significant accumulation of Cd, Pb, and Zn in agricultural soils, with particularly severe Hg accumulation [36]. Furthermore, 46.5% of the sampling sites showed at least moderate accumulation levels, further confirming the accumulation phenomenon of Hg, Cd, and Zn in farmland soils.

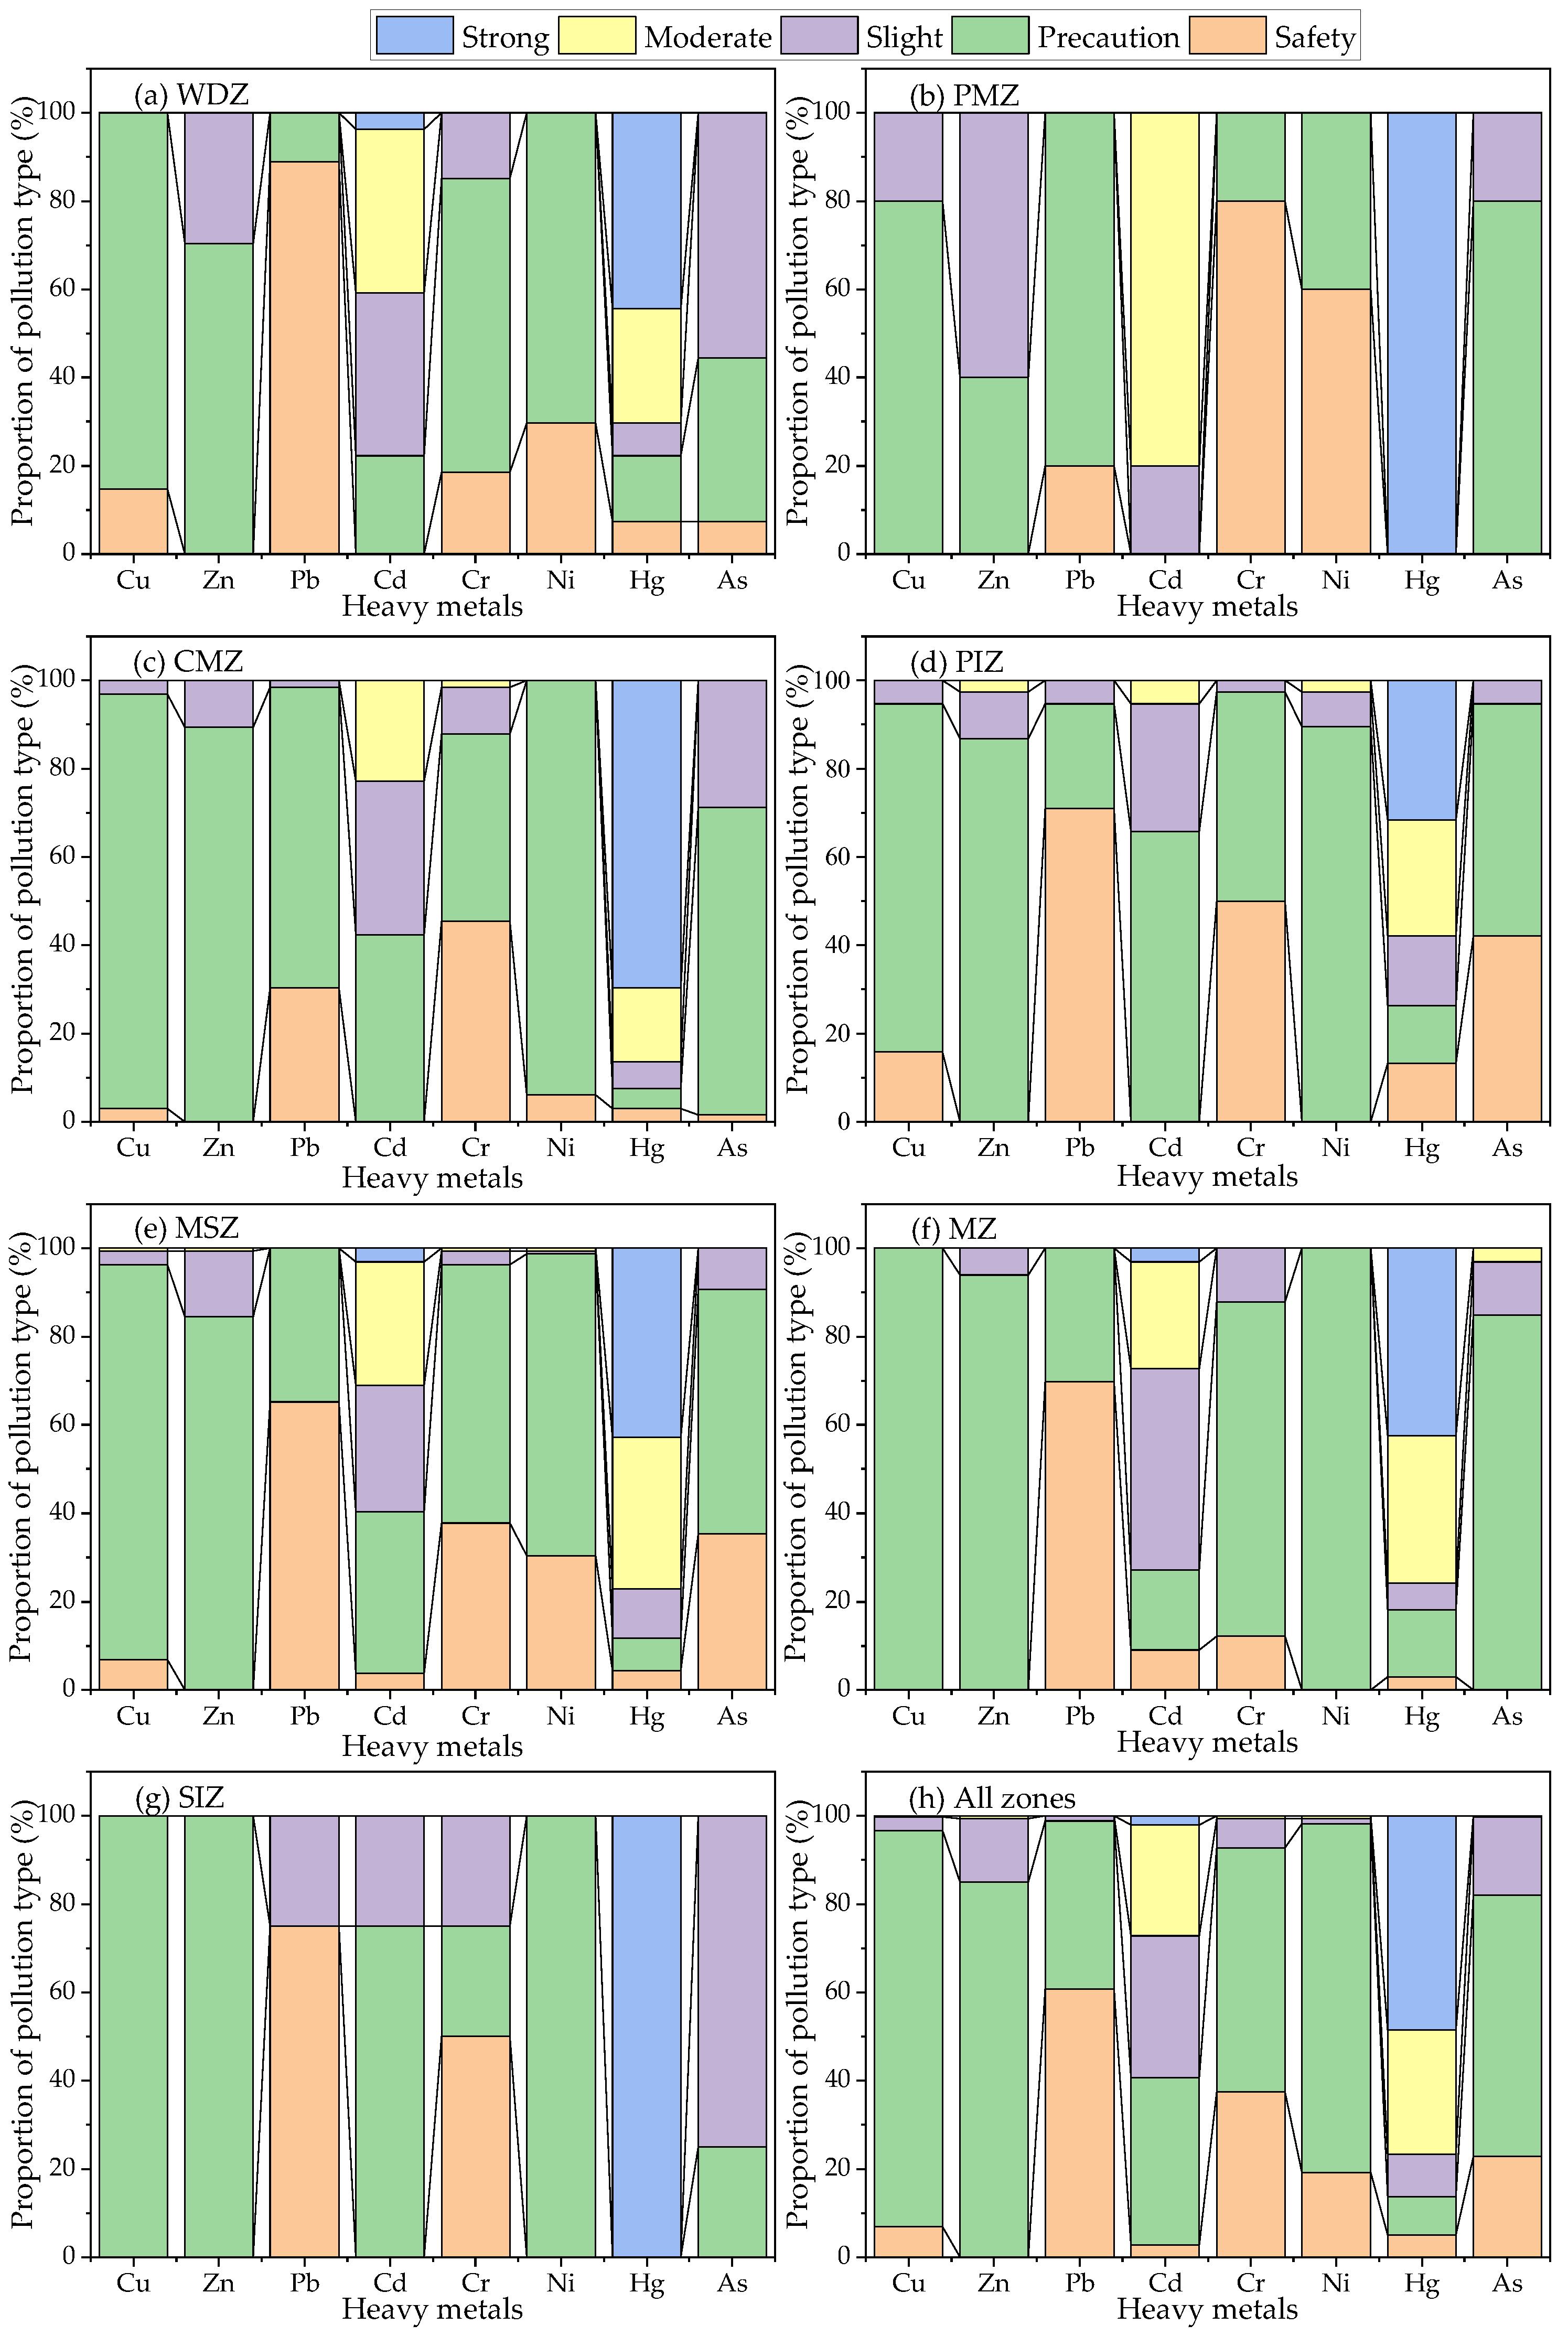
3.2.2. Evaluation of Pi

The evaluation of Pi for heavy metals in farmland soils around different industries is shown in Figure 3. Heavy metal pollution exists to varying degrees across all industries, with the following proportions of elements exhibiting moderate or higher pollution levels. WDZ: Cd (40.74%) and Hg (70.37%); PMZ: Cd (80%) and Hg (100%); CMZ: Cd (22.73%), Cr (1.52%), and Hg (86.37%); PIZ: Zn (2.63%), Cd (5.26%), Ni (2.63%), and Hg (57.90%); MSZ: Cu (0.62%), Zn (0.62%), Cd (31.06%), Cr (0.62%), Ni (0.62%), and Hg (77.02%); MZ: Cd (27.24%), Hg (75.75%), and As (3.03%); and SIZ: Hg (100%).
Analysis of moderate or higher pollution data reveals that the MSZ may contribute to a wider variety of heavy metal contaminants, though the pollution intensity is relatively low. Jiang et al. reviewed studies published between 2000 and 2019 to assess heavy metals contamination in soils around China’s non-ferrous metal smelters, revealing average concentrations of Cd (19.8 mg/kg), Cu (265 mg/kg), and Zn (1371 mg/kg) that systematically exceeded the local background levels, confirming the diversity of heavy metal pollution types in smelter-adjacent soils [37].
Notably, Cd and Hg show consistently high pollution levels across all regions: Hg exhibits severe pollution in all the zones, with contamination proportions of 44.44% (WDZ), 100% (PMZ), 69.70% (CMZ), 31.58% (PIZ), 42.86% (MSZ), 42.42% (MZ), and 100% (SIZ). Cd displays severe pollution in the WDZ (3.70%), MSZ (3.11%), and MZ (3.03%). Overall, all heavy metals except Pb show moderate or higher pollution levels. Cd and Hg are particularly problematic, with widespread severe pollution.

3.2.3. Evaluation of PN

The evaluation of PN, as presented in Table 6, reveals that all the areas have experienced varying degrees of heavy metal contamination. The proportions of regions with moderate-to-strong pollution are as follows: SIZ (100%) = PMZ (100%) > CMZ (95.45%) > MZ (93.94%) > WDZ (92.59%) > MSZ (88.2%) > PIZ (73.69%). Specifically, every sample in both the SIZ and PMZ shows strong pollution, with the former likely due to long-term irrigation with heavy metal-laden wastewater, leading to soil degradation [38], and the latter associated with residuals from pharmaceutical production, such as mercury-containing catalysts [39]. In summary, the agricultural soil surrounding enterprises in Lanzhou City suffers from substantial heavy metal pollution, with the distribution of pollution levels being heavily skewed towards strong pollution (67.37%), followed by moderate pollution (21.86%) and slight pollution (10.78%). In response to the issue of heavy metal pollution, we propose employing physical, chemical, and biological remediation techniques to restore contaminated soils and establishing or reinforcing regulations to restrict the use of highly polluted water for irrigation, promoting the utilization of reclaimed water, and enforcing rigorous monitoring and management in sewage-irrigated areas, as well as advocating for the cultivation of crops that absorb less heavy metals or effectively sequester and immobilize these elements.

3.3. Potential Ecological Risk Assessment

The single-factor potential ecological risk assessment for heavy metals is illustrated in Figure 4. Cu, Zn, Pb, Cr, Ni, and As all pose slight risks across the regions. While Cd does not exhibit critical risks in any area, it shows the following patterns: a strong risk level exclusively in the PMZ, a moderate risk level in the SIZ, and mixed risk levels (slight to severe) in other regions. Hg demonstrates high ecological risks, with the samples showing critical risks in all regions. Notably, 100% of the samples in the PMZ and SIZ fall under critical Hg risk, and this aligns with the earlier pollution evaluation results, confirming high Hg contamination in these zones.
In summary, the farmland soils surrounding enterprises in Lanzhou City are primarily subject to ecological risks from Hg and Cd. The distribution of risk levels for Hg is as follows: critical risk (41.32%) > strong risk (23.05%) > severe risk (22.75%) > moderate risk (8.08%) > slight risk (4.79%). For Cd, the risk levels are distributed as moderate risk (52.10%) > strong risk (32.63%) > slight risk (11.98%) > severe risk (3.29%). This hierarchical structure highlights Hg as the predominant ecological threat, followed by Cd, with spatial patterns closely tied to industrial activities and wastewater management practices.
Regarding the comprehensive potential ecological risk of heavy metals (Table 7), apart from the PIZ and MSZ, where some samples show a slight risk, all other areas face moderate-to-severe risks. Notably, every sample in the PMZ and SIZ is at a severe risk level, primarily due to the accumulation of Hg and Cd. The overall ecological risk levels for heavy metals in farmlands surrounding enterprises in Lanzhou City are severe risk (39.82%) > strong risk (35.93%) > moderate risk (21.56%) > slight risk (2.69%).

3.4. Health Risk Assessment

The health risks posed by individual heavy metals and different exposure pathways to adults and children are detailed in Table 8 and Table 9. The patterns of non-carcinogenic and carcinogenic risks from heavy metals in agricultural soils across districts are consistent. For exposure pathways, oral ingestion presents the highest risk for both carcinogenic and non-carcinogenic outcomes, with the hierarchy of health risks being oral ingestion > dermal absorption > inhalation. Numerous studies have demonstrated that, among the three exposure pathways, humans are more significantly affected by heavy metals through ingestion, while inhalation exhibits the least impact [40,41], which aligns with the findings of this investigation.
For non-carcinogenic risks, the metals are ranked as follows: As > Cr > Pb > Hg > Ni > Cu > Zn > Cd. However, across all three exposure pathways, the HQ values for non-carcinogenic exposure to individual heavy metals in soils near enterprises are below 1 for both adults and children, indicating no significant non-carcinogenic health risks from these soils in Lanzhou.
Regarding carcinogenic risks, Cu, Zn, and Hg are excluded due to lacking slope factors. The remaining metals rank as Ni > Cr > As > Pb > Cd. Ni, Cr, and As show CR values between 10−6 and 10−4, suggesting acceptable carcinogenic risks. Pb and Cd exhibit CR values below 10−6, indicating negligible carcinogenic potential. Notably, while Hg and Cd show elevated pollution and ecological risks, their lower health risks stem from higher RfD and smaller SF. This suggests that the current health risk assessment model may underestimate the neurotoxic effects of Hg and Cd, and it is necessary to improve the assessment system with morphological analysis (such as the proportion of methylmercury).
Additionally, carcinogenic risks arise from dermal contact and oral ingestion. Children’s oral exposure shows CR values exceeding 10−4, indicating significant carcinogenic risk, while dermal contact and adult oral ingestion remain within acceptable limits. Overall, children face higher health risks than adults, consistent with the findings by Pan et al. [42]. This disparity arises from children’s hand-to-mouth behaviors and higher respiratory rates, increasing their vulnerability to soil pollutants [43]. Therefore, it is essential to maintain the cleanliness of children’s hands and mouths and correct unhealthy habits such as thumb-sucking [44]. We propose preventive measures against the risks faced by children in two ways: adjusting crop cultivation and intervening in dietary behaviors. For instance, establishing a 500-m buffer zone around industrial areas is recommended to modify crop patterns, restricting the cultivation of high-accumulating crops like potatoes and carrots, which are root vegetables, and instead planting non-edible crops such as castor or cotton to hinder the transfer of heavy metals through the food chain. The adoption of drip irrigation over flood irrigation is encouraged to decrease the uptake of heavy metals in leafy vegetables. Parents are advised to thoroughly wash the skin of fruits and vegetables to remove settled dust and peel root vegetables to further reduce exposure.
The regional rankings for non-carcinogenic risks in the soils are SIZ > WDZ > CMZ > PMZ > MZ > MSZ > PIZ. For carcinogenic risks, the order is WDZ > MZ > SIZ > CMZ > PIZ > MSZ > PMZ. These rankings reveal that the SIZ and WDZ pose relatively higher health risks. The elevated risk in the SIZ primarily stems from historically accumulated pollution, particularly from decades of untreated industrial wastewater irrigation. In contrast, the WDZ exhibits a compounding effect where emerging contaminants (e.g., microplastics and pharmaceutical residues) interact synergistically with traditional heavy metals [45], amplifying their toxicological impacts through mechanisms like enhanced metal bioavailability and altered soil redox conditions.

4. Conclusions

This study systematically evaluates the contamination characteristics, ecological risks, and health effects of heavy metals in agricultural soils near various industries in Lanzhou City, revealing the impacts of industrial activities on soil environmental quality and associated potential risks. Key findings include (1) farmland soils primarily exhibited Hg and Cd contamination, particularly Hg, which showed moderate-to-critical accumulation across all industrial zones. The SIZ and PMZ emerged as contamination hotspots, with 100% of the samples reaching strong pollution levels; (2) Hg posed the most critical ecological risk, with 41.32% of the samples demonstrating critical risk levels, particularly in the SIZ and PMZ. Cd did not exhibit a critical risk, but a substantial 32.63% of the samples showed a strong risk; (3) while the non-carcinogenic (HQ < 1) and carcinogenic risks (CR < 10−4) remained generally acceptable, the oral exposure carcinogenic risk for children (CR = 1.33 × 10⁻⁴) exceeded safety thresholds. Notably, the elevated Hg and Cd concentrations did not proportionally translate into corresponding health risks due to differential toxicological parameters (RfD and SF), emphasizing the necessity to integrate both concentration and toxicity in risk assessments. This study did not analyze the pollution sources and relative contributions of heavy metals. We will address this component in subsequent research. Additionally, we propose establishing a dual-approach early warning system integrating IoT sensors and bioindicators to effectively identify and mitigate high-risk contaminated zones. Furthermore, the current health risk assessment models may underestimate the neurotoxic effects of Hg and Cd. Establishing a neurotoxicity equivalent (NEQ) correction model based on heavy metal speciation analysis represents a promising direction for future studies.

Supplementary Materials

The following supporting information can be downloaded at https://www.mdpi.com/article/10.3390/su17125343/s1: Table S1: Original data of heavy metals in farmland soil of the WDZ (mg·kg−1); Table S2: Original data of heavy metals in farmland soil of the CMZ; Table S3: Original data of heavy metals in farmland soil of the WDZ; Table S4: Original data of heavy metals in farmland soil of the PIZ; Table S5: Original data of heavy metals in farmland soil of the SIZ; Table S6: Original data of heavy metals in farmland soil of the MSZ; Table S7: Original data of heavy metals in farmland soil of the MZ.

Author Contributions

Conceptualization, K.D. and Y.L. (Yingquan Li); methodology, K.D.; software, K.D. and W.Y.; validation, Y.L. (Yingquan Li); formal analysis, K.D.; investigation, Y.L. (Yuda Lin) and L.R.; resources, K.D.; data curation, L.R. and C.H.; writing—original draft preparation, K.D.; writing—review and editing, K.D. and Y.L. (Yingquan Li); visualization, K.D. and W.Y.; supervision, K.D.; project administration, K.D.; funding acquisition, K.D. All authors have read and agreed to the published version of the manuscript.

Funding

This research was funded by Gansu Province Youth Science and Technology Fund (24JRRA272), Lanzhou Jiaotong University Youth Scientists Fund (2023028), and Tianjin University-Lanzhou Jiaotong University Joint Research Fund (LH2024010).

Institutional Review Board Statement

Not applicable.

Informed Consent Statement

Not applicable.

Data Availability Statement

Data are contained within the article and Supplementary Materials.

Conflicts of Interest

The authors declare no conflicts of interest.

Abbreviations

The following abbreviations are used in this manuscript:
WDZWaste disposal zone
PMZPharmaceutical manufacturing zone
CMZChemical manufacturing zone
PIZPetrochemical industry zone
MSZMetal smelting zone
MZMining zone
SIZSewage-irrigated zone
IgeoGeo-accumulation index
PNNemerow composite pollution index
PiSingle-factor pollution index
RIPotential ecological risk index
HINon-carcinogenic health risk index
CRCarcinogenic health risk index
ADIAverage daily intake
INGOral ingestion
DERDermal absorption
INHInhalation
IRingOral intake rate
IRinhRespiratory intake rate
ABSdSkin respiratory coefficient
SASkin exposure area
AFSkin adhesion coefficient
PEFSoil dust diffusion factor
EDExposure time
EFExposure frequency
CFConversion factor
BWAverage body weight
ATAverage exposure time

References

  1. Asaiduli, H.; Abliz, A.; Abulizi, A.; Sun, X.; Ye, P. Assessment of soil heavy metal pollution and health risks in different functional areas on the northern slope of the eastern Tianshan mountains in Xinjiang, NW China. Int. J. Environ. Res. Public Health 2023, 20, 4843. [Google Scholar] [CrossRef] [PubMed]
  2. Shi, H.; Wang, S.; Xu, X.; Huang, L.; Gu, Q. Spatial distribution and risk assessment of heavy metal pollution from enterprises in China. J. Hazard. Mater. 2024, 480, 136147. [Google Scholar] [CrossRef] [PubMed]
  3. Khan, S.; Naushad, M.; Lima, E.C.; Zhang, S.; Shaheen, S.M.; Rinklebe, J. Global soil pollution by toxic elements: Current status and future perspectives on the risk assessment and remediation strategies-A review. J. Hazard. Mater. 2021, 417, 126039. [Google Scholar] [CrossRef]
  4. Jahandari, A.; Abbasnejad, B. Environmental pollution status and health risk assessment of selective heavy metal(oid)s in Iran’s agricultural soils: A review. J. Geochem. Explor. 2024, 256, 107330. [Google Scholar] [CrossRef]
  5. Shi, J.; Zhao, D.; Ren, F.; Huang, L. Spatiotemporal variation of soil heavy metals in China: The pollution status and risk assessment. Sci. Total Environ. 2023, 871, 161768. [Google Scholar] [CrossRef]
  6. Han, Y.; Zhang, S.; Kang, D.; Hao, N.; Peng, J.; Zhou, Y.; Liu, K.; Chen, Y. A decade review of human health risks from heavy metal contamination in industrial sites. Water Air Soil Poll. 2025, 236, 144. [Google Scholar] [CrossRef]
  7. Zhu, Y.; Hou, K.; Liu, J.; Zhang, L.; Yang, K.; Li, Y.; Yuan, B.; Li, R.; Xue, Y.; Li, H.; et al. Multimodel-based quan-titative source apportionment and risk assessment of soil heavy metals: A reliable method to achieve regional pollution traceability and management. Sci. Total Environ. 2024, 956, 177368. [Google Scholar] [CrossRef]
  8. Yang, S.; Zhou, Q.; Sun, L.; Qin, Q.; Sun, Y.; Wang, J.; Liu, X.; Xue, Y. Source to risk receptor transport and spatial hotspots of heavy metals pollution in peri-urban agricultural soils of the largest megacity in China. J. Hazard. Mater. 2024, 480, 135877. [Google Scholar] [CrossRef]
  9. Shen, C.; Huang, S.; Wang, M.; Wu, J.; Su, J.; Lin, K.; Chen, X.; He, T.; Li, Y.; Sha, C.; et al. Source-oriented health risk assessment and priority control factor analysis of heavy metals in urban soil of Shanghai. J. Hazard. Mater. 2024, 480, 135859. [Google Scholar] [CrossRef]
  10. Jiang, Z.J.; Yang, S.Z.; Luo, S. Source analysis and health risk assessment of heavy metals in agricultural land of multi-mineral mining and smelting area in the Karst region—A case study of Jichangpo Town, Southwest China. Heliyon 2023, 9, e17246. [Google Scholar] [CrossRef]
  11. Sun, W.; Ye, J.; Lin, H.; Yu, Q.; Wang, Q.; Chen, Z.; Ma, J. Dynamic characteristics of heavy metal accumulation in agricultural soils after continuous organic fertilizer application: Field-scale monitoring. Chemosphere 2023, 335, 139051. [Google Scholar] [CrossRef] [PubMed]
  12. Zeng, J.Q.; Ke, W.S.; Deng, M.; Tan, J.; Li, C.; Cheng, Y.; Xue, S. A practical method for identifying key factors in the distribution and formation of heavy metal pollution at a smelting site. J. Environ. Sci. 2023, 127, 552–563. [Google Scholar] [CrossRef] [PubMed]
  13. MEE. Investigation Plan for Soil Pollution Around Typical Industrial Enterprises and Their Surroundings; Ministry of Ecology and Environment of the People’s Republic of China: Beijing, China, 2021.
  14. HJ 491-2019; Soil and Sediment—Determination of Copper, Zinc, Lead, Nickel and Chromium—Flame Atomic Absorption Spectrophotometry. China Environment Publishing Group: Beijing, China, 2019.
  15. GB/T 17141-1997; Soil Quality-Determination of Lead, Cadmium-Graphite Furnace Atomic Absorption Spectrophotometry. China National Environmental Monitoring Centre: Beijing, China, 1997.
  16. HJ 680-2013; Soil and Sedimen — Determination of Mercury, Arsenic, Selenium, Bismuth, Antimony — Microwave Dissolution/Atomic Fluorescence Spectrometry. China Environmental Science Press: Beijing, China, 2013.
  17. Sun, J.; Zhao, M.; Cai, B.; Song, X.; Tang, R.; Huang, X.; Huang, H.; Huang, J.; Fan, Z. Risk assessment and driving factors of trace metal(loid)s in soils of China. Environ. Pollut. 2022, 309, 119772. [Google Scholar] [CrossRef] [PubMed]
  18. Li, J.; Li, K.M.; Wang, X.H.; Jiao, L.; Zang, F.; Mao, X.X.; Yang, Y.Q.; Tai, X.S. Pollution characteristics and risk assessment of heavy metals in surface dusts and surrounding green land soils from Yellow River custom tourist line in Lanzhou. Environ. Sci. 2023, 44, 3475–3487. [Google Scholar] [CrossRef]
  19. Jiang, Y.; Hu, B.; Shi, H.; Yi, L.; Chen, S.; Zhou, Y.; Cheng, J.; Huang, M.; Yu, W.; Shi, Z. Pollution and risk assessment of potentially toxic elements in soils from industrial and mining sites across China. J. Environ. Manag. 2023, 336, 117672. [Google Scholar] [CrossRef]
  20. Zhu, X.; Cao, L.; Liang, Y. Spatial distribution and risk assessment of heavy metals inside and outside a typical lead-zinc mine in southeastern China. Environ. Sci. Pollut. Res. 2019, 26, 26265–26275. [Google Scholar] [CrossRef]
  21. Nemerow, N.L. Stream, Lake, Estuary, and Ocean Pollution, 2nd ed.; Van Nostrand Reinhold Publishing Co.: New York, NY, USA, 1991. [Google Scholar] [CrossRef]
  22. Mai, X.; Tang, J.; Tang, J.; Zhu, X.; Yang, Z.; Liu, X.; Zhuang, X.; Feng, G.; Tang, L. Research progress on the environmental risk assessment and remediation technologies of heavy metal pollution in agricultural soil. J. Environ. Sci. 2025, 149, 1–20. [Google Scholar] [CrossRef]
  23. Hakanson, L. An ecological risk index for aquatic pollution control. A sedimentological approach. Water Res. 1980, 14, 975–1001. [Google Scholar] [CrossRef]
  24. Duan, K.; Zhao, B.; Zhang, S.; Li, Y.; Ma, Y.; Liu, H.; Ejaz, M.; Peng, X.; Yang, P. Toxic metals and metalloids in farmland soil and cereals in an industrial-agricultural interaction region of China: Contamination, sources and risks. Environ. Eng. Manag. J. 2022, 21, 1493–1504. [Google Scholar] [CrossRef]
  25. USEPA. Exposure Factors Handbook 2011 Edition (Final); EPA/600/R-09/052F; U.S. Environmental Protection Agency: Washington, DC, USA, 2011.
  26. Huang, Y.; Teng, Y.; Zhang, N.; Fu, Z.; Ren, W. Human health risk assessment of heavy metals in the soil-Panax notoginseng system in Yunnan province, China. Hum. Ecol. Risk Assess. 2018, 24, 1312–1316. [Google Scholar] [CrossRef]
  27. Luo, H.; Wang, Q.; Guan, Q.; Ma, Y.; Ni, F.; Yang, E.; Zhang, J. Heavy metal pollution levels, source apportionment and risk assessment in dust storms in key cities in Northwest China. J. Hazard. Mater. 2022, 422, 126878. [Google Scholar] [CrossRef] [PubMed]
  28. MEE. Soil Environment Quality–Risk Contor Standard for Soil Contamination of Agricultural Land; Ministry of Ecology and Environment of the People’s Republic of China: Beijing, China, 2018.
  29. Siddig, M.M.S.; Asabere, S.B.; Al-Farraj, A.S.; Brevik, E.C.; Sauer, D. Pollution and ecological risk assessment of heavy metals in anthropogenically-affected soils of Sudan: A systematic review and meta-analysis. J. Hazard. Mater. Adv. 2025, 17, 100601. [Google Scholar] [CrossRef]
  30. Reimann, C.; Fabian, K.; Birke, M.; Filzmoser, P.; Demetriades, A.; Négrel, P.; Oorts, K.; Matschullat, J.; de Caritat, P.; The GEMAS Project Team. GEMAS: Establishing geochemical background and threshold for 53 chemical elements in European agricultural soil. Appl. Geochem. 2018, 88, 302–318. [Google Scholar] [CrossRef]
  31. Tóth, G.; Hermann, T.; Da Silva, M.R.; Montanarella, L.J.E.I. Heavy metals in agricultural soils of the European Union with implications for food safety. Environ. Int. 2016, 88, 299–309. [Google Scholar] [CrossRef]
  32. Yuan, X.; Xue, N.; Han, Z. A meta-analysis of heavy metals pollution in farmland and urban soils in China over the past 20 years. J. Environ. Sci. 2021, 101, 217–226. [Google Scholar] [CrossRef]
  33. Zhang, J.; Peng, W.; Lin, M.; Liu, C.; Chen, S.; Wang, X.; Gui, H. Environmental geochemical baseline determination and pollution assessment of heavy metals in farmland soil of typical coal-based cities: A case study of Suzhou City in Anhui Province, China. Heliyon 2023, 9, e14841. [Google Scholar] [CrossRef] [PubMed]
  34. Qin, Y.; Zhang, F.; Xue, S.; Ma, T.; Yu, L. Heavy metal pollution and source contributions in agricultural soils developed from karst landform in the southwestern region of China. Toxics 2022, 10, 568. [Google Scholar] [CrossRef]
  35. Cai, L.; Wang, Y.; Wang, X.; Ma, L.; Cheng, Z.; Su, L. Pollution characteristics, spatial distributions, and source apportionment of heavy metals in cultivated soil in Lanzhou, China. Ecol. Indic. 2021, 125, 107507. [Google Scholar] [CrossRef]
  36. Chen, Y.J.; Qu, X.C.; Zhang, B.; Li, X.T.; Zhu, G.P.; Cha, T.G. Ecological and health risk assessment of heavy metal pollution in farmland soil of Xianghe County. Environ. Sci. 2022, 43, 5728–5741. [Google Scholar] [CrossRef]
  37. Jiang, Z.; Guo, Z.; Peng, C.; Liu, X.; Zhou, Z.; Xiao, X. Heavy metals in soils around non-ferrous smelteries in China: Status, health risks and control measures. Environ. Pollut. 2021, 282, 117038. [Google Scholar] [CrossRef]
  38. Meng, W.; Wang, Z.; Hu, B.; Wang, Z.; Li, H.; Goodman, R.C. Heavy metals in soil and plants after long-term sewage irrigation at Tianjin China: A case study assessment. Agric. Water Manag. 2016, 171, 153–161. [Google Scholar] [CrossRef]
  39. Wang, S.; Ma, Z.; Yue, G.; Wu, H.; Wang, P.; Zhu, L.; Liang, C.; Xie, C.; Wang, S.; Jiao, W.; et al. Spatial distribution and assessment of the human health risks of heavy metals in a retired pharmaceutical industrial area, southwest China. Bull. Environ. Contam. Toxicol. 2022, 109, 808–816. [Google Scholar] [CrossRef]
  40. Adimalla, N.; Chen, J.; Qian, H. Spatial characteristics of heavy metal contamination and potential human health risk assessment of urban soils: A case study from an urban region of South India. Ecotoxicol. Environ. Saf. 2020, 194, 110406. [Google Scholar] [CrossRef] [PubMed]
  41. Yang, E.; Wang, Q.; Zhang, Z.; Shao, W.; Luo, H.; Xiao, X.; Ni, F.; Mi, J.; Sun, X.; Guan, Q. Source-oriented health risk assessment of heavy metals in a soil-river continuum in northwest China. Int. J. Sediment Res. 2024, 39, 916–928. [Google Scholar] [CrossRef]
  42. Pan, L.; Ma, J.; Hu, Y.; Su, B.; Fang, G.; Wang, Y.; Wang, Z.; Wang, L.; Xiang, B. Assessments of levels, potential ecological risk, and human health risk of heavy metals in the soils from a typical county in Shanxi province, China. Environ. Sci. Pollut. Res. 2016, 23, 19330–19340. [Google Scholar] [CrossRef]
  43. Li, Z.; Ma, Z.; van der Kuijp, T.J.; Yuan, Z.; Huang, L. A review of soil heavy metal pollution from mines in China: Pollution and health risk assessment. Sci. Total Environ. 2014, 468, 843–853. [Google Scholar] [CrossRef] [PubMed]
  44. Lv, J.; Wang, Y. PMF receptor models and sequential Gaussian simulation to determine the quantitative sources and hazardous areas of potentially toxic elements in soils. Geoderma 2019, 351, 347–358. [Google Scholar] [CrossRef]
  45. Kajal, S.; Thakur, S. Coexistence of microplastics and heavy metals in soil: Occurrence, transport, key interactions and effect on plants. Environ. Res. 2024, 262, 119960. [Google Scholar] [CrossRef]
Figure 1. Classification map of the study area based on the type of pollution by heavy metals.
Sustainability 17 05343 g001
Figure 2. Geo-accumulation index of soil heavy metals.
Sustainability 17 05343 g002aSustainability 17 05343 g002b
Figure 3. Evaluation of the single-factor pollution index for soil heavy metals.
Sustainability 17 05343 g003
Figure 4. Evaluation of the single-factor ecological risk of soil heavy metals.
Sustainability 17 05343 g004
Table 1. Pollution classification standards of different heavy metal pollution evaluation methods.
Evaluation MethodologyIgeo
Value rangeIgeo ≤ 00 < Igeo ≤ 11 < Igeo ≤ 22 < Igeo ≤ 33 < Igeo ≤ 4Igeo > 4
Accumulation levelSafetySlightModerateBordering on SevereSevereCritical
Pi
Value rangePi ≤ 11 < Pi ≤ 22 < Pi ≤ 33 < Pi ≤ 6Pi > 6
Pollution levelSafetyPrecautionSlightModerateStrong
PN
Value rangePN ≤ 0.70.7 < PN ≤ 1.01.0 < PN ≤ 2.02.0 < PN ≤ 3.0PN > 3.0
Pollution levelSafetyPrecautionSlightModerateStrong
“–” indicates no relevant data or content, as below.
Table 2. Adjusted potential ecological risk classification criteria.
Risk DegreeSlightModerateStrongSevereCritical
EriEri ≤ 4040 < Eri ≤ 8080 < Eri ≤ 160160 < Eri ≤ 320Eri > 320
RIRI ≤ 110110 < RI ≤ 220220 < RI ≤ 440RI > 440
Table 3. Parameter values for the health risk evaluation model.
ParameterImplicationUnitAdultChild
IRingOral intake ratemg·d−1100200
IRinhRespiratory intake ratem3·d−1157.5
ABSdSkin respiratory coefficientdimensionless0.0010.001
SASkin exposure areacm2·d−150752447
AFSkin adhesion coefficientmg·cm−2·d−10.070.20
PEFSoil dust diffusion factorm3·kg−11.36 × 1091.36 × 109
EDExposure timea246
EFExposure frequencyd·a−1350350
CFConversion factormg·kg−110−610−6
BWAverage body weightkg56.815.9
ATAverage exposure time (carcinogenic)d70 × 36570 × 365
ATAverage exposure time (non-carcinogenic)dED × 365ED × 365
Table 4. RfD and SF values for different exposure routes.
ElementIngestionDermal AbsorptionInhalation
RfDSFRfDSFRfDSF
As3.00 × 10−41.50 × 1001.23 × 10−43.66 × 1003.00 × 10−41.51 × 10
Cd1.00 × 10−33.80 × 10−11.00 × 10−53.80 × 10−11.00 × 10−36.30 × 100
Cr3.00 × 10−35.00 × 10−16.00 × 10−52.00 × 102.86 × 10−54.02 × 10
Pb3.50 × 10−38.50 × 10−35.25 × 10−43.52 × 10−34.20 × 10−2
Hg3.00 × 10−42.10 × 10−58.57 × 10−5
“–” indicates no relevant data or content.
Table 5. Descriptive statistics of soil heavy metal concentrations.
RegionsItemsCuZnPbCdCrNiHgAs
WDZMax/mg·kg−137.20128.0029.001.17160.0056.700.95230.70
Min/mg·kg−120.3060.0011.000.2155.0024.700.0036.77
Mean/mg·kg−128.9497.2616.110.5599.3342.080.2021.00
CV/%16.8220.9925.8646.0826.9024.6897.4130.34
PMZMax/mg·kg−144.70126.0031.000.7674.0033.600.6524.40
Min/mg·kg−122.9069.0013.000.5250.0024.200.2517.50
Mean/mg·kg−131.30105.8023.000.6557.4029.520.3820.28
CV/%25.4321.6125.3514.5915.1711.9737.2711.49
CMZMax/mg·kg−144.90147.0056.000.82212.0052.901.8826.80
Min/mg·kg−121.5062.0013.000.1820.0025.600.0049.82
Mean/mg·kg−131.9194.8924.860.4175.3642.020.3318.92
CV/%17.6816.9026.7837.2147.6217.2088.3720.13
PIZMax/mg·kg−165.40278.0049.000.72150.00155.000.6523.90
Min/mg·kg−119.5063.0014.000.2129.0036.300.0025.60
Mean/mg·kg−128.5190.5020.870.3565.5346.320.1412.88
CV/%29.5842.1632.0924.5636.9842.8387.9140.41
MSZMax/mg·kg−170.50168.0039.001.33205.0099.800.9824.80
Min/mg·kg−117.3061.0014.000.1239.0017.600.0024.43
Mean/mg·kg−129.2991.2320.690.4670.5335.180.2314.00
CV/%24.1724.1819.5052.1430.3626.3691.2438.39
MZMax/mg·kg−136.50130.0032.001.24142.0057.400.5534.00
Min/mg·kg−122.0065.0013.000.1651.0031.300.02810.60
Mean/mg·kg−129.6192.1821.030.4694.5247.330.1915.96
CV/%12.6013.4619.4646.1826.0114.8672.1230.69
SIZMax/mg·kg−135.6088.0047.000.41128.0041.601.4426.20
Min/mg·kg−131.6079.0016.000.2541.0038.400.6020.30
Mean/mg·kg−133.9581.7525.500.3084.5040.050.9723.40
CV/%4.604.4449.1821.3444.943.1630.948.97
All zonesMax/mg·kg−170.50278.0056.001.33212.00155.001.8834.00
Min/mg·kg−117.3060.0011.000.1220.0017.600.0024.43
Mean/mg·kg−129.8192.5621.290.4475.5839.530.2415.81
CV/%22.3324.5526.7048.2637.1629.2997.0936.50
Reference valuesBackground values/mg·kg−121.9255.7321.700.17563.8530.340.02810.46
Risk screening values/mg·kg−11003001700.62501903.425
EU agricultural soils/mg·kg−115.0045.0016.000.1820.0018.360.035.5
China agricultural soils/mg·kg−125.7383.8730.250.1866.8127.670.078.45
“Max”, “Min”, and “Mean” represent the maximum, minimum, and arithmetic mean, respectively.
Table 6. Percentage of heavy metal pollution types based on the PN (%).
RegionsSafetyPrecautionSlightModerateStrong
WDZ0.000.007.4118.5274.07
PMZ0.000.000.000.00100.00
CMZ0.000.004.5515.1580.30
PIZ0.000.0026.3226.3247.37
MSZ0.000.0011.8024.2263.98
MZ0.000.006.0627.2766.67
SIZ0.000.000.000.00100.00
All zones0.000.0010.7821.8667.37
Table 7. Proportions of the comprehensive potential ecological risk levels of heavy metals (%).
RegionsSlightModerateStrongSevere
WDZ0.0018.5244.4437.04
PMZ0.000.000.00100.00
CMZ0.0015.1524.2460.61
PIZ7.8936.8442.1113.16
MSZ3.7322.3637.8936.02
MZ0.0021.2145.4533.33
SIZ0.000.000.00100.00
All zones2.6921.5635.9339.82
Table 8. Non-carcinogenic health risk assessment.
INGDERINHCuZnPbCdCrNiHgAsTotal
WDZAdult6.68 × 10−24.03 × 10−37.48 × 10−41.24 × 10−35.57 × 10−42.73 × 10−34.31 × 10−42.32 × 10−21.32 × 10−31.17 × 10−34.09 × 10−27.15 × 10⁻²
Child1.35 × 10−15.25 × 10−31.16 × 10−48.80 × 10−33.96 × 10−34.84 × 10−37.06 × 10−43.85 × 10−22.21 × 10−38.22 × 10−37.28 × 10−21.40 × 10⁻¹
PMZAdult5.93 × 10−22.68 × 10−34.49 × 10−41.34 × 10−36.06 × 10−43.89 × 10−35.13 × 10−41.34 × 10−29.27 × 10−42.26 × 10−33.95 × 10−26.24 × 10⁻²
Child1.28 × 10−13.79 × 10−37.06 × 10−59.52 × 10−34.31 × 10−36.90 × 10−38.42 × 10−42.23 × 10−21.55 × 10−31.59 × 10−27.03 × 10−21.32 × 10⁻¹
CMZAdult6.04 × 10−23.22 × 10−35.91 × 10−41.36 × 10−35.44 × 10−44.21 × 10−33.21 × 10−41.76 × 10−21.32 × 10−31.97 × 10−33.68 × 10−26.42 × 10⁻²
Child1.28 × 10−14.40 × 10−39.21 × 10−59.70 × 10−33.86 × 10−37.46 × 10−35.27 × 10−42.92 × 10−22.21 × 10−31.38 × 10−26.56 × 10−21.32 × 10⁻¹
PIZAdult4.50 × 10−22.69 × 10−35.32 × 10−41.22 × 10−35.18 × 10−43.53 × 10−32.71 × 10−41.53 × 10−21.45 × 10−38.07 × 10−42.51 × 10−24.82 × 10⁻²
Child9.36 × 10−23.54 × 10−38.23 × 10−58.67 × 10−33.68 × 10−36.27 × 10−34.45 × 10−42.54 × 10−22.43 × 10−35.68 × 10−34.47 × 10−29.72 × 10⁻²
MSZAdult4.84 × 10−22.93 × 10−35.42 × 10−41.25 × 10−35.23 × 10−43.50 × 10−33.60 × 10−41.65 × 10−21.10 × 10−31.37 × 10−32.72 × 10−25.18 × 10⁻²
Child1.03 × 10−13.94 × 10−38.42 × 10−58.90 × 10−33.71 × 10−36.21 × 10−35.90 × 10−42.73 × 10−21.85 × 10−39.67 × 10−34.85 × 10−21.07 × 10⁻¹
MZAdult5.70 × 10−23.78 × 10−37.25 × 10−41.26 × 10−35.28 × 10−43.56 × 10−33.58 × 10−42.21 × 10−21.49 × 10−31.10 × 10−33.11 × 10−26.15 × 10⁻²
Child1.17 × 10−14.93 × 10−31.12 × 10−49.00 × 10−33.75 × 10−36.31 × 10−35.88 × 10−43.67 × 10−22.48 × 10−37.75 × 10−35.53 × 10−21.22 × 10⁻¹
SIZAdult7.44 × 10−23.77 × 10−36.50 × 10−41.45 × 10−34.68 × 10−44.32 × 10−32.35 × 10−41.97 × 10−21.26 × 10−35.73 × 10−34.56 × 10−27.88 × 10⁻²
Child1.72 × 10−15.75 × 10−31.03 × 10−41.03 × 10−23.33 × 10−37.66 × 10−33.86 × 10−43.28 × 10−22.10 × 10−34.04 × 10−28.11 × 10−21.78 × 10⁻¹
All zonesAdult5.32 × 10−23.14 × 10−35.85 × 10−41.27 × 10−35.30 × 10−43.61 × 10−33.48 × 10−41.77 × 10−21.24 × 10−31.45 × 10−33.08 × 10−25.69 × 10⁻²
Child1.12 × 10−14.21 × 10−39.08 × 10−59.06 × 10−33.77 × 10−36.39 × 10−35.72 × 10−42.93 × 10−22.07 × 10−31.02 × 10−25.48 × 10−21.16 × 10⁻¹
“ING”, “DER”, and “INH” represent oral ingestion, dermal absorption, and inhalation, respectively, as below.
Table 9. Carcinogenic health risk assessment.
INGDERINHPbCdCrNiAsTotal
WDZAdult8.86 × 10−57.92 × 10−68.10 × 10−77.94 × 10−81.22 × 10−73.36 × 10−54.51 × 10−51.84 × 10−59.73 × 10−5
Child1.58 × 10−49.75 × 10−61.24 × 10−71.42 × 10−72.16 × 10−75.65 × 10−57.85 × 10−53.28 × 10−51.68 × 10−4
PMZAdult6.35 × 10−55.09 × 10−64.92 × 10−71.13 × 10−71.45 × 10−71.94 × 10−53.16 × 10−51.78 × 10−56.91 × 10−5
Child1.13 × 10−46.27 × 10−67.54 × 10−82.02 × 10−72.58 × 10−73.26 × 10−55.51 × 10−53.16 × 10−51.20 × 10−4
CMZAdult7.98 × 10−56.91 × 10−66.25 × 10−71.23 × 10−79.09 × 10−82.55 × 10−54.50 × 10−51.66 × 10−58.73 × 10−5
Child1.43 × 10−48.51 × 10−69.56 × 10−82.19 × 10−71.61 × 10−74.29 × 10−57.84 × 10−52.95 × 10−51.51 × 10−4
PIZAdult7.59 × 10−56.84 × 10−65.35 × 10−71.03 × 10−77.67 × 10−82.21 × 10−54.96 × 10−51.13 × 10−58.33 × 10−5
Child1.36 × 10−48.42 × 10−68.18 × 10−81.83 × 10−71.36 × 10−73.73 × 10−58.64 × 10−52.01 × 10−51.44 × 10−4
MSZAdult6.74 × 10−56.08 × 10−65.73 × 10−71.02 × 10−71.02 × 10−72.38 × 10−53.77 × 10−51.23 × 10−57.40 × 10−5
Child1.20 × 10−47.48 × 10−68.78 × 10−81.82 × 10−71.81 × 10−74.01 × 10−56.56 × 10−52.18 × 10−51.28 × 10−4
MZAdult8.80 × 10−58.14 × 10−67.60 × 10−71.04 × 10−71.01 × 10−73.19 × 10−55.07 × 10−51.40 × 10−59.69 × 10−5
Child1.57 × 10−41.00 × 10−51.16 × 10−71.85 × 10−71.80 × 10−75.37 × 10−58.83 × 10−52.49 × 10−51.67 × 10−4
SIZAdult8.44 × 10−57.15 × 10−67.05 × 10−71.26 × 10−76.66 × 10−82.86 × 10−54.29 × 10−52.06 × 10−59.22 × 10−5
Child1.51 × 10−48.80 × 10−61.08 × 10−72.24 × 10−71.18 × 10−74.81 × 10−57.47 × 10−53.65 × 10−51.60 × 10−4
All zonesAdult7.47 × 10−56.68 × 10−66.17 × 10−71.05 × 10−79.85 × 10−82.55 × 10−54.24 × 10−51.39 × 10−58.20 × 10−5
Child1.33 × 10−48.22 × 10−69.45 × 10−81.87 × 10−71.75 × 10−74.30 × 10−57.37 × 10−52.47 × 10−51.42 × 10−4
Disclaimer/Publisher’s Note: The statements, opinions and data contained in all publications are solely those of the individual author(s) and contributor(s) and not of MDPI and/or the editor(s). MDPI and/or the editor(s) disclaim responsibility for any injury to people or property resulting from any ideas, methods, instructions or products referred to in the content.

