1. Introduction
Energy poverty (EP) has been used to refer to issues in home heating, but in recent years, it has evolved to include all energy needs of a household [
1]. Currently, “Energy poverty is broadly defined as inadequate levels of essential energy services experienced by households. It has various forms and is predicated upon a multitude of vulnerability factors” [
2]. Therefore, EP refers to a household’s inability to meet its basic energy needs adequately and affordably. It often results from a combination of financial constraints, energy-inefficient housing, high energy prices, and unfavorable socio-economic factors. In other words, it manifests when a household’s energy expenditure compromises its economy, well-being, and safety [
3]. EP may yield profound repercussions within impacted households, precipitating financial stress and adverse effects on the physical and mental well-being of individuals facing this phenomenon [
4].
Due to the various geographical and socio-economic situations in its different countries, there is significant heterogeneity across Europe in energy affordability. For example, the average energy burden—the household’s share of energy expenditure over income—varies from 2.9% in Malta to 10.9% in Latvia. The incidence of households experiencing a burden beyond 10% is minimal in Luxembourg and Malta (2%), starkly contrasting with Hungary, Latvia, and Slovakia, where it exceeds 43% [
5]. These regional disparities underscore the importance of quantifying and monitoring EP at a country level, as well as having tools to compare different states.
Moreover, the COVID-19 global health crisis and, more recently, the energy crisis have significantly exacerbated this problem in Europe [
6,
7,
8]. For instance, the share of Spanish households unable to keep home adequately warm grew from 7.6% in 2019 to 14.3% in 2021 and increased again in 2022 and 2023 reaching values of 17.1% and 20.8%, according to studies from the Chair of Energy Poverty at Comillas University. These crises have highlighted the fragility of Europe’s energy systems and have urged decision-makers to adopt a more proactive approach to mitigating the devastating effects of EP.
Against this alarming backdrop, there is a current need to quantify and compare EP prevalence in different countries to identify potential similar trends. Such unified approaches could enable better coordination, collaboration, and consistency in fighting EP, as demonstrated in the past for some neighboring countries.
Accordingly, the goal of this paper is to contribute to the research by developing a systematic measurement tool to characterize and monitor EP in Europe and applying it to three EU Member States (MSs), namely Spain, Italy, and France. This tool may help decision-makers better understand regional variations in energy vulnerability and design more effective energy and social policies. This measurement tool is programmed to read, clean, and process microdata from the Statistics on Income and Living Conditions (SILC) and Household Budget Survey (HBS), two surveys conducted at the national level regularly and joined at the EU level by Eurostat. To adequately capture the different dimensions of EP, this tool allows us to compute five different indicators, namely the arrears on utility bills; the inability to keep homes adequately warm; the presence of leak, damp, and rot; the high share of energy expenditure in income (2M); and the low absolute energy expenditure (M/2).
Once EP has been measured, the most vulnerable households need to be identified to develop effective measures targeting them and adequately tackle this issue. To this extent, this paper presents a vulnerability analysis based on an econometric methodology. The goal of this analysis is to identify key characteristics of the households most likely to be in a situation of EP. This analysis is based on the French SILC data from 2020 and uses whether a household is unable to keep its home adequately warm as the indicator of EP.
This econometric analysis contributes to the existent EP literature by aiming to uncover the underlying determinants that influence the likelihood of being energy poor in France. This analysis considers a wide range of variables, including socio-demographic characteristics.
The structure of this paper is as follows:
Section 2 presents a State-of-the-Art EP measurement and identifies research gaps and this paper’s novel contributions.
Section 3 and
Section 4 describe the two analyses carried out in this paper.
Section 3 presents and discusses the monitoring tool developed and the comparative study of EP occurrence in Spain, Italy, and France.
Section 4 describes and debates our econometric study of French vulnerable households based on the EP indicator chosen. Finally,
Section 5 presents the conclusions and implications of the results obtained.
2. Measuring Energy Poverty
As the Introduction notes, EP is a complex phenomenon that demands an in-depth understanding of its various dimensions. The origins of household EP encompass a broad spectrum of potential causes. While energy affordability issues predominantly impact lower-income households [
5], poor housing energy performance is equally significant as low income in determining EP [
9]. The risk of EP is also increased by a mismatch between dwelling size and household size, as well as lower overall household expenditures [
9].
The prevalence of the potential causes of EP varies broadly depending on the country and its geographical and socio-economic characteristics. For instance, in Baltic and Central–Eastern Europe, energy affordability issues are more often related to a high energy burden and utility bills arrears [
5], while in Southern Europe, EP households mostly experience inadequate thermal comfort and under-consumption issues, i.e., the so-called hidden EP [
5,
10,
11]. Therefore, to adequately identify EP and its different potential causes, employing a variety of pertinent indicators is essential. This enables a comprehensive understanding of this complex reality and facilitates its quantification and monitoring [
5].
The EU Energy Poverty Observatory (EPOV), established by the European Union in 2016, tracked and evaluated EP across its Member States. A key objective of the EPOV was to propose consistent methodological indicators throughout all Member States. For the identification of households at risk of EP, EPOV recognized three primary approaches: comparing household energy expenditure against an absolute or relative threshold (objective or income-expenditure approach), comparing levels of energy service against set standards (direct approach), and analyzing self-assessment reports on their energy situation (subjective approach). Notably, the first two methods essentially rely on quantitative data, while the third relies solely on qualitative data [
12].
In this line, EPOV introduced four primary indicators, which are also included in the dashboard created by the EU Energy Poverty Advisory Hub (EPAH) that continued the EPOV work [
13,
14]:
- -
Inability to keep home adequately warm: the share of the population that was unable to keep its home adequately warm over the last year.
- -
Arrears on utility bills: the share of the population that had one or more arrears on utility bills over the last year.
- -
M/2 (low absolute energy expenditure): the share of the population whose absolute energy expenditure is below half the national median.
- -
2M: the share of the population whose share of energy expenditure is above twice the national median [
12].
The first two primary indicators are consensual-based (subjective) and are computed using household self-assessments. Meanwhile, the 2M and M/2 are expenditure-based indicators. It must be noted that these two indicators intend to capture two different dimensions of EP. The 2M aims to quantify disproportionate energy expenditure by measuring the share of households with a high proportion of energy expenses over income, while the M/2 attempts to identify hidden EP, meaning that a household is deliberately under-consuming energy to save money, by determining the share of households with insufficient energy expenses. However, the latter fails to capture this under-consuming issue adequately [
10,
15]. For these four indicators, second-level disaggregating variables could be considered: income deciles in the country, tenure type, urbanization density, and dwelling type. This aims to identify more precisely the type of population suffering from EP [
16].
Criticism can also be directed at subjective indicators. Indeed, they are based on people’s lived experiences, which are highly subjective and heterogeneous. Although their consistency across regions and countries is an advantage, there is a clear lack of homogeneity in people’s perceptions across a population. Therefore, objective indicators are necessary to complement subjective indicators, and vice versa [
1].
In addition, the different indicators give very diverse poverty rates [
2]. These dissimilar rates are explained by the fact that the different indicators make it possible to better identify the diverse causes of EP, allowing for more effective policies to be developed depending on the prevailing problem [
5]. Interestingly, the main indicators of EP have a very low overlap rate, highlighting the existence of different causes of EP, as shown in the case of Hungary in 2018, where 11.8% of the population declared having arrears on utility bills, while 12.7% of the population had a disproportionate share of energy expenditure, but only 1.2% of the population was captured by both indicators [
2]. The overlap rate is no better when considering only subjective indicators. For the same Hungarian case, 7.0% of the population declared not being able to keep its home adequately warm during winter, but only 1.7% of the population was identified in the situation of EP by both consensual-based indicators [
2].
Among the various approaches to EP measurement and targeting in the EU, Tovar Reaños et al. (2025) [
17] emphasize a multidimensional approach, considering factors such as income, energy costs, and housing conditions. This comprehensive method allows for a more nuanced understanding of EP across different European contexts.
Makridou et al. (2024) [
18] evaluated EP in EU countries, highlighting the importance of housing conditions and financial security. Their findings suggest that poor insulation and substandard housing significantly contribute to EP, while higher-income households are better equipped to mitigate these effects.
Kashour and Jaber (2024) [
19] revisited EP measurement in the EU, proposing new methodologies to capture the multifaceted nature of EP better. Their research suggests that traditional metrics may overlook essential aspects of EP, such as hidden energy deprivation.
Gouveia et al. (2023) [
20] provide insights into national indicators for EP, uncovering new possibilities for expanded knowledge. Their work emphasizes the importance of continuous monitoring and updating of indicators to reflect changing socio-economic conditions.
Antunes et al. (2023) [
5] analyzed energy affordability across 26 European countries, offering insights into the prevalence and depth of EP problems. Their study highlights significant disparities in EP rates and the need for tailored interventions.
Karpinska and Smiech (2023) [
21] examined housing-cost-induced EP in Central and Eastern Europe, revealing multiple faces of poverty. Their findings suggest that EP is closely linked to housing costs and socio-economic vulnerabilities.
Despite the extensive research, several gaps remain. Firstly, there is a lack of comparative studies focusing specifically on Southern and Western Europe. Most studies either address Europe as a whole or focus on specific countries, leaving a gap in understanding regional differences.
Secondly, while multidimensional approaches are valuable, there is a need for more dynamic and conjectural/situational analyses that consider the impact of crises, such as economic downturns or energy price spikes, on EP. Existing studies often provide static snapshots, which may not capture the evolving nature of EP during crisis years.
Thirdly, vulnerability trends in crisis years are underexplored. The INFORM Risk Index highlights the increased vulnerability and risk due to crises like the COVID-19 pandemic. However, there is limited research on how these trends affect EP in Southern and Western Europe.
In this sense, one of the key contributions of this paper is its focus on a comparative regional analysis of EP in Spain, Italy, and France. This regional focus allows this study to uncover specific vulnerabilities and trends not apparent in broader European studies, providing a more detailed understanding of EP in Southern and Western Europe.
Another significant contribution is this study’s dynamic/situational approach to analyzing how EP evolves during crisis years.
This paper also conducts an econometric analysis to identify the characteristics of households most vulnerable to EP in France. This analysis considers a wide range of socio-demographic variables, providing insights into the key drivers of vulnerability. By identifying these characteristics, this study offers valuable information for designing targeted interventions to mitigate EP.
Furthermore, the findings of this study have significant policy implications. By highlighting the most vulnerable households and the factors contributing to their vulnerability, this study provides a basis for policymakers to design more effective and targeted interventions. This is particularly important for addressing EP in a way that is sensitive to the specific needs and circumstances of different regions and populations.
Lastly, this study introduces a systematic tool designed to characterize and monitor energy poverty (EP). By integrating multiple indicators, this tool enables a multidimensional and comprehensive assessment of EP. This methodological advancement improves the capacity to capture the complexity of EP, thereby supporting more effective monitoring and targeted intervention strategies.
3. Comparative Analysis of Energy Poverty in France, Italy and Spain
This section presents the methodology used to quantify EP and the comparative analysis conducted in three case-study countries, namely Spain, Italy, and France.
3.1. Data and Methodology
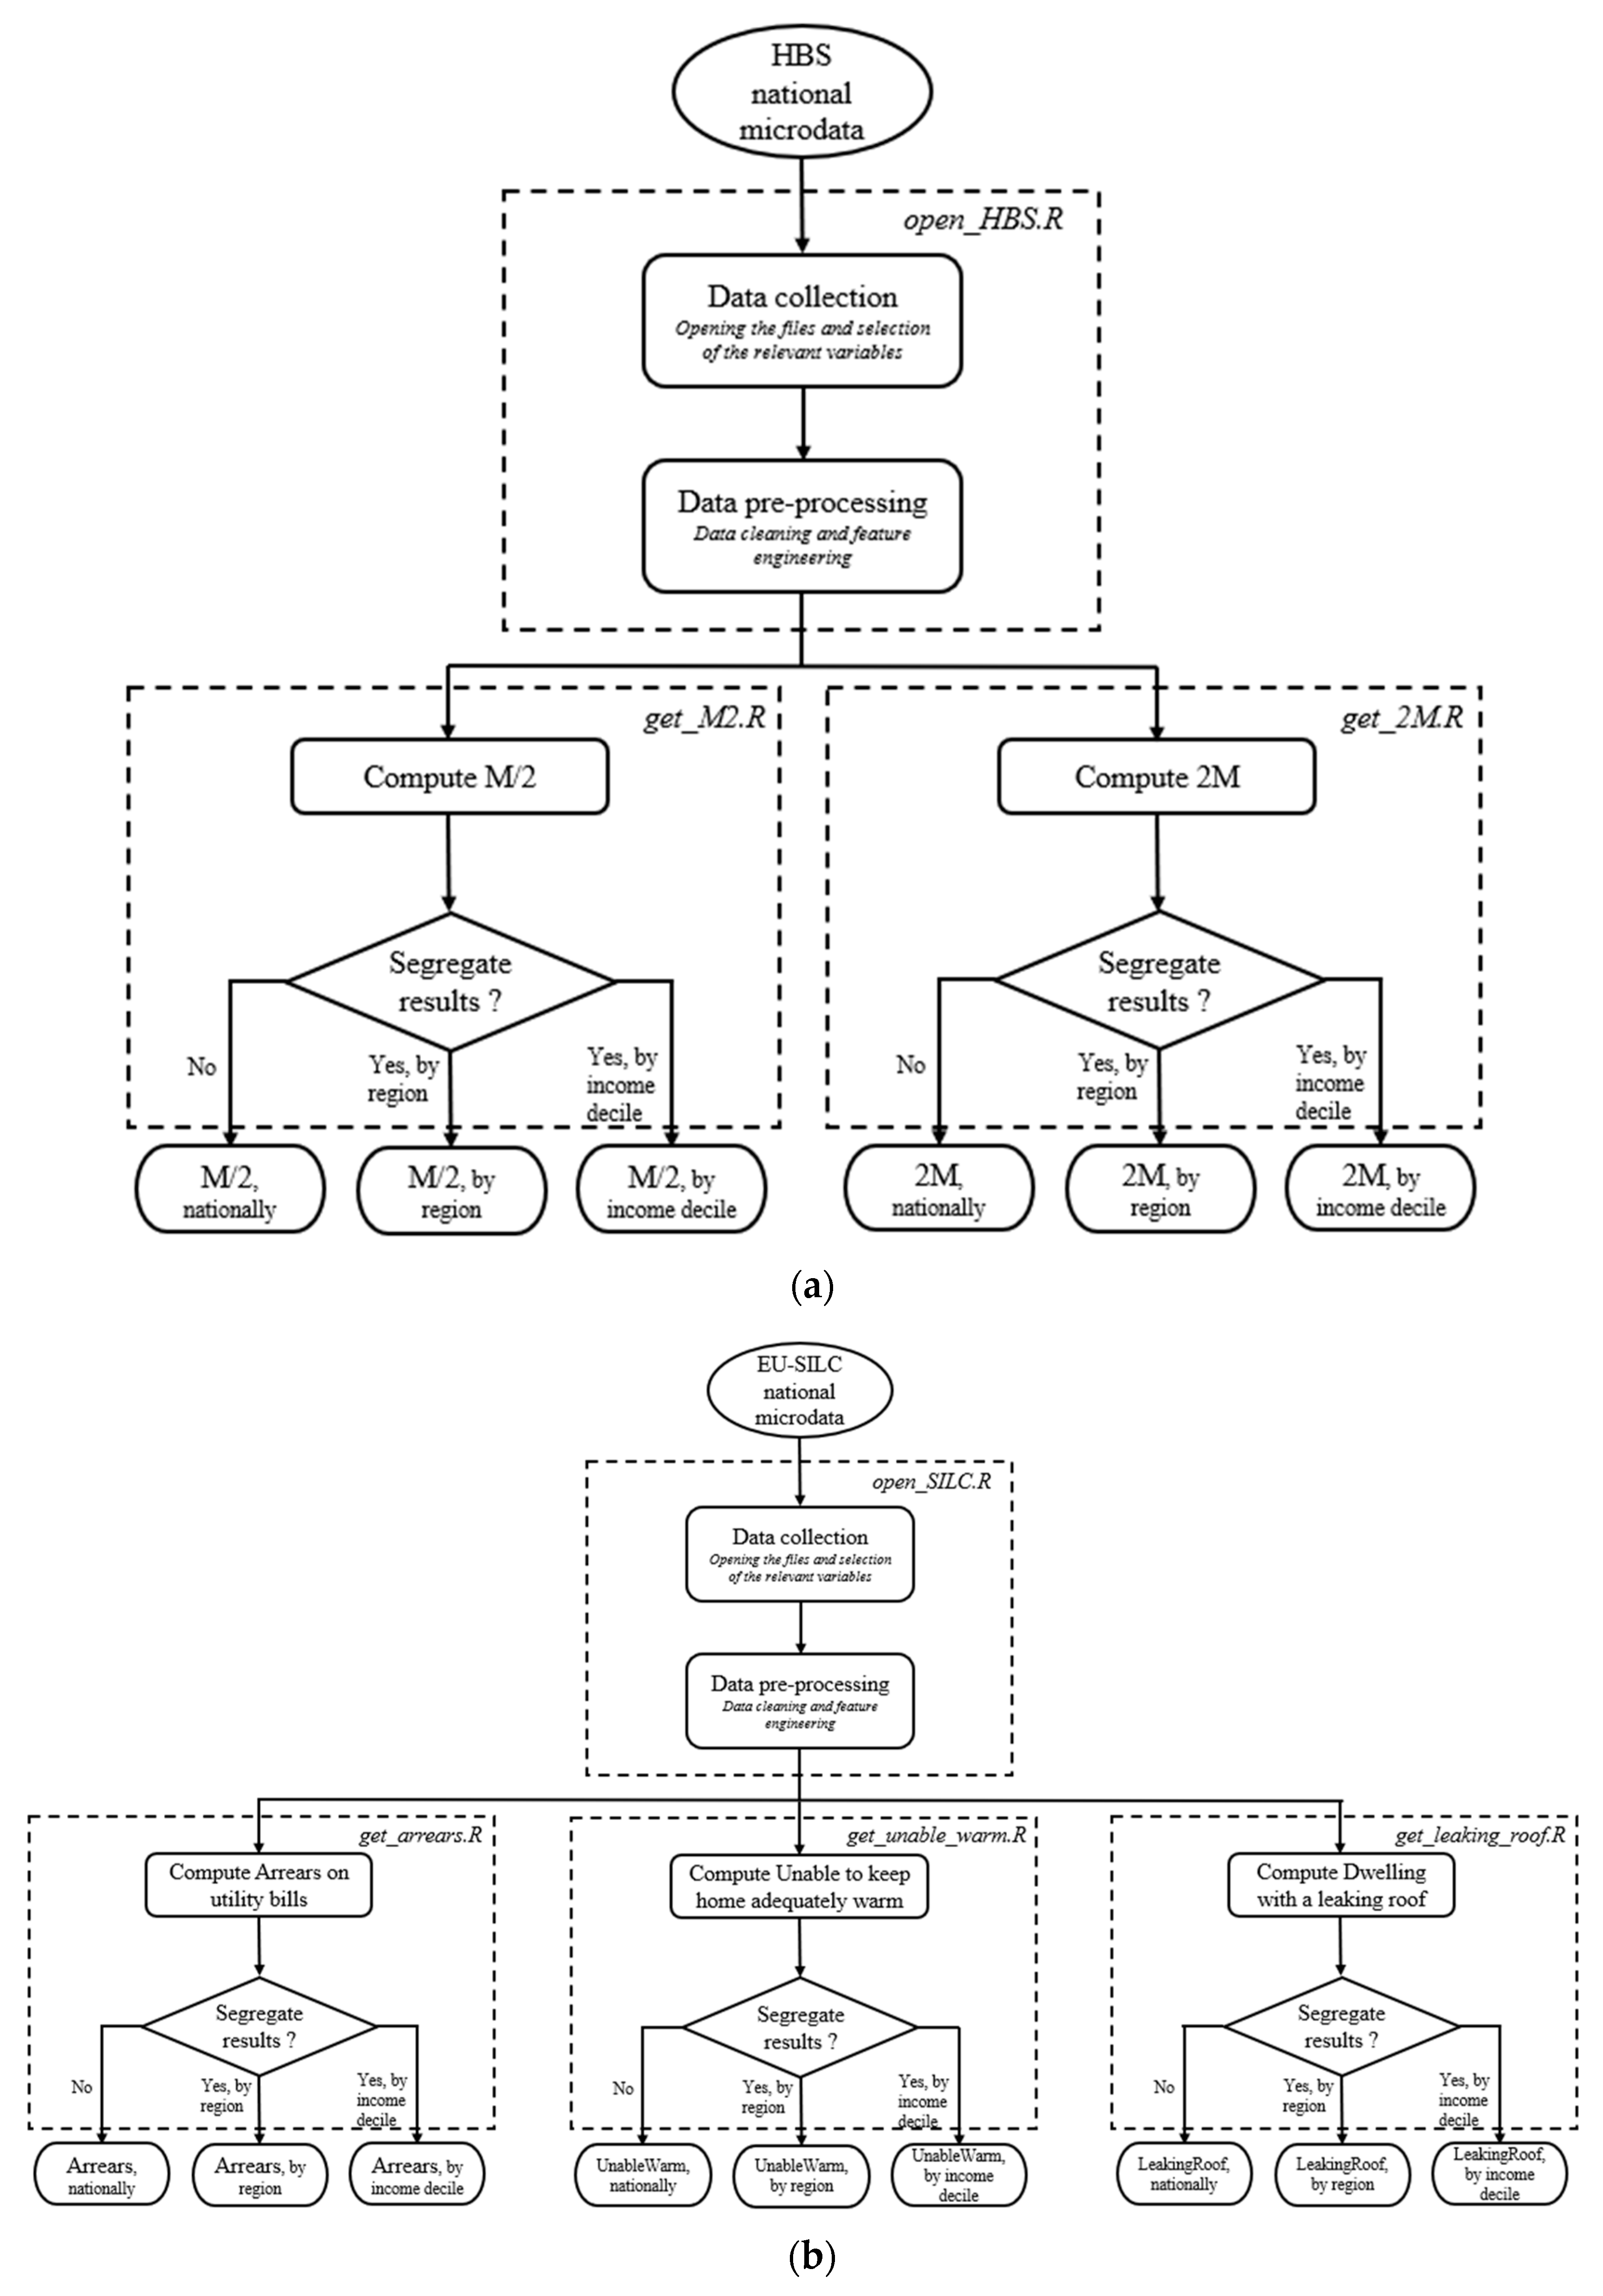
Two main databases are used to compute EP indicators: The Household Budget Survey (HBS) is conducted at a national level by the EU MSs’ national statistics institutes on a periodical basis. It aims to obtain information on the nature and destination of consumption expenditures, as well as on various characteristics related to the socio-economic conditions of the households. This database is used to calculate objective indicators based on households’ income and expenditure data. The European Statistics on Income and Living Conditions (EU-SILC) is a survey conducted by each national statistics institute and unified by Eurostat [
22], at the EU level. It is carried out every year. It serves as the basis for generating subjective indicators. For each of these two surveys, the national sample is made up of around 20,000 responses from the countries studied.
As highlighted by the EP literature, various indicators need to be used to properly address all the aspects of the problem. In this research, the four primary indicators identified by the EPOV were retained for analysis: “inability to keep its home adequately warm”, “arrears on utility bills”, M/2, and 2M [
16]. Additionally, a third subjective indicator was considered: the share of the “population living in a dwelling with the presence of leak, damp, and rot”.
The “inability to keep home adequately warm”; the “arrears on utility bills”; and the “population living in a dwelling with presence of leak, damp, and rot” are computed directly from the SILC data, specifically from variables HH050, HS021, and HH040 of the EU-SILC.
The 2M is a disproportionate expenditure indicator, computed using the following equation:
with
The national median used as a reference is computed annually. To compute the income and the energy expenditure per capita, various equivalence factors are used, as described by Barrella and Romero [
16].
The M/2 is computed using the following equation:
For the calculation of the household energy expenditure and its national median, the same procedure as for the 2M indicator is used [
23].
Various algorithms have been developed to read, clean, and process the survey microdata, and then to compute the different EP indicators using the calculations previously described. Finally, these algorithms were put together in a tool. How this tool works is shown in
Figure 1.
3.2. Comparison of Energy Poverty Incidence in Spain, Italy, and France
In this section, a comparative study of EP incidence in Spain, Italy, and France is conducted for the 2017–2022 period. Due to the lack of annual HBS data in Italy and France, the comparative study was performed using only the three subjective indicators that had been previously selected. The data used for this analysis are presented in
Table 1,
Table 2 and
Table 3.
In all three countries, the situation is quite alarming, as the values of the indicators have either increased or remained stable over the 2017–2022 period. Nevertheless, there are differences in the prevalence of the multiple dimensions of EP in these three countries.
First, the share of the population having arrears on utility bills is higher in Spain than in France and Italy, with 9.2% of the Spanish population, 7.1% of the French population, and 5% of the Italian one in 2022. However, the three countries share quite similar trends. Spain and France experienced a consequent drop from 2017 and 2018, while Italy’s value slightly increased. Then, all three countries had a gradual increase between 2018 and 2021, followed by a slight decrease in 2022.
Both Spain and France show worrying results in regard to their inability to keep home adequately warm, an indicator that has more than doubled over the 5-year span; however, the problem remains much more acute in Spain, with 17.1% of the Spanish population being unable to keep their homes adequately warm against 10.9% of the French population in 2022. Conversely, the share of the Italian population unable to keep their homes adequately warm decreased between 2019 and 2020; then, it was stable in 2021 and slightly increased in 2022.
A key shared concern is the sharp increase in the proportion of the population living in dwellings affected by leaks, damp, and rot. It increased by about 50% in all three countries between 2018 and 2020 to reach 17.7% in France, 19.6% in Italy, and 19.7% in Spain. This trend reflects a deterioration in housing quality, which could significantly impact the required energy expenditure. Poorly insulated homes with structural issues require more energy to maintain comfortable indoor temperatures, ultimately resulting in higher energy bills [
10,
24].
Overall, the situation of EP appeared relatively stable in all three countries between 2017 and 2019. However, from 2020 onwards, the situation worsened overall in these countries, especially in Spain and France. This mainly reflects the impact of the COVID-19 crisis and the following energy and inflationary crisis, both of which have caused a loss of purchasing power, as well as changes in households’ behavior and comfort [
23,
25].
These results are aligned with the ones published by the Chair of Energy and Poverty for Spain [
11] and the Italian and French National Energy Poverty Observatory annual reports [
26,
27]. Moreover, this paper pursues one of the EPAH’s objectives of comparing energy poverty trends in EU Member States.
In summary, despite some disparities, France, Italy, and Spain share common trends in terms of EP. This reinforces the idea that harmonized policies to tackle EP at the European level could be relevant, especially when looking at more affine countries.
4. Identifying Vulnerable Households
After measuring the different dimensions of EP, finding the characteristics of the households most vulnerable to EP is the next step in drafting effective policies to address this issue adequately. In this way, EP policies can be tailored to address specific dimensions of the phenomenon or to target particularly at-risk population groups.
4.1. Methodology of the Vulnerability Analysis
The methodology used in this research is an econometric analysis, as proposed by Legendre [
28] and also used by Romero et al. [
29]. To this extent, a logit model was developed.
The econometric analysis is based on EU-SILC data for France in 2020. The indicator of EP chosen for the analysis is the “Inability to keep home adequately warm”. Thus, the dependent variable of the logit regression is equal to 1 if the household is unable to keep its home adequately warm, and it is equal to 0 in the other case. The explanatory variables from the 2020 French SILC database that are used are presented in
Table 4. For each categorical variable, the most frequent category was chosen as the reference group in order to stabilize the estimates, especially as some categories have very few observations.
According to the logit model methodology, we presume that there is a latent variable,
, as in (4).
where
is the vector of explanatory variables, and
is the error term.
The variable is unobservable; we only observe , the binary variable equal to 1, if household i is unable to keep its home adequately warm, and it is equal to 0 otherwise. It is assumed that the error term follows a standard logistic regression.
Then, the probability of household
i being vulnerable to being unable to keep its home adequately warm is given by (5).
The logit model has the advantage of showing the relationship between the estimated coefficients and the odds ratios. If the odds ratio is greater than one, it indicates that the probability of being vulnerable to EP is higher relative to the reference category of the variable, and vice versa [
30].
As previously mentioned, the analysis uses the 2020 French SILC dataset, which includes a sample of 10,673 households after data cleaning. All variables included in the model are binary (dummy) variables, with one dummy created for each category within a variable, except for one—the base or reference category—against which the effects of the other categories are measured.
It should be noted that, for the “employment of the main breadwinner”, we chose two references, “retired” and “employed”, in order to avoid redundancy with the “type of employment of the main breadwinner” variable.
Before computing the logit regression model, we carried out a multicollinearity analysis to ensure that there was no collinearity between the different explanatory variables used in the model, which could affect the reliability of the results. The variance inflation factor (VIF) for each variable in the regression model was calculated. The results are shown in
Table 5. Since all of the VIF values are lower than 5, there is no concern regarding potential multicollinearity issues between explanatory variables.
4.2. Results and Discussion
This subsection presents the outcomes of analyzing the vulnerability to EP of French households in 2020, as shown in
Table 6. The model we developed presents a pseudo-R
2 of 0.1042. It is worth recalling that, in this context, being energy poor refers to a household’s inability to keep the home adequately warm. While the pseudo-R
2 of 0.1042 may appear low compared to traditional linear regression benchmarks, it is within an acceptable range for logistic regression models, particularly in the context of complex social phenomena like energy poverty. This suggests that the model captures meaningful variation in vulnerability, although additional unobserved factors likely contribute to the outcome.
First, household composition strongly influences the likelihood of being unable to keep the home adequately warm. The households of couples, with or without children, are less likely to be energy poor than households formed by a single person or a single-parent family. Moreover, the likelihood of being energy poor is slightly higher for couples with at least one child. Thus, household composition should also be considered when designing measures to tackle EP. However, overcrowding within the dwelling showed no statistically significant influence on the likelihood of being energy poor.
Second, tenure status also affects the probability of being unable to keep homes adequately warm. The households that own their dwellings show a much lower probability of being energy poor. In fact, their likelihood of being unable to keep their home adequately warm is twice as low as that of the tenants and 1.5 as low as people accommodated free of charge. An explanation for this result might be that homeownership is correlated with higher and stable disposable incomes [
31]. Moreover, in rented homes, the landlord–tenant dilemma [
32] makes it challenging to improve energy efficiency. In this regard, the French parliament voted in 2021 for a gradual ban from 2025 on renting out dwellings with low energy efficiency [
33], which may result in a reduction of EP.
Furthermore, our study found that households living in a semi-detached house or in an appartement with less than 10 dwellings have a higher probability of being energy poor than the ones living in a detached house.
It is also noteworthy that households living in low-density areas are more likely to be unable to keep their homes adequately warm than those living in intermediate-density or high-density areas, the last ones being the least likely to be energy poor.
Finally, when identifying EP vulnerability factors for the households, the occupation of the main breadwinner is very relevant. A household is more than twice as likely to be unable to keep its home adequately warm if its main breadwinner is unemployed or professionally inactive than if he or she is employed, studying, or retired. Additionally, working as an executive reduces the probability of being energy poor. This result is easy to understand, as this occupation often comes with a substantial salary. Conversely, office employees seem to be more likely to be energy poor.
On top of that, the education level of the main breadwinner also has an influence, as having a master’s degree consequently decreases the likelihood of being energy poor. Having a license (a French academic diploma corresponding to 3 years of study) or a DUT (a French academic diploma corresponding to 2 years of study) also reduces the likelihood of being unable to keep their homes adequately warm in comparison to having only the Baccalauréat (a French national academic qualification that students can obtain at the completion of their secondary education). Additionally, the households whose main breadwinner has no diploma are more likely to be in a situation of energy poverty. The following trend seems to be emerging: the higher the level of education of the main breadwinner, the less likely the household is to be energy poor. The explanation behind this result could be the higher salary to which a higher degree entitles the holder. Nevertheless, holding a doctorate degree shows a similar probability of being energy poor as to only holding a Baccalauréat degree.
To assess the robustness of our model, we re-estimated it using a Probit specification instead of Logit. While both are appropriate for binary outcomes, they differ in the assumed distribution of the error term (logistic vs. normal).
The results of this new model, included in
Appendix A, are similar to the ones previously obtained, as the model has the same significant variables, with the same coefficient signs, thus showing the robustness of the previous results.
Additionally, a Hosmer–Lemeshow test was conducted to evaluate how well the Logit model’s predicted probabilities align with actual outcomes. This test groups the data into deciles based on predicted probability and compares observed versus expected events. The p-value obtained is 0.7205, greater than 0.05, suggesting that the model does not significantly deviate from the observed data and, thus, implying a good fit.
Regarding policies, the two main measures to combat EP in France are the “Chèque Energie” and the financial subsidies for renovating dwellings with low energy efficiency [
20].
The “Chèque Energie” is a government subsidy for low-income households to help them pay their energy bills. Deployed in 2018, this scheme currently covers almost 5.6 million households, for an average of EUR 150 per year [
34]. The “Chèque Energie” is allocated according to the income of the whole household and its composition. Considering the analysis conducted, these attribution criteria appear to be incomplete. Tenure status and area density, two criteria identified as impacting EP, are not currently considered in the allocation process.
The financial subsidies for energy-efficient home renovation also seem inadequate to fight EP in France. Indeed, households with the main breadwinners in job instability or households with one adult have less money to invest in dwelling renovation, making it difficult for them to perform an energy renovation, even with financial aid. Moreover, tenants are not concerned about this measure.
In summary, the households most vulnerable to being unable to keep their homes adequately warm in France are non-owners with multiple children and/or single-parent households, particularly those located in low-density areas and with a main breadwinner facing job instability. Consequently, policies addressing this dimension of energy poverty should prioritize support for these specific groups. Nevertheless, the low pseudo-R2 value of the model highlights the inherent complexity of EP and the challenges involved in precisely identifying vulnerable households.
5. Conclusions
This study aimed to develop a systematic tool to measure EP in three European countries: Spain, France, and Italy.
The comparative study of the incidence of EP in these EU MSs from 2017 to 2022 reveals a worrying situation, with all countries experiencing an increase or stability in EP indicators. The prevalence of the different dimensions of EP varies across these countries, with Spain showing higher disproportionate energy expenditure (2M) and inability to keep homes adequately warm, while France has a higher prevalence of low absolute energy expenditure (M/2). Italy, on the other hand, has lower rates of arrears on utility bills. Despite these differences, these countries share common trends over the period of study. During the COVID-19 and energy-crisis years, all three countries have seen an alarming increase in the population living in dwellings with the presence of leaks, dampness, and rot, indicating a deterioration in housing quality and potential implications for energy efficiency. Also, the EP situation seemed to improve in all three countries until 2019 but has since worsened.
These common trends reinforce the idea that harmonized EP policies at the European level could be relevant and that a unified approach could enable better coordination, collaboration, and consistency in fighting this issue. It could involve common energy efficiency standards for housing, regulations to prevent disconnections and arrears, and measures to improve energy affordability for low-income households.
The other objective of this research was to evaluate the impact of socio-demographic factors on EP to identify the key characteristics of the households most vulnerable to EP.
The econometric analysis performed has shown that non-owner households with many children and/or with one adult, living in a rural area, and with the main breadwinner in the situation of job instability are more likely to be unable to keep their home adequately warm in France.
Therefore, French policies to deal with this dimension of EP should target these households. In this way, these measures would be more effective and mitigate the issue.
The French government has already deployed some mechanisms to fight EP, most notably the “Chèque Energie” and financial subsidies for renovating dwellings with low energy efficiency. However, these measures could be improved in light of the econometric analysis carried out. The “Chèque Energie” could consider additional allocation criteria, such as the household’s tenure status. Energy renovation of buildings is a good way of tackling EP, but financial aids are poorly adapted to people in EP.
Regarding data limitations, it should be noted that the included data were the last available microdata downloadable from the official survey websites or were obtained from the National Statistics Office by sending them a formal request. In this sense, the Italian and French offices do not publish all the microdata, while the Spanish one does. Further work will extend this study by including Eurostat homogeneous microdata for all EU Member States, thus continuing to work in this research line and exploring post-crisis years, such as 2023 and 2024.
Regarding the econometric analysis, several limitations should be acknowledged. First, the model is based on cross-sectional data from the 2020 French SILC survey, which provides a snapshot in time and does not allow for the observation of changes in energy poverty over time or causal inference. Second, although the model includes a wide range of socio-demographic variables, the pseudo-R2 value indicates that other unobserved factors likely play a significant role in explaining vulnerability to energy poverty. These may include behavioral aspects, subjective perceptions of comfort, or more detailed housing characteristics not captured in the dataset. In addition, the analysis focuses exclusively on France due to data availability, limiting the generalizability of the findings to other European contexts.
Future research could address these limitations by incorporating panel data to study the dynamics and persistence of energy poverty over time, as well as the impact of specific policy interventions. Expanding the econometric analysis to additional countries with harmonized microdata would also enable comparative insights across different institutional and socio-economic contexts. Furthermore, integrating qualitative approaches could help capture more nuanced aspects of vulnerability that are not easily quantified.


