Article

The Last Mile of China’s Low-Carbon Movement: Amplifying Climate Policy Through Cadre Performance Evaluation System

School of Public Policy and Management, Guangxi University, Nanning 530004, China
*
Author to whom correspondence should be addressed.
Sustainability 2025, 17(12), 5232; https://doi.org/10.3390/su17125232
Submission received: 14 April 2025 / Revised: 14 May 2025 / Accepted: 17 May 2025 / Published: 6 June 2025
(This article belongs to the Section Air, Climate Change and Sustainability)

Abstract

:
Climate governance operates across multiple administrative tiers, and enhancing the vertical coherence of policies has become a critical determinant of successful climate governance. This study employs data from 1578 counties in China from 2008 to 2022 to explore the synergistic effects between the Low Carbon City Policy (LCCP) and the Cadre Performance Evaluation System Transformation (CPEST). The study reveals that the CPEST has the potential to enhance the carbon reduction effects of the LCCP, yet it has not fully realized a synergistic effect. Further analysis indicates that although the timing arrangement is beneficial, it alone is insufficient to generate a synergistic effect. A synergistic impact only materializes when the objectives of the CPEST and LCCP are aligned, resulting in a carbon reduction effect that is approximately 1.5 times greater than the simple sum of their individual impacts. Mechanism analysis indicates that the combination of the LCCP and CPEST reduces carbon emissions primarily through four pathways: environmental investment, environmental penalties, green technology innovation, and upgrading of industrial structure. The effects of this combined approach are greater than those achieved through separate implementation. Heterogeneity analysis reveals that the combination of the LCCP and CPEST has a more pronounced effect in resource-based cities, old industrial bases, and regions with strong promotion incentives. The research findings provide both theoretical support and empirical evidence for enhancing vertical coordination in climate governance.

1. Introduction

Climate change is a broad threat across various dimensions of human life, including ecology, economy, and public health [1]. In response to the harmful effects of greenhouse gas emissions, the Intergovernmental Panel on Climate Change (IPCC) has proposed the goal of achieving net-zero carbon dioxide emissions by 2050 [2]. However, the latest reports indicate that achieving this target remains a distant prospect. The AR6 Synthesis Report: Climate Change 2023, published by the IPCC in 2023, highlights that global temperatures have already risen by 1.1 °C above pre-industrial levels. The report emphasizes that all sectors must make an unprecedented effort to reduce greenhouse gas emissions within this decade. As one of the largest carbon emitters in the world, China is also actively addressing the issue of carbon emissions. On 22 September 2020, the Chinese government made a global commitment to ensure that carbon dioxide emissions peak before 2030 and to achieve carbon neutrality by 2060 (hereafter referred to as “3060”). Although the Chinese government has implemented numerous policies to control carbon emissions, many of these policies have not met expectations [3], particularly due to insufficient implementation at the local government level [4,5]. Therefore, under the hierarchical governance structure, ensuring the effective implementation of carbon reduction policies down to the “last mile” has become one of the key challenges for both the Chinese government and governments worldwide at present.
Public policy is a crucial tool for achieving government objectives, requiring collaboration across different levels of governance [6]. While the ideal state of public policy implementation can be encapsulated by the “top-down model” [7], the “bottom-up model” contends that the “last mile” of policy execution is fraught with numerous conflicts. The effectiveness of policies is generally influenced by grassroots governments, and this influence is often decisive [8,9]. Similarly, a common conflict in climate policy is the incompatibility between national carbon reduction targets and local development goals [10,11,12]. This conflict has been substantiated by empirical evidence from various countries, which shows its weakening effect on carbon reduction policies [4,11,13,14]. Therefore, rather than merely expanding carbon reduction policies, it is more urgent to enhance the synergy between national carbon reduction targets and local development goals.
Given China’s significant carbon emissions, the effectiveness of its carbon reduction policies plays a decisive role in the success of global climate governance [15,16]. China practices authoritarian environmentalism, positioning itself as a nation that employs a top-down approach to climate governance [17]. The effective implementation of central government carbon reduction policies depends on the ability to mitigate the conflict between policy objectives and local government development goals. These conflicts are primarily manifested in the tension between carbon reduction targets and economic development [18]. This is because China’s industrial structure dictates that the enforcement of stringent carbon reduction policies may lead to a short-term slowdown in economic growth [19]. Under the GDP-centered Cadre Performance Evaluation System (CPES), local officials often lack the political will to implement carbon reduction policies, resulting in many such policies becoming little more than symbolic processes with no tangible impact [4,5]. In recent years, the Chinese government has begun implementing the Cadre Performance Evaluation System Transformation (subsequently recorded as CPEST) in certain counties. This initiative aims to eliminate the GDP-based indicators within the CPES, thereby reducing policy goal conflicts and encouraging local governments to focus their efforts on critical issues such as environmental protection and poverty reduction. Thus, this initiative provides an opportunity for the current paper to explore how to enhance the synergy between national carbon reduction policies and local development goals, as well as to promote the effective implementation of climate policies down to the “last mile.” To the best of our knowledge, there is limited existing literature on this topic. To fill this gap, we combine another Low Carbon City Policy (LCCP) with the CPEST in our study. Based on the theory of nested institutions [20], we investigate the synergistic effects of these two policies by analyzing data from 1578 counties in China spanning from 2008 to 2022. Subsequent research will focus on answering two questions: whether the LCCP and CPEST can produce synergistic effects, and under what conditions they generate synergies. Our study will contribute to the existing literature in three key ways.
First, it develops a new theoretical framework for assessing the vertical synergy of carbon reduction policies. The climate is a typical common pool resource, involving multiple governance levels, and thus requires abandoning the framework assumption that analyzes it at a single level [21]. However, most existing studies focus on the synergistic effects of policies at the same governance level [22,23], with limited attention given to cross-level interactions. Additionally, existing policy mix frameworks do not offer actionable models [24]. Building on the policy mix framework [25], we incorporate the theory of nested institutions to analyze the synergistic effects of policies across different governance levels.
Second, this study fills the knowledge gap regarding how policy synergy arises within a hierarchical structure. Current assessments of the carbon reduction effects of the LCCP primarily focus on the urban level [22,26]. This overlooks the constraints of policy implementation across hierarchical structures and fails to consider how the bundling of different policy instruments generates synergistic effects [27]. Our results indicate that timing is crucial. However, synergistic effects between the LCCP and CPEST can only be achieved when their objectives are aligned.
Third, this study utilizes more granular data and new econometric methods. Previous studies often relied on case studies or urban-level data, which lack the level of detail necessary for a comprehensive analysis. By using county-level data, we address these limitations and provide a more nuanced analysis. In terms of methodology, we employed techniques such as double machine learning (DML) and synthetic difference-in-differences (SDID) to strengthen the robustness of our conclusions.

2. Policy Background, Framework, and Assumptions

2.1. Policy Background

2.1.1. Low Carbon City Policy

China’s urbanization process has led to a significant increase in carbon emissions. In order to control greenhouse gas emissions, China’s 12th Five-Year Plan, released in 2010, established low-carbon development as a key national strategy. In the same year, the National Development and Reform Commission (NDRC) launched the Low Carbon City Policy (LCCP). The plan established three batches of pilot cities in 2010, 2013, and 2017, totaling 127 cities. The LCCP aims to assist China in achieving its goal set during the 12th Five-Year Plan to control greenhouse gas emissions, specifically targeting a 17% reduction in carbon dioxide emissions per unit of GDP by 2015, compared to 2010 levels. The results indicate that the LCCP has significantly reduced urban carbon emissions; however, in many scenarios, its effectiveness remains suboptimal [27]. Therefore, the next key task is to enhance the synergy of the LCCP during implementation and reduce barriers to its execution [28].

2.1.2. Cadre Performance Evaluation System Transformation

During the same period as the LCCP, the Chinese government recognized the drawbacks of the “GDP-only” mindset. The “GDP-ism” in the CPES has been an important institutional design that has facilitated China’s rapid economic growth [29]. However, it has also intensified goal conflicts, hindering the effective implementation of many environmental protection policies. In 2013, to better achieve goals such as environmental protection and poverty alleviation, the Central Organization Department of the Communist Party of China issued the “Notice on Improving the Performance Evaluation of Local Party and Government Leadership”. This document explicitly called for reducing the weight of GDP in evaluations and strengthening the assessment of indicators such as environmental protection and energy consumption. In 2014, a total of 324 county-level governments announced that they would no longer include GDP indicators in their performance evaluations. Subsequently, regions such as Zhejiang, Inner Mongolia, and Guangxi completely abolished GDP assessments for certain counties. By the end of 2022, a total of 490 county-level governments had completely abolished the GDP assessment in the CPES, accounting for 17.24% of the total (490/2843). The Cadre Performance Evaluation System Transformation (CPEST) has indeed improved air quality at the county level [30]. However, the new question is whether this system transformation can align with climate policies in a synergistic way, thereby amplifying policy effects.

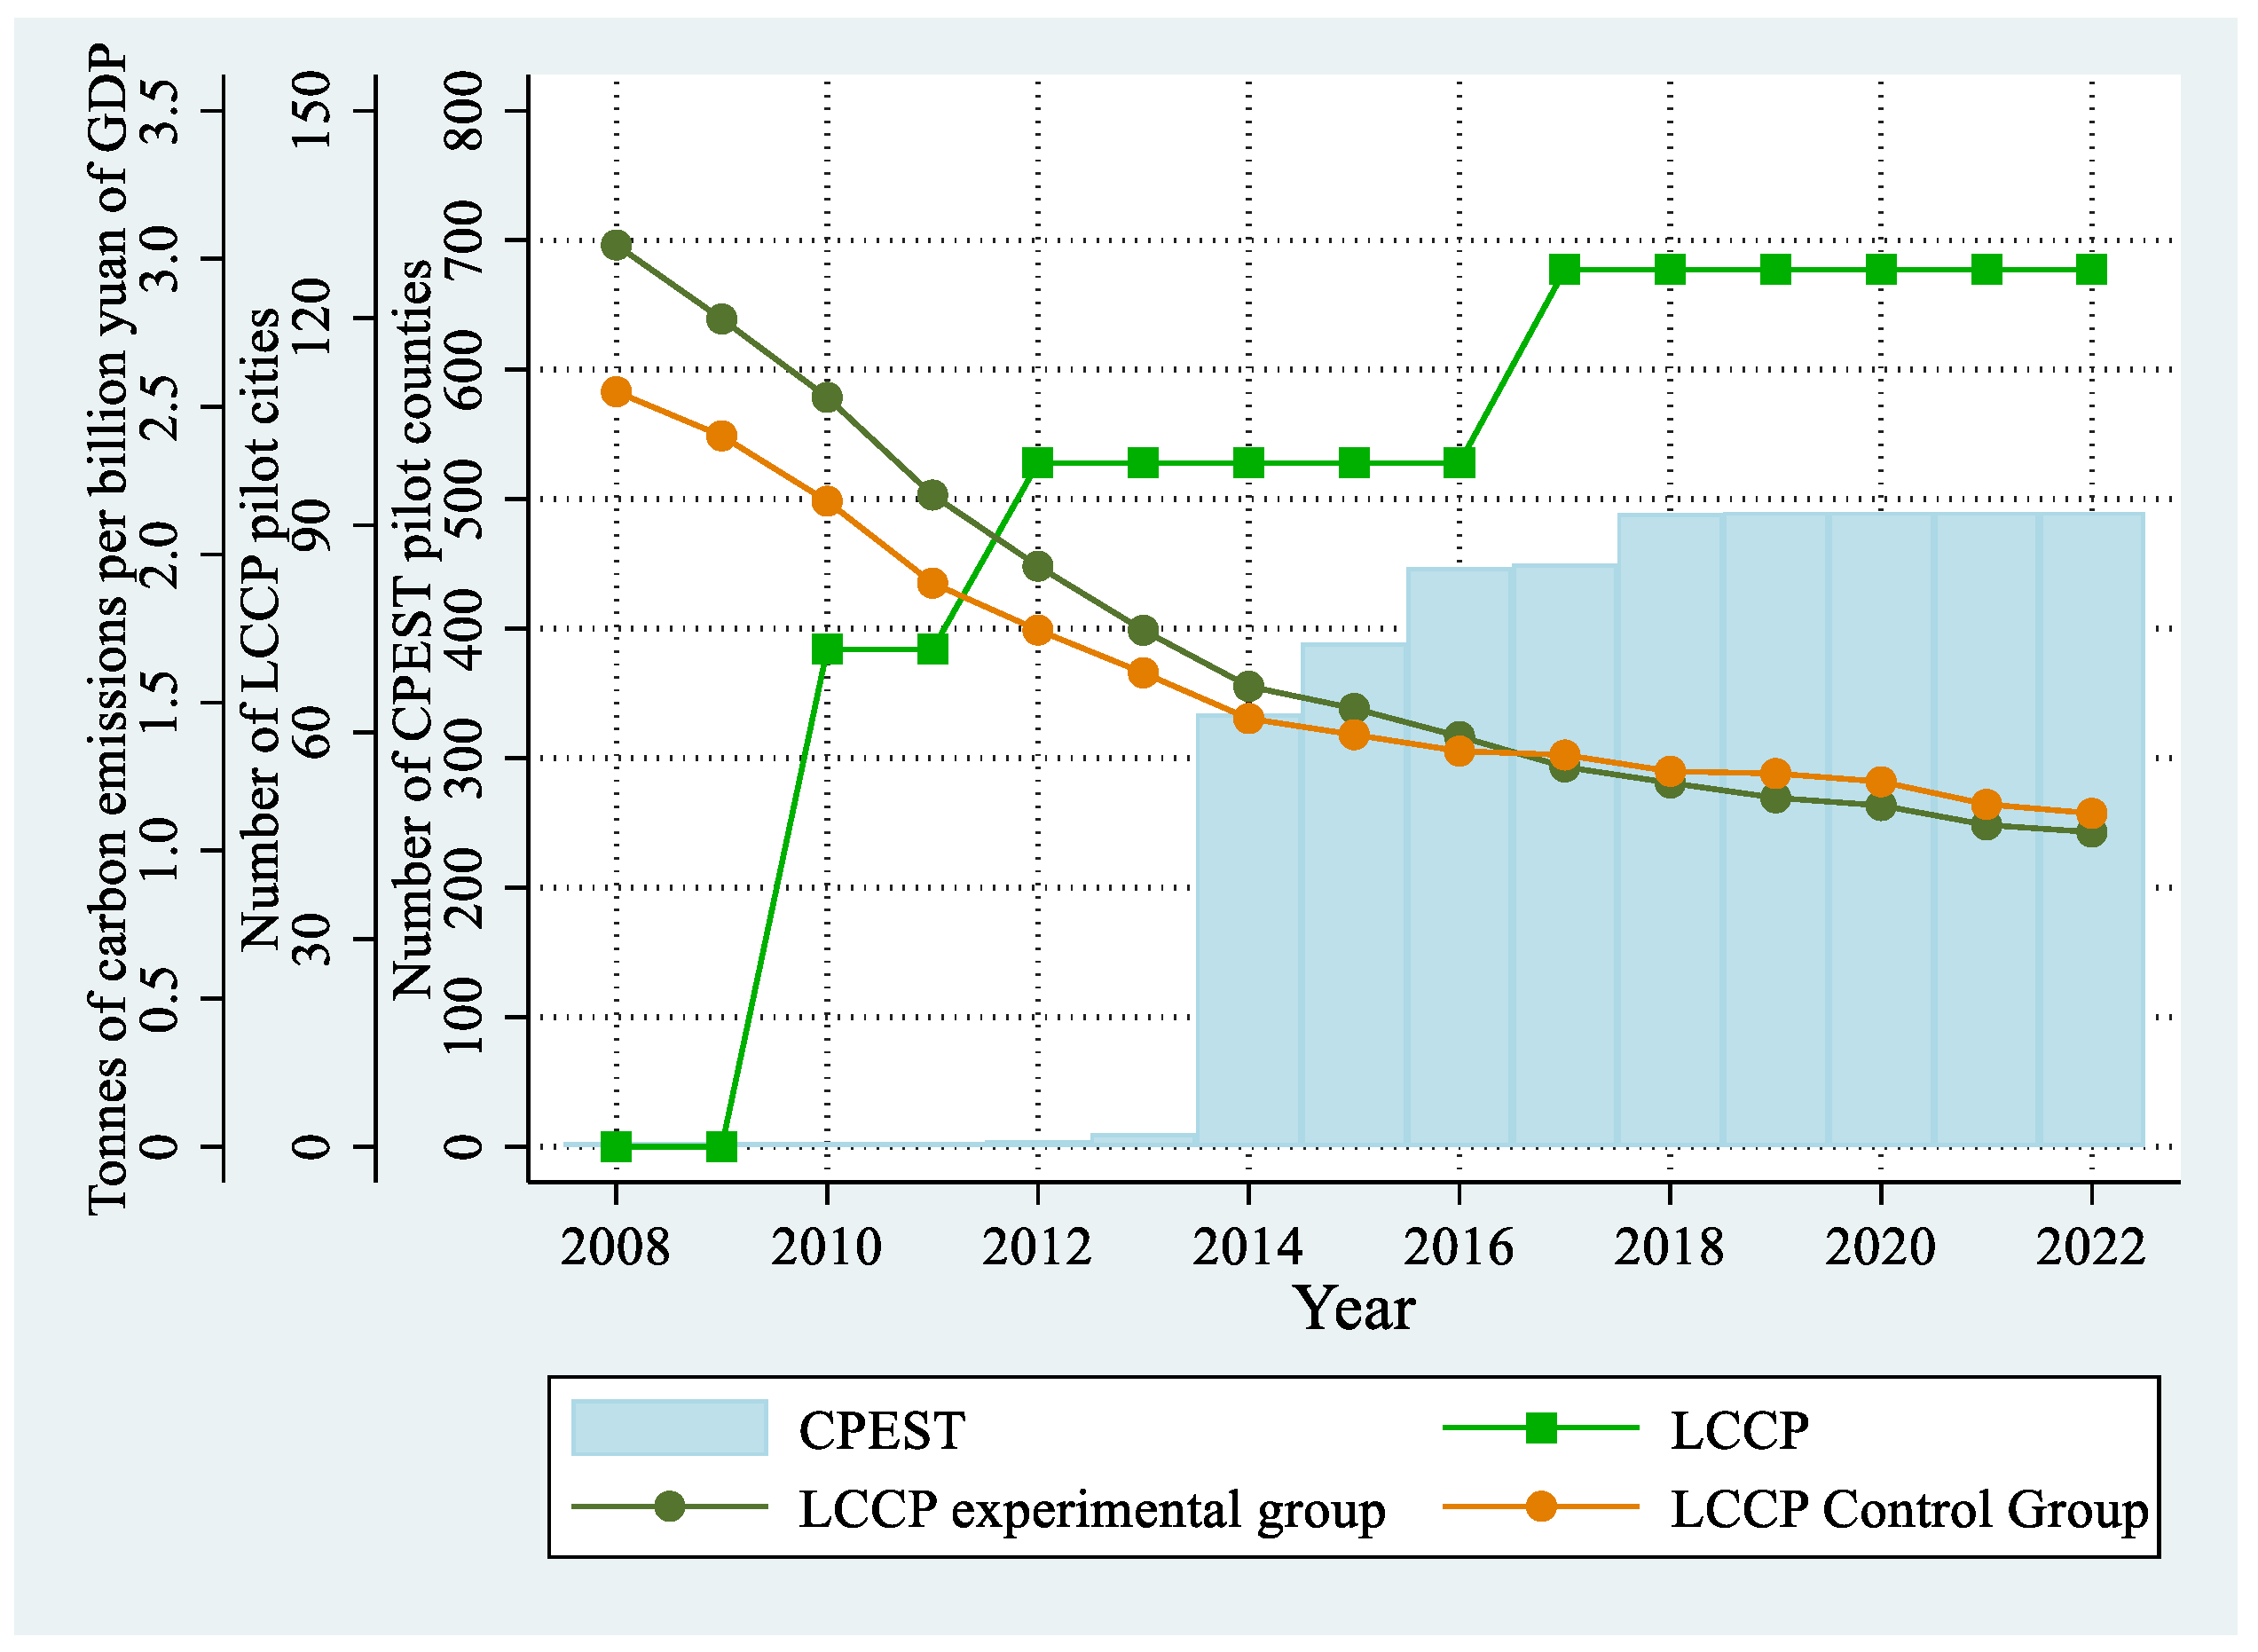
2.1.3. Stylized Facts

Figure 1 illustrates the implementation of these two policies and the levels of carbon emissions from 2008 to 2022. During this period, the number of cities implementing the LCCP gradually increased to 127. The number of counties implementing the CPEST began to rise rapidly after 2014, reaching a total of 490. The counties in the LCCP experimental group experienced a faster reduction in carbon emissions per unit of GDP, and after 2017, their emissions began to fall below those of the control group. This preliminary evidence suggests that the LCCP is effective and warrants further investigation.

2.2. Theoretical Framework and Hypothesis
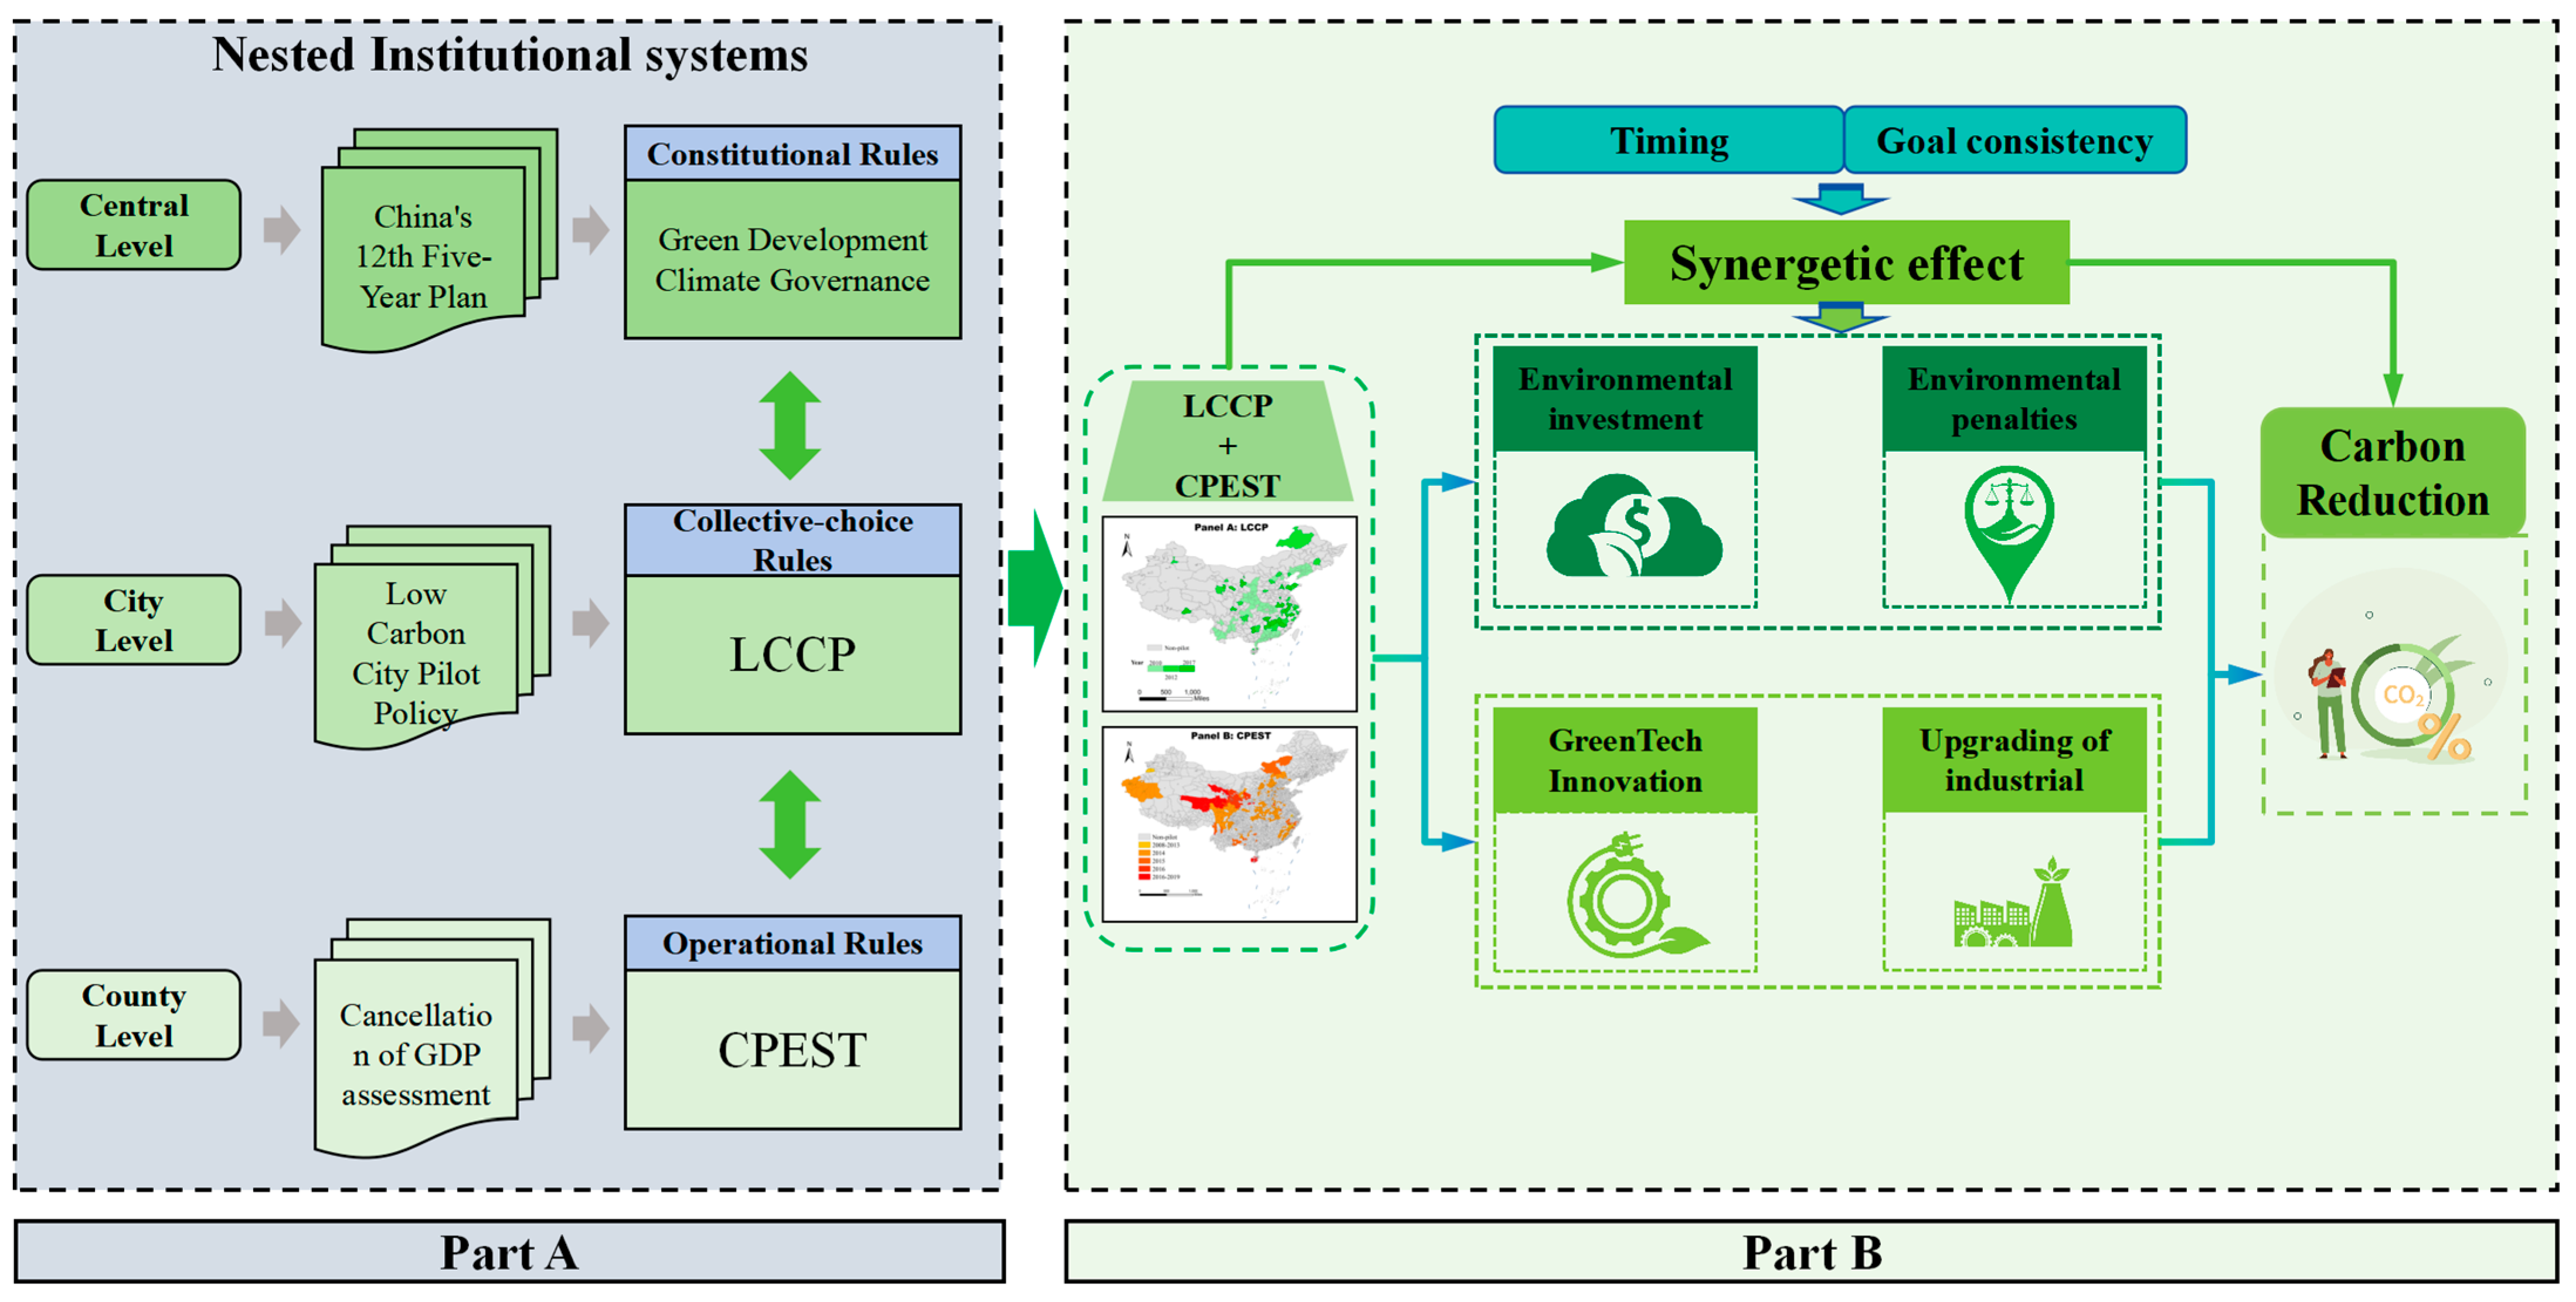
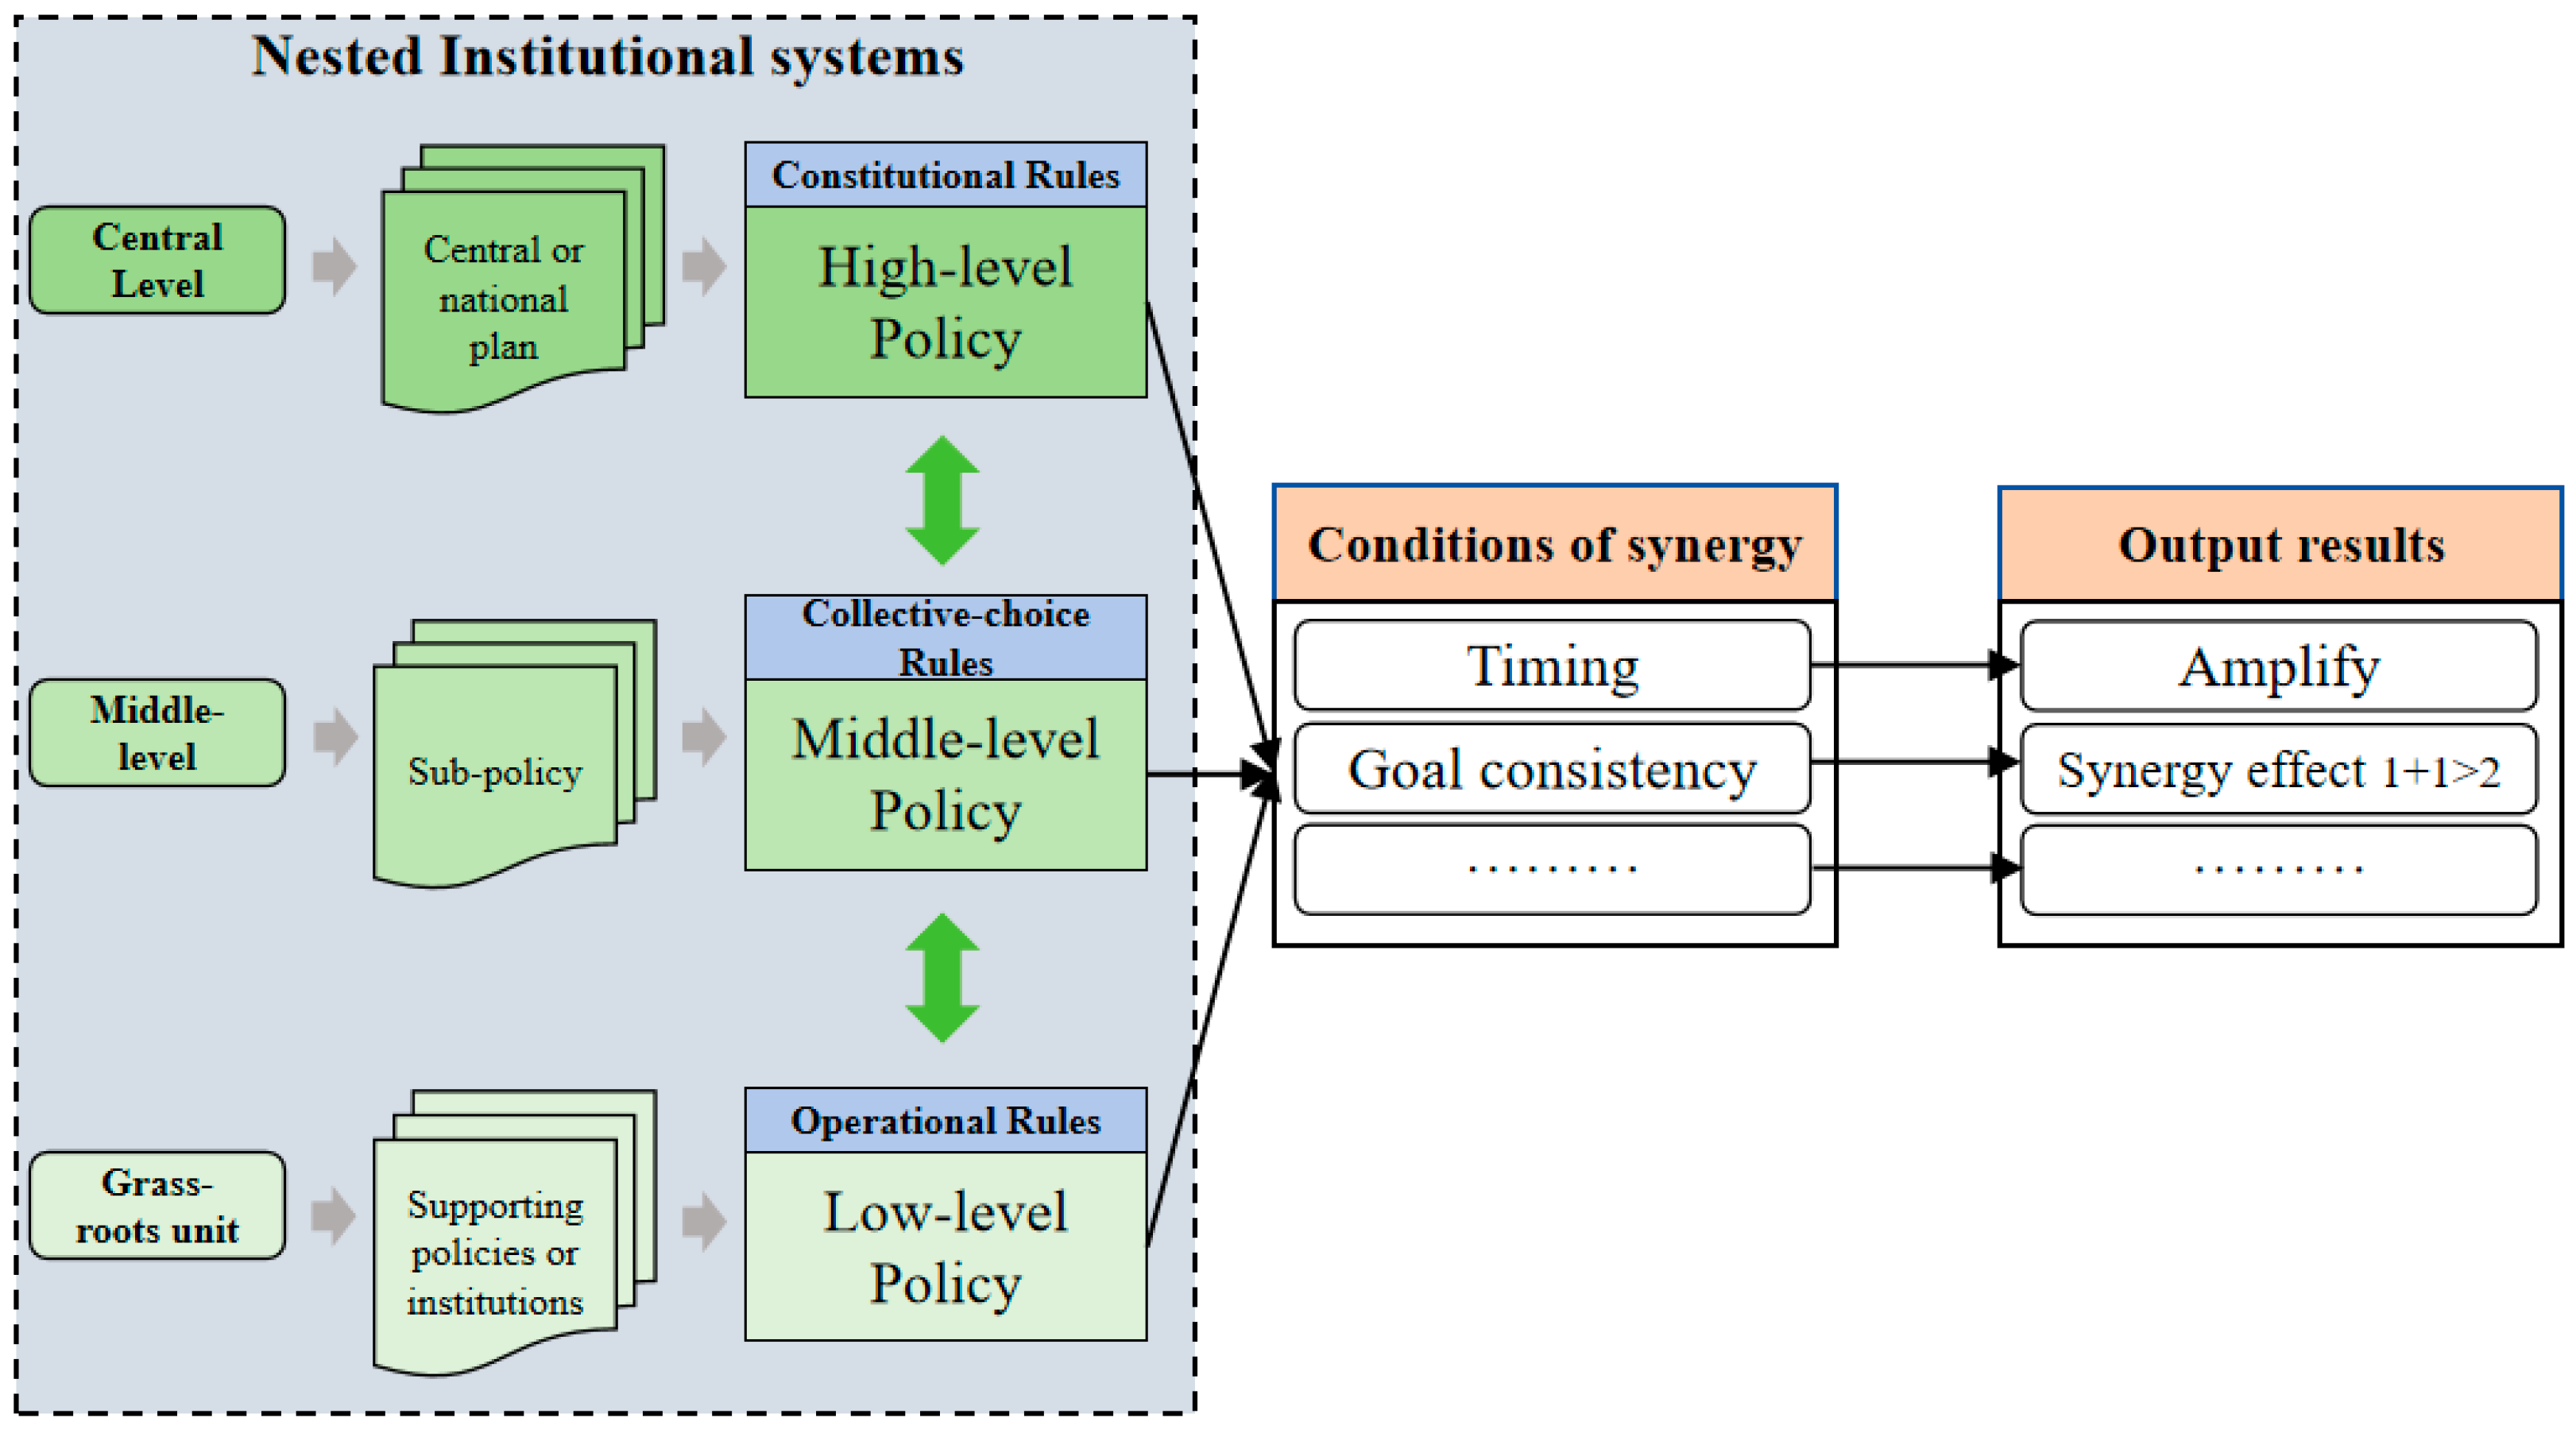
2.2.1. Framework

Top-down and bottom-up approaches represent two important pathways for understanding public policy implementation, each with its inherent limitations. However, the Institutional Analysis and Development (IAD) framework offers a comprehensive approach that effectively integrates these two perspectives [20]. According to O’Toole, public policy is fundamentally an institutional arrangement. The IAD framework encompasses three analytical levels, allowing it to transcend the aforementioned perspectives and offer a more comprehensive analysis of policy implementation activities [31].
At the macro level, constitutional rules occupy the highest tier, serving as a top-level framework that provides legitimacy and directional guidance for the lower-level institutions. The green development strategy and climate governance goals outlined in China’s “12th Five-Year Plan” constitute the constitutional rules. At the meso level, collective-choice rules serve as a bridge between the upper and lower levels. They are responsible for transforming overarching concepts or frameworks into actionable plans and determining the decision-making authority of the actors [20]. The LCCP is a specific action plan implemented at the city level to achieve climate governance goals. It further refines the constitutional rules and provides guidance for the institutions at the next level and the carbon reduction activities of the actors. At the micro level, operational rules directly influence the decisions of actors in specific contexts and determine the practical effectiveness of higher-level rules. They primarily alter actor behavior through incentive mechanisms, ultimately affecting the outcomes of actions [20]. The CPEST represents changes in the incentive systems and mechanisms for lower-level officials, and it will influence the implementation effectiveness of the LCCP within the institutional framework. In summary, by utilizing the nested institutional theory, we have integrated the LCCP and CPEST into the same framework, as shown in Figure 2 Panel A. This provides a foundation for analyzing their interaction and formulating hypotheses.

2.2.2. Hypothesis

Institutions at different levels can interact to form combinations or nesting, creating an institutional system that generates new efficiencies [32]. Although the LCCP is directly mandated by the central government for implementation in select cities, it has not introduced any fundamental changes to the performance evaluation of local officials [3]. As a result, the execution of the LCCP at the county level is often undermined by goal conflicts (between climate governance and economic development), which weakens its effectiveness [28]. Research on nested institutions indicates that when institutions at different levels exhibit inherent complementarities, the outcomes generated by the institutions are enhanced [33,34]. Alexander contends that inter-organizational collaboration arises not spontaneously but through “institutionalized cooperation”, exemplified by common goal-setting [35]. The CPEST has shifted the focus of county-level governments away from an overemphasis on economic growth, which has helped to create common climate goals between upper and lower levels of government and significantly reduced goal conflicts. This evidently enhances the complementarities within the nested institutional structure, allowing for more effective implementation of the LCCP at the county level. Based on this, we propose the following hypothesis:
Hypothesis H1:
The LCCP and CPEST can interact through the nested institutional system, thereby amplifying the effectiveness of carbon reduction policies.
How do institutions at different levels interact? Lower-level institutions are nested within higher-level institutions, and as such, lower-level institutions are more susceptible to the influence of higher-level systems [20]. Since changes at higher-level institutions exert a greater influence, the costs and difficulties associated with such changes are correspondingly higher. Once a change occurs at a higher level, it often influences the rule-making at lower levels, thereby altering performance outcomes [21]. It is evident that a key variable in this process is time. The temporal sequence of policies is crucial, as supplementary policy tools at lower levels can enhance the effectiveness of policies at higher levels [21]. For a county, if the LCCP exists prior to the implementation of the CPEST, the latter will be influenced by the former, leading to an increased emphasis on environmental performance in the evaluation. Conversely, the CPEST may place greater focus on objectives such as poverty alleviation and agriculture. According to our statistics, in regions where the LCCP was implemented prior to the CPEST, 66% of counties chose ecological priority as the new incentive direction. In contrast, in regions where the LCCP was implemented after the CPEST, this figure was 26%. Based on this, we propose the following hypothesis:
Hypothesis H2:
Lower-level institutions are constrained by higher-level institutions, and the implementation of the LCCP prior to the CPEST can better amplify the effects of policy execution.
Higher-level institutions also rely on operational-level institutions to fulfill their functions, as rules related to incentives, decision-making, and other mechanisms at the operational level can easily render higher-level institutions ineffective [21]. In policy implementation, the incentive system has a significant impact on the behavior choices of policy implementers. Policy failure can be seen as a consequence of the malfunctioning of the incentive system [36]. For instance, due to the incompatibility between policy goals and the incentive mechanisms of grassroots governments, many carbon reduction policies in China remain confined to political processes without yielding tangible results [4]. To achieve synergistic effects, the objectives of policy tools must at least be free of contradictions or conflicts [25]. Goal-Framing Theory states that a change in goals dominates individual and organizational actions [37]. The elimination of GDP assessment, which signifies a shift in the Gain Goal Framework, has reduced the intensity of officials’ economic development efforts. If the newly established Gain Goal is closely tied to environmental objectives, carbon reduction efforts will be intensified, thereby enhancing the policy impact of the LCCP. According to our statistics, there are approximately four types of incentive rules in the CPEST: poverty alleviation priority, agriculture priority, ecological priority, and no strong incentive objectives. The ecological priority incentive rule exhibits the optimal synergy with the LCCP. Therefore, it can be anticipated that the synergistic effect between the LCCP and CPEST will be strongest under the ecological priority incentive rule, while the synergy under the other incentive rules will be relatively weaker. Based on this, we propose the following hypothesis:
Hypothesis H3:
The synergy between higher-level and lower-level institutions is influenced by goal alignment. When the incentive rules in the CPEST align with the LCCP, they are more likely to generate stronger synergistic effects.
Through which mechanisms does the LCCP and CPEST combination achieve carbon reduction? The two primary pathways are government governance mechanisms and market mechanisms. Institutional economics theory posits that markets generally face issues such as information asymmetry, externalities, and the provision of public goods, and therefore require government intervention to address market failures. Environmental regulation is a key tool for the government in climate governance, encompassing legislation, increased investment in environmental protection, and stringent penalties [38]. The LCCP has also been confirmed to adopt robust environmental regulation [28], but its effectiveness is constrained by the political will for stringent enforcement [22]. By reducing the weight of GDP indicators and increasing the weight of environmental protection indicators, it has proven effective in curbing carbon emissions at their source [39]. Therefore, we hypothesize that the implementation of the CPEST can amplify the effectiveness of the mandatory tools within the LCCP. In summary, this paper proposes Hypothesis H4:
Hypothesis H4:
The combination of the LCCP and CPEST can reduce carbon emissions by augmenting environmental investments and reinforcing environmental penalties, with a greater effect than the implementation of the LCCP alone.
The market mechanism represents another avenue for reducing carbon emissions. The Environmental Kuznets Curve (EKC) suggests that advancements in green technologies and the upgrading of industrial structures are key pathways to improving environmental quality [40]. An important objective of the LCCP is to foster the development of green technologies and adjust the industrial structure, thereby achieving a continuous reduction in carbon emissions. Existing studies also indicate that the LCCP has indeed facilitated green technological innovation and industrial structural upgrading [41,42]. However, under the context where local officials prioritize economic indicators, the policy effectiveness of the LCCP tends to deteriorate significantly [43]. This is primarily because heavily polluting industries make substantial contributions to local GDP growth, and for economic reasons, local officials are often reluctant to impose excessive interventions [44]. CPEST can significantly mitigate the economic indicator bias of officials, thereby enhancing the channeling effect of the LCCP on technological innovation and industrial upgrading. In light of this, the present study proposes the following hypothesis H5:
Hypothesis H5:
The combination of the LCCP and CPEST can reduce carbon emissions by promoting green technology innovation and accelerating industrial structural upgrading, with a greater effect than the implementation of the LCCP alone.
In summary, the research framework of this study is illustrated in Figure 2.

3. Methods and Data

3.1. Identification Strategy

We use a staggered difference-in-differences (Staggered DID) approach to identify the treatment effects of the LCCP, CPEST, and their synergistic impact. This method divides the samples into experimental and control groups based on whether they are exposed to the policy shock. It estimates the policy treatment effect by analyzing the changes in variables before and after the policy shock. First, we estimate the treatment effects of the LCCP and CPEST separately. Next, counties that simultaneously implement both the LCCP and CPEST are considered the treatment group, while the remaining counties serve as the control group to estimate the synergistic effect. The model is specified as follows:
C E   i t = α + θ 1 D i t L CCP + η X i t + δ i + γ t + μ i t
C E   i t = α + θ 2 D i t C P E S T + η X i t + δ i + γ t + μ i t
C E   i t = α + θ 3 D i t L C C P + C P E S T + η X i t + δ i + γ t + μ i t
In Equations (1)–(3), C E   i t represents the carbon emission intensity of County i in year t . D i t L C C P is a policy dummy variable, which equals 1 if County i implements the LCCP in year t or thereafter, and 0 otherwise. D i t C P E S T is also a dummy variable, which equals 1 if County i implements the CPEST in year t or thereafter, and 0 otherwise. D i t L C C P + C P E S T is a dummy variable representing the combination of the LCCP and CPEST. It equals 1 if County i implements both the LCCP and CPEST simultaneously in year t , and 0 otherwise. X i t represents a series of control variables. δ i denotes county fixed effects, γ t represents year fixed effects, and μ i t is the random error term. θ 1 and θ 2 are the treatment effects of the LCCP and CPEST, respectively, while θ 3 represents the synergistic effect of both.
To further identify the mechanism, the following triple difference-in-differences (DID) model is designed [22,44]:
C E   i t = α + φ D i t L C C P + C P E S T × M i t + η X i t + δ i + γ t + μ i t
In Equation (4), M i t represents each of the mediating variables, while the remaining parameters are consistent with those described above.

3.2. Variables and Data

3.2.1. Dependent Variable

To mitigate the impact of economic scale and remain consistent with existing studies [45,46,47], we measure the carbon emission intensity (CE) using carbon emissions per billion GDP (measured in hundred thousand tons). This is also the carbon performance indicator that the Chinese government has committed to and focuses on [28]. To mitigate heteroscedasticity issues [48], we applied a natural logarithm transformation.

3.2.2. Independent Variable

The independent variable in this study is defined as follows: If County i implements the LCCP in year t , a value of 1 is assigned for year t and subsequent years; otherwise, a value of 0 is assigned. If County i implements the CPEST in year t , a value of 1 is assigned for year t and subsequent years; otherwise, a value of 0 is assigned. The synergistic effect is measured using the interaction term between the two variables.

3.2.3. Mechanism Variables

The mechanism variables include environmental investment (EI), environmental penalties (EP), green technological innovation (GTI), and upgrading of industrial structure (UIS). Environmental investment is measured by the proportion of environmental expenditure to total fiscal expenditure. Due to missing data at the county level, we use environmental expenditure at the city level, weighted by the ratio of county fiscal expenditure to city fiscal expenditure. Environmental penalties are measured by the ratio of the number of environmental penalty cases (cases) to the number of employees in the secondary industry (thousand persons). Green technological innovation is measured by the logarithm of the number of green patent applications. The number of patent applications at the county level is obtained by cleaning patent data from the patent database based on green patent classification codes, following the existing studies [49]. Upgrading of the industrial structure is measured by the cosine angle between the unit vectors of the primary, secondary, and tertiary industries [50].

3.2.4. Control Variables

Building on related studies [23,51], this paper controls for the following economic, policy, and geographical factors. Economic factors include the following: (1) The local economic development level (Lnpgdp), measured by the natural logarithm of per capita GDP at the county level. (2) Government fiscal capacity (Lnfina), measured by the natural logarithm of fiscal revenue at the county level. (3) Population density (Popdens), measured as the ratio of the county’s population to its total area. (4) Urban–rural coordination level (Coor), defined as the ratio of urban to rural residents’ income. (5) Industrial structure (Indus), measured by the natural logarithm of the number of employees in the tertiary sector. (6) Electricity consumption (Lnelec), measured by the natural logarithm of total electricity consumption in society. (7) Digital infrastructure (Dig), measured by the number of fixed-line telephone users (per 1000 households). The policy mainly controls the influence of the national key ecological function zone policy (Eco). We reference the 676 counties announced by the national environmental protection department in 2007 and 2016, assigning a value of 1 to those included in the year of announcement and subsequent years, and a value of 0 to others. In terms of geographical factors, we control for the slope (Slope), measured as the ratio of average slope to county area. Drawing on related research [52], we interact the geographical variables with time trend terms to mitigate the estimation limitations of time-invariant variables in panel data, while simultaneously controlling for time trends.

3.2.5. Data Sources

By integrating multiple data sources, we have compiled a dataset covering 1578 counties in China from 2008 to 2022, spanning 289 cities across the country. The carbon emission data originate from the Emissions Database for Global Atmospheric Research (EDGAR, https://edgar.jrc.ec.europa.eu, accessed on 5 September 2024). After cleaning the raw data, we obtained the annual carbon dioxide emissions for each county. The explanatory variables and policy control variables were compiled by the author team from official government documents. Some of the mechanism variable data come from the “China City Statistical Yearbook”, the Peking University Legal Information Institute (PKULaw, https://www.pkulaw.com, accessed on 15 September 2024) database, and the patent database of the China National Intellectual Property Administration. The data for county-level economic variables come from the “China County Statistical Yearbook”, provincial statistical yearbooks, county-level national economic and social development statistical bulletins, and the EPS statistical platform. The geographical variables come from NASA ASTER. A small amount of missing data is filled in using linear interpolation. Descriptive statistics for the main variables can be found in Supplementary Material Section S1.1. The data treatment of carbon emissions and green patents can be viewed in Supplementary Material Section S1.2.

4. Empirical Results

4.1. Benchmark Regression

Table 1 reports the estimation results. Columns (1) to (3) exclude control variables, while columns (4) to (6) include control variables. Overall, whether considering individual policies or their combination, both significantly reduce carbon emissions. The results in column (4) indicate that the LCCP significantly reduced CE by 0.0396 units, which implies an average reduction of 25.5% in CE (0.0396/0.1554 = 0.2548). The results in column (5) show that the CPEST also significantly reduced carbon emissions, leading to an average decrease of 22.07% in CE (0.0343/0.1554 = 0.2207). The results in column (6) indicate that after the combination of the LCCP and CPEST, the carbon reduction effect is significantly enhanced, leading to an average reduction of 44.92% in CE (0.0698/0.1554 = 0.4492). The definition of a synergistic effect refers to the situation where the overall effect exceeds the sum of the individual effects of each component. In the field of management, Ansoff symbolically represents this as “1 + 1 > 2” [53]. The above results indicate that the CPEST amplifies the policy effect of the LCCP by 1.763 times (0.0698/0.0396), thus confirming Hypothesis H1. However, the combined effect of the LCCP and CPEST is slightly lower than the linear sum of their individual effects (0.0698 < 0.0739), suggesting that the synergistic effect between the two has not yet fully materialized. The conditions under which the synergistic effect between the two may arise will be discussed further in the subsequent sections.

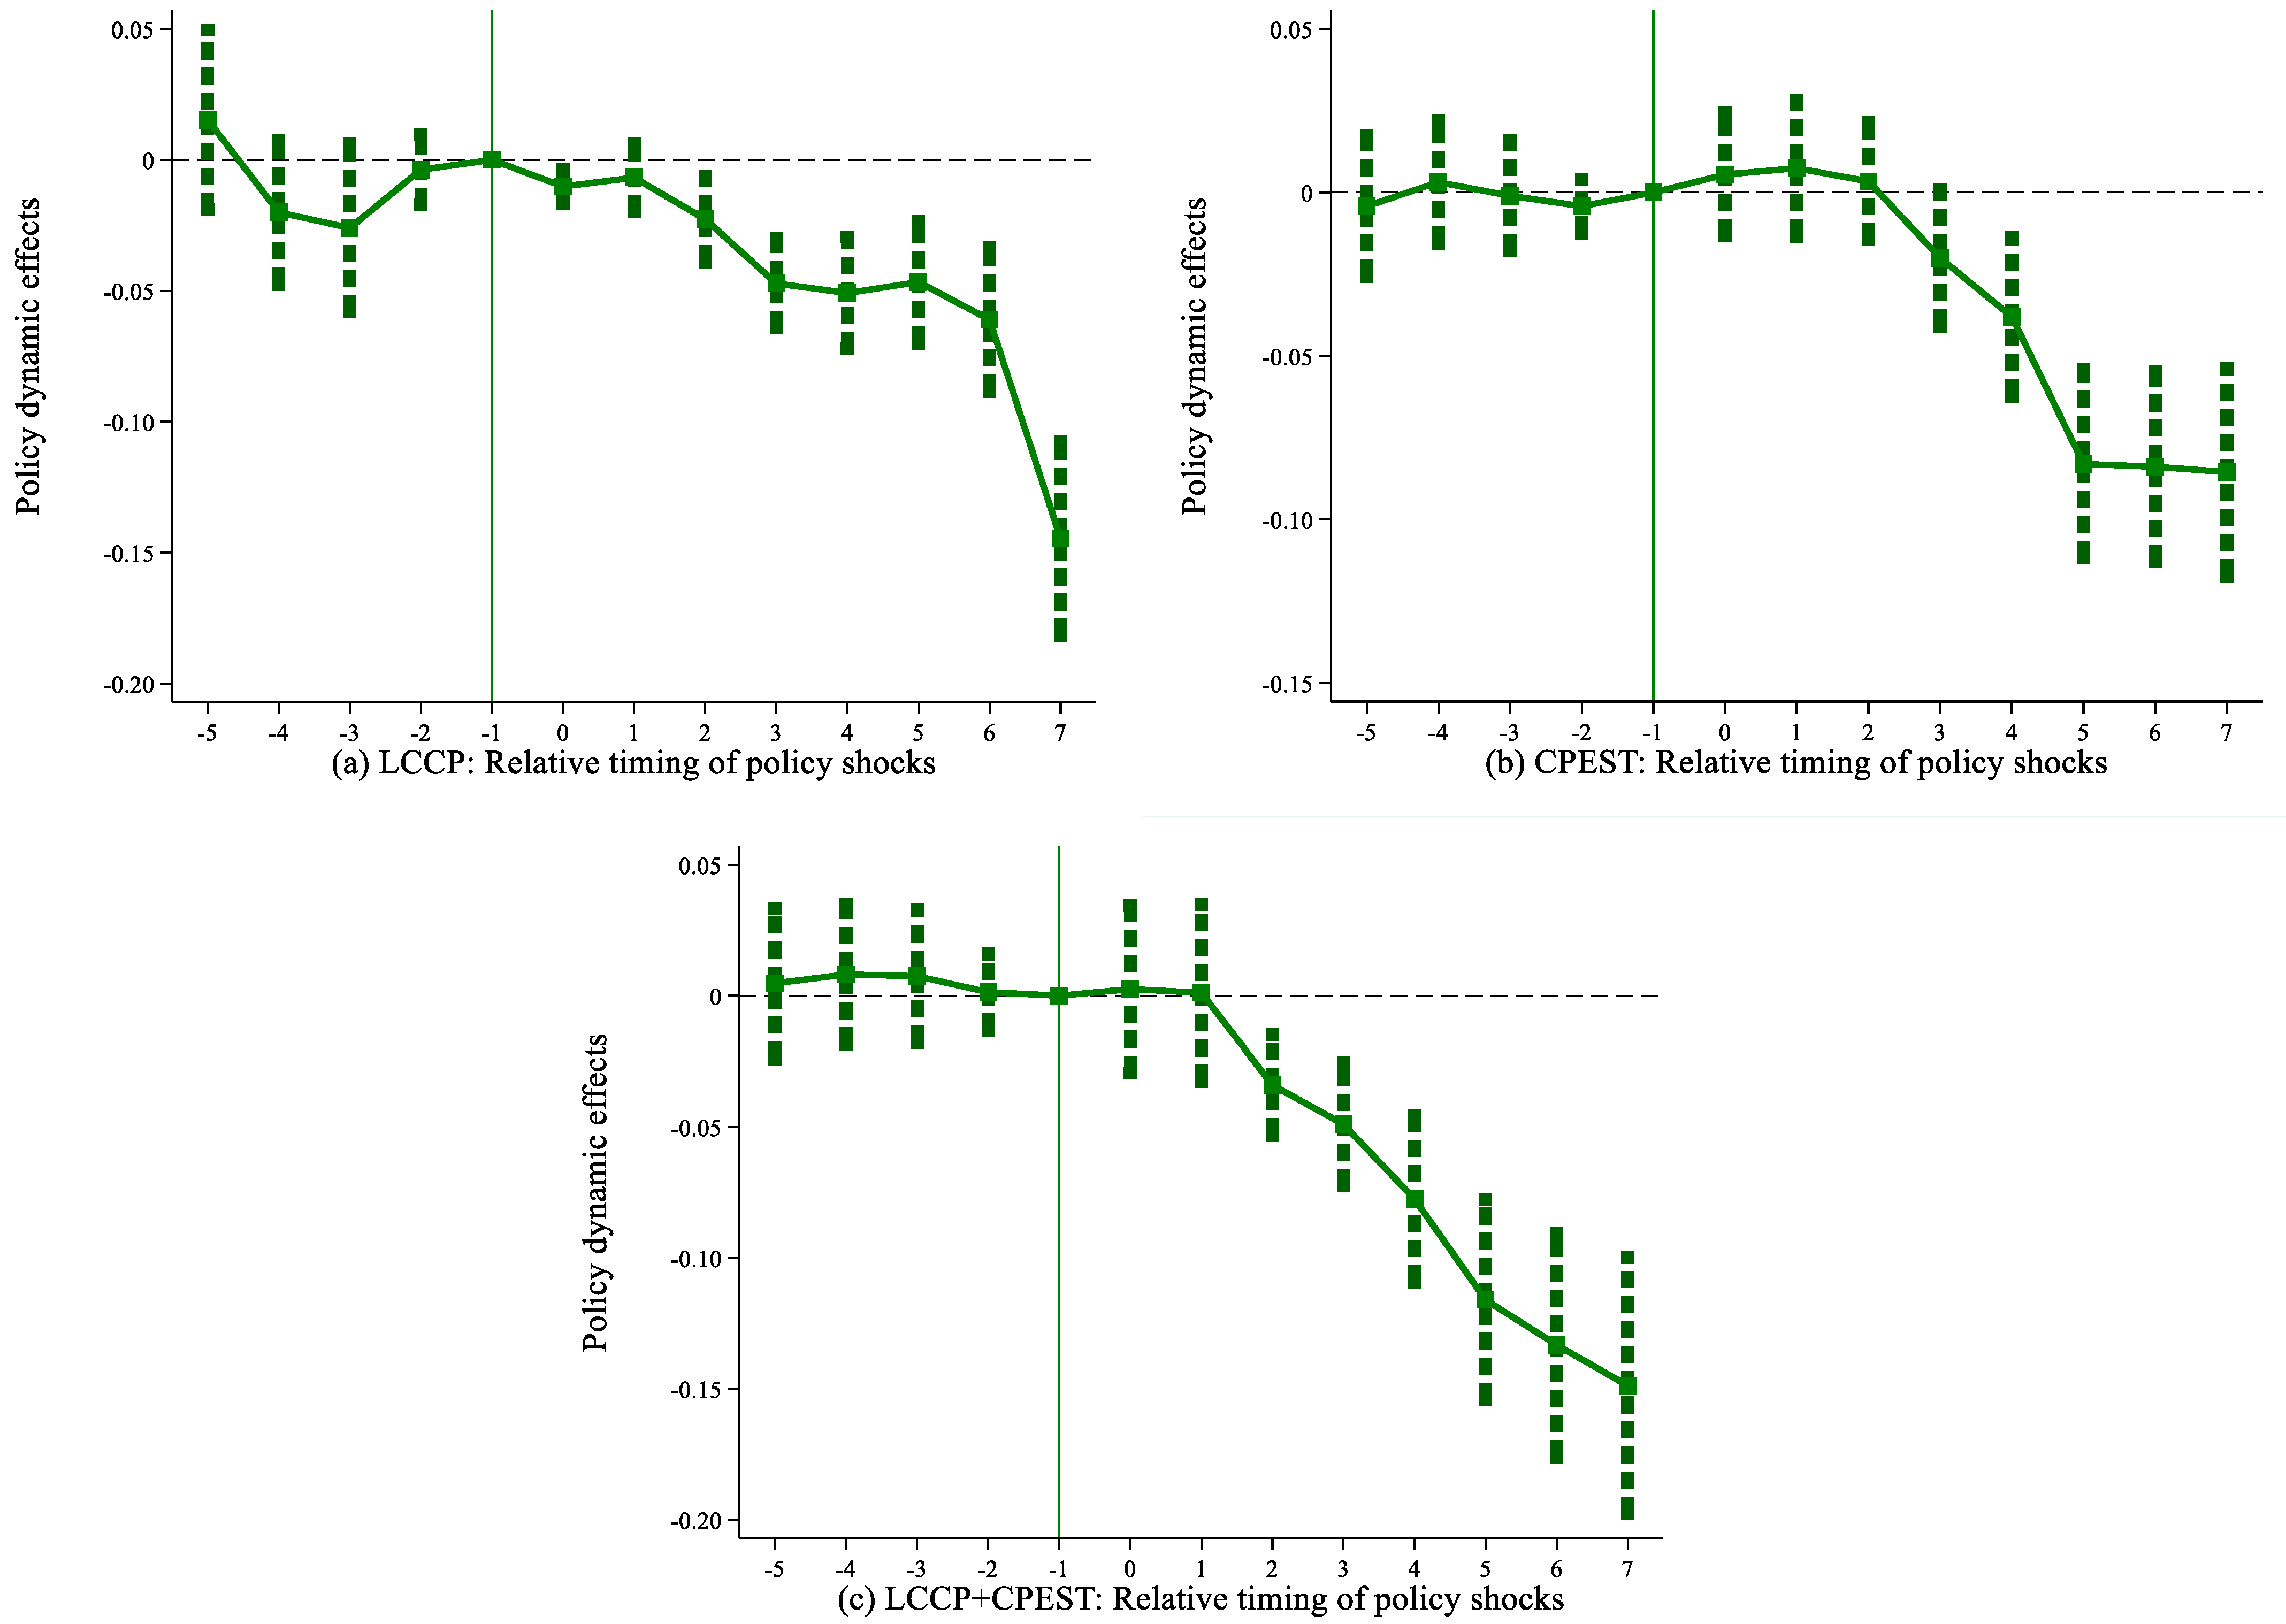
4.2. Parallel Trend Test
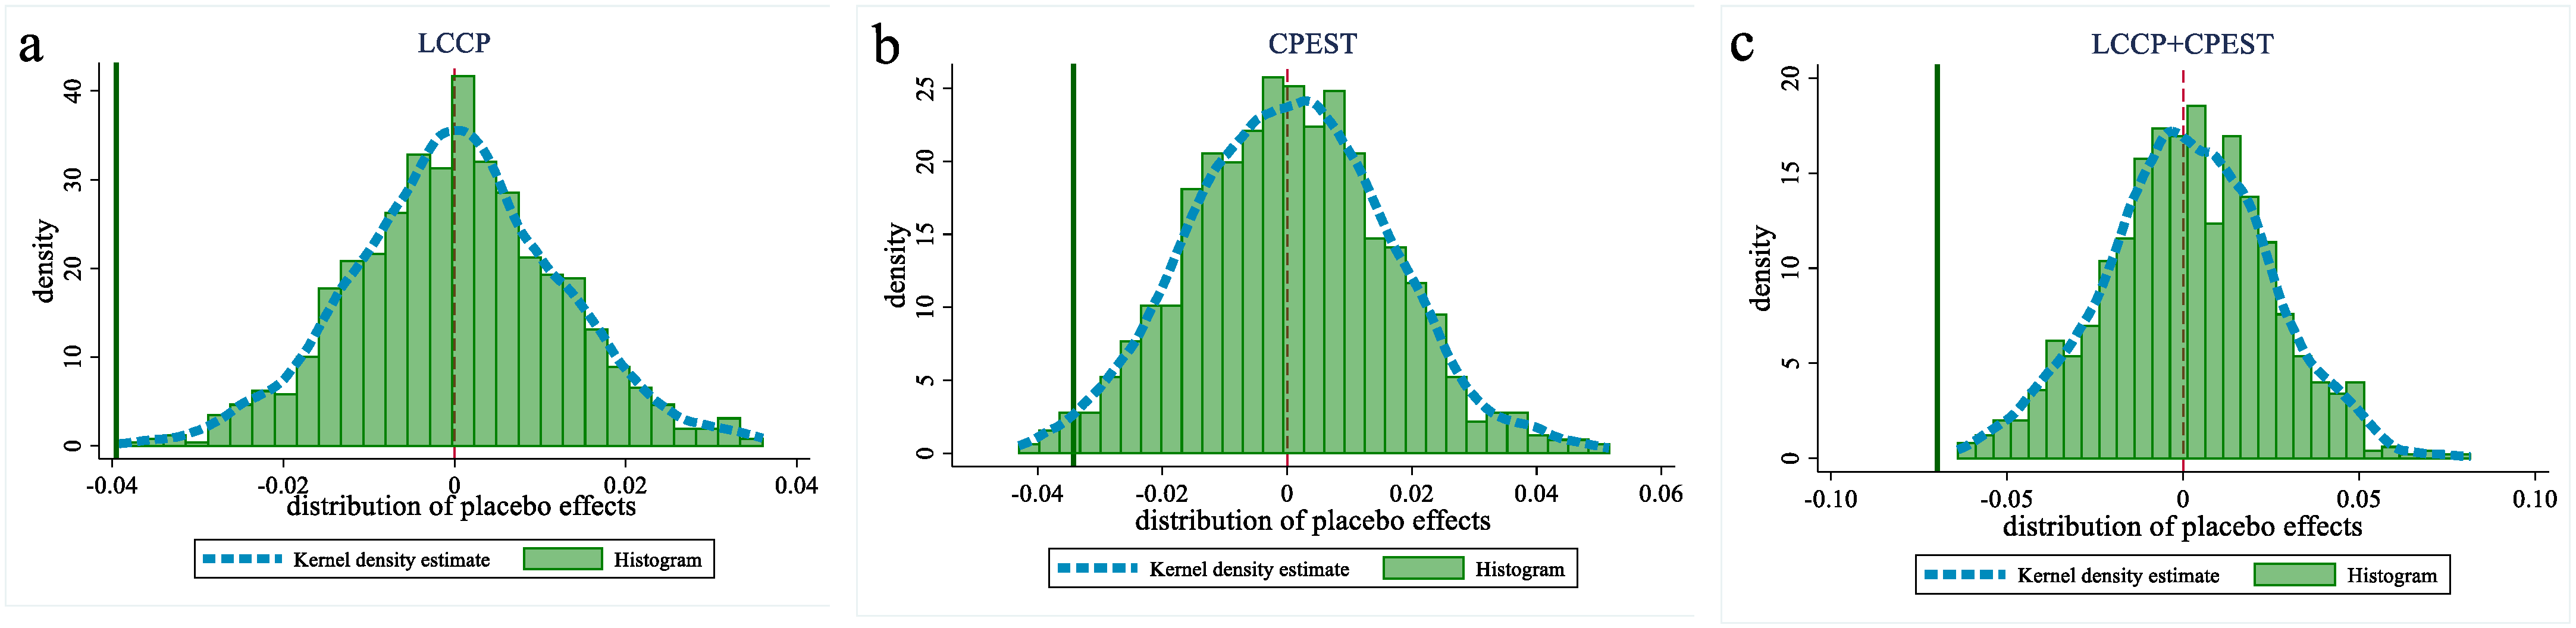
The validity of the staggered DID results depends on the parallel trends assumption. To validate this assumption, we set up the following model:
C E   i t = α + k = 5 7 β k D i t k + η X i t + δ i + γ t + μ i t
In Equation (5), D i t k represents a series of policy dummy variables in year k , including the LCCP, CPEST, and their combination. We use the year preceding the policy implementation as the baseline. The estimation results are shown in Figure 3. The results show that the estimated coefficients before the three types of shocks are not significant, whereas after the shocks occur, the carbon reduction effects begin to materialize. This suggests that the DID model we constructed is valid, and the benchmark regression results are established.
The traditional Staggered DID may face the heterogeneity problem and produce estimation bias. We test for parallel trends again using four types of heterogeneity-robust estimators. The results in Figure 4 indicate that, after eliminating potential estimation bias, the combination of the LCCP and CPEST still meets the parallel trend assumption.

4.3. Placebo Test

To rule out the interference of random factors, we conduct 1000 “time-space” mixed placebo tests, with the results shown in Figure 5. The true estimation results significantly deviate from the normal distribution curve, with left-sided p-values consistently less than 0.05. This indicates that the policy effect is not due to random chance, and the results are robust.

4.4. Robustness Test

4.4.1. Replacing the Dependent Variable

Since carbon emissions are closely related to air pollution, we substitute PM2.5 (particulate matter) as the dependent variable. The measurement method remains consistent with the previous approach. PM2.5 data are sourced from the M2TMNXAER_5.12.4 product provided by the Global Modeling and Assimilation Office (GMAO) of NASA. Following the algorithm of the existing research [54], PM2.5 data are aggregated at the district and county levels. Supplementary Material Section S2.1 shows that the estimation results are consistent with the benchmark regression.

4.4.2. Adjusting the Sample

Due to the impact of the COVID-19 pandemic in 2020, which led to a reduction in economic activity, the samples from 2020 to 2022 are excluded. In addition, we exclude regions with relatively strong or weak economic conditions, specifically Beijing, Tianjin, Shanghai, Chongqing, Guizhou, Xizang, Xinjiang, Gansu, and Qinghai. Supplementary Material Section S2.2 shows that the conclusions remain unchanged.

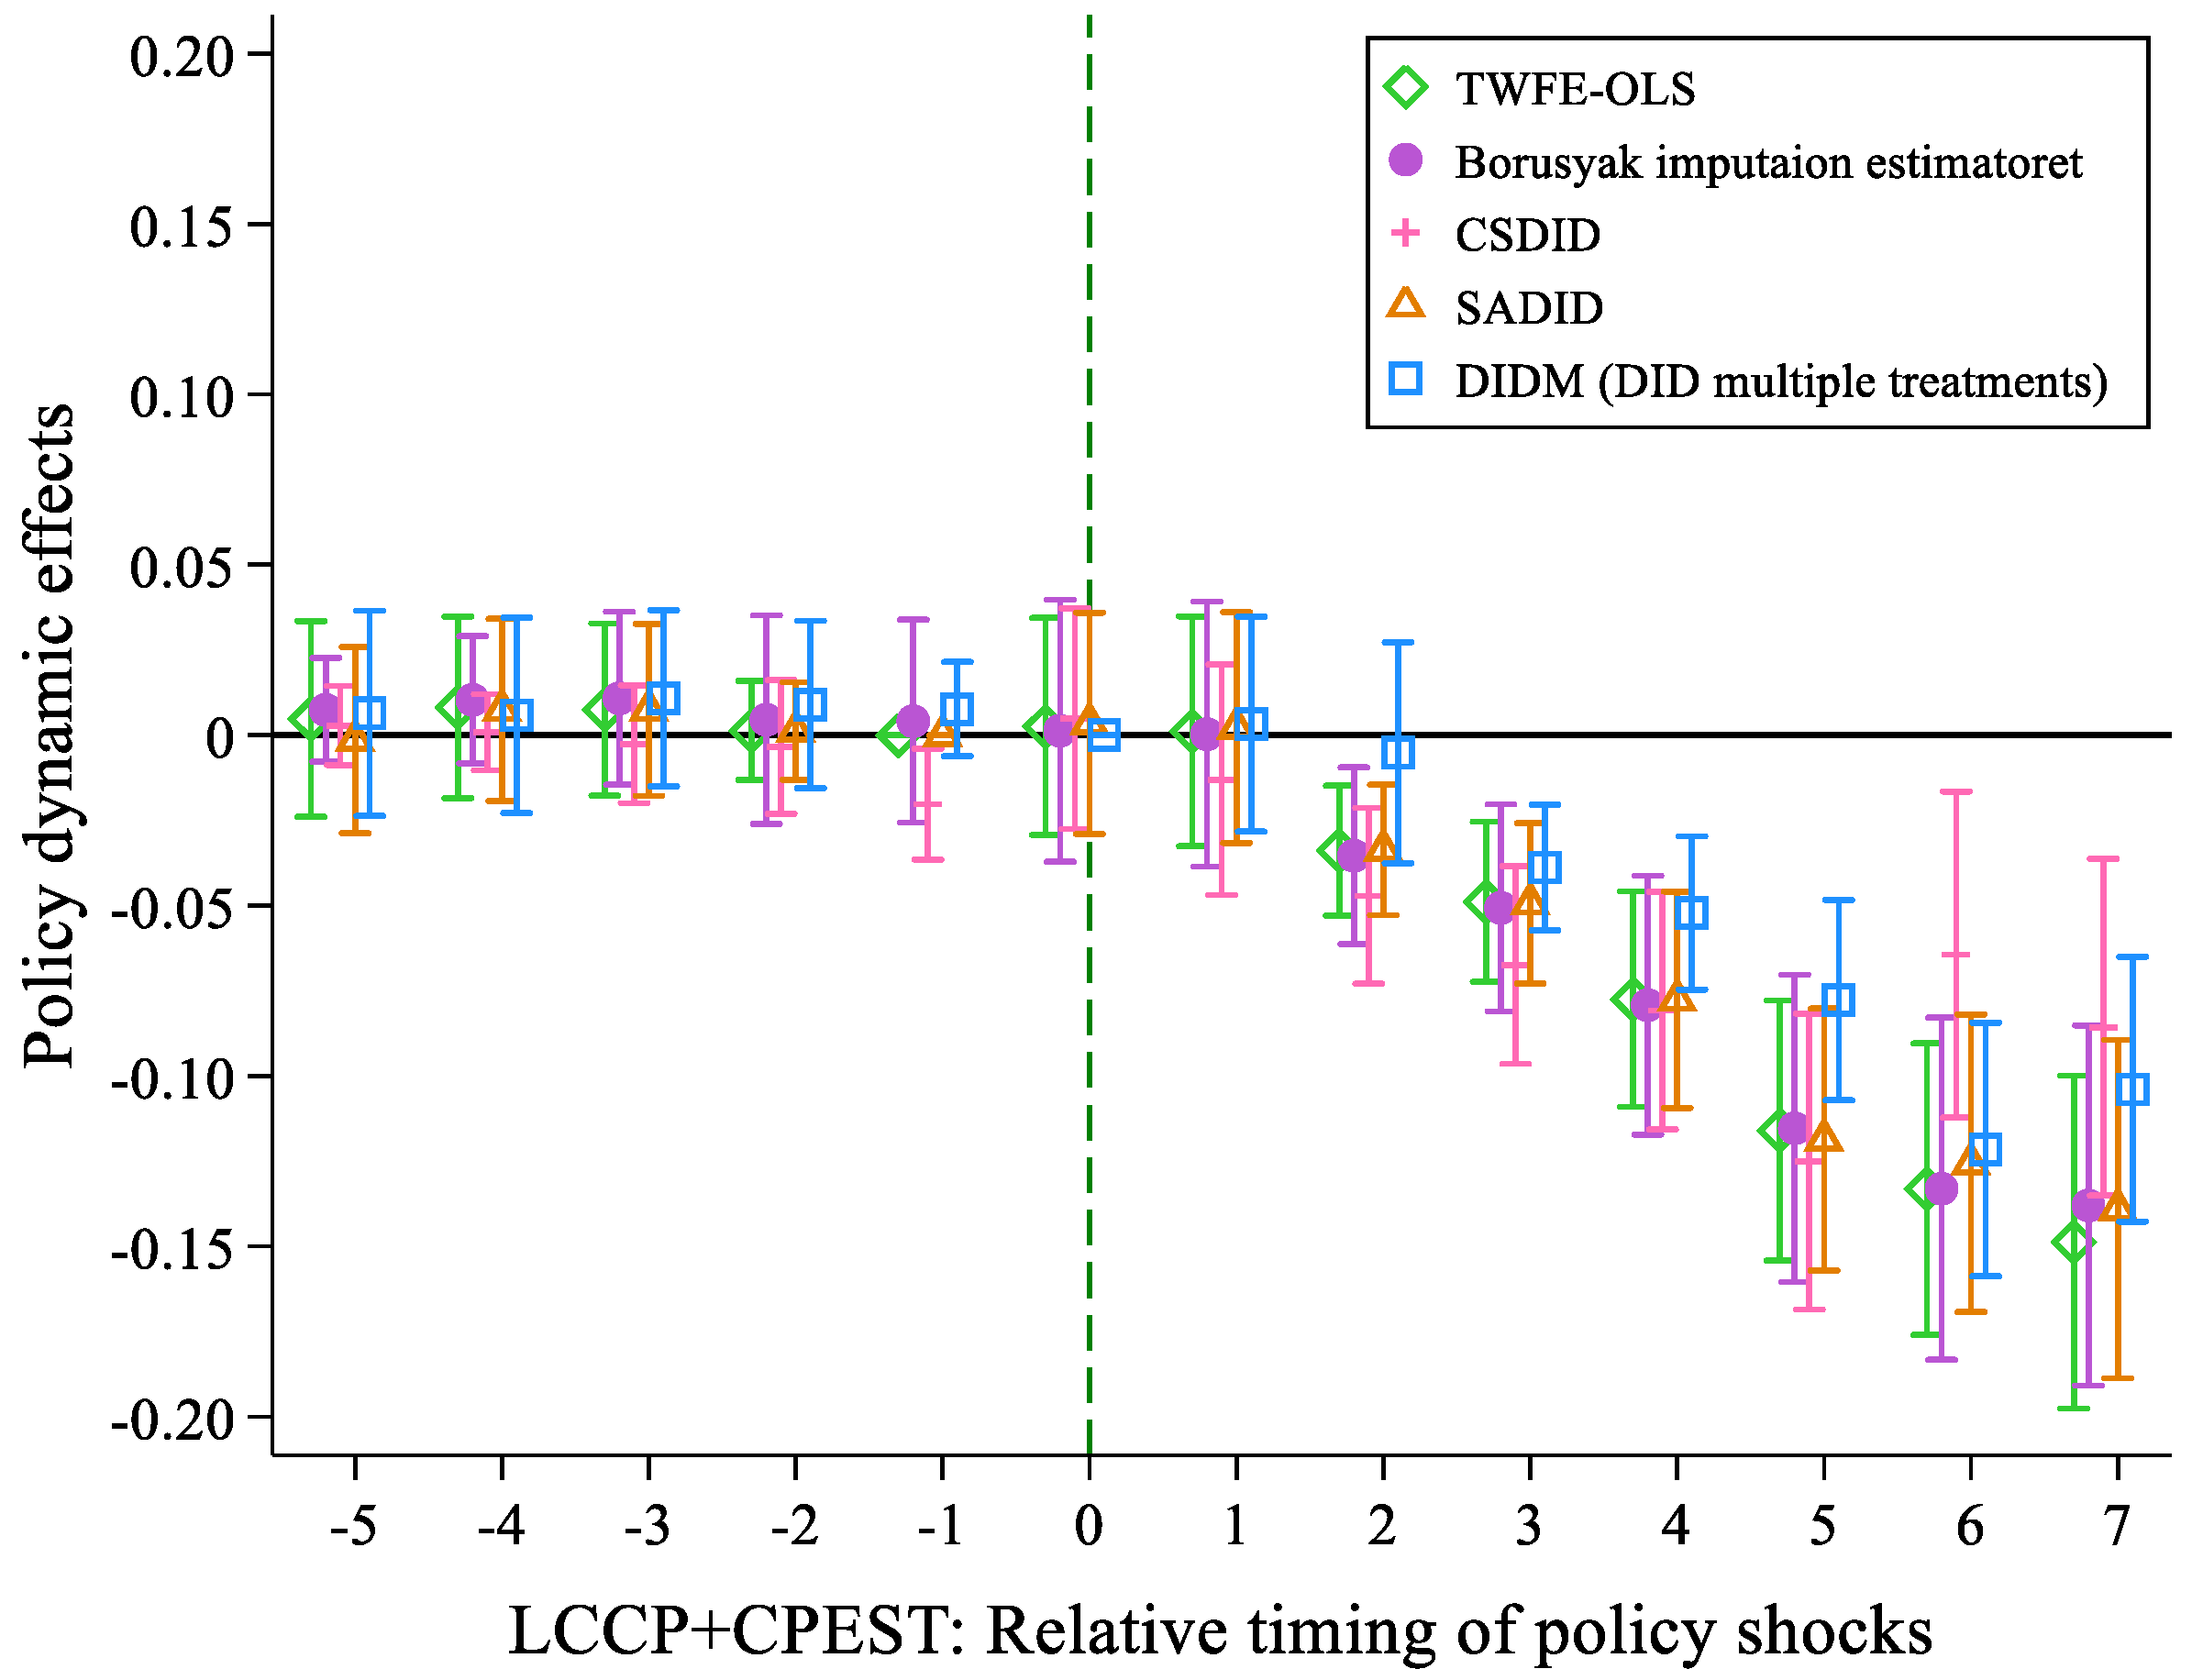
4.4.3. Considering Heterogeneous Treatment Effects

Research has shown that the staggered DID based on the two-way fixed effects (TWFE) model can produce estimation bias when dealing with heterogeneous treatment effects [55]. We re-examine the parallel trends assumption using the method proposed by Sun and Abraham [56]. Supplementary Material Section S2.3 indicates that the results remain robust.

4.4.4. Reducing Sample Bias

Due to potential systematic differences between the treatment and control groups, which could interfere with the results, we use the Propensity Score Matching (PSM) method to more appropriately assign control groups to the treatment group, followed by DID estimation. Based on the nearest-neighbor matching method, we allocate the new control group using two strategies: cross-sectional matching and year-by-year matching. Supplementary Material Section S2.4 shows that the conclusions remain unchanged.

4.4.5. Excluding the Interference of Related Policies

The carbon reduction effects of the LCCP and CPEST may also be influenced by other concurrent policies. We further control for five types of policies that may have an impact, with specific details provided in Supplementary Material Section S2.5. The estimation results remain consistent.

4.4.6. Considering Transportation and Natural Factors

We further control for transportation, vegetation, and temperature factors in the model. The regression results are provided in Supplementary Material Section S2.6, and the conclusions remain unchanged.

4.4.7. Using the Double Machine Learning Model

The traditional DID model may encounter the curse of dimensionality and model misspecification, whereas the double machine learning (DML) model can mitigate these issues by leveraging machine learning algorithms and semiparametric models. With reference to related studies [57], we construct the DML model for re-estimation. The model specification and results are provided in Supplementary Material Section S2.7, and the conclusions remain unchanged.

4.4.8. Using the Synthetic Difference-in-Differences Model

The DID model may suffer from estimation bias when the parallel trends assumption does not hold. We introduce the synthetic difference-in-differences (SDID) method to re-estimate the results under a relaxed parallel trends assumption. The results in Supplementary Material Section S2.8 show that the SDID estimation still supports the above conclusions.
In conclusion, after conducting robustness tests, our results remain robust.

5. Synergistic Mechanism of LCCP and CPEST

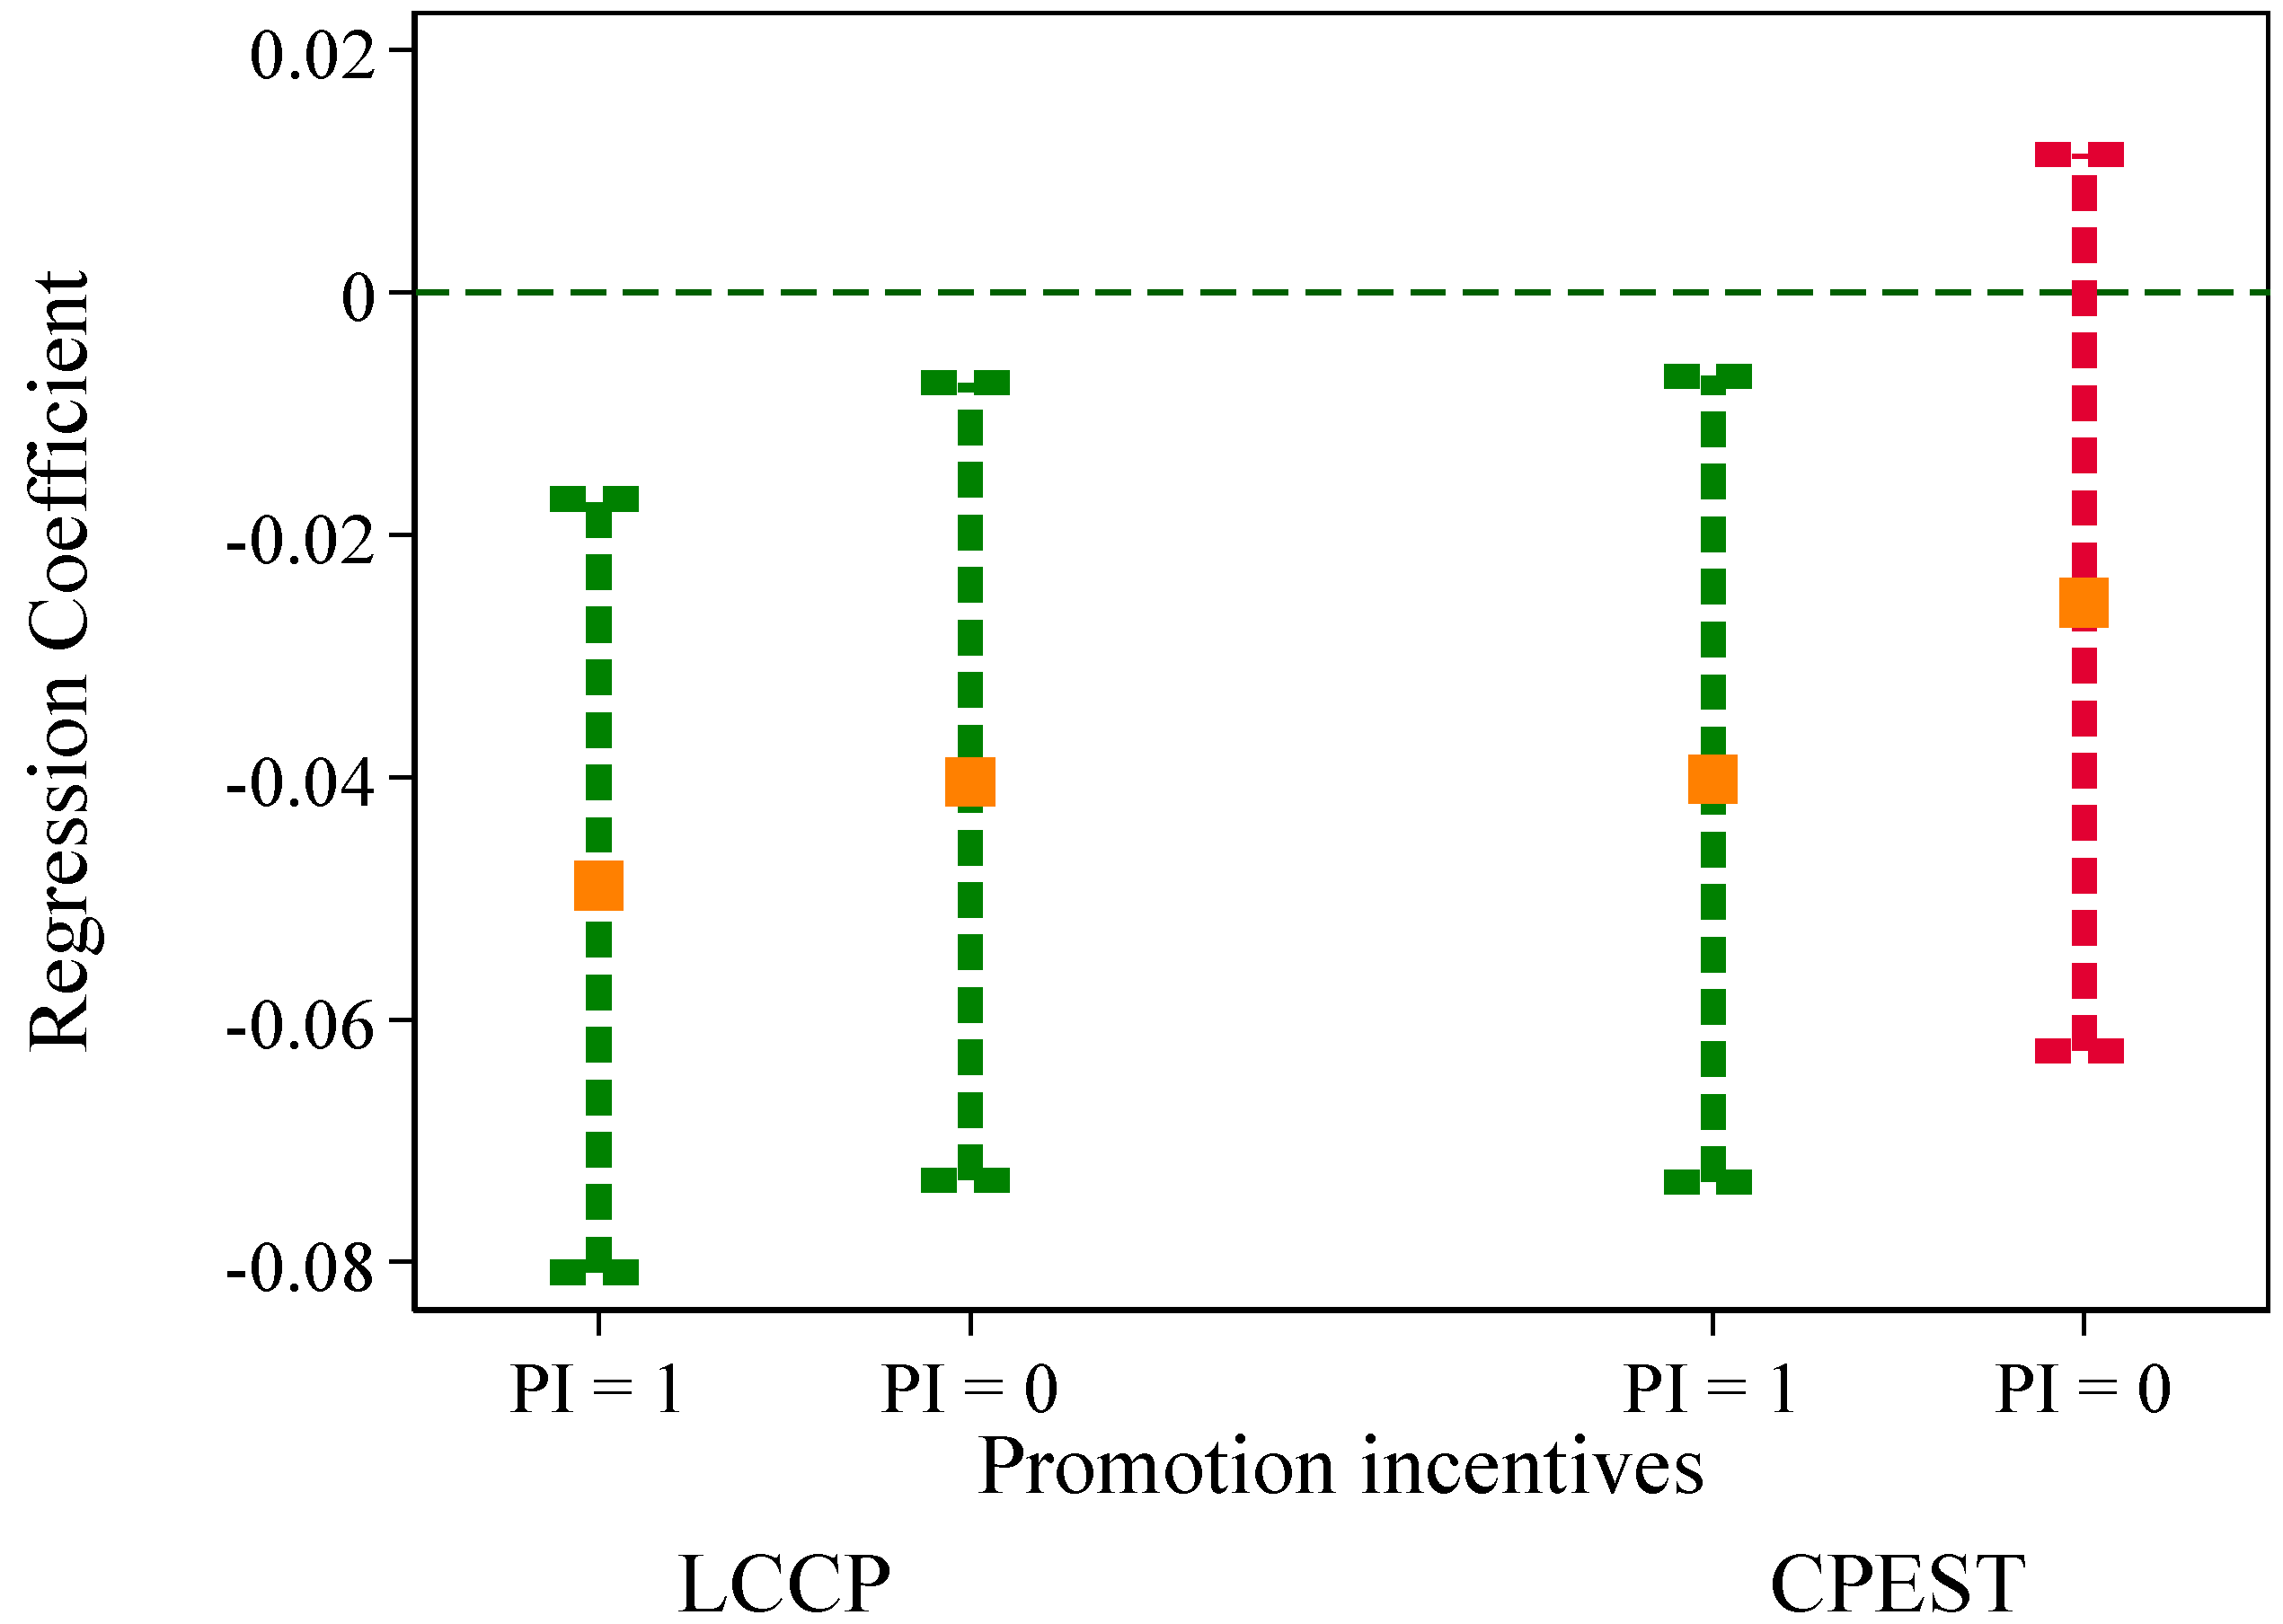
5.1. The Impact of the Timing

Analyzing policy interactions should also consider the timing and implementation process [58]. The temporal sequence of policies or institutions at different levels can significantly impact the effectiveness of the policy [27]. We further distinguish the temporal sequence of the LCCP and CPEST. The results in column (1) of Table 2 indicate that counties where the LCCP was implemented prior to the CPEST experienced more pronounced carbon reduction effects. The effect was approximately 1.42 times greater (0.0735/0.0518) than that of counties where the CPEST was implemented after the LCCP, and 5.3% greater than the baseline result (0.0735/0.0698). This is consistent with our previous analysis. The implementation of the LCCP first enhances the consistency between the two policies, thereby increasing the probability that counties prioritize ecological considerations. This is consistent with the existing research [27], which suggests that the primary tools at the higher level (LCCP) have higher priority, while the tools at the lower level (CPEST) are secondary. However, the latter plays a role in enhancing and reinforcing the effectiveness of the primary tool. Therefore, when the LCCP is implemented prior to the CPEST, the CPEST can better align with and support the LCCP. Conversely, if the CPEST is implemented first, it may be influenced by other policy objectives, weakening its supporting role. In conclusion, these results support Hypothesis H2, indicating that the prioritization of upper-level institutions’ implementation can enhance the support provided by lower-level institutions, thereby amplifying the policy effects. However, this still does not result in a synergistic effect. Nonetheless, it at least demonstrates that the temporal sequence is important, as it prevents the synergetic effect from being significantly weakened.

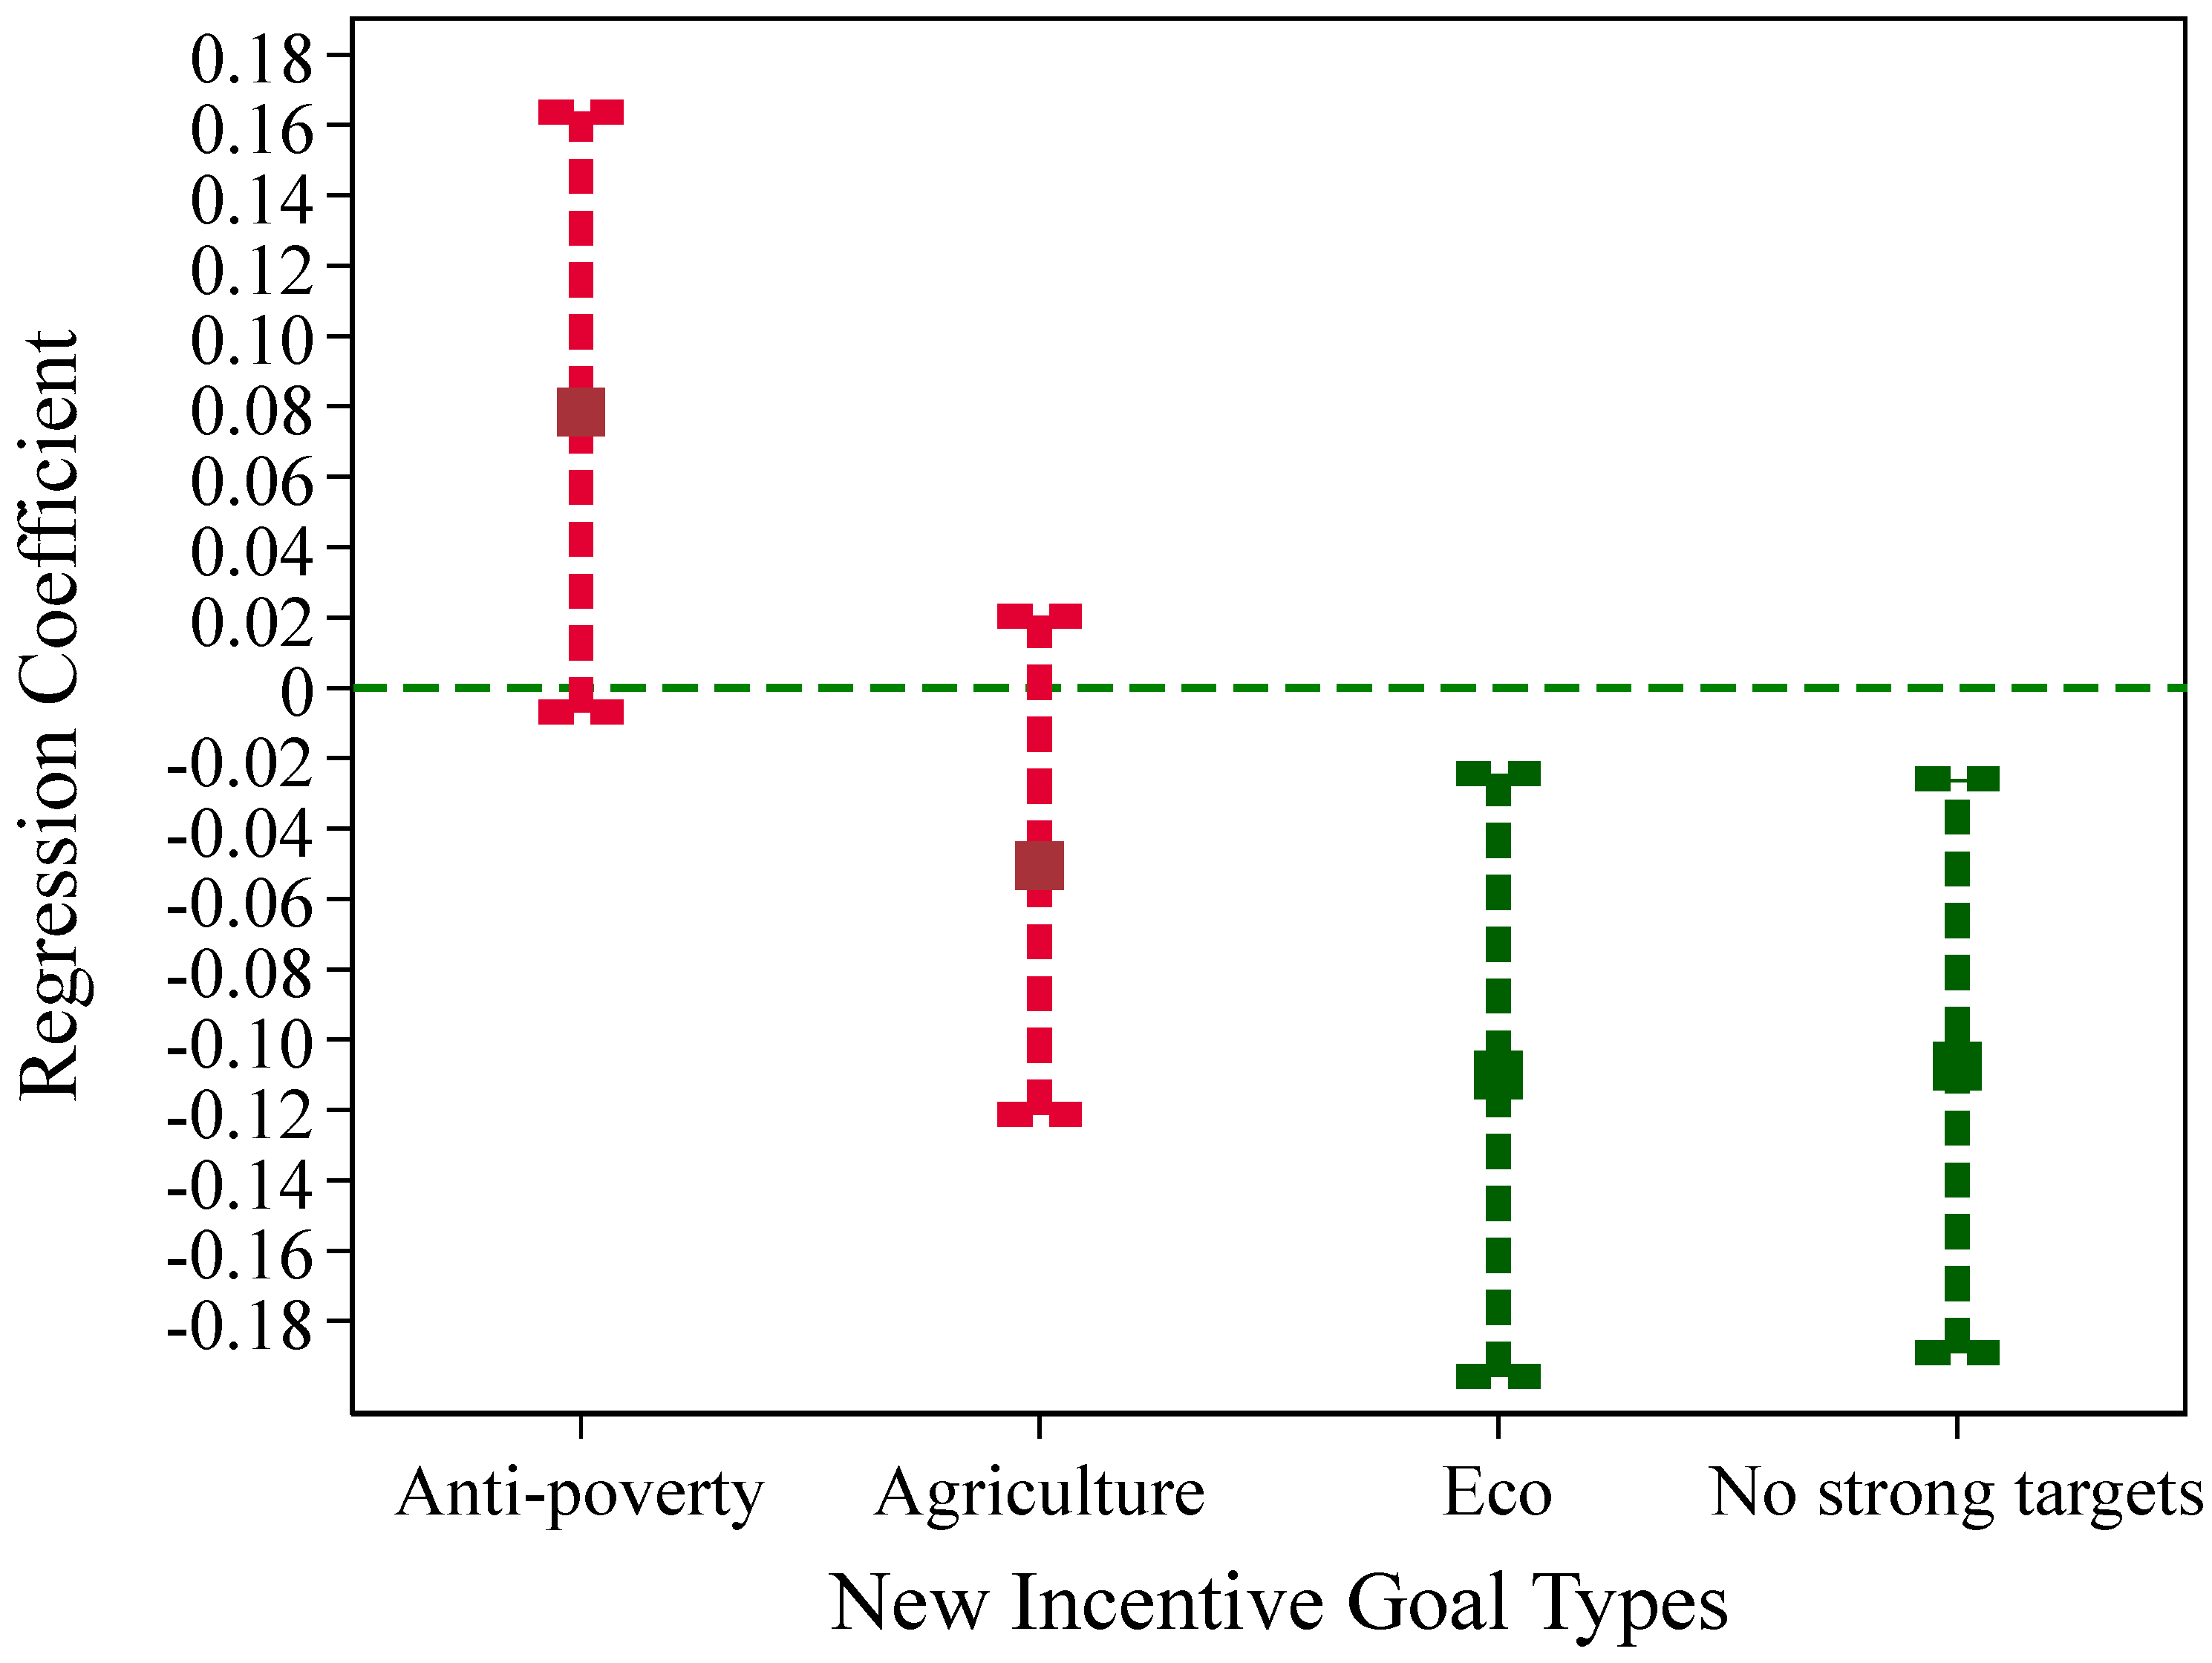
5.2. The Impact of Goal Consistency

When considering the time sequencing, why has the synergistic effect still not materialized? To explore this further, we introduce objective consistency as a potential factor. Objective consistency refers to the alignment of goals such that they can be achieved simultaneously, where the objectives mutually reinforce each other rather than conflict [25].
The CPEST encompasses four distinct models: anti-poverty first, agriculture first, ecology first, and no strong incentive goals. Among these, the ecology first model aligns most closely with the LCCP, as both share the same carbon reduction objectives, which can be achieved concurrently without significant trade-offs [25]. We set the four models as dummy variables and analyze them using the following estimation model:
C E   i t = α + β D i t L C C P + C P E S T + m = 1 4 β m O b j e c t i t m × D i t L C C P + C P E S T + η X i t + δ i + γ t + μ i t
In Equation (6), O bject i t m represents the dummy variable for the new objectives, where m takes values from 1 to 4, corresponding to the four policy models.
The estimation results are presented in Column (2) of Table 2 and Figure 6. We also tested the parallel trend assumption for each type of sub-goal, and the full results are presented in Supplementary Material Section S2.9. The findings indicate that, after considering objective consistency, a synergistic effect between the LCCP and CPEST emerges. Among the various types, the synergistic effect is strongest for the “ecology first” priority, followed by the “multi-objective” type, while the other types show no significant effect. For “ecology first”, its goals align most closely with those of the LCCP, resulting in the optimal synergistic effect. This effect is 1.58 times greater than the linear sum of the individual effects (0.1101/0.0698). “Ecology first” includes the reduction in greenhouse gas emissions, which aligns closely with the goals of the LCCP. Moreover, the measures adopted under both frameworks can mutually reinforce each other, thereby leading to a pronounced synergistic effect.
For regions with no strong incentivized goals, the carbon reduction synergistic effect is slightly lower than that of the “ecology first” priority, yet still 1.54 times greater than the linear sum effect (0.1075/0.0698). This suggests that, in the absence of explicit incentivized targets at the county level, the LCCP may play a guiding role, encouraging these regions to adopt carbon reduction as a key objective. In this case, the LCCP and CPEST play a complementary role. More conservatively, even in the absence of explicit targets, the CPEST at least does not conflict with the objectives of the LCCP, thereby allowing for a synergistic effect to unfold.
For the poverty prioritization and agriculture prioritization models, the carbon reduction effects were not significant, causing the LCCP to lose its practical effectiveness in these contexts. This is because it directs the focus of county-level governments toward rural economic development, thereby neglecting the low-carbon objectives of the LCCP. In such cases, the alignment of goals is weakened, and even conflicts may arise, leading to the combination of the two policies being ineffective.
In conclusion, the synergy between the LCCP and CPEST is conditional, and the consistency of their objectives determines whether such synergy can occur, thereby validating Hypothesis H3. This also suggests that the primary constraint on the synergistic effect of the LCCP and CPEST lies in the economic objectives that favor rural areas, which undermine the effectiveness of the policies. The inconsistency of objectives between the CPEST and LCCP hinders the generation of synergy.

5.3. Mechanism Test

5.3.1. Government Aspect: Governance Mechanism

We will continue to explore the channels through which the LCCP and CPEST contribute to carbon reduction. This section delves into the mechanisms by which environmental investments and regulatory frameworks shape ecological outcomes. The findings are delineated in Table 3. The findings demonstrate that, in isolation, the LCCP is capable of reducing carbon emissions through targeted environmental investments and regulatory interventions. In contrast, the CPEST, when applied independently, does not exhibit the efficacy of either mechanism. However, when the LCCP and CPEST are integrated, the impact of the environment and penalties is substantially enhanced, leading to a synergistic effect that magnifies the overall outcomes. This implies that, in contrast to the LCCP implemented independently, the integration of both the LCCP and CPEST significantly enhances the impact of environmental investments and penalties, thereby achieving more substantial carbon reduction outcomes. Hypothesis H4 has been corroborated. This outcome can be attributed to the fact that the CPEST mitigates the implementation barriers faced by the LCCP. Moreover, in the absence of well-defined targets, the CPEST, when employed independently, fails to substantially augment governmental efforts in environmental protection, while the implementation of the LCCP amplifies these efforts.

5.3.2. Market Aspect: Economic Mechanism

We continue to examine the economic mechanism, with the results presented in Table 4. The findings demonstrate that both the LCCP and CPEST, as well as their integrated application, facilitate carbon reduction through the promotion of green technological innovation and the advancement of industrial upgrading. This substantiates Hypothesis H5. Significantly, while the integrated approach enhances the policy impact of the LCCP, the synergistic effect remains relatively modest. This indicates that, within the context of market mechanisms, the CPEST plays a limited role in augmenting the effectiveness of the LCCP. The likely reason is that the CPEST directly influences the government, with a stronger impact on governmental behavior, while its effect on the market is more indirect. As a result, the synergistic effect within the economic mechanism is relatively weak in the combined model.

5.4. Heterogeneity Analysis

Under what conditions does the integration of the LCCP and CPEST prove to be more effective? We continue our exploration of the heterogeneity of the combined model, focusing on factors such as resource endowment, industrial infrastructure, and promotional incentives. The grouping criteria are provided in Supplementary Material Section S3.1. The estimation results, shown in Table 4, have successfully passed Fisher’s permutation test, thereby confirming the existence of heterogeneity.
First and foremost, the resource endowment of a region is strongly correlated with its carbon emissions. In China, resource-based cities, which are predominantly engaged in the extraction and processing of mineral resources, tend to have significantly higher carbon emission levels [59]. The results in columns (1) and (2) of Table 5 show that the combination of the LCCP and CPEST leads to stronger carbon reduction effects in resource-based cities. This is because resource-based cities are characterized by a high concentration of carbon-intensive industries. Under the dual pressures of carbon reduction and the emphasis on enhancing the quality of economic growth, these cities must overcome the “resource curse” and transition toward low-carbon development.
Secondly, industrial infrastructure is intrinsically linked to energy efficiency and carbon emissions. In China, numerous legacy industrial bases are predominantly characterized by high energy consumption and carbon-intensive industries, which pose significant challenges to the nation’s climate objectives. The results in columns (3) and (4) of Table 5 reveal that the combination of LCCP and CPEST yields significantly stronger carbon reduction effects in old industrial bases. In line with previous studies, due to the influence of industrial infrastructure, the LCCP, when implemented in isolation, is often ineffective in reducing carbon emissions and may even result in an increase in carbon emissions [26]. Our results indicate that, even in regions densely populated with carbon-intensive industries, the policy effect of the LCCP can be significantly enhanced by altering the incentive structures at the county level through the CPEST, which reduces political barriers.
Finally, promotion incentives play a critical role in determining the effectiveness of policy implementation. The results presented in columns (5) and (6) of Table 5 show that in regions with strong promotion incentives, the combined policy leads to significantly higher carbon reduction effects. In contrast, in areas with weak promotion incentives, the carbon reduction impact is not statistically significant. This is because the intensity of promotion incentives determines the effectiveness of the CPEST. Generally, low promotion incentives may render the CPEST ineffective, thereby diminishing the overall impact of the policy combination. Related studies have also found that when promotion opportunities are limited (especially for those past the typical promotion age), officials’ efforts to reduce pollution tend to decrease [60]. To validate this, we report additional test results in Figure 7 and Supplementary Material Section S3.2. The findings indicate that the LCCP is minimally affected by promotion incentives, while the CPEST loses its effectiveness in the contexts with low promotion incentives. This further corroborates the notion that the CPEST can indeed adjust the policy effectiveness of the LCCP.

6. Conclusions, Discussion, and Policy Implications

6.1. Conclusions

We utilized data from 1578 counties in China spanning from 2008 to 2022 to examine the synergistic carbon reduction effects of the LCCP and CPEST. The study reveals that the CPEST significantly amplifies the carbon reduction outcomes of the LCCP at the county level. However, the emergence of this synergistic effect is conditional. An analysis of the two key factors influencing synergy reveals that, compared to the timing of implementation, the alignment of objectives plays a decisive role. When the new incentive goals of the CPEST align with—or at the very least do not conflict with—the objectives of the LCCP, the two policies generate synergistic effects, with their combined impact approximately 1.5 times that of a simple linear summation. However, when conflicts arise between the two, the effectiveness of the LCCP is undermined. Mechanism analysis indicates that the combination of the LCCP and CPEST primarily reduces carbon emissions through four key pathways: increasing environmental investments, strengthening environmental penalties, promoting green technological innovation, and advancing industrial upgrading. Moreover, the synergistic effect of their combination is notably pronounced. Heterogeneity analysis reveals that the combination of the LCCP and CPEST yields more significant results in resource-based cities, old industrial bases, and regions with stronger promotion incentives.

6.2. Discussion

Our findings offer contributions to the existing literature through multiple distinct channels.
First, we develop a framework for analyzing policy synergies among vertical governments, grounded in the theory of nested institutions. The empirical findings derived from this framework contribute novel insights to the existing literature. Ostrom’s theory of nested institutions provides a valuable analytical framework for explaining climate governance across governance levels [20]. However, empirical research has yet to investigate whether cross-level institutional design can enhance the effectiveness of climate governance actions. Our study validates the effectiveness of this cross-level system design, emphasizing the critical role of goal alignment and temporal coordination in implementation.
Second, our findings enrich the literature in the area of policy mixes. Current research on policy mixes primarily focuses on horizontal policy synergies [22,23], yet lacks a comprehensive analytical framework for vertical policy synergies [24,25]. We propose a theoretical framework for analyzing vertical policy synergy by integrating Ostrom’s Institutional Analysis and Development (IAD) framework, particularly its nested institutional design principles. Empirical analysis reveals that goal consistency is a critical determinant of synergy generation, while timing also plays a significant role. We plot the framework in Figure 8, which helps provide an analytical tool for subsequent studies of cross-level policy synergies. The framework may undergo further refinement in future studies.
Finally, our findings exhibit parallels with the existing literature in related fields. Ellerman et al. document that the EU Emissions Trading System (EU ETS) faces intense implementation conflicts [61]. The tendency of member countries to strategically overreport the demand to safeguard their domestic industries has resulted in an aggregate quota surplus, thereby constraining the efficacy of emission reductions. China’s LCCP program faces similar problems [4,5]. This is because stringent enforcement of the LCCP constrains local economic development, thereby impeding county-level officials’ ability to meet GDP growth targets. Reforming the Cadre Performance Evaluation System can substantially enhance the effectiveness of the LCCP program’s implementation. Of course, China’s experience may not necessarily be universally applicable to the EU’s federal institutional framework. For Global South countries with multi-tiered governance structures, such as Vietnam and India, China’s experience may offer practical insights. For instance, Vietnam exemplifies a country with multi-level climate governance, where the implementation of centralized climate policies is often constrained by local governments, particularly due to challenges in institutionalized coordination [62]. Redesigning the official incentive system to move beyond Vietnam’s reliance on purely economic incentives may expedite the achievement of its climate governance objectives.

6.3. Policy Implications

The conclusions of our study offer the following policy implications for global climate governance. First, it is crucial to enhance the coherence of climate policies across different levels of governance. The results indicate that reforms in incentive systems at lower governance levels can significantly amplify the effectiveness of climate policies. This implies that, rather than focusing on the widespread introduction of new policies or enhancing horizontal policy coherence, governments should place greater emphasis on strengthening the vertical coherence of existing policies, particularly by improving the incentive structures for lower-level governments. Second, it is essential to reduce conflicts between policy tools at different governance levels. This study reveals that inconsistent objectives are a key barrier to the generation of synergistic effects. Therefore, in climate governance, governments should focus on adjusting institutional or policy tools at lower levels that may conflict with those at higher levels. Third, it is crucial to adjust the incentive mechanisms at lower governance levels to enhance the effectiveness of both governance and economic systems. Efforts should be made to strengthen the overall coherence of climate governance by aligning the incentive structures of lower-level governments with climate development goals (or at least ensuring they do not conflict), thereby reducing obstacles to the implementation of climate policies.
Of course, there are still some limitations to the research. On the one hand, due to data constraints, our discussion of the conditions for the emergence of synergistic effects focused solely on timing and consistency. Future research could further explore other factors such as coherence, credibility, and comprehensiveness. Furthermore, public participation is a critical component of Ostrom’s institutional theory. Given constraints on data, future research could explore how public participation enhances climate policy implementation. On the other hand, our study focused exclusively on the vertical synergy between low-carbon policies and incentive systems. Future research could shift its focus to examine the synergy between low-carbon policies and other areas, such as digital transformation policies, supervision systems, and related institutional frameworks.

Supplementary Materials

The following supporting information can be downloaded at https://www.mdpi.com/article/10.3390/su17125232/s1, Section S1: descriptive statistics and data processing; Section S2: robustness tests; Section S3: heterogeneity analysis.

Author Contributions

Conceptualization, Y.C. and Q.Y.; methodology, Y.C.; software, Y.C.; validation, Q.Y.; formal analysis, Y.C.; data curation, Y.C. and Q.Y.; writing—original draft preparation, Y.C. and Q.Y.; writing—review and editing, Y.C.; visualization, Y.C.; supervision, Q.Y.; funding acquisition, Y.C. All authors have read and agreed to the published version of the manuscript.

Funding

This study was funded by the Innovation Project of Guangxi Graduate Education (grant number YCBZ2024030).

Institutional Review Board Statement

Not applicable.

Informed Consent Statement

Not applicable.

Data Availability Statement

The datasets used and analyzed during the current study can be obtained on reasonable request by contacting the corresponding author via email.

Acknowledgments

We wish to thank the provider of financial support for this study and all the participants.

Conflicts of Interest

The authors declare that they have no known competing financial interests or personal relationships that could have appeared to influence the work reported in this paper.

References

  1. Mora, C.; Spirandelli, D.; Franklin, E.C.; Lynham, J.; Kantar, M.B.; Miles, W.; Smith, C.Z.; Freel, K.; Moy, J.; Louis, L.V.; et al. Broad threat to humanity from cumulative climate hazards intensified by greenhouse gas emissions. Nat. Clim. Change 2018, 8, 1062–1071. [Google Scholar] [CrossRef]
  2. Masson-Delmotte, V.; Zhai, P.; Pörtner, H.-O.; Roberts, D.; Skea, J.; Shukla, P.R. Global Warming of 1.5 C: IPCC Special Report on Impacts of Global Warming of 1.5 C Above Pre-Industrial Levels in Context of Strengthening Response to Climate Change, Sustainable Development, and Efforts to Eradicate Poverty; Cambridge University Press: Cambridge, UK, 2022. [Google Scholar]
  3. Song, Q.J.; Liu, T.L.; Qi, Y. Policy innovation in low carbon pilot cities: Lessons learned from China. Urban Clim. 2021, 39, 100936. [Google Scholar] [CrossRef]
  4. Guo, S.H.; Song, Q.J.; Qi, Y. Innovation or implementation? Local response to low-carbon policy experimentation in China. Rev. Policy Res. 2021, 38, 555–569. [Google Scholar] [CrossRef]
  5. Wang, C.; Lin, J.; Cai, W.J.; Liao, H. China’s carbon mitigation strategies: Enough? Energy Policy 2014, 73, 47–56. [Google Scholar] [CrossRef]
  6. Lindblom, C.E. The Policy-Making Process; Prentice-Hall: Hoboken, NJ, USA, 1968. [Google Scholar]
  7. Pressman, J.L.; Wildaysky, A.B. Implementation (Third Edition Expanded); University of California Press: Berkeley, CA, USA, 1984. [Google Scholar]
  8. Hjern, B. Implementation research—The link gone missing. J. Public Policy 1982, 2, 301–308. [Google Scholar] [CrossRef]
  9. Lipsky, M. Street-Level Bureaucracy: Dilemmas of the Individual in Public Service; Russell Sage Foundation: New York, NY, USA, 2010. [Google Scholar]
  10. Gilmore, E.A.; Buhaug, H. Climate mitigation policies and the potential pathways to conflict: Outlining a research agenda. Wiley Interdiscip. Rev.-Clim. Change 2021, 12, e722. [Google Scholar] [CrossRef]
  11. Peterson, T.D.; Rose, A.Z. Reducing conflicts between climate policy and energy policy in the US: The important role of the states. Energy Policy 2006, 34, 619–631. [Google Scholar] [CrossRef]
  12. van der Voorn, T.; Svenfelt, Å.; Björnberg, K.E.; Fauré, E.; Milestad, R. Envisioning carbon-free land use futures for Sweden: A scenario study on conflicts and synergies between environmental policy goals. Reg. Environ. Change 2020, 20, 35. [Google Scholar] [CrossRef]
  13. Markard, J.; Rosenbloom, D. Political conflict and climate policy: The European emissions trading system as a Trojan Horse for the low-carbon transition? Clim. Policy 2020, 20, 1092–1111. [Google Scholar] [CrossRef]
  14. Yun, S.J.; Ku, D.; Han, J.Y. Climate policy networks in South Korea: Alliances and conflicts. Clim. Policy 2014, 14, 283–301. [Google Scholar] [CrossRef]
  15. Wu, Q.Y.; Tan, C.; Wang, D.P.; Wu, Y.T.; Meng, J.; Zheng, H.R. How carbon emission prices accelerate net zero: Evidence from China’s coal-fired power plants. Energy Policy 2023, 177, 113524. [Google Scholar] [CrossRef]
  16. Wu, S.; Hu, F.F.; Zhang, Z.J. Visible hand or invisible hand in climate governance? Evidence from China. Renew. Sustain. Energy Rev. 2024, 204, 114798. [Google Scholar] [CrossRef]
  17. Gilley, B. Authoritarian environmentalism and China’s response to climate change. Environ. Politics 2012, 21, 287–307. [Google Scholar] [CrossRef]
  18. Rao, Y.C.; Wang, X.L.; Li, H.K.; Ruan, Y.J. How can the Pearl River Delta urban agglomeration achieve the carbon peak target: Based on the perspective of an optimal stable economic growth path. J. Clean. Prod. 2024, 439, 140879. [Google Scholar] [CrossRef]
  19. Song, Y.; Wei, Y.C.; Zhu, J.; Liu, J.; Zhang, M. Environmental regulation and economic growth: A new perspective based on technical level and healthy human capital. J. Clean. Prod. 2021, 318, 128520. [Google Scholar] [CrossRef]
  20. Ostrom, E. Background on the Institutional Analysis and Development Framework. Policy Stud. J. 2011, 39, 7–27. [Google Scholar] [CrossRef]
  21. Ostrom, E. Governing the Commons: The Evolution of Institutions for Collective Action; Cambridge University Press: New York, NY, USA, 1990. [Google Scholar]
  22. Wu, J.X.; Nie, X.; Wang, H. Are policy mixes in energy regulation effective in curbing carbon emissions? Insights from China’s energy regulation policies. J. Policy Anal. Manag. 2023, 43, 1152–1184. [Google Scholar] [CrossRef]
  23. Zhang, X.F.; Fan, D.C. Collaborative emission reduction research on dual-pilot policies of the low-carbon city and smart city from the perspective of multiple innovations. Urban Clim. 2023, 47, 101364. [Google Scholar] [CrossRef]
  24. Flanagan, K.; Uyarra, E.; Laranja, M. Reconceptualising the ‘policy mix’for innovation. Res. Policy 2011, 40, 702–713. [Google Scholar] [CrossRef]
  25. Rogge, K.S.; Reichardt, K. Policy mixes for sustainability transitions: An extended concept and framework for analysis. Res. Policy 2016, 45, 132–147. [Google Scholar] [CrossRef]
  26. Feng, T.; Lin, Z.G.; Du, H.B.; Qiu, Y.M.; Zuo, J. Does low-carbon pilot city program reduce carbon intensity? Evidence from Chinese cities. Res. Int. Bus. Financ. 2021, 58, 101450. [Google Scholar] [CrossRef]
  27. Bali, A.S.; Howlett, M.; Ramesh, M. Unpacking policy portfolios: Primary and secondary aspects of tool use in policy mixes. J. Asian Public Policy 2022, 15, 321–337. [Google Scholar] [CrossRef]
  28. Wang, Y.F.; Song, Q.J.; He, J.J.; Qi, Y. Developing low-carbon cities through pilots. Clim. Policy 2015, 15, S81–S103. [Google Scholar] [CrossRef]
  29. Li, H.; Zhou, L.-A. Political turnover and economic performance: The incentive role of personnel control in China. J. Public Econ. 2005, 89, 1743–1762. [Google Scholar] [CrossRef]
  30. Zeng, J.J.; Bao, R. Moving beyond gross domestic product: The impacts of gross domestic product-centric cadre performance targets shift on environmental protection. Public Adm. Dev. 2024, 44, 397–411. [Google Scholar] [CrossRef]
  31. O’Toole, L.J., Jr. Research on policy implementation: Assessment and prospects. J. Public Adm. Res. Theory 2000, 10, 263–288. [Google Scholar] [CrossRef]
  32. Ostrom, E. Understanding Institutional Diversity; Princeton University Press: Princeton, NJ, USA, 2009. [Google Scholar]
  33. Bodin, Ö. Collaborative environmental governance: Achieving collective action in social-ecological systems. Science 2017, 357, aan1114. [Google Scholar] [CrossRef]
  34. Ostrom, E. A General Framework for Analyzing Sustainability of Social-Ecological Systems. Science 2009, 325, 419–422. [Google Scholar] [CrossRef]
  35. Alexander, E. How Organizations Act Together: Interorganizational Coordination in Theory and Practice, 1st ed.; Routledge: London, UK, 1995. [Google Scholar]
  36. Mitnick, B.M.; Backoff, R. The incentive relation in implementation. In Public Policy Implementation; Edwards, G.C., III, Ed.; Congressional Quarterly Press: Washington, DC, USA, 1984; Volume 3. [Google Scholar]
  37. Lindenberg, S.; Steg, L. Normative, gain and hedonic goal frames guiding environmental behavior. J. Soc. Issues 2007, 63, 117–137. [Google Scholar] [CrossRef]
  38. Blackman, A.; Li, Z.Y.; Liu, A.T.A. Efficacy of Command-and-Control and Market-Based Environmental Regulation in Developing Countries. Annu. Rev. Resour. Econ. 2018, 10, 381–404. [Google Scholar] [CrossRef]
  39. Liu, Z.; Wang, H.; Zhou, Y. Assessment of emission reduction effects in China’s economic transformation and sustainable development strategy. Ecol. Indic. 2024, 167, 112522. [Google Scholar] [CrossRef]
  40. Grossman, G.M.; Krueger, A.B. Economic growth and the environment. Q. J. Econ. 1995, 110, 353–377. [Google Scholar] [CrossRef]
  41. Chen, M.Q. A study of low-carbon development, urban innovation and industrial structure upgrading in China. Int. J. Low-Carbon Technol. 2022, 17, 185–195. [Google Scholar] [CrossRef]
  42. Pan, A.; Zhang, W.N.; Shi, X.P.; Dai, L. Climate policy and low-carbon innovation: Evidence from low-carbon city pilots in China. Energy Econ. 2022, 112, 106129. [Google Scholar] [CrossRef]
  43. Tang, P.C.; Yang, S.W.; Shen, J.; Fu, S.K. Does China’s low-carbon pilot programme really take off? Evidence from land transfer of energy-intensive industry. Energy Policy 2018, 114, 482–491. [Google Scholar] [CrossRef]
  44. Chen, X.; Jiang, H.C.; Ling, J.H. Addressing Multitasking Problems through Promotion Incentives: An Empirical Study of Local Governments in China. Public Perform. Manag. Rev. 2024, 47, 654–680. [Google Scholar] [CrossRef]
  45. Shao, S.; Liu, J.H.; Geng, Y.; Miao, Z.; Yang, Y.C. Uncovering driving factors of carbon emissions from China’s mining sector. Appl. Energy 2016, 166, 220–238. [Google Scholar] [CrossRef]
  46. Dong, F.; Yu, B.L.; Hadachin, T.; Dai, Y.J.; Wang, Y.; Zhang, S.N.; Long, R.Y. Drivers of carbon emission intensity change in China. Resour. Conserv. Recycl. 2018, 129, 187–201. [Google Scholar] [CrossRef]
  47. Chang, H.; Ding, Q.Y.; Zhao, W.Z.; Hou, N.; Liu, W.W. The digital economy, industrial structure upgrading, and carbon emission intensity—Empirical evidence from China’s provinces. Energy Strategy Rev. 2023, 50, 101218. [Google Scholar] [CrossRef]
  48. Lyu, J.; Liu, T.L.; Cai, B.F.; Qi, Y.; Zhang, X.L. Heterogeneous effects of China’s low-carbon city pilots policy. J. Environ. Manag. 2023, 344, 118329. [Google Scholar] [CrossRef]
  49. Dong, Z.Q.; He, Y.D.; Wang, H.; Wang, L.H. Is there a ripple effect in environmental regulation in China?—Evidence from the local-neighborhood green technology innovation perspective. Ecol. Indic. 2020, 118, 106773. [Google Scholar] [CrossRef]
  50. Wu, N.; Liu, Z. Higher education development, technological innovation and industrial structure upgrade. Technol. Forecast. Soc. Change 2021, 162, 120400. [Google Scholar] [CrossRef]
  51. Lu, J.; Wang, T.H.; Liu, X.H. Can environmental governance policy synergy reduce carbon emissions? Econ. Anal. Policy 2023, 80, 570–585. [Google Scholar] [CrossRef]
  52. Nunn, N.; Qian, N. US Food Aid and Civil Conflict. Am. Econ. Rev. 2014, 104, 1630–1666. [Google Scholar] [CrossRef]
  53. Ansoff, H.I. Corporate Strategy: An Analytic Approach to Business Policy for Growth and Expansion; McGraw-Hill: New York, NY, USA, 1965. [Google Scholar]
  54. Brunekreef, B.; Holgate, S.T. Air pollution and health. Lancet 2002, 360, 1233–1242. [Google Scholar] [CrossRef]
  55. Baker, A.C.; Larcker, D.F.; Wang, C.C.Y. How much should we trust staggered difference-in-differences estimates? J. Financ. Econ. 2022, 144, 370–395. [Google Scholar] [CrossRef]
  56. Sun, L.Y.; Abraham, S. Estimating dynamic treatment effects in event studies with heterogeneous treatment effects. J. Econom. 2021, 225, 175–199. [Google Scholar] [CrossRef]
  57. Chernozhukov, V.; Chetverikov, D.; Demirer, M.; Duflo, E.; Hansen, C.; Newey, W.; Robins, J. Double/debiased machine learning for treatment and structural parameters. Econom. J. 2018, 21, C1–C68. [Google Scholar] [CrossRef]
  58. Sorrell, S.; Smith, A.; Betz, R.; Walz, R.; Boemare, C.; Quirion, P.; Sijm, J.; Mavrakis, D.; Konidari, P.; Vassos, S. Interaction in EU Climate Policy, Final Report to DG Research Under the Framework V Project Interaction in EU Climate Policy; University of Sussex: Brighton, UK, 2003. [Google Scholar]
  59. Li, B.; Han, Y.K.; Wang, C.S.; Sun, W. Did civilized city policy improve energy efficiency of resource-based cities? Prefecture-level evidence from China. Energy Policy 2022, 167, 113081. [Google Scholar] [CrossRef]
  60. Zhu, X.W.; Yang, Y.P. The pollution reduction effect of official turnover: Evidence from China. Sci. Total Environ. 2023, 868, 161459. [Google Scholar] [CrossRef]
  61. Ellerman, A.D.; Convery, F.J.; De Perthuis, C. Pricing Carbon: The European Union Emissions Trading Scheme; Cambridge University Press: Cambridge, UK, 2010. [Google Scholar]
  62. Phuong, L.T.H.; Biesbroek, G.R.; Wals, A.E.J. Barriers and enablers to climate change adaptation in hierarchical governance systems: The case of Vietnam. J. Environ. Policy Plan. 2018, 20, 518–532. [Google Scholar] [CrossRef]
Figure 1. Policy implementation and carbon emission levels from 2008 to 2022. Data source: compiled by the authors.
Sustainability 17 05232 g001
Figure 2. Research framework.
Sustainability 17 05232 g002
Figure 3. Parallel trend test. (a) The LCCP parallel trend test; (b) The CPEST parallel trend test; (c) The LCCP and CPEST parallel trend test.
Sustainability 17 05232 g003
Figure 4. Heterogeneity-robust DID estimation.
Sustainability 17 05232 g004
Figure 5. Placebo test results. (a) The LCCP placebo test results; (b) The CPEST placebo test results; (c) The LCCP and CPEST placebo test results.
Sustainability 17 05232 g005
Figure 6. Estimation results for different types of incentive goals.
Sustainability 17 05232 g006
Figure 7. Carbon reduction effects of LCCP and CPEST under different promotion incentive conditions.
Sustainability 17 05232 g007
Figure 8. Cross-level policy synergy framework.
Sustainability 17 05232 g008
Table 1. Benchmark regression results.
VariableCE
(1)(2)(3)(4)(5)(6)
LCCP−0.1071 ***
(0.0142)
−0.0396 ***
(0.0116)
CPEST −0.0810 ***
(0.0158)
−0.0343 ***
(0.0125)
LCCP + CPEST −0.1211 ***
(0.0198)
−0.0698 ***
(0.0168)
ControlsNoNoNoYesYesYes
CountyYesYesYesYesYesYes
YearYesYesYesYesYesYes
Mixes (linear summation) −0.1881 −0.0739
Obs23,50523,50523,50523,50523,50523,505
R20.92880.92850.92850.95090.95080.9509
Note: *** indicate significance at the 1% levels; the values in parentheses are clustered robust standard errors (clustered at the county level).
Table 2. Estimation results of timing and goal consistency.
VariableCECE
(1)(2)
LCCP before CPEST−0.0735 ***
(0.0125)
CPEST before LCCP−0.0518 ***
(0.0177)
Anti-poverty 0.0784
(0.0501)
Agriculture −0.0505
(0.0177)
Eco −0.1101 **
(0.0503)
No strong targets −0.1075 **
(0.0479)
ControlsYesYes
CountyYesYes
YearYesYes
Obs23,50523,505
R20.95090.9511
Note: ***, **, denote significance levels of 1%, 5%, respectively; the values in parentheses represent cluster-robust standard errors.
Table 3. Governance mechanism.
VariableEIEP
(1)(2)(3)(4)(5)(6)
LCCP × M−0.4525 **
(0.2246)
−0.0044 ***
(0.0012)
CPEST × M −0.2819
(0.2744)
−0.0032
(0.0032)
(LCCP + CPEST) × M −1.0195 **
(0.4546)
−0.0070 **
(0.0017)
ControlsYesYesYesYesYesYes
CountyYesYesYesYesYesYes
YearYesYesYesYesYesYes
Obs18,58518,58518,58514,55014,55014,550
R20.95040.95030.95040.95460.95460.9546
Note: ***, **, denote significance at the 1%, 5%, levels, respectively. The values in parentheses represent clustered robust standard errors (clustered at the county level).
Table 4. Economic mechanism.
VariableGTIUIS
(1)(2)(3)(4)(5)(6)
LCCP × M−0.0162 ***
(0.0041)
−0.2089 ***
(0.0261)
CPEST × M −0.0162 ***
(0.0054)
−0.2054 ***
(0.0260)
(LCCP + CPEST) × M −0.0284 ***
(0.0060)
−0.2125 ***
(0.0262)
ControlsYesYesYesYesYesYes
CountyYesYesYesYesYesYes
YearYesYesYesYesYesYes
Obs17,86017,86017,86023,50523,50523,505
R20.95500.95490.95500.95200.95200.9521
Note: ***, denote significance at the 1% levels. The values in parentheses represent clustered robust standard errors (clustered at the county level).
Table 5. Heterogeneity test.
VariableRC-YesRC-NoOIB-YesOIB-NoPI-HighPI-Low
(1)(2)(3)(4)(5)(6)
LCCP + CPEST−0.0964 ***
(0.0422)
−0.0483 ***
(0.0169)
−0.1466 ***
(0.0324)
−0.0370 *
(0.0192)
−0.1024 ***
(0.0241)
−0.0291
(0.0224)
ControlsYesYesYesYesYesYes
CountyYesYesYesYesYesYes
YearYesYesYesYesYesYes
Obs10,20013,305645017,05512,01511,490
R20.95080.95150.95260.95130.94860.9538
Fisher’s Permutation Test0.0480 ***0.1100 ***0.0730 ***
Note: ***, and * denote significance at the 1%, and 10% levels, respectively. The values in parentheses represent clustered robust standard errors (clustered at the county level).
Disclaimer/Publisher’s Note: The statements, opinions and data contained in all publications are solely those of the individual author(s) and contributor(s) and not of MDPI and/or the editor(s). MDPI and/or the editor(s) disclaim responsibility for any injury to people or property resulting from any ideas, methods, instructions or products referred to in the content.

