Article

The Rise and Fall of Regions: A Hybrid Multi-Criteria Analysis of Türkiye’s Regional Economies’ Sustainable Performance

1
Department of Transportation Services, Osmaniye Vocational School, Osmaniye Korkut Ata University, Osmaniye 80010, Türkiye
2
Department of Industrial Engineering, Faculty of Engineering and Natural Sciences, Osmaniye Korkut Ata University, Osmaniye 80010, Türkiye
*
Author to whom correspondence should be addressed.
Sustainability 2025, 17(11), 5222; https://doi.org/10.3390/su17115222
Submission received: 27 April 2025 / Revised: 26 May 2025 / Accepted: 3 June 2025 / Published: 5 June 2025
(This article belongs to the Section Economic and Business Aspects of Sustainability)

Abstract

Macroeconomic indicators are essential measures that reflect the overall economic wellbeing of a region or country and have a significant impact on investment decisions. The data on macroeconomic indicators for Turkish development regions facilitate a comparison of macroeconomic performance between these regions. This kind of analysis can help enhance the development levels of the regions while ensuring resources are used efficiently. This study compares the macroeconomic performance of Turkish development regions between 2019 and 2022 using a hybrid multi-criteria analysis method. A total of 26 regions were evaluated based on seven criteria: GDP, GDP per capita, employment rate, number of enterprises, export, unemployment rate, and import. The criteria were weighted using the Step-Wise Weight Assessment Ratio Analysis (SWARA) method and ranked using the Combined Compromise Solution (CoCoSo) method. This study addresses a gap in the literature by analyzing the macroeconomic performance of Turkish regions, aiming to reduce economic disparities. The results showed that the Istanbul region had the best performance over the 4-year period, while Eastern Anatolia experienced a consistently declining performance, ranking last. Some regions had fluctuating performances, while others maintained steady outcomes. This study advances research by offering a more reliable and comprehensive analysis, thereby contributing to the improvement of future studies on regional economic development.

1. Introduction

Macroeconomic indicators serve as critical metrics that encapsulate the overall economic health of a nation and exert a profound influence on investment strategies, as well as sectors such as banking and government policymaking. The selection and evaluation of these indicators necessitate a multidimensional analytical framework, encompassing key dimensions of economic performance, including but not limited to growth, unemployment, inflation, trade balance, fiscal balance, and the current account balance [1]. These indicators are indispensable in providing essential insights into the trajectory of an economy, thus enabling policymakers and businesses to make data-driven, strategic decisions with a high degree of precision [2].
Development agencies were established to mitigate regional disparities and ensure a more equitable distribution of prosperity across the nation. Their core objectives include optimizing the contribution of each region to national development through the assessment of regional potential, enhancing competitiveness, fostering economic and social integration, and promoting a more balanced geographic settlement structure [3]. Türkiye is subdivided into 26 development regions [4]. A comprehensive analysis of macroeconomic indicators is imperative for addressing developmental imbalances both within the cities of Turkish development regions and between these regions. In this context, rather than relying on single-parameter analyses—such as gross domestic product (GDP) or the unemployment rate—multi-parameter analyses that incorporate a range of macroeconomic variables offer a more robust and nuanced approach to comparison. To facilitate such evaluations, multicriteria decision-making methodologies are extensively applied across various fields of research, providing a systematic framework for complex decision processes [5].
This study aims to conduct a comparative analysis of the macroeconomic performance of Turkish development regions through the application of a hybrid multi-criteria decision-making approach. In this context, a total of 26 development regions were evaluated across seven distinct criteria drawn from the existing literature, including GDP, GDP per capita, employment rate, number of enterprises, export, unemployment rate, and import. In the initial phase of the hybrid framework, these criteria were systematically assessed and weighted using the Step-Wise Weight Assessment Ratio Analysis (SWARA). Subsequently, the final stage involved ranking the macroeconomic performance of the development regions employing the Combined Compromise Solution (CoCoSo) method, providing a comprehensive and nuanced evaluation. While various studies have applied MCDM approaches to development regions, a notable gap remains regarding comprehensive macroeconomic performance assessment. This study fills this gap by providing an in-depth analysis aimed at reducing regional economic disparities. Unlike most prior research that employs objective weighting or equal weights, this work uniquely adopts the subjective SWARA method to determine criteria weights, reflecting expert judgments. Furthermore, it pioneers the integration of the CoCoSo method in this context, offering a robust and innovative hybrid framework for evaluating regional macroeconomic performance.
To further clarify the scope and direction of the study, the following research questions are posed:
  • How does the macroeconomic performance of the 26 Turkish development regions compare over the 2019–2022 period?
  • Which regions show consistently strong or weak performance, and which display fluctuating trends?
  • How can the integration of SWARA and CoCoSo methods contribute to a more comprehensive and reliable regional performance assessment?
In line with these questions and based on the problem areas identified in the literature, the following hypotheses are proposed to guide the empirical analysis and demonstrate the methodological advantages of the proposed framework:
H1. 
There are statistically significant differences in macroeconomic performance among the 26 Turkish development regions during the 2019–2022 period.
H2. 
The hybrid MCDM approach (SWARA-CoCoSo) provides more comprehensive and differentiated rankings than traditional single-criterion or equal-weight approaches.
H3. 
Regions with consistently strong or weak macroeconomic indicators exhibit stable performance rankings over time, validating the robustness of the proposed methodology.
The structure of the study is as follows: In Section 2, a comprehensive review of multi-criteria decision-making (MCDM) approaches utilized in macroeconomic performance analysis is provided, highlighting the unique contributions of this study to the literature. Section 3 offers a detailed explanation of the development regions and criteria considered, alongside a rigorous step-by-step presentation of the hybrid MCDM methodology employed. In Section 4, the findings are critically analyzed, and the study concludes in Section 5, where insights are drawn and recommendations for future research trajectories are outlined.

2. Literature Review

Macroeconomic performance analysis employs multi-criteria decision-making (MCDM) methods to assess and compare the economic conditions of different cities, regions, or country groups. These analyses typically focus on various factors, such as trade, tourism, and production performance. For example, the comparison of macroeconomic performance across different country groups was investigated in various studies: OECD countries by Altay Topçu and Oralhan [6] and Ersoy [7], World Trade Organization member countries by Öztürk and Deniz Başar [8], G7 countries by Belke [1], European Union countries by Oğuz et al. [9] and Orhan [10], and E7 countries by Koşaroğlu [11]. Furthermore, MCDM approaches have been applied to explore sustainable development strategies, considering critical macroeconomic indicators related to the environment, economy, and governance. In this framework, alternative cities, regions, or nations are evaluated from different perspectives, with a focus on comparing potential policy options and investment strategies. In the fields of energy and renewable energy, studies by Sastry Musti [12] and Li et al. [13] used MCDM techniques to identify optimal green finance investment strategies. Similarly, Li et al. [14], Meng and Shaikh [15], and Li et al. [16] focused on reaching carbon reduction goals, using MCDM to inform decision making in this area. Additionally, Nguyen et al. [17] applied multi-criteria decision-making approaches to analyze and refine investment strategies in financial markets, ensuring they align with sustainable economic and environmental goals.
Development regions, a key area for decision-making approaches, have been analyzed using multi-criteria decision-making methods for different objectives. These studies led to the ranking of provinces within the development regions based on their performance, along with the provision of relevant recommendations. Atan et al. [18] analyzed development regions based on hunger and poverty thresholds, Belgin and Apaydın Avşar [19] focused on R&D and innovation levels, Demirdöğen et al. [20] and Gergin et al. [21] examined the site selection problem, Durmaz et al. [22] analyzed educational performance, Erkılıç [23] addressed public health and service infrastructure, Gök Kısa [24] evaluated renewable energy sources, Örtlek [25] focused on socioeconomic performance analysis, Sungur and Işık Maden [26] studied the manufacturing industry sector, Ordu [4] analyzed occupational accidents and diseases, Yalçınkaya et al. [27] assessed investment environments in organized industrial zones, and Yıldırım and Yeşilyurt [28] examined project evaluation criteria using multi-criteria decision-making approaches. The literature review for multi-criteria analysis on macroeconomic performance is shown in Table 1. However, no study in the literature has yet examined development regions from the perspective of macroeconomic performance.
The primary objective of this study and its contribution to the literature are as follows: Although development regions have been examined using MCDM approaches for various purposes, a notable gap remains in the evaluation of their macroeconomic performance. This study addresses this gap by providing a thorough analysis of the macroeconomic performance of development regions, aiming to reduce economic development disparities. In doing so, it offers a more robust and reliable foundation for advancing future research. Unlike most existing studies, which primarily rely on objective methods or assign equal weights to criteria, this study introduces Step-Wise Weight Assessment Ratio Analysis (SWARA) approach by employing a subjective method to determine the weights of the criteria. Furthermore, it incorporates the CoCoSo method—a state-of-the-art MCDM technique—into the analysis, representing the first application of this hybrid approach in macroeconomic performance evaluations.

3. Materials and Methods

3.1. The Development Regions (Alternatives)

The data analyzed in this study cover the period from 2019 to 2022, which were accurately collected in line with the procedures set by the relevant government agencies. The majority of the data (i.e., gross domestic product, gross domestic product per capita, export, import, and number of enterprises) were sourced from the Turkish Statistical Institute [39]. Other data (i.e., employment and unemployment rates) were obtained from the geographic statistics portal of the Turkish Statistical Institute [40]. The data for the criteria (i.e., export and import) were first collected on a provincial level and then aggregated by province based on the development regions. Türkiye consists of 26 development regions, each encompassing the following provinces [41]: Ahiler (Aksaray, Kirikkale, Kirsehir, Nigde, and Nevsehir), Ankara (Ankara), BEBKA (Bursa, Eskisehir, and Bilecik), Central Anatolian (Kayseri, Sivas, and Yozgat), Cukurova (Adana and Mersin), Dicle (Batman, Mardin, Sirnak, and Siirt), East Marmara (Bolu, Duzce, Kocaeli, Sakarya, and Yalova), Eastern Anatolia (Bitlis, Hakkari, Mus, and Van), Eastern Black Sea (Artvin, Giresun, Gumushane, Ordu, Rize, and Trabzon), Eastern Mediterranean (Hatay, Kahramanmaras, and Osmaniye), Firat (Bingol, Elazig, Malatya, and Tunceli), Istanbul (Istanbul), Izmir (Izmir), Karacadag (Diyarbakir and Sanliurfa), Mevlana (Karaman and Konya), Middle Black Sea (Amasya, Corum, Samsun, and Tokat), North Anatolian (Cankiri, Kastamonu, and Sinop), North East Anatolian (Bayburt, Erzincan, and Erzurum), Serhat (Agri, Ardahan, Igdir, and Kars), Silk Road (Adiyaman, Gaziantep, and Kilis), South Aegean (Aydin, Denizli, and Mugla), Southern Marmara (Balikesir and Canakkale), Trakya (Edirne, Kirklareli, and Tekirdag), Western Black Sea (Bartin, Karabuk, and Zonguldak), Western Mediterranean (Antalya, Burdur, and Isparta), and Zafer (Afyonkarahisar, Kutahya, Manisa, and Usak).

3.2. Macroeconomic Indicators (Criteria for Evaluation)

In this study, the Turkish development regions were evaluated under seven district criteria (see Table 2). Some of these criteria are maximization-oriented, while others are minimization-oriented. The maximization-oriented criteria frequently referenced in the literature, including GDP, GDP per capita, employment rate, exports, and number of enterprises, were taken into account. GDP reveals the economic strength of a country, and GDP per capita (GDPPC) reflects the economic power of the average individual in society and indicates their ability to sustain purchasing power. GDP per capita at the regional level was calculated by dividing the total gross domestic product (GDP) of each development region by the total population of the same region. Both the GDP and population data were obtained from official national statistical sources [39]. In this study, we compare development regions within Turkey, rather than making cross-country comparisons. Therefore, using the Turkish Lira (TRY), the official currency of all the regions under study, is appropriate and sufficient for internal comparison purposes. Since all regions share the same monetary unit, comparability is preserved without the need for conversion to the USD. Employment rate indicates the percentage of the working-age population that is actively employed within a specific time frame. Number of enterprises represents the active business establishments in a region or country. Export is an economic activity that allows a country to produce based on foreign demand. On the other hand, the two criteria considered are minimization-oriented. Unemployment rate is a metric that considers individuals who are actively seeking employment but are unable to find a job. Import has a lower potential to directly stimulate economic growth while representing external purchases. In this study, export and import values are expressed in current prices, as published by the Turkish Statistical Institute [39]. Since all data refer to the same time period and a comparison is made between regions within a single country, adjusting for inflation was not considered necessary.
As the number of evaluation criteria increases in decision-making problems, the decision-making process becomes more complex. The number of macroeconomic variables is quite high, and measuring the performance of regions is a serious task. Taking into account the necessary evaluation criteria as much as possible ensures the ability to make more accurate decisions. Table 3 presents the descriptive statistics of the data used in the study. This shows that the most ideal and least ideal alternatives differ for each criterion. Therefore, if alternatives are ranked under a single evaluation criterion, the results vary depending on the criterion used. This situation necessitates performing the analysis within a multi-criteria framework. For this reason, the SWARA-based CoCoSo approach, one of the multi-criteria decision-making methods, was used to rank development regions under multiple criteria.

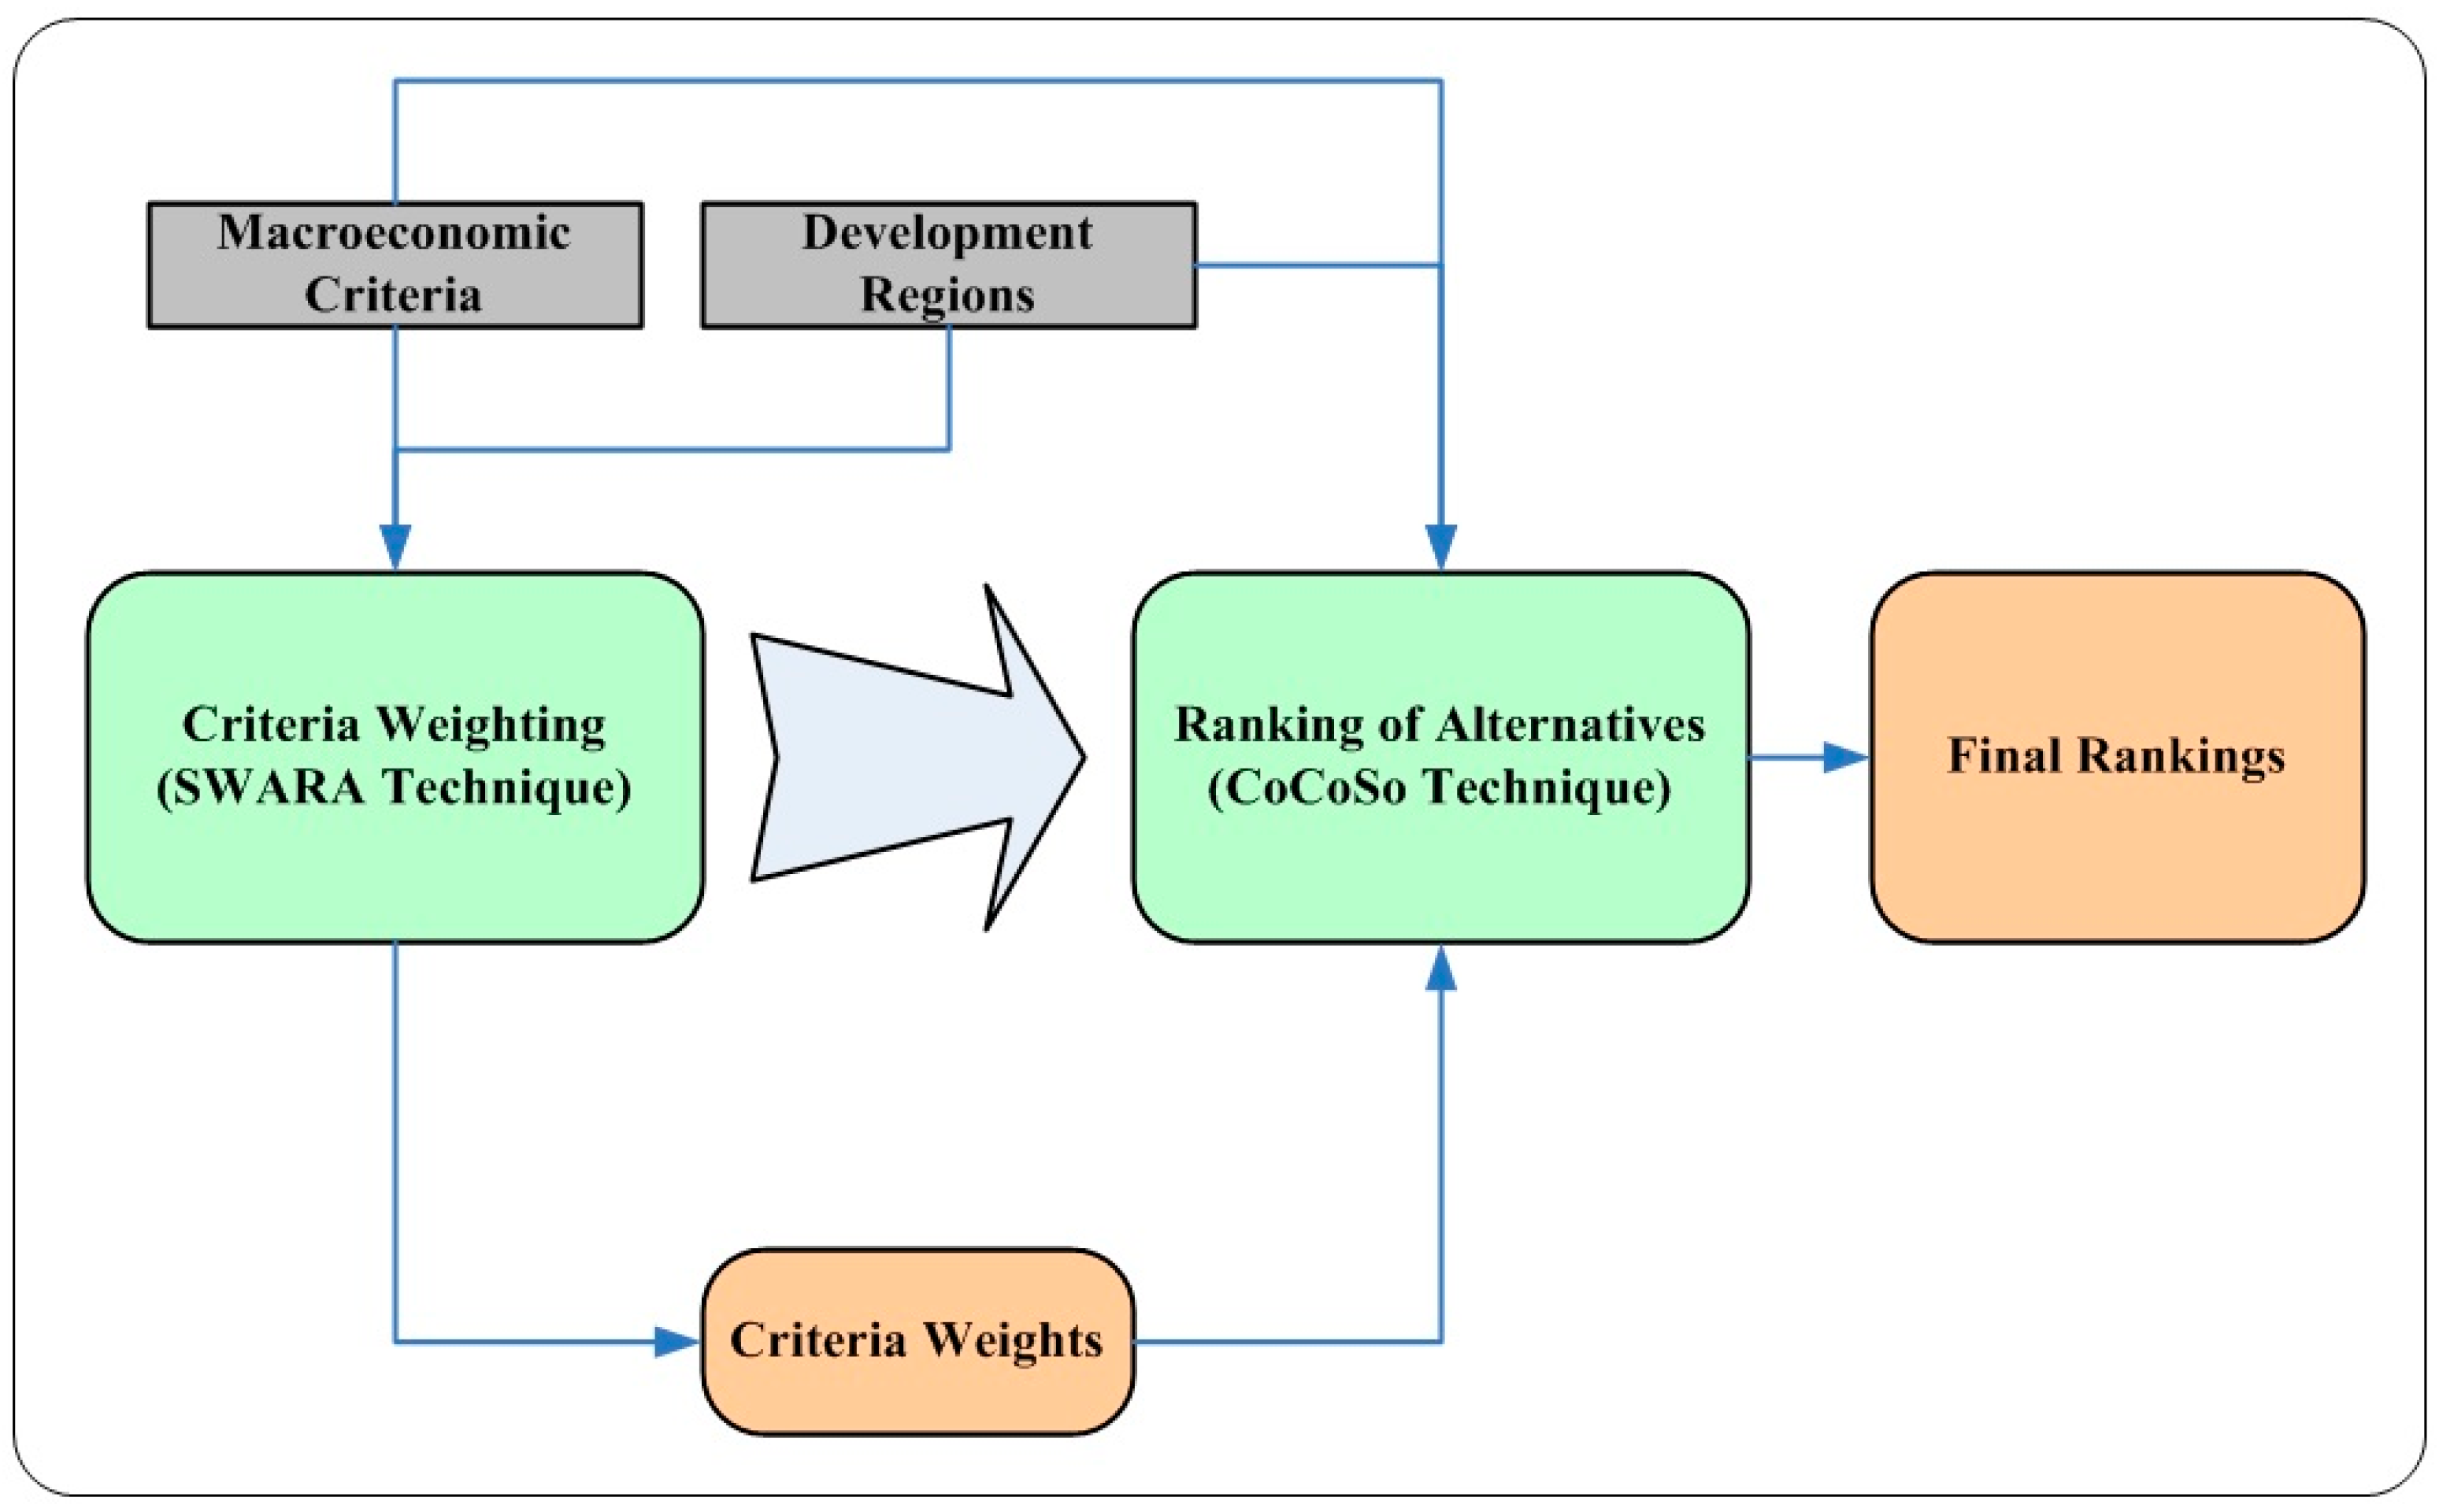
3.3. Multi-Criteria Analysis: A SWARA-Based CoCoSo Approach

In this study, a hybrid multi-criteria decision-making approach (see Figure 1) was developed to assess the macroeconomic performances of Turkish Development Regions. This approach involves developing a hierarchical structure for the problem and considering 7 criteria (see Table 3 for the descriptive statistics of the criteria). The weights for these criteria were calculated by using the SWARA method to prioritize the criteria relative to each other. To achieve precise and dependable rankings, a pairwise comparison matrix was developed. The resulting criteria weights were then integrated into the CoCoSo method for the final assessment. This approach was applied repeatedly throughout the study period to rank the Turkish Development Regions based on their macroeconomic performance.

3.3.1. Step-Wise Weight Assessment Ratio Analysis (SWARA) Method

The SWARA method, formulated by Keršulienė et al. [42], is a multi-criteria decision-making (MCDM) approach designed to assign weights to different criteria. This methodology comprises several stages, as detailed by Keršulienė et al. [42]:
Step 1: All criteria are organized in a descending order according to their importance.
Step 2: The Comparative Significance of the Mean Value (sj) is determined for each criterion. This step entails comparing criterion j with the following criterion (j + 1) to evaluate the relative importance of criterion j in relation to criterion (j + 1).
Step 3: The coefficient (kj) is calculated using Equation (1).
k j = 1 , j = 1 s j + 1 , j > 1
Step 4: The importance vector (qj) is obtained through the application of Equation (2).
q j = 1 , j = 1 k j 1 k j , j > 1
Step 5: The weights of the criteria (wj) are established using Equation (3).
w j = q j k = 1 n q k
The SWARA method capitalizes on experts’ direct evaluations of criterion importance, effectively harnessing their specialized knowledge and experiential insights. Unlike purely data-driven techniques such as the entropy method, which disregard subjective input, SWARA integrates expert judgment to produce more context-sensitive weightings. Its methodological simplicity facilitates swift and transparent computations, contrasting with the more intricate pairwise comparisons and consistency assessments required by methods like AHP. Grounded entirely in expert opinion, SWARA offers unparalleled flexibility in tailoring criterion weights to the nuances of specific decision-making environments, a distinct advantage in domains where domain expertise is paramount. Furthermore, its streamlined structure simplifies consistency verification processes, enhancing the robustness and interpretability of the results. Additionally, SWARA’s comparatively modest data demands alleviate challenges associated with data scarcity, thereby broadening its applicability across diverse empirical settings.

3.3.2. Combined Compromise Solution (CoCoSo) Method

The CoCoSo method, introduced by Yazdani et al. [43], combines the principles of Simple Additive Weighting (SAW), Multiplicative Exponential Weighting (MEW), and Weighted Aggregated Sum Product Assessment (WASPAS). This method’s distinctive ability to integrate data enhances the development of more reliable models and supports precise decision making [44]. The procedure involved in the CoCoSo method is outlined as follows [43].
Step 1: The decision matrix is first constructed. The criteria values are normalized according to the compromise normalization equations, applying Equation (4) for maximization-oriented criteria and Equation (5) for minimization-oriented criteria. Here, xij represents the value of alternative i for criterion j, while rij denotes the normalized value of alternative i for criterion j,
r i j = x i j min i x i j max i x i j min i x i j
r i j = max i x i j x i j max i x i j min i x i j
Step 2: The sums of the weighted comparability (Si) and power-weighted comparability sequences (Pi) for each alternative are computed using Equations (6) and (7). Here, wj represents the weight of criterion j.
S i = j = 1 n ( w j r i j )
P i = j = 1 n ( r i j ) w j
Step 3: Construct three aggregated assessment scores to determine the corresponding weights of the alternatives by using Equations (8)–(10). Broadly, Equation (8) denotes the arithmetic average of the total scores derived from the Weighted Sum Method (WSM) and the Weighted Product Method (WPM). In contrast, Equation (9) indicates the sum of the relative scores from the WSM and WPM in relation to the optimal choice. Equation (10) is utilized to calculate the balanced compromise score of the WSM and WPM models. While the values from Equation (10) can range from 0 to 1, a threshold value is typically established at 0.50.
k i a = P i + S i i = 1 m ( P i + S i )
k i b = S i min i S i + P i min i P i
k i c = λ ( S i ) + ( 1 λ ) ( P i ) ( λ max i S i + ( 1 λ ) max i P i )
Step 4: Determine the final ranking of the alternatives (ki) based on the descending order of the total scores calculated using Equation (11).
k i = ( k i a k i b k i c ) 1 3 + 1 3 ( k i a + k i b + k i c )

4. Results

4.1. Criteria Weights

In this study, the macroeconomic performance analysis of Turkish development regions is addressed within the framework of seven district criteria (see Table 3). Contrary to the literature, the SWARA method, which allows for subjective evaluation, was used as a weighting method. To this end, through interviews conducted with a group of experts in the fields of macroeconomics and development regions, the criteria were ranked from the most important to the least. Then, based on the importance order of each criterion, pairwise comparisons were conducted to determine the Comparative Significance of the Mean Value. The coefficients were calculated using Equation (1), followed by the importance vector using Equation (2), and the criterion weights (see Table 4) were calculated using Equation (3).
While gross domestic product (GDP) provides a measure of the overall economic size of a nation, it does not offer an adequate reflection of the country’s welfare levels. A more nuanced approach to assessing welfare is provided by GDP per capita (GDPPC), as it factors in income distribution across the population, thus offering a clearer depiction of average economic well-being. Although a high GDP signals a robust national economy, it can obscure underlying income inequalities. In contrast, GDPPC more accurately represents the economic power and purchasing capabilities of the average individual within a society. Consequently, GDPPC serves as a superior metric for evaluating the economic welfare of countries or regions, assessing disparities in development, and analyzing the effectiveness of social policies, as it reflects how economic prosperity is distributed across the population. For these reasons, GDPPC holds greater significance than GDP in the study when examining economic development, living standards, and income levels.
In addition, the employment rate, which reflects the proportion of the working-age population that is actively employed during a given period, serves as a more telling indicator of economic health than the unemployment rate. The latter merely captures those individuals within the labor force who are actively seeking employment but have not yet found work. By contrast, the employment rate illustrates the proportion of the population actively engaged in the labor market, offering a more comprehensive view of workforce participation and economic vitality. As such, the employment rate provides a more expansive and accurate picture of the economy’s overall efficiency, real productivity, and the status of the working population. This makes it a more reliable indicator for assessing the broader health of the labor market and the economic landscape. In light of these factors, the employment rate criterion has been deemed more significant than the unemployment rate criterion in this study.
Moreover, exports play a pivotal role in fostering economic growth by enabling a country to produce goods and services in response to external demand, whereas imports have a comparatively muted direct effect on growth. Exports contribute to mitigating the current account deficit by generating foreign exchange inflows, stimulate the growth and expansion of domestic firms, and promote employment through export-oriented production models—particularly by encouraging the production of high-value-added goods. An economy driven by exports is more adaptable to shifts in global market demand. In contrast, high levels of imports can lead to increased foreign exchange outflows, potentially exacerbating the current account deficit and contributing to economic instability. Moreover, imports may intensify competitive pressures on domestic producers, leading to job displacement in certain sectors. Countries excessively dependent on imports become more susceptible to exchange rate volatility and external financing risks. Therefore, exports are a more critical determinant than imports in macroeconomic performance analysis. While imports are not devoid of merit—such as providing access to intermediate goods and facilitating technology transfer—the primacy of exports in the foreign trade balance is essential for ensuring economic sustainability and long-term independence.

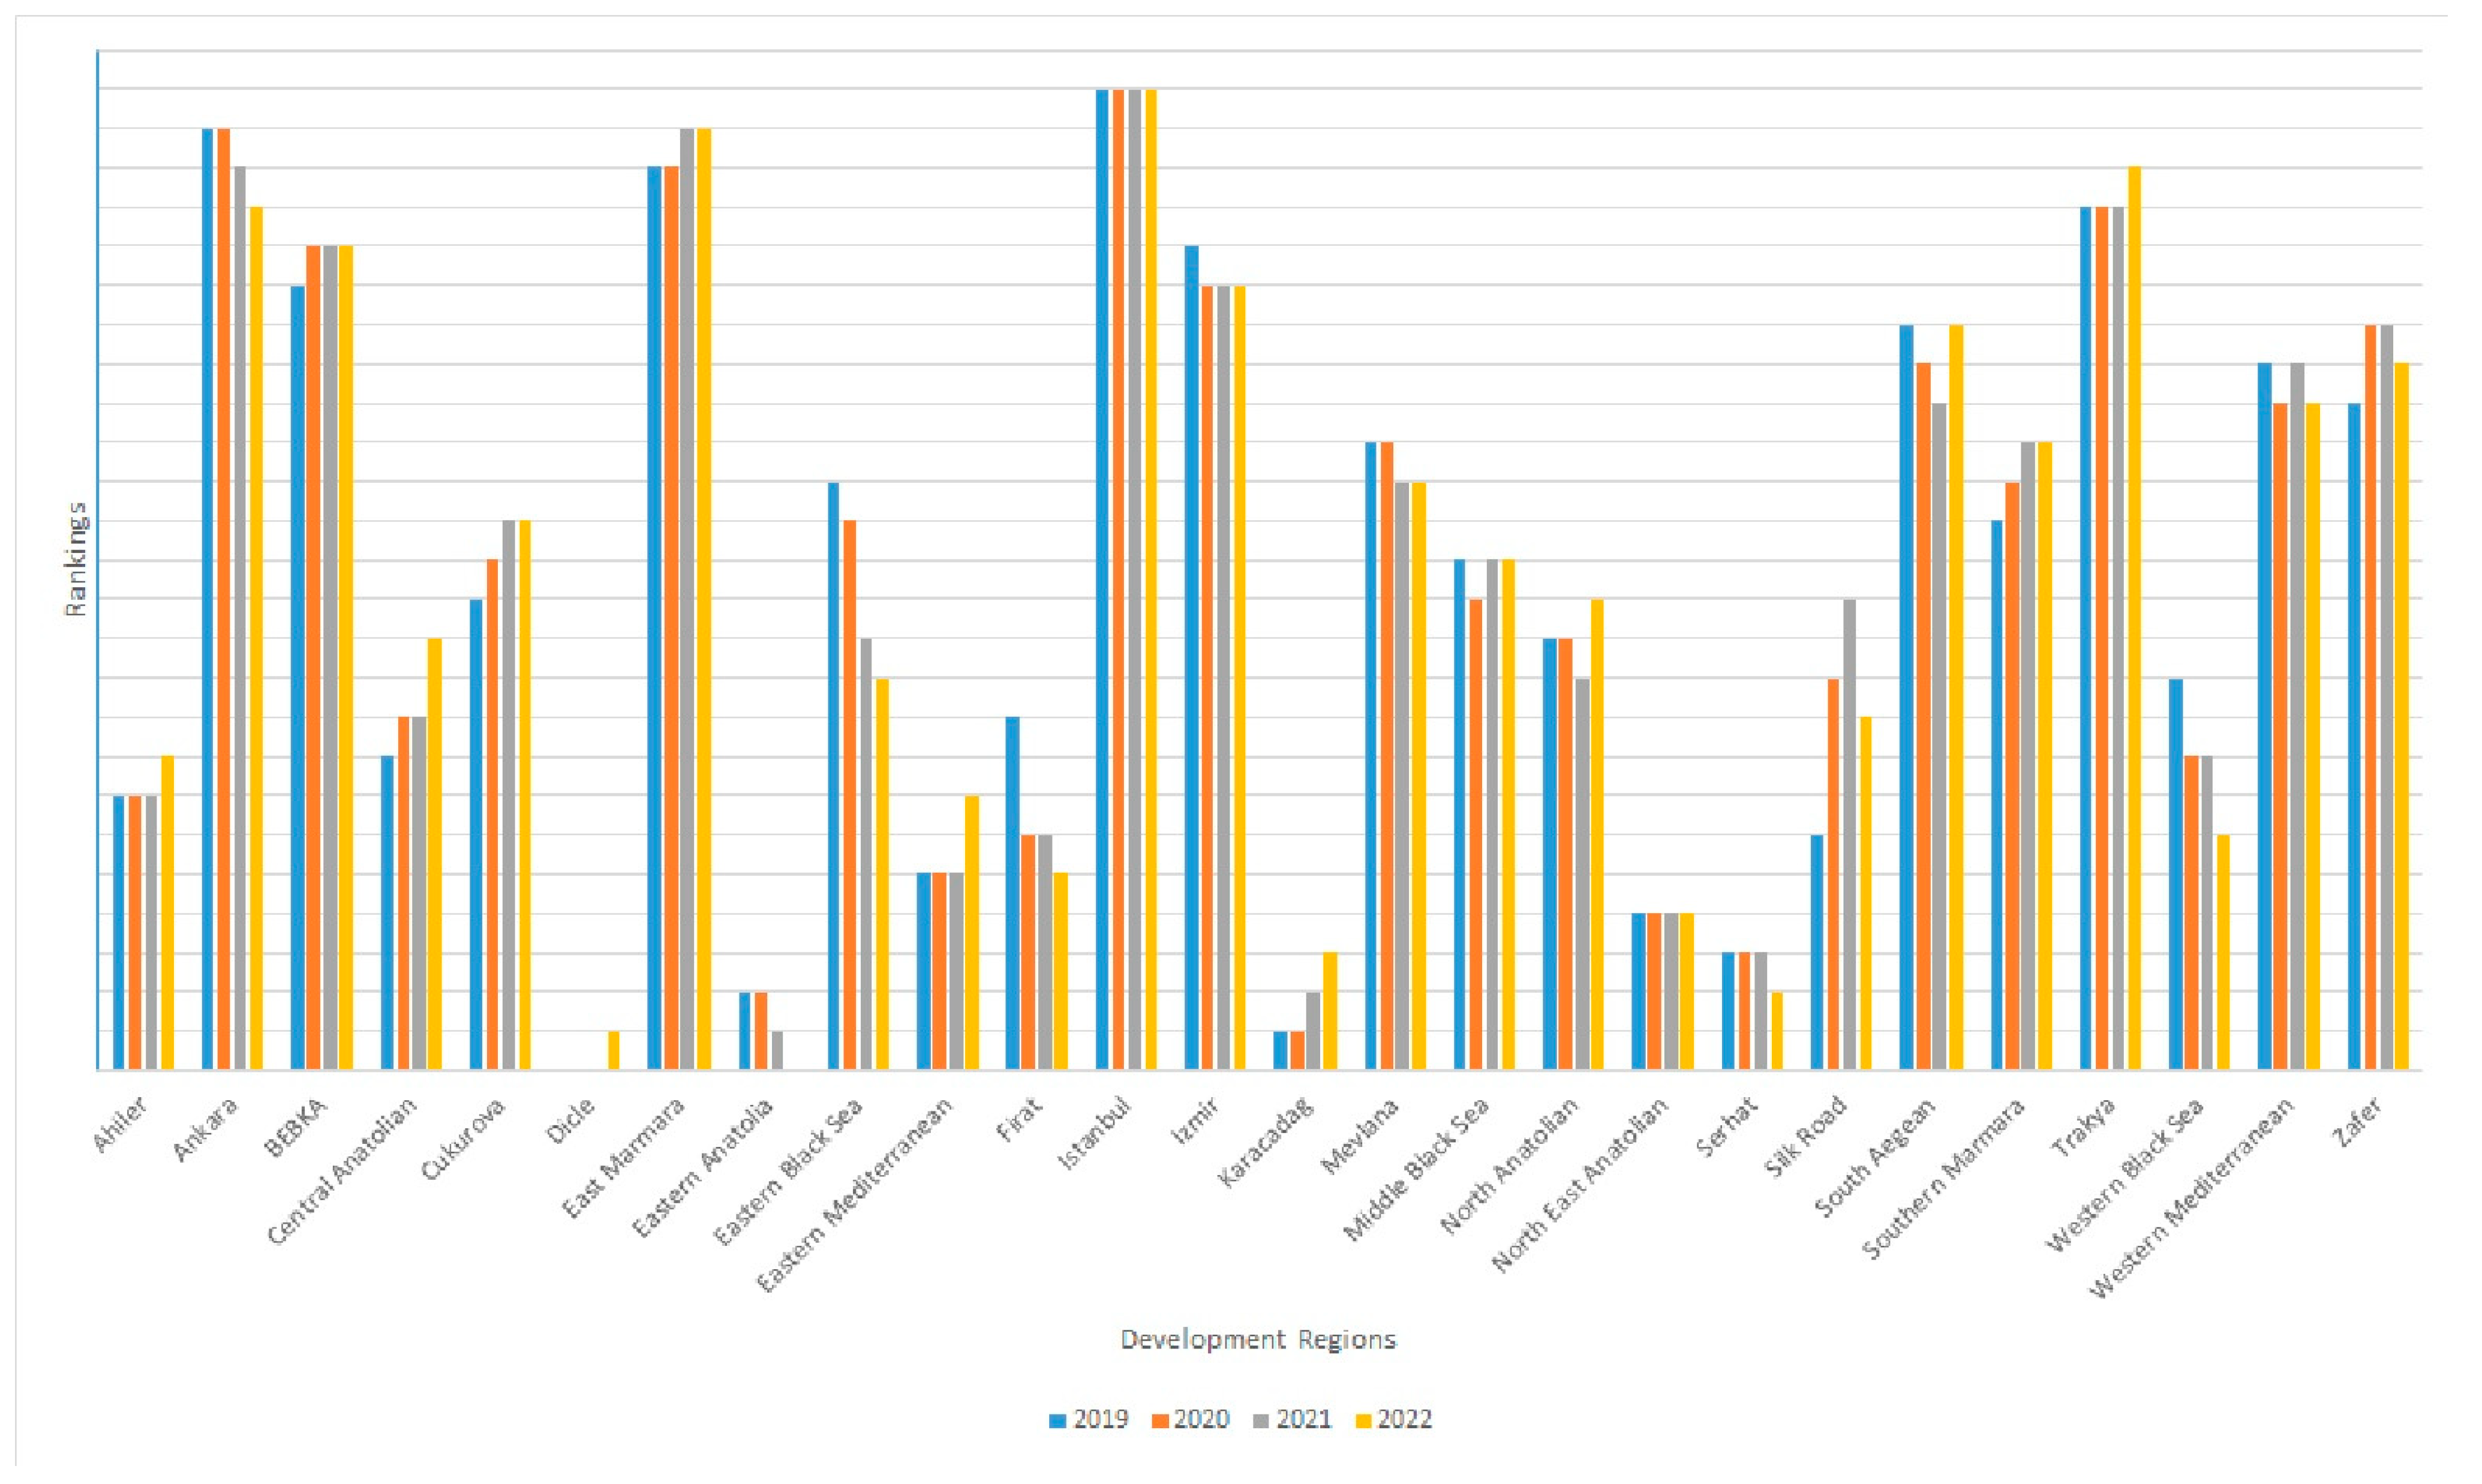
4.2. Rankings of the Development Regions

After determining the criterion weights, the second phase of the study involves ranking alternative development regions throughout the study period and monitoring their macroeconomic performances. In this context, an initial decision matrix (see Table 5) was developed, consisting of five maximization-oriented and two minimization-oriented criteria. Maximization-oriented criteria were normalized using Equation (4), while minimization-oriented criteria were normalized using Equation (5). The sums of the weighted comparability sequences were determined using Equation (6), and the sums of the power-weighted comparability sequences were specified using Equation (7). Three aggregated assessment scores were calculated using Equations (8)–(10). The total scores to be considered for the final rankings were calculated using Equation (11). All these steps were repeated for the years 2019 to 2022, and the final rankings for all years are given in Table 6 and Figure 2.
Istanbul stands out as the most economically robust region in Türkiye due to its high GDP, export volume, employment opportunities, industrial output, and role as a financial hub. The city’s economy is primarily driven by industries such as finance, services, technology, and manufacturing. Istanbul offers extensive job prospects in various sectors like industry, services, trade, and technology. With a high labor force participation rate, the region maintains a low unemployment rate and generates the most employment in the country. It is also home to Türkiye’s largest organized industrial zones, with industries like textiles, automotive, electronics, chemicals, pharmaceuticals, and machinery concentrated in and around the city. In terms of technology and research and development (R&D) investments, Istanbul is the most advanced region in Türkiye. It attracts the highest level of foreign direct investment (FDI) in the country, and large infrastructure projects such as airports, metro systems, bridges, and ports further boost its appeal. This makes Istanbul a preferred investment destination for multinational companies, enhancing its economic vitality. Its strong logistics infrastructure, including extensive ports, airports, and highways, along with the presence of large industrial and insurance companies, strengthens the financial sector through Borsa Istanbul (BIST). As a result, Istanbul’s high GDP and GDP per capita, coupled with its dominance in trade and exports, its central role in the finance and banking sectors, and its high employment rate, continue to place it at the top in terms of economic dynamism and competitiveness.
Ankara ranked second for the first two years, but its position has declined since then. While the capital is strong in sectors such as public services and defense, its industrial output lags behind Istanbul and East Marmara. The surge in exports from East Marmara and the Aegean regions in 2021–2022 likely contributed to Ankara’s decline. Despite having a strong high-tech sector, Ankara’s overall export share has remained relatively low. The growing business activity in cities like Istanbul, Izmir, and industrial zones contrasts with the slowdown in Ankara’s business growth, potentially impacting its macroeconomic performance. In summary, Ankara’s decline in rankings can be attributed to slower growth in industry and trade, limited increases in employment and business numbers, reduced competitiveness in exports, and changes in private sector investments. To improve its standing, Ankara must increase private sector investments, diversify its industrial production, and focus on export-oriented growth.
The Eastern Anatolia and Southeastern Anatolia development regions rank lower in terms of macroeconomic performance compared to other regions of Türkiye. The primary reasons for this include a lack of industrialization, low investment rates, employment challenges, insufficient infrastructure, and a shortage of human capital. While the Western and Marmara regions are advanced in industrial production, industrial investments in the East remain quite limited. The few organized industrial zones (OSBs) in the region are mostly small-scale, and the region’s economic activities largely depend on agriculture and livestock, which limits its contributions to economic growth and exports. Due to limited job opportunities, the employment rate is below the national average. In particular, young people struggle to find work, encouraging migration to larger cities. As investments in industrial and service sectors that could generate employment are inadequate, the region maintains a high unemployment rate. The per capita GDP in the East is significantly below the national average, and the low-income level restricts both domestic consumption and the ability to attract investment, thus hindering economic growth. Eastern cities are far from major industrial centers and ports, resulting in high logistics costs. Insufficient road, rail, and energy infrastructure further restricts the development of industry and trade. The lack of industrial production limits the region’s competitiveness in foreign trade, and since most of the production is for domestic consumption, export capacity is weaker compared to more developed regions. Large industrial areas like Istanbul, Kocaeli, and Izmir account for a substantial portion of Türkiye’s total exports, while export rates from the East are quite low. Despite incentives being offered in the region, industrial investment remains insufficient. The low level of education in the region makes it difficult for the workforce to engage in skilled jobs. The inadequacy of vocational education and technical schools restricts the development of the industrial and service sectors. The migration of educated and skilled individuals to large cities further reduces the availability of a qualified workforce in the region.
The Eastern Black Sea region initially ranked higher in the first years of the study but dropped five positions after four years, showing a decline in macroeconomic performance. The region has limited industrial and production capacity and cannot compete with Istanbul, East Marmara, and the Aegean regions in terms of industrial production and large-scale factories. While there has been an increasing trend of industrial investments in western regions, investment in the Eastern Black Sea has progressed relatively slowly, potentially limiting economic growth. Although agriculture and livestock play a significant role in the region’s economy, low-value-added production in these sectors may have contributed to the region’s drop in rankings. Exports from the Eastern Black Sea are largely based on agriculture and raw materials, and the insufficient export of industrial products may have reduced the region’s competitiveness. Employment rates in the region may have increased more slowly compared to other developed industrial regions. Particularly, the young and educated population migrates to larger cities like Istanbul, Ankara, and Izmir, where job opportunities are more abundant. The underdevelopment of industrial and service sectors may have led to a brain drain from the region. The tourism sector is important for the region, but due to its seasonal nature, it may not provide sufficient economic stability year-round. The region’s economy largely depends on agriculture (especially tea and hazelnut production) and livestock, but productivity issues in these sectors could negatively affect macroeconomic performance. Fluctuations in the prices of tea and hazelnuts may have weakened the incomes of local producers and the region’s overall economic power. Additionally, the inability to fully develop the necessary transportation, energy, and logistics infrastructure for industrial investments may have slowed economic growth. In conclusion, the decline in the Eastern Black Sea Region can be attributed to factors such as insufficient industrial investments, low export capacity, reduced employment and human capital, limited private sector investments, and infrastructure deficiencies. The economy of the Eastern Anatolia region has steadily declined, ultimately ranking at the bottom. This decline is directly linked to the region’s weak macroeconomic indicators and its disadvantages in certain economic activities. Eastern Anatolia is one of the regions in Türkiye with the lowest GDP, and its per capita GDP (GDPPC) is also low, resulting in income levels significantly below the national average. The lack of industrialization and the absence of large-scale production centers have restricted the region’s economic growth. Employment opportunities are limited, and the unemployment rate is higher than the national average. The economy of Eastern Anatolia heavily relies on agriculture and livestock, but productivity in these sectors is low. The agricultural sector in the region is inadequate in terms of modern farming techniques and irrigation systems, which reduces efficiency. While livestock is an important economic activity, the production and industrialization of processed animal products are insufficient, limiting their economic contribution. Private sector investments in Eastern Anatolia are very limited, and the region is one of the lowest in terms of exports in Türkiye. The lack of industrial products and value-added production weakens the region’s foreign trade strength. In short, the primary reasons for Eastern Anatolia’s decline to the bottom of the rankings include underdeveloped industrial production, low employment rates, high unemployment, inefficient agricultural production, a lack of industrialization, a low export and foreign trade capacity, insufficient private sector investments, brain drain due to a lack of education and human capital, infrastructure and transportation issues, geopolitical risks, and low investor confidence.
The Fırat Region is dominated by an agriculture-based economy, while the Western Black Sea region focuses more on industry and mining. However, growth in these sectors is not at a competitive level with the large industrial centers in the West. The economy of the Fırat Region is largely agricultural, but the use of traditional farming methods and inadequate irrigation systems has reduced agricultural productivity. While agriculture, mining, and industry are significant in the Western Black Sea, a lack of investment has limited growth in these sectors. Agriculture and livestock-based economies often struggle to compete with industrial and service-based economies, which is why the decline in these regions’ rankings is expected. Both the Fırat and Western Black Sea regions may have seen a decrease in private sector investments due to their inability to offer a competitive advantage in terms of investment. The limited production capacity has caused a decline in the region’s GDP and per capita GDP (GDPPC). In the Western Black Sea Region, exports based on industry and mining are significant, but due to the shift of industrial investments to other regions, export growth has remained limited.
To improve the economic performance of underperforming regions, the following measures could be taken: industrial investments should be encouraged, and the number of organized industrial zones (OSBs) should be increased. Infrastructure and transportation projects should be developed to strengthen the region’s logistics capabilities. Education and vocational training programs should be expanded to improve the quality of the workforce. Tax incentives should be provided to attract private sector and foreign investments. Export-oriented production should be encouraged, and the region’s foreign trade potential should be enhanced. These measures could accelerate economic growth and reduce macroeconomic disparities between regions.

5. Discussion

5.1. Interpretation of Results

The macroeconomic rankings over the 2019–2022 period highlight significant disparities among Turkish development regions. Istanbul consistently maintained the highest performance across all years, driven by its diversified industrial base, strong export capacity, high employment levels, and its status as a financial hub. The region’s robust infrastructure, foreign direct investment inflows, and R&D orientation further reinforced its top ranking.
Conversely, Eastern Anatolia persistently ranked lowest, reflecting structural deficiencies such as low industrialization, limited private investment, weak export performance, and high unemployment. The absence of large-scale industrial facilities and insufficient infrastructure, especially in logistics and transportation, have significantly hindered economic growth in the region.
Several regions, such as Ankara and Eastern Black Sea, exhibited fluctuations in performance, largely due to sectoral shifts, migration patterns, and changes in export competitiveness. For example, Ankara dropped in rankings in later years, possibly due to stagnation in industrial and export sectors despite a strong presence in public services and defense.

5.2. Hypotheses’ Evaluation

To strengthen the contribution of the proposed methodology, the following hypotheses were formulated and evaluated based on the results:
H1. 
There are statistically significant differences in macroeconomic performance among the 26 Turkish development regions during 2019–2022.
Confirmed. The performance rankings indicate substantial variation. Istanbul consistently ranked first, while Eastern Anatolia remained at the bottom. Regions like Ankara and the Eastern Black Sea showed fluctuations, confirming regional heterogeneity.
H2. 
The hybrid MCDM approach (SWARA-CoCoSo) provides a more comprehensive and realistic framework for evaluating regional macroeconomic performance compared to traditional single-indicator methods.
Supported. The use of SWARA allowed expert-based subjective weighting, giving greater importance to GDP per capita and the employment rate over basic GDP or import metrics. This led to rankings that more accurately reflected regional development realities.
H3. 
Regions with consistent macroeconomic indicators tend to maintain stable rankings over time.
Supported. Istanbul’s stable macroeconomic indicators corresponded with consistent top rankings, while Eastern Anatolia’s persistently weak indicators aligned with its continual bottom ranking. In contrast, regions with more volatile indicators experienced ranking shifts.

5.3. Limitations

Despite its contributions, this study has several limitations:
Temporal Scope: The analysis only covers the years 2019–2022, which include the COVID-19 pandemic period. Economic anomalies due to global disruptions may have influenced the rankings.
Subjectivity of Weights: While SWARA captures expert opinion, the weighting process is inherently subjective and may vary across panels.
Data Constraints: This study relies on publicly available data, which may have limitations in timeliness or completeness.
Indicator Selection: Only seven macroeconomic indicators were used; the inclusion of other dimensions (e.g., inflation, fiscal balance, and infrastructure index) could provide further insight.
Future studies may extend the time frame, include more diverse criteria, or apply alternative hybrid MCDM techniques for comparative validation.

6. Conclusions

This study employed a hybrid multi-criteria decision-making (MCDM) approach to compare the macroeconomic performance of 26 Turkish development regions between 2019 and 2022. The evaluation was conducted using seven macroeconomic criteria: the gross domestic product (GDP), GDP per capita, employment rate, number of enterprises, exports, unemployment rate, and imports. The Step-Wise Weight Assessment Ratio Analysis (SWARA) method was used to derive subjective weights based on expert judgment, and the Combined Compromise Solution (CoCoSo) method was applied to rank the regions. This hybrid methodology enabled a more comprehensive, consistent, and expert-driven comparison of regional macroeconomic performance.
From a theoretical standpoint, this study contributes to the existing literature by filling a significant gap in the comparative macroeconomic analysis of Turkish regions using advanced MCDM techniques. While previous studies often used objective weighting techniques (e.g., entropy and equal weights), this study uniquely incorporates subjective expert input through SWARA, allowing for a more nuanced and context-sensitive assessment. Furthermore, the implementation of the CoCoSo method in this context is novel, offering a robust mechanism for compromise-based decision making. This study therefore expands the methodological toolbox available for regional economic analysis and demonstrates how hybrid MCDM approaches can enhance the accuracy and policy-relevance of comparative assessments.
In terms of practical utility, the findings of this study offer significant insights for policymakers, development agencies, investors, and regional planners. The proposed methodology enables stakeholders to identify regional strengths and weaknesses in a structured and transparent way, helping to prioritize areas for investment and intervention. Development agencies, in particular, can use these results to allocate resources more efficiently and design targeted strategies that address regional disparities. Moreover, the analysis equips local entrepreneurs, businesses, and municipalities with empirical evidence to support funding applications, policy requests, and strategic planning efforts. In doing so, the methodology facilitates more sustainable and equitable economic growth across regions.
Despite its contributions, this study has several limitations. The selection of only seven macroeconomic indicators, while grounded in the literature, may not capture all dimensions of regional performance. Future research may incorporate additional criteria such as inflation, innovation indices, infrastructure quality, or environmental performance to offer a more holistic evaluation. Furthermore, while the SWARA-CoCoSo framework proved effective, comparative analyses using other hybrid MCDM methods (e.g., AHP-TOPSIS and DEMATEL-VIKOR) could enhance methodological robustness. Finally, extending the analysis beyond the 2019–2022 period or applying the model to other countries could validate the generalizability of the findings.
In conclusion, this study demonstrates that hybrid MCDM methodologies offer a powerful tool for understanding regional economic dynamics and guiding strategic development planning. By combining subjective expertise with objective performance data, the proposed approach enhances both the theoretical depth and practical impact of regional macroeconomic analysis.

Author Contributions

Conceptualization, methodology, software, validation, formal analysis, investigation, resources, data curation, writing—original draft preparation, writing—review and editing, visualization, N.T. and M.O. All authors have read and agreed to the published version of the manuscript.

Funding

This research received no external funding.

Institutional Review Board Statement

Not applicable.

Informed Consent Statement

Not applicable.

Data Availability Statement

Data are contained within the article.

Conflicts of Interest

The authors declare no conflicts of interest.

References

  1. Belke, M. Evaluation of macroeconomic performance of G7 countries with CRITIC and MAIRCA methods. İstanbul Ticaret Üniversitesi Sos. Bilim. Derg. 2020, 19, 120–139. [Google Scholar]
  2. Tekman, N. Foreign trade-based macroeconomic performance analysis of E7 countries. In Decision Making Approaches from a Macroeconomic Perspective, 1st ed.; Ordu, M., Ed.; BIDGE Publications: Ankara, Türkiye, 2024; pp. 4–19. [Google Scholar]
  3. Development Agencies. Available online: https://ka.gov.tr/sayfalar/bolgesel-kalkinma-ve-ulkemizde-bolgesel-kalkinma-politikalarinin-gelisim-sureci--22 (accessed on 31 January 2025).
  4. Ordu, M. Evaluating occupational accidents and diseases-based sustainable performances of the Turkish development regions using a hybrid MCDM approach. In Intelligent Engineering Applications and Applied Sciences for Sustainability, 1st ed.; Mishra, B.K., Ed.; IGI Global: Hershey, PA, USA, 2023; pp. 190–207. [Google Scholar]
  5. Tekman, N. A macroeconomic performance assessment regarding industry and employment for the Northeastern Anatolia Development Region. In Decision Making Approaches from a Macroeconomic Perspective, 1st ed.; Ordu, M., Ed.; BIDGE Publications: Ankara, Türkiye, 2024; pp. 20–36. [Google Scholar]
  6. Altay Topçu, B.; Oralhan, B. The comparison of Turkey and other OECD countries with multi criteria decision making methods in terms of basic macroeconomic indicators. Int. J. Acad. Value Stud. 2017, 3, 260–277. [Google Scholar]
  7. Ersoy, N. Assessment of macroeconomic performances of OECD countries using the MEREC-MULTIMOOSRAL model. Gümüşhane Univ. J. Soc. Sci. Inst. 2023, 14, 471–491. [Google Scholar]
  8. Öztürk, B.; Deniz Başar, Ö. Investigation of macroeconomic indicators of high income countries member of the World Trade Organization with multi-criteria decision making methods. Istanb. Ticaret Univ. J. Foreign Trade 2023, 1, 31–50. [Google Scholar]
  9. Oğuz, S.; Çetiner, Ö.; Yalçıntaş, D. Evaluation of EU candidate and potential candidate countries’ economic indicators with TOPSIS method. Çağ Univ. J. Soc. Sci. 2020, 17, 17–28. [Google Scholar]
  10. Orhan, M. Comparison of the macroeconomic performance between European Union member and candidate countries with ARAS method. J. Humanit. Tour. Res. 2020, 10, 115–129. [Google Scholar]
  11. Koşaroğlu, Ş.M. Comparison of the macroeconomic performances of E7 countries with the entropy and ARAS methods. Dumlupinar Univ. J. Soc. Sci. 2021, 68, 203–221. [Google Scholar]
  12. Sastry Musti, K.S. Multicriteria decision analysis for sustainable green financing in energy sector. In Green Finance Instruments, FinTech, and Investment Strategies, 1st ed.; Naifar, N., Elsayed, A., Eds.; Springer Cham: Switzerland, 2023; pp. 3–25. [Google Scholar]
  13. Li, T.; Wang, H.; Lin, Y. Selection of renewable energy development path for sustainable development using a fuzzy MCDM based on cumulative prospect theory: The case of Malaysia. Sci. Rep. 2024, 14, 15082. [Google Scholar] [CrossRef]
  14. Li, C.; Solangi, Y.A.; Ali, S. Evaluating the factors of green finance to achieve carbon peak and carbon neutrality targets in China: A delphi and fuzzy AHP approach. Sustainability 2023, 15, 2721. [Google Scholar] [CrossRef]
  15. Meng, X.; Shaikh, G.M. Evaluating environmental, social, and governance criteria and green finance investment strategies using fuzzy AHP and fuzzy WASPAS. Sustainability 2023, 15, 6786. [Google Scholar] [CrossRef]
  16. Li, Y.; Zhang, Y.; Solangi, Y.A. Assessing ESG factors and policies of green finance investment decisions for sustainable development in China using the fuzzy AHP and fuzzy DEMATEL. Sustainability 2023, 15, 15214. [Google Scholar] [CrossRef]
  17. Nguyen, P.H.; Nguyen, L.A.T.; Le, H.Q.; Tran, L.C. Navigating critical barriers for green bond markets using a fuzzy multi-criteria decision-making model: Case study in Vietnam. Heliyon 2024, 10, e33493. [Google Scholar] [CrossRef] [PubMed]
  18. Atan, M.; Özcan, M.; Arslantürk, Y. Spatial relations based on regional efficiency on Nuts II in determining hunger and poverty threshold: Turkey case. Gazi İktisat Ve İşletme Derg. 2015, 1, 1–16. [Google Scholar]
  19. Belgin, Ö.; Apaydın Avşar, B. Measuring R&D and innovation performance at regional and provincial level in Turkey using grey relational analysis. J. Product. 2019, 2, 27–48. [Google Scholar]
  20. Demirdöğen, O.; Erdal, H.; Kul, S. A stochastic model proposal for distribution center location problem: A case study in TRA district. Atatürk Univ. J. Econ. Adm. Sci. 2017, 31, 555–570. [Google Scholar]
  21. Gergin, R.E.; Tip, F.N.; Peker, İ. Site selection of weapon industrial zone in TR-90 region with integrated FUCOM-VIKOR approach. J. Res. Bus. 2024, 9, 365–394. [Google Scholar]
  22. Durmaz, K.İ.; Çalış Boyacı, A.; Gencer, C. Evaluation of level-1 regions in Turkey in terms of educational indicators with multi-criteria decision making methods. J. Inf. Technol. 2020, 13, 13–25. [Google Scholar]
  23. Erkılıç, C.E. Comparison of level 1 regions according to the statistical regional unit classification of Turkey in terms of public health service infrastructure and human resources. J. Erciyes Acad. 2022, 36, 2006–2031. [Google Scholar] [CrossRef]
  24. Gök Kısa, A.C. Evaluation of renewable energy sources in TR83 region by CRITIC based grey relational analysis approach. Pamukkale Univ. J. Eng. Sci. 2021, 27, 542–548. [Google Scholar] [CrossRef]
  25. Örtlek, Z. Analysis of socioeconomic performance: Turkey level 2 region. Nevşehir Hacı Bektaş Veli Univ. J. ISS 2024, 14, 1934–1954. [Google Scholar] [CrossRef]
  26. Sungur, O.; Işık Maden, S. Ranking of manufacturing industry sectors in TR61 region (Antalya, Isparta, Burdur) with PROMETHEE method. Ege Akad. Rev. 2016, 16, 641–654. [Google Scholar]
  27. Yalçınkaya, Y.; Dulupçu, M.A.; Baykul, A. Evaluation of the investment climate of organized industrial zones with TOPSIS method: An implementation on Nuts 3. J. Mehmet Akif Ersoy Univ. Econ. Adm. Sci. Fac. 2018, 5, 90–107. [Google Scholar]
  28. Yıldırım, B.F.; Yeşilyurt, C. Bulanık analitik hiyerarşi prosesi yaklaşımı ile proje değerlendirme kriterlerinin önceliklendirilmesi: Kalkınma ajansı örneği. Atatürk İletişim Derg. 2014, 6, 23–50. [Google Scholar]
  29. Ordu, M.; Tekman, N. A macroeconomic investigation of the Organization of Turkic States by a hybrid decision-making approach. In Decision Making Approaches from a Macroeconomic Perspective, 1st ed.; Ordu, M., Ed.; BIDGE Publications: Ankara, Türkiye, 2024; pp. 37–52. [Google Scholar]
  30. Hokka, C.; Bektaş, S. Macroeconomic performance measurement with MCDM methods: The case of D8 countries in 2021–2022. Çukurova Univ. Soc. Sci. Inst. J. 2024, 33, 397–420. [Google Scholar]
  31. Pınar, A.; Yıldırım, M.; Erdoğan, S. COVID measuring the performance of the Turkish economy in the COVID period and after with the CRITIC, TOPSIS and MABAC methods. KMU J. Soc. Econ. Res. 2023, 25, 433–449. [Google Scholar]
  32. Arsu, T. Assessment of macroeconomic performances and human development levels of BRICS and MINT countries using CRITIC and COPRAS methods. Pac. Bus. Rev. 2022, 14, 1–19. [Google Scholar]
  33. Doğan, H. Evaluation of Turkey’s macroeconomic performance for 2010–2020 with the CRITIC based ARAS method. Asya Stud. —Acad. Soc. Stud. 2022, 6, 189–202. [Google Scholar] [CrossRef]
  34. Al, İ.; Demirel, S.R. The Evaluation of macroeconomic performance of Turkey with TOPSIS method: The period of 2002-2019. Mehmet Akif Ersoy Univ. J. Econ. Adm. Sci. Fac. 2022, 9, 202–222. [Google Scholar]
  35. Coşkun, A.E. Evaluation of macroeconomic performances of BRICS-T economies: Entropy-based WASPAS approach. İstanbul Ticaret Üniversitesi Sos. Bilim. Derg. 2022, 21, 1320–1340. [Google Scholar] [CrossRef]
  36. Uludağ, A.S.; Ümit, A.Ö. An analysis of value-added production and macroeconomic performances of the Turkic countries via DEMATEL and COPRAS methods. Sosyoekonomi 2020, 28, 139–164. [Google Scholar] [CrossRef]
  37. Yapa, K.; Durmus, M.; Tayyar, N.; Akbulut, İ. Comparison of the European Union countries and Turkey’s macroeconomic indicators with Best Worst method. In Handbook of Research on Social and Economic Development in the European Union, 1st ed.; Bayar, Y., Ed.; IGI Global: Hershey, PA, USA, 2020; pp. 204–219. [Google Scholar]
  38. Chattopadhyay, S.; Bose, S. Global macroeconomic performance: A comparative study based on composite scores. J. Rev. Glob. Econ. 2015, 4, 51–68. [Google Scholar] [CrossRef]
  39. Turkish Statistical Institute. Available online: https://www.tuik.gov.tr/ (accessed on 31 January 2025).
  40. Geographic Statistics Portal. Available online: https://cip.tuik.gov.tr/ (accessed on 31 January 2025).
  41. General Directorate of Relations with Civil Society. Available online: https://www.siviltoplum.gov.tr/bilgimerkezi/kalkinma-ajanslari (accessed on 31 January 2025).
  42. Keršuliene, V.; Zavadskas, E.K.; Turskis, Z. Selection of rational dispute resolution method by applying new step-wise weight assessment ratio analysis (SWARA). J. Bus. Econ. Manag. 2010, 11, 243–258. [Google Scholar] [CrossRef]
  43. Yazdani, M.; Zarate, P.; Kazimieras Zavadskas, E.; Turskis, Z. A combined compromise solution (CoCoSo) method for multi-criteria decision-making problems. Manag. Decis. 2019, 57, 2501–2519. [Google Scholar] [CrossRef]
  44. Torkayesh, A.E.; Pamucar, D.; Ecer, F.; Chatterjee, P. An integrated BWM-LBWA-CoCoSo framework for evaluation of healthcare sectors in Eastern Europe. Socio-Econ. Plan. Sci. 2021, 78, 101052. [Google Scholar] [CrossRef]
Figure 1. SWARA-based CoCoSo Approach.
Sustainability 17 05222 g001
Figure 2. A graph of rankings of the development regions.
Sustainability 17 05222 g002
Table 1. The literature review of multi-criteria analysis applied to macroeconomic performance.
StudyMacroeconomic IndicatorsMCDM Approach Used
Ordu and Tekman [29]Gross domestic product (GDP), GDP per capita (GDPPC), Export (EXP), Import (IMP), Labor Force, PopulationEntropy-based COPRAS
Hokka and Bektaş [30]Gross Domestic Product (GDP), Unemployment Rate (UR), Inflation Rate (IR), Misery Index (MI), Gross Domestic Product per Capita (GDPPC)Entropy-based ARAS
Öztürk and Deniz Başar [8]Growth (G), Export (EXP), Import (IMP), IR, URExpert Opinion, DEMATEL, and Equally Weighted-based TOPSIS and EVAMIX
Pınar et al. [31]Growth Rate (GR), IR, UR, Current Balance (CB), Budget Balance (BB)/GDPCRITIC-based TOPSIS and MABAC
Ersoy [7]IR, UR, GDPPC, CBMEREC-based MULTIMOOSRAL
Arsu [32]Economic Growth Rate, UR, IR, EXP/IMP, GDPPCCRITIC-based COPRAS
Doğan [33]GDP, GDPPC, EXP/IMP, Foreign Direct Investment (FDI) Inflow, Interest Rate, IR, URCRITIC-based ARAS
Al and Demirel [34]EG, IR, UR, CBTOPSIS
Coşkun [35]GDP, GDPPC, EXP, IMP, Growth Rate (GR), FDI, IR, UREntropy-based WASPAS
Koşaroğlu [11]EG, Investment Rate, EXP, IMP, Current Account Balance (CAB)/GDP, UR, IREntropy-based ARAS
Uludağ and Ümit [36]GDP, GDPPC, Real GDP per Capita in Purchasing Power Parity, GDP Deflator Representing Inflation, Foreign Debt/GDP, FDI Inflow/GDP, UR, EXP/IMPDEMATEL-based COPRAS
Oğuz et al. [9]Public Debts (PD)/GDP, UR, Budget Deficit/GDP, GDP/Population, IRTOPSIS
Orhan [10]GDPPC, Employment Rate (ER), EXP, IMPARAS
Yapa et al. [37]Bond Yields, GDPPC, UR, IR, GrowthExpert Opinion-based BWM
Belke [1]GDPPC, EG, Investment Rate, Trade, CAB, BB, PD, UR, IRCRITIC-based MAIRCA
Altay Topçu and Oralhan [6]GDPPC, GR, IR, EXP, IMP, ERELECTRE, TOPSIS
Chattopadhyay and Bose [38]GR of Real GDP, GDPPC, UR, Fiscal Balance, IR, and CABEntropy-based TOPSIS
Table 2. Criteria used in the study.
CriteriaUnitType of Optimization
Gross Domestic Product (GDP)Thousand TRYMaximization
Gross Domestic Product per Capita (GDPPC) TRY
Employment Rate (ER)%
Number of Enterprise (NoE)-
Export (EXP)Thousand USD
Unemployment Rate (UR)%Minimization
Import (IMP)Thousand USD
Table 3. Descriptive statistics of criteria values over the study period (2019–2022).
CriteriaPeriodsMeanStandard DeviationMinimumMaximum
Development RegionValueDevelopment RegionValue
GDP2019166,069,609252,114,375Serhat25,573,945Istanbul1,325,199,566
2020194,175,690289,085,53031,618,8161,518,604,665
2021279,082,375421,185,93938,931,4192,204,761,565
2022577,375,999869,942,14779,538,9964,564,280,141
GDPPC201942,99116,432.31Karacadag20,285Istanbul86,651
202050,45018,251.2024,13998,032
202171,05228,303.8931,335140,864
2022145,35856,925.97Eastern Anatolia63,706287,524
ER201944.805.22Dicle30.00Trakya53.00
202042.305.3126.0050.90
202144.524.8429.9052.00
202246.584.5333.8054.10
NoE2019152,104174,865.8Serhat30,567Istanbul944,954
2020157,508182,664.330,507985,862
2021168,641198,471.731,0971,069,885
2022178,483212,819.030,6761,144,953
EXP20196,955,10417,234,804North East Anatolian37,783Istanbul88,827,640
20206,524,49716,012,06943,78782,815,389
20218,661,97620,988,04251,230108,666,008
20229,775,71524,098,59554,167124,661,773
UR201913.425.71North Anatolian7.60Dicle30.90
202012.775.786.6033.50
202112.004.865.8029.80
202210.583.326.20Eastern Anatolian19.20
IMP20197,027,49521,172,603North East Anatolian35,873Istanbul109,280,926
20207,779,62824,568,89746,520126,858,302
20219,190,81426,780,975Serhat104,799138,122,531
202211,576,54634,562,483North East Anatolian64,151178,524,546
Table 4. Criteria weights.
Criteriasjkjqjwj
Gross Domestic Product per Capita (GDPPC) 1.001.00000.2203
Gross Domestic Product (GDP)0.101.100.90910.2003
Employment Rate (ER)0.301.300.69930.1541
Unemployment Rate (UR)0.151.150.60810.1340
Export (EXP)0.151.150.52880.1165
Number of Enterprise (NoE)0.201.200.44060.0971
Import (IMP)0.251.250.35250.0777
Table 5. Initial decision matrix for the year 2022.
Development RegionsGDPGDPPCERNoEEXPURIMP
Ahiler213,743,671131,54445.2085,956782,9959.40638,674
Ankara1,329,809,540230,67747.20338,87112,004,80912.1014,496,010
BEBKA821,862,745191,03050.00235,25214,228,7038.9011,339,450
Central Anatolian323,443,080129,79645.30118,8394,074,2889.401,925,501
Cukurova618,038,019148,12145.70211,6179,279,32412.3011,738,531
Dicle215,432,25290,49133.8062,2302,275,47018.50815,354
East Marmara969,517,862233,96450.90212,59020,848,96610.1023,424,210
Eastern Anatolia138,051,38663,70640.2057,440338,90919.20367,097
Eastern Black Sea264,414,96698,23950.00135,5242,091,5279.20436,371
Eastern Mediterranean397,697,166116,66350.30149,9155,851,99514.6010,305,331
Firat169,766,68896,06244.0074,551836,1728.10220,209
Istanbul4,564,280,141287,52444.101,144,953124,661,77310.20178,524,528
Izmir972,237,714218,77947.30280,68517,014,90113.0013,576,367
Karacadag267,712,07967,69537.70117,058728,26911.50465,607
Mevlana361,266,882141,86747.30138,1633,609,9457.401,550,248
Middle Black Sea293,470,888103,64949.90138,1613,385,6328.105,049,454
North Anatolian98,425,885124,18149.8038,439669,6856.20479,368
North East Anatolian111,061,603103,19345.4039,96854,1679.2064,151
Serhat79,538,99672,79344.5030,676159,06312.70137,371
Silk Road377,360,208129,11044.40130,22911,406,44910.708,635,387
South Aegean501,514,462155,29249.90226,6366,664,8408.603,529,164
Southern Marmara290,556,641160,31347.60109,5771,126,9767.10763,328
Trakya421,082,669220,55554.10106,4493,487,0907.803,484,830
Western Black Sea144,270,133138,41543.8049,155959,2889.203,316,676
Western Mediterranean598,661,465177,47752.20239,6543,302,10414.602,057,482
Zafer468,558,836148,17050.50167,9764,325,2547.103,649,490
Table 6. Rankings results based on years.
Development Regions2019202020212022
Ahiler19191918
Ankara2234
BEBKA6555
Central Anatolian18171715
Cukurova14131212
Dicle26262625
East Marmara3322
Eastern Anatolia24242526
Eastern Black Sea11121516
Eastern Mediterranean21212119
Firat17202021
Istanbul1111
Izmir5666
Karacadag25252423
Mevlana10101111
Middle Black Sea13141313
North Anatolian15151614
North East Anatolian22222222
Serhat23232324
Silk Road20161417
South Aegean7897
Southern Marmara12111010
Trakya4443
Western Black Sea16181820
Western Mediterranean8989
Zafer9778
Disclaimer/Publisher’s Note: The statements, opinions and data contained in all publications are solely those of the individual author(s) and contributor(s) and not of MDPI and/or the editor(s). MDPI and/or the editor(s) disclaim responsibility for any injury to people or property resulting from any ideas, methods, instructions or products referred to in the content.

