1. Introduction
In recent years, China’s economic growth deceleration has brought social conflicts into sharper relief. In response, the Chinese government has increasingly appreciated the pivotal role of public services as a “stabilizer” in social operations. Through the sequential issuance of key policy documents, including the National Basic Public Service System “12th Five-Year” Plan, the “13th Five-Year” Plan for Promoting the Equalization of Basic Public Services, and the “14th Five-Year” Public Service Plan, the government has cultivated a conducive policy environment for the advancement of public services. Concurrently, there has been a sustained increase in investment in public service initiatives. Based on the figures from the China Health Statistics Yearbook 2022, there has been a marked upswing in government spending within the healthcare sector, jumping from 1.57 trillion CNY in 2018 to 2.68 trillion CNY by 2022. Nonetheless, it is imperative to recognize that, as the world’s most populous nation, China cannot feasibly sustain a model of public service delivery that relies exclusively on increased investment in a “one-size-fits-all” approach for its 1.4 billion citizens. Such a strategy is neither prudent nor viable in the long term. Thus, enhancing the efficiency of public services emerges as an essential pathway for the Chinese government to ensure sustainable economic development.
In the meantime, digitalization is reshaping human society in profound ways. By 2022, the global digital economy had expanded to a staggering USD 38.1 trillion, representing 45% of the worldwide GDP. This shift has been particularly evident during the COVID-19 pandemic, where the digital economy has become deeply intertwined with public services. It has introduced novel business models, scenarios, and service offerings to traditional sectors such as education, healthcare, and government services. The digital economy has emerged as a crucial driver in optimizing resource allocation, fostering collaboration among multiple stakeholders, and catalyzing external oversight and governmental reforms. The digital economy has unlocked new potential for enhancing public service efficiency. However, whether the digital economy positively impacts public service efficiency and what mechanisms such impacts are realized remain pressing questions that demand further exploration.
In light of this context, this study examines the impact of the digital economy on public service efficiency and its underlying mechanisms. Initially, we outline the theoretical pathways through which the digital economy can enhance public service efficiency and derive four hypotheses based on these mechanisms. Subsequently, we develop a DEA (Data Envelopment Analysis) model to assess the public service efficiency of prefecture-level cities in China. Further, leveraging panel data from 288 Chinese cities spanning 2011–2022, we utilize a double fixed-effects and a mechanism analysis model to test the four hypotheses. The results confirm that the data support all four theoretical hypotheses, suggesting that the digital economy has significantly improved local public service efficiency. Moreover, political environment, government autonomy, urban innovation capacity, and social attention positively moderate the relationship between the digital economy and local public service efficiency.
The remainder of this paper consists of four sections:
Section 2 presents four hypotheses;
Section 3 discusses data selection, public service efficiency modeling, and econometric models;
Section 4 reports the results of the empirical tests and conducts robustness checks; and
Section 5 summarizes the study and offers policy recommendations.
2. Literature Review
2.1. The Concept and Evaluation of Public Service Efficiency
Efficiency has long been a core management value for public organizations, with its significance deeply embedded in the evolution of public administration thought [
1]. Research on public service efficiency has evolved to encompass four major dimensions: productive (or technical) efficiency, allocative efficiency, distributive efficiency, and dynamic efficiency. Each dimension addresses a distinct aspect: allocative efficiency examines how well the supply of public services matches the structure of demand, often related to the effectiveness of supply; distributive efficiency focuses on the equitable distribution of services across different groups or regions; dynamic efficiency considers the sustainability and future development potential of public services; and productive efficiency, which is widely used to assess the effectiveness of transforming inputs into outputs, aims to achieve the Pareto optimal state in public service supply [
2]. This study specifically focuses on productive efficiency, evaluating whether local governments can maximize public service supply under resource constraints by examining the ratio of outputs to inputs.
In terms of research subjects, studies on public service efficiency generally follow two major paths. The first path focuses on the efficiency of specific service areas, such as public health [
3], education [
4], and cultural services [
5,
6]. The second path, however, assesses the overall efficiency across multiple public services [
6,
7]. Given the inherent complexity and interrelatedness of public service supply, as well as evidence that local residents tend to judge government performance based on the overall availability and comprehensive experience of key services rather than isolated areas [
8], this study adopts the holistic assessment method. The government operates as an integrated system, and resource allocation and performance in one area inevitably affect others. Therefore, evaluating comprehensive (or overall) efficiency is not only necessary but also essential. Based on this rationale, this study defines overall public service efficiency as the ratio of outputs to inputs in the government’s provision of core services, including healthcare, education, public culture, social security, and public infrastructure.
When it comes to evaluating public service efficiency, scholars primarily employ two methodological approaches: parametric and non-parametric methods. Novignon et al. [
9] (2017) and Zhu et al. [
10] (2024) utilized stochastic frontier analysis (SFA), a parametric technique, to assess public service efficiency across different countries. It should be noted that in SFA models, random effects may capture unobserved organizational-specific factors affecting efficiency, which are distinct from inefficiency [
11]. As a non-parametric method, data envelopment analysis (DEA) is particularly effective for evaluating complex systems with multiple inputs and outputs and is widely applied in this area [
9,
10]. For example, Ren et al. [
12] utilized a three-stage DEA model to analyze the efficiency of sports services in China’s 31 provinces in 2016. Li and Liu [
13] (2021) employed DEA’s CCR and BBC models to examine the efficiency of rural public health services in 29 Chinese regions from 2004 to 2018. Yao et al. [
14] (2024) assessed China’s public service efficiency using DEA and explored its spatial variations. However, previous research has mainly used traditional DEA models like the CCR and BBC to assess public cultural service efficiency. In this study, we apply the SBM-DEA model, which overcomes the drawback of traditional DEA methods’ inability to rank multiple efficient DMUs [
15]. It permits variable input–output ratios in public cultural services, offering a more precise efficiency evaluation and better identification of influencing factors [
15].
2.2. Factors Influencing Public Service Efficiency
Current scholarship has extensively explored the determinants of public service efficiency. These studies often examine governments’ dynamic management behaviors, revealing that specific governmental actions can significantly influence public service efficiency. For instance, the implementation of targeted policies can catalyze improvements in public service efficiency through top-down incentives. China’s Civilized City policy is a case in point, where top-down incentives have demonstrably enhanced public service efficiency [
16]. Conversely, the misuse of consulting services can undermine public service efficiency [
17]. Second, governmental information disclosure and regulatory practices exert a substantial impact on efficiency. During the procurement of public services, excessive transparency regarding past transactions may erode fiscal expenditure efficiency [
18]. Moreover, regulatory actions in specific sectors, particularly in the environmental domain, can affect public service efficiency [
19]. Third, the mode of service delivery plays a pivotal role in shaping public service efficiency. The outsourcing of public services has been extensively debated. Research indicates that while private provision of public services in the health sector can boost efficiency, it may also compromise service quality [
20]. Hospitals operating under public–private partnerships tend to outperform those under traditional management models [
21]. In contrast, public departments are more efficient than private ones in education [
4]. In municipal infrastructure, services dominated by the private sector incur higher costs than those managed by non-profits [
22]. Some studies have critiqued the conventional cost–benefit analysis approach to evaluating different public service models. While private sector operations may appear more efficient, a singular focus on cost may skew the selection of public service models. Other factors, such as population size and stakeholder expectations, warrant consideration [
23].
On the other hand, research also examines the impact of the static government structure. First, fiscal decentralization has been extensively studied for its influence on public service efficiency. However, its effects vary significantly due to regional differences and national contexts [
7,
24]. In China, horizontal market segmentation among provinces has been shown to reduce public service efficiency. Conversely, vertical competition between the central and local governments can enhance public service efficiency when fiscal decentralization is limited. Yet, once the degree of fiscal decentralization surpasses a certain threshold, this positive effect becomes negative [
14]. Second, the characteristics of key minority elites substantially impact public services. For instance, higher salaries and more extraordinary dedication among politicians can significantly boost public service efficiency in their regions [
25]. Third, the political environment is a critical determinant of public service efficiency. Public service efficiency is typically lower in areas with rampant corruption and limited voter access to information on government practices [
26]. Compared to centralized systems, decentralized political environments are more conducive to improving public service efficiency [
27]. Moreover, the political strength of local governments can enhance public service efficiency [
28]. Public sports services, mainly, are more efficient in regions with more vigorous economic development, excellent government support, and advanced education [
29].
Current scholarship on the determinants of public service efficiency, particularly those examining government behavior and structural factors, has laid the necessary groundwork for this study. However, the relationship between the digital economy and public service efficiency remains underexplored. For instance, one study highlights the critical role of an independent information integration department in enhancing public service efficiency in the digital age [
30]. Another study, through case analysis, demonstrates that blockchain technology can boost the operational efficiency of public services and aid the public sector in better realizing public value [
31]. Additionally, some scholars have employed provincial-level data in China to verify the nonlinear impact of Internet development on public service efficiency [
32] and to test the positive influence of the digital economy on public service efficiency using maximum likelihood estimation [
33]. Despite these contributions, existing studies still fail to elucidate the mechanisms through which the digital economy impacts public service efficiency. Moreover, they have yet to establish a robust connection with the broader literature on the determinants of public service efficiency. Furthermore, most of these studies rely on provincial-level public service data, with relatively sparse attention to public service efficiency at the city level, thus lacking sufficient granularity and depth.
3. Theoretical Analysis and Hypothesis Development
3.1. Digital Economy on the Efficiency of the Public Service
The digital economy represents a novel economic paradigm, building upon agricultural and industrial economies. Integrating digital technologies such as 5G, AI, blockchain, cloud computing, and IoT, it is reshaping societal operations. This technological fusion permeates market and public governance sectors, driving upgrades in traditional industries and nurturing emerging digital industries and business models. It instigates systemic transformations in social structures.
The digital economy amplifies efficiency via dual pathways within the public services domain. On the demand side, it equips citizens with more avenues to articulate their public service needs. Digital technologies, exemplified by big data, efficiently and accurately capture public demands. This addresses information-matching issues in basic public services, rooted in information asymmetry theory [
34]. Analysis of relevant data facilitates timely adjustments to public resource allocation and public service policies [
35,
36,
37]. On the supply side, the digital economy refines public service processes [
38,
39] and elevates transparency [
40] through digital innovation. This enhances the precision and responsiveness of public services. For instance, studies highlight that Indonesia, Brazil, China, the Czech Republic, Ukraine, Estonia, Kazakhstan, and the UK have harnessed digital functions to enhance citizen experiences, fortify transparency and accountability, streamline administrative procedures, and boost service-delivery efficiency [
41].
Hence, this study proposes the following hypothesis:
H1: The development of the digital economy has boosted the efficiency of public services.
3.2. The Mechanism of Digital Economy’s Impact on Public Service Efficiency
3.2.1. Political Environment
The ongoing refinement of the political environment significantly boosts the digital economy’s positive effect on public service efficiency. It is clear in two main areas: First, simplifying administrative approval, increasing policy transparency, and strengthening the legal framework cut compliance costs and regulatory uncertainty. It encourages more market players to engage in digital innovation for public services. Organizations can then focus on key tech applications like innovative governance and digital healthcare. Greater competition in innovation drives continuous improvements in service quality and accessibility. Integrating digital technologies such as big data analytics and automated processes improves public resource allocation and response times. It creates a virtuous cycle, providing citizens with more convenient, efficient, and stable public services. For example, research shows that reducing corruption and boosting public management transparency can unlock the value of underused assets and reduce transaction costs through digital platforms and the sharing economy, leading to more efficient resource allocation [
42]. Conversely, rising political uncertainty can increase perceived transaction costs for businesses and entrepreneurs, disrupting normal business operations [
43]. Second, optimizing the political environment improves cross-departmental data sharing and strengthens cybersecurity regulations. It enhances the resilience of digital governance systems against technical risks and external shocks, ensuring the stable and continuous delivery of public services. This enhanced resilience allows the digital economy to deliver technological benefits consistently, minimizes efficiency loss from governance vulnerabilities, and ensures the steady optimization of service processes and cost reduction in complex environments. In the long term, this drives the sustainable improvement of public service efficiency.
Hence, this study proposes the following hypothesis:
H2: The political environment positively moderates the relationship between the digital economy and public service efficiency.
3.2.2. Local Government Autonomy
Local government autonomy can significantly boost the digital economy’s impact on public service efficiency. China’s fiscal decentralization policy hands local governments more fiscal responsibility, granting them greater control over revenue and spending [
43,
44]. This enhanced autonomy enables them to craft digital technology policies that fit local needs, attract enterprises to participate in public service digitization, and build regional digital platforms by coordinating fiscal funds, tech firms, and infrastructure, thus avoiding resource duplication. On the demand side, local governments can better align policies with residents’ preferences [
45]. Governments with greater autonomy and superior information show enhanced adaptability to citizens’ needs and preferences [
46,
47]. Generally, these local governments utilize digital technologies to accurately grasp the needs of residents and swiftly adjust the content of services accordingly.
Hence, this study proposes the following hypothesis:
H3: Local government autonomy positively moderates the relationship between the digital economy and public service efficiency.
3.2.3. Innovation Capacity
A city’s innovation capacity can amplify the digital economy’s boost to public service efficiency. Endogenous growth theory posits that productivity rises as firms [
48] seek monopolistic profits, accumulate knowledge and invest in innovation [
49]. The digital economy is an open-innovation model that overcomes traditional input–output limitations, lifting national productivity [
50]. Urban digital economic development spurs city-wide innovation, applying technological advances to public services and enhancing efficiency. A higher urban innovation capacity also drives high-quality joint production of public services. As key urban innovation drivers, companies enhance their technological and innovative capabilities through digital transformation [
51]. It strengthens government–enterprise collaboration and modernizes public service delivery. Digital platforms, leveraging their technological strengths, now play a crucial role in social governance. For example, local governments and ByteDance have collaborated through social security initiatives, improving public service efficiency in poverty alleviation and employment support [
52].
Hence, this study proposes the following hypothesis:
H4: Innovation capacity positively moderates the relationship between the digital economy and public service efficiency.
3.2.4. Social Attention
Social attention greatly influences the link between the digital economy and public service efficiency. In today’s digital age, public opinions and sentiments spread quickly through social and online platforms, generating a potent public opinion force. It impacts organizational behavior and strategy [
53,
54], pushing governments to fast-track digital transformation in response to public expectations. Governments can enhance information collection and analysis with advanced technological tools, enabling prompt responses to shifts in public sentiment [
55]. Backed by digital technologies, governments have refined public service procurement and production, thus boosting urban public service efficiency [
56]
. However, ignoring social attention can lead to serious supply–demand imbalances in public services, undermining urban public service efficiency [
57].
Hence, this study proposes the following hypothesis:
H5: Social attention positively moderates the relationship between the digital economy and public service efficiency.
4. Research Design
4.1. Data
This study explores the impact of the digital economy on public service efficiency in Chinese cities. The data employed in this research are derived from multiple sources, including the China City Statistical Yearbook, China Urban Construction Statistical Yearbook, the Digital Inclusive Finance Index, China Internet Development Status Statistical Report, the Digital Economy Special Database of the China Enterprise Research Database, and administrative division data published by prefecture-level cities.
We have conducted specific processing for certain variables to ensure data accuracy and consistency. For instance, the total foreign investment is converted using the annual exchange rate of US dollars to Chinese yuan. Additionally, we deflate the data using the corresponding deflator from the China Statistical Yearbook, with 2008 as the base year. We use linear interpolation to address data gaps and supplement missing values. Moreover, we exclude samples with significant missing variables to enhance the reliability of our analysis. The final dataset comprises annual observations for 288 cities, covering 2011 to 2012.
4.2. Variable
4.2.1. Independent Variable
This study utilizes the development level of the digital economy (Dig) as the independent variable. In line with the Bureau of Economic Analysis (BEA) of the U.S. Department of Commerce, the digital economy is delineated as economic activities propelled by digital technology. It comprises three principal components: First, digital infrastructure, which encompasses hardware, software, and network facilities that underpin the digital economy. Second is digital transactions, which pertain to exchanging goods and services via digital platforms, such as e-commerce, digital payments, and online services. Third, digital content includes content created, distributed, and consumed in digital form, including digital media, software, and databases. This definition provides a holistic framework for grasping the essence and scope of the digital economy.
Building on this foundation, this study draws on the work of Zhao et al. [
58]. We have developed a comprehensive index system comprising two secondary and five tertiary indicators (see
Table 1). To optimize these indicators and improve the accuracy of our analysis, we have utilized principal component analysis to streamline the dimensionality of the metrics.
Specifically, the mean value of the Digital Economy Level indicator (Dig) is −0.023, with a standard deviation of 1.557, which is significantly higher than that of other variables. The minimum value is −2.252, while the maximum value reaches 6.505, resulting in an extreme range of 8.757 (as shown in
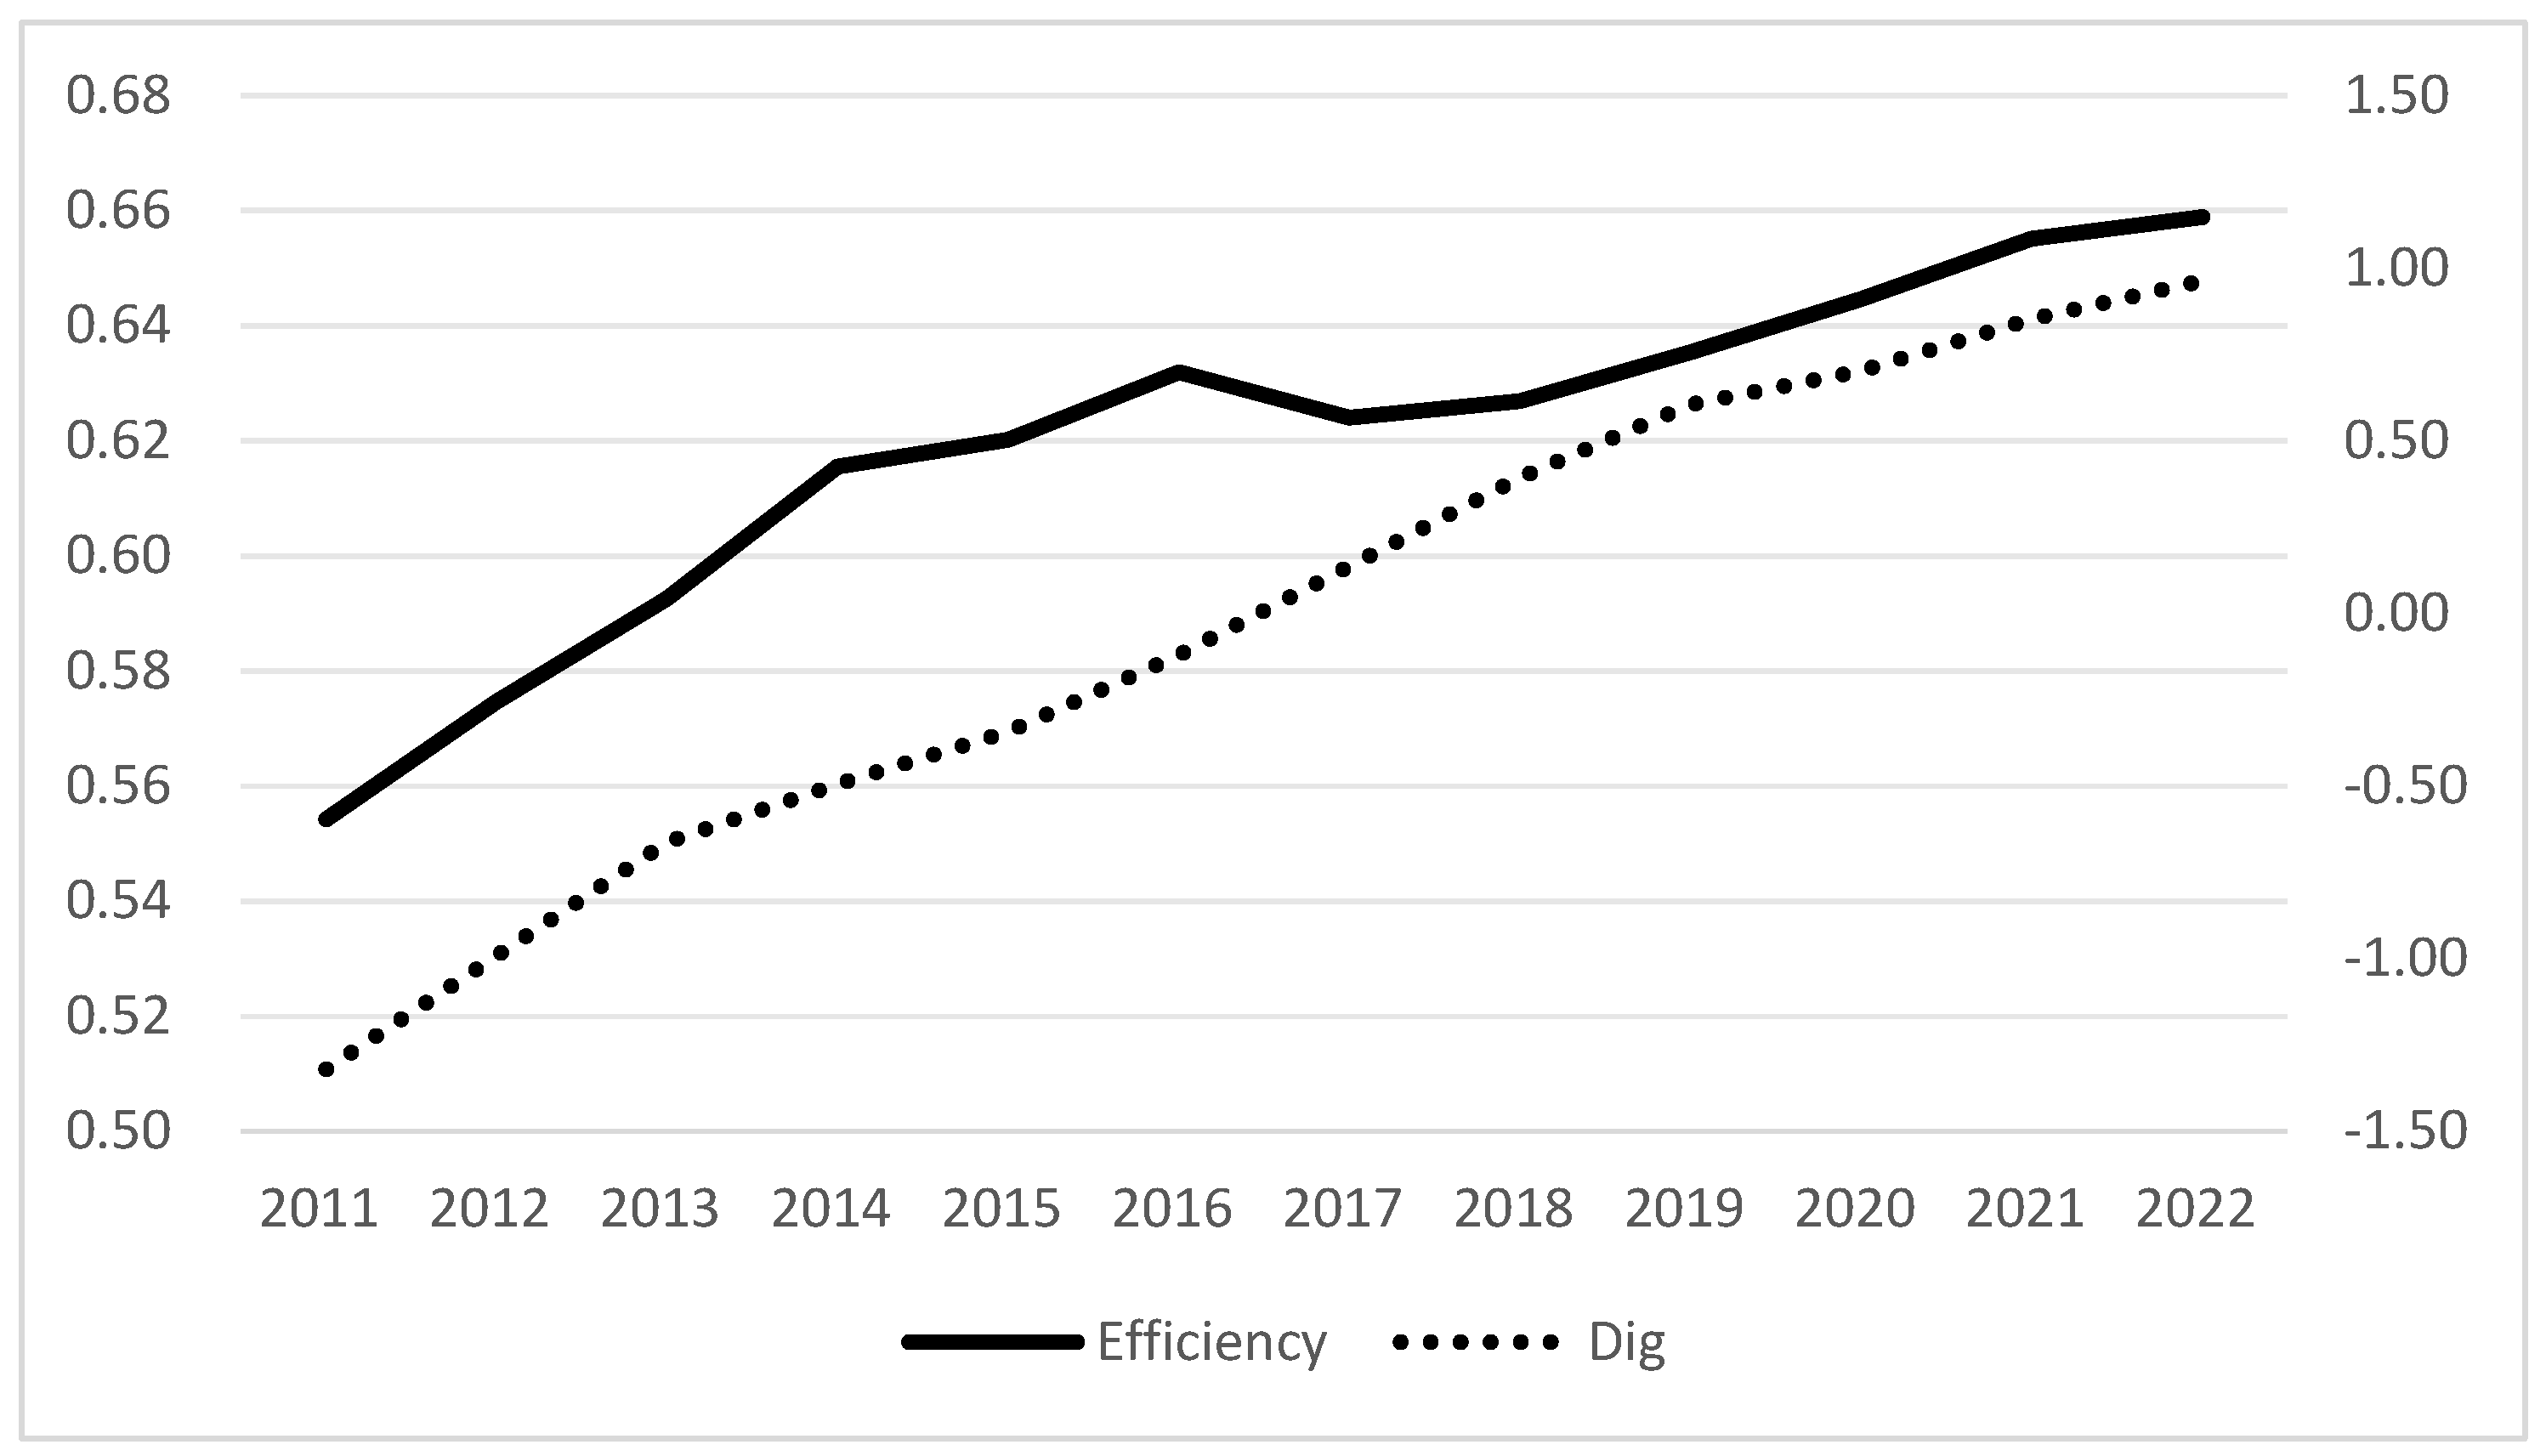
Table 2). This wide dispersion reflects substantial heterogeneity in the digital economy level indicator within the sample, highlighting significant differences among individual observations. Moreover, to assess the developmental trajectory of the digital economy, this study computed the average digital economy level for each year within the specified period. As depicted in
Figure 1, the results indicate a consistent upward trend in the digital economy level of cities from 2011 to 2022, with a notable increase from −1.32 to 0.96.
4.2.2. Dependent Variable
This study adopts public service efficiency (efficiency) as the dependent variable. This study identifies healthcare, education, public culture, social security, and public infrastructure as the output dimensions of public services. Local government fiscal expenditure is used as the expenditure dimension. This study uses a super-efficiency DEA model with input orientation and constant returns to scale to evaluate the overall technical efficiency (OTE) of local public services. Higher OTE scores indicate more efficient public service delivery. For specific indicators, please refer to
Table 3.
If we suppose that there are
evaluation regions, each with N inputs and M outputs for ecological efficiency, for any region k, the input and output sets are
= (
,
…,
),
= (
,
…,
) [
59]. The super-efficiency DEA model with input orientation and constant returns to scale is formulated as follows [
60]:
Furthermore, our assessment of public service efficiency across 288 Chinese cities from 2011 to 2022 reveals an average score of 0.620, with a standard deviation of 0.101. Efficiency scores ranged from a low of 0.393 to a high of 1.088, indicating a range of 0.659 (see
Table 3). This shows that while public service efficiency is generally clustered, some cities still stand out with significant differences. To track efficiency trends over time, we calculated the annual average public service efficiency for each city within this period. As illustrated in
Figure 1, there is a clear upward trajectory, with the average efficiency climbing steadily by 20% from 2011 to 2022.
Given the parallel trends in digital economy growth and public service efficiency enhancement, it is reasonable to infer that the development of the digital economy has played a role in boosting public service efficiency.
4.2.3. Mechanism Variables
The mechanism variables examined in this study include the level of openness to the outside world (open), the degree of fiscal decentralization (decentral), and the level of innovation (innovation). Building on prior research, we measure openness to the outside world using the ratio of total foreign investment to the annual GDP [
61]. The degree of fiscal decentralization is captured by the ratio of per capita fiscal revenue in prefecture-level cities to the combined per capita fiscal revenues of prefecture-level cities, provincial-level governments, and the central government [
62]. Then, the innovation capacity is assessed through the number of authorized invention patents (in ten thousand) [
63,
64].To ensure the reliability of regression results, this study conducted a logarithmic transformation of these variables. Lastly, to measure social attention, this study uses keywords like “schools, hospitals, transportation, social security, greening, and employment” in core public service areas. It leverages the Baidu Index search engine to compile the weighted average of annual average search indexes from 2011 to 2022 for prefecture-level and above cities in China [
65]. In this study, we divided this variable by 1000 for processing.
4.2.4. Control Variables
To minimize measurement errors arising from model specifications and to enhance the accuracy of the results, this study controls for additional variables that may influence public service efficiency. Drawing on relevant literature [
66,
67,
68], the following control variables are incorporated: First, urban economic level (lnPGDP) is measured by the natural logarithm of per capita GDP, which serves as a key indicator of urban economic development. Second, industrial structure (structure) is represented by the natural logarithm of the ratio of the added value of the tertiary sector to GDP in the same year [
69]. Third, urbanization level (urbanization) is assessed by the ratio of urban permanent residents to the total permanent population [
66]. Fourth, population density (density) is calculated as the natural logarithm of the ratio of permanent residents to the administrative area of the prefecture-level city [
67]. Fifth, the human capital (Edu) level is assessed using the ratio of the number of students enrolled in general higher education institutions to the total population [
70]. Lastly, government performance (GP) is determined by the ratio of each city’s total population at year-end to the number of individuals employed in public management, social security, and social organizations within the city [
71].
The descriptive statistical results for all variables are presented in
Table 2.
4.2.5. Methods and Analysis Strategies
To examine how the digital economy affects the public service efficiency of local governments, this study constructs a fixed-effects model using the following analytical approach (cf. Equation (1)). This model allows us to control for unobservable individual heterogeneity, remove the influence of time trends, and mitigate potential endogeneity concerns.
Here, represents the dependent variable, which is the public service efficiency of prefecture-level cities; is the core explanatory variable, the Digital Economy Development Index; t denotes the prefecture-level city; represents the year; is a set of control variables that may affect the public service efficiency of prefecture-level cities; is the intercept of the model; is the time fixed effect; is the individual fixed effect; and is the random disturbance term. The coefficient of the Digital Economy Development Index () is the focal effect of interest when examining the direct impact of the digital economy on public service efficiency.
To further examine the nonlinear relationship between the digital economy and public service efficiency, this paper employs public service efficiency (
) as a threshold variable. Specifically, it explores how the digital economy affects cities with varying levels of public service efficiency. Building on the work of Hansen [
72](1999), we develop the following panel threshold model:
Here, and are the two threshold values, with . These two threshold values divide the sample into three intervals. , and are the coefficients representing the impact of digital economy development on public service provision efficiency in each of the three intervals, respectively.
Then, to explore the pathways through which the digital economy boosts public service efficiency, this paper draws on the methodologies of Chen et al. [
73] and Ma et al. [
74] to develop a mechanism model.
Here, represents the mechanism variables, including the level of openness to the outside world, fiscal decentralization, and urban innovation levels.
5. Results
5.1. Baseline Regression Results
To assess the influence of the digital economy on public service efficiency, we performed a fundamental regression analysis, with results detailed in
Table 4. In Model (1), after accounting for time and individual fixed effects, the regression outcome reveals that the digital economy exerts a significantly positive impact on public service efficiency at the 1% significance level. This finding underscores the robust promotional effect of the digital economy on public service efficiency. Expanding on this foundation, Models (2) through (7) progressively incorporate control variables, including local economic development, industrial structure, urbanization level, population density, the level of human capital and government performance. Across these models, the coefficient for digital economy development consistently ranges from 0.041 to 0.015 and remains significant at the 1% level. This stability affirms our initial hypothesis (Hypothesis 1) and aligns with our expectations.
5.2. Robustness Tests
5.2.1. Alternate Explanatory Variable
This study uses local internet user numbers (Dig2) as a proxy for digital economy development. The regression results (Model (1) in
Table 5) indicate a significant positive relationship between the digital economy and public service efficiency.
Additionally, when employing employment data from the information transmission, computer services, and software sectors (Dig3) as an alternative indicator, the benchmark regression results (Model (2) in
Table 5) also show robustness.
5.2.2. Alternate the Explained Variable
This study considers healthcare, education, public culture, social security, and infrastructure as output dimensions and local government fiscal input as the expenditure dimension. We adopt a global DEA model with input orientation and constant returns to scale to calculate Overall Technical Efficiency (OTE). The regression results (Models (3) in
Table 5) reveal a significant positive relationship between the digital economy and public service efficiency, further confirming the robustness of the main effect.
5.2.3. Changing Model
Clustered standard errors are particularly well-suited for data with natural groupings, as they account for potential within-group correlation by relaxing the assumption of independence among observations within the same group. This approach yields more conservative and reliable estimates of standard errors [
75]. In this study, we replace the robust standard errors in the benchmark regression model with clustered standard errors at the prefecture-level city level. The results remain robust and consistent with our initial analysis (see Model (4) in
Table 5).
Furthermore, cities within the same province often share common infrastructure, such as transportation networks and human resources, which may introduce additional within-group correlation. To address this, we follow the recommendations of prior research [
76] and cluster the standard errors at the provincial level—a higher aggregation level than the prefecture-level city. This adjustment ensures that our inference is robust to potential correlation within provinces. The results from this specification continue to align with our earlier findings, further validating the robustness of our analysis (see Model (5) in
Table 5).
5.3. Endogenous Tests
This study uses an instrumental variable (IV) approach to address endogeneity from omitted variables and reverse causality, testing the positive impact of the digital economy on public service efficiency. Specifically, it employs 1984 postal and telecommunication data from Chinese prefecture-level cities as an IV for digital economy development. The choice of IV is based on two main reasons. First, the digital economy evolved from traditional communication technologies, such as fixed-line telephones and postal networks. The 1984 postal and telecommunication infrastructure influenced the subsequent growth of the digital economy by providing a physical foundation for information technologies like fiber optics and data centers and enhancing public acceptance of digital applications. Second, historical postal and telecommunication development does not directly cause the current public service supply. Instead, it only affects it indirectly through long-term information infrastructure accumulation. Traditional 1984 communication facilities, such as fixed-line telephones and post offices, no longer directly impact modern urban public services, satisfying the IV’s “exogeneity” requirement.
Given the IV’s cross-sectional nature, it cannot be directly used in a two-way fixed-effects model. Instead, this study interacts it with a time series variable—national internet users (in hundred millions)—to form a valid IV for the digital economy development level [
77].
The study applies two-stage least squares (2SLS) for the benchmark regression (
Table 6). The first-stage F-statistic of 17.863 (well above 10) indicates a strong IV. The Durbin–Wu–Hausman test
p-value of 0.026 (<0.05) confirms model endogeneity, thus justifying the IV approach. The IV regression results reveal a positive link between the digital economy and 1984 postal/telecommunications data. In the second stage, the digital economy coefficient is 0.069 (
p < 0.05), higher than in the baseline model (
Table 4, Model 6). It suggests OLS underestimates the digital economy’s positive effect due to endogeneity. Consequently, the results further support Hypothesis H1.
5.4. The Threshold Regression
This study explores the nonlinear relationship between digital technology and public service efficiency using a threshold regression model, where public service efficiency serves as the threshold variable.
Firstly, the Bootstrap method with 400 resamples is applied to validate the double-threshold model’s suitability and number of thresholds. The results confirm that the digital economy’s influence on public service efficiency aligns with a double-threshold analysis (p < 0.01), indicating two distinct thresholds.
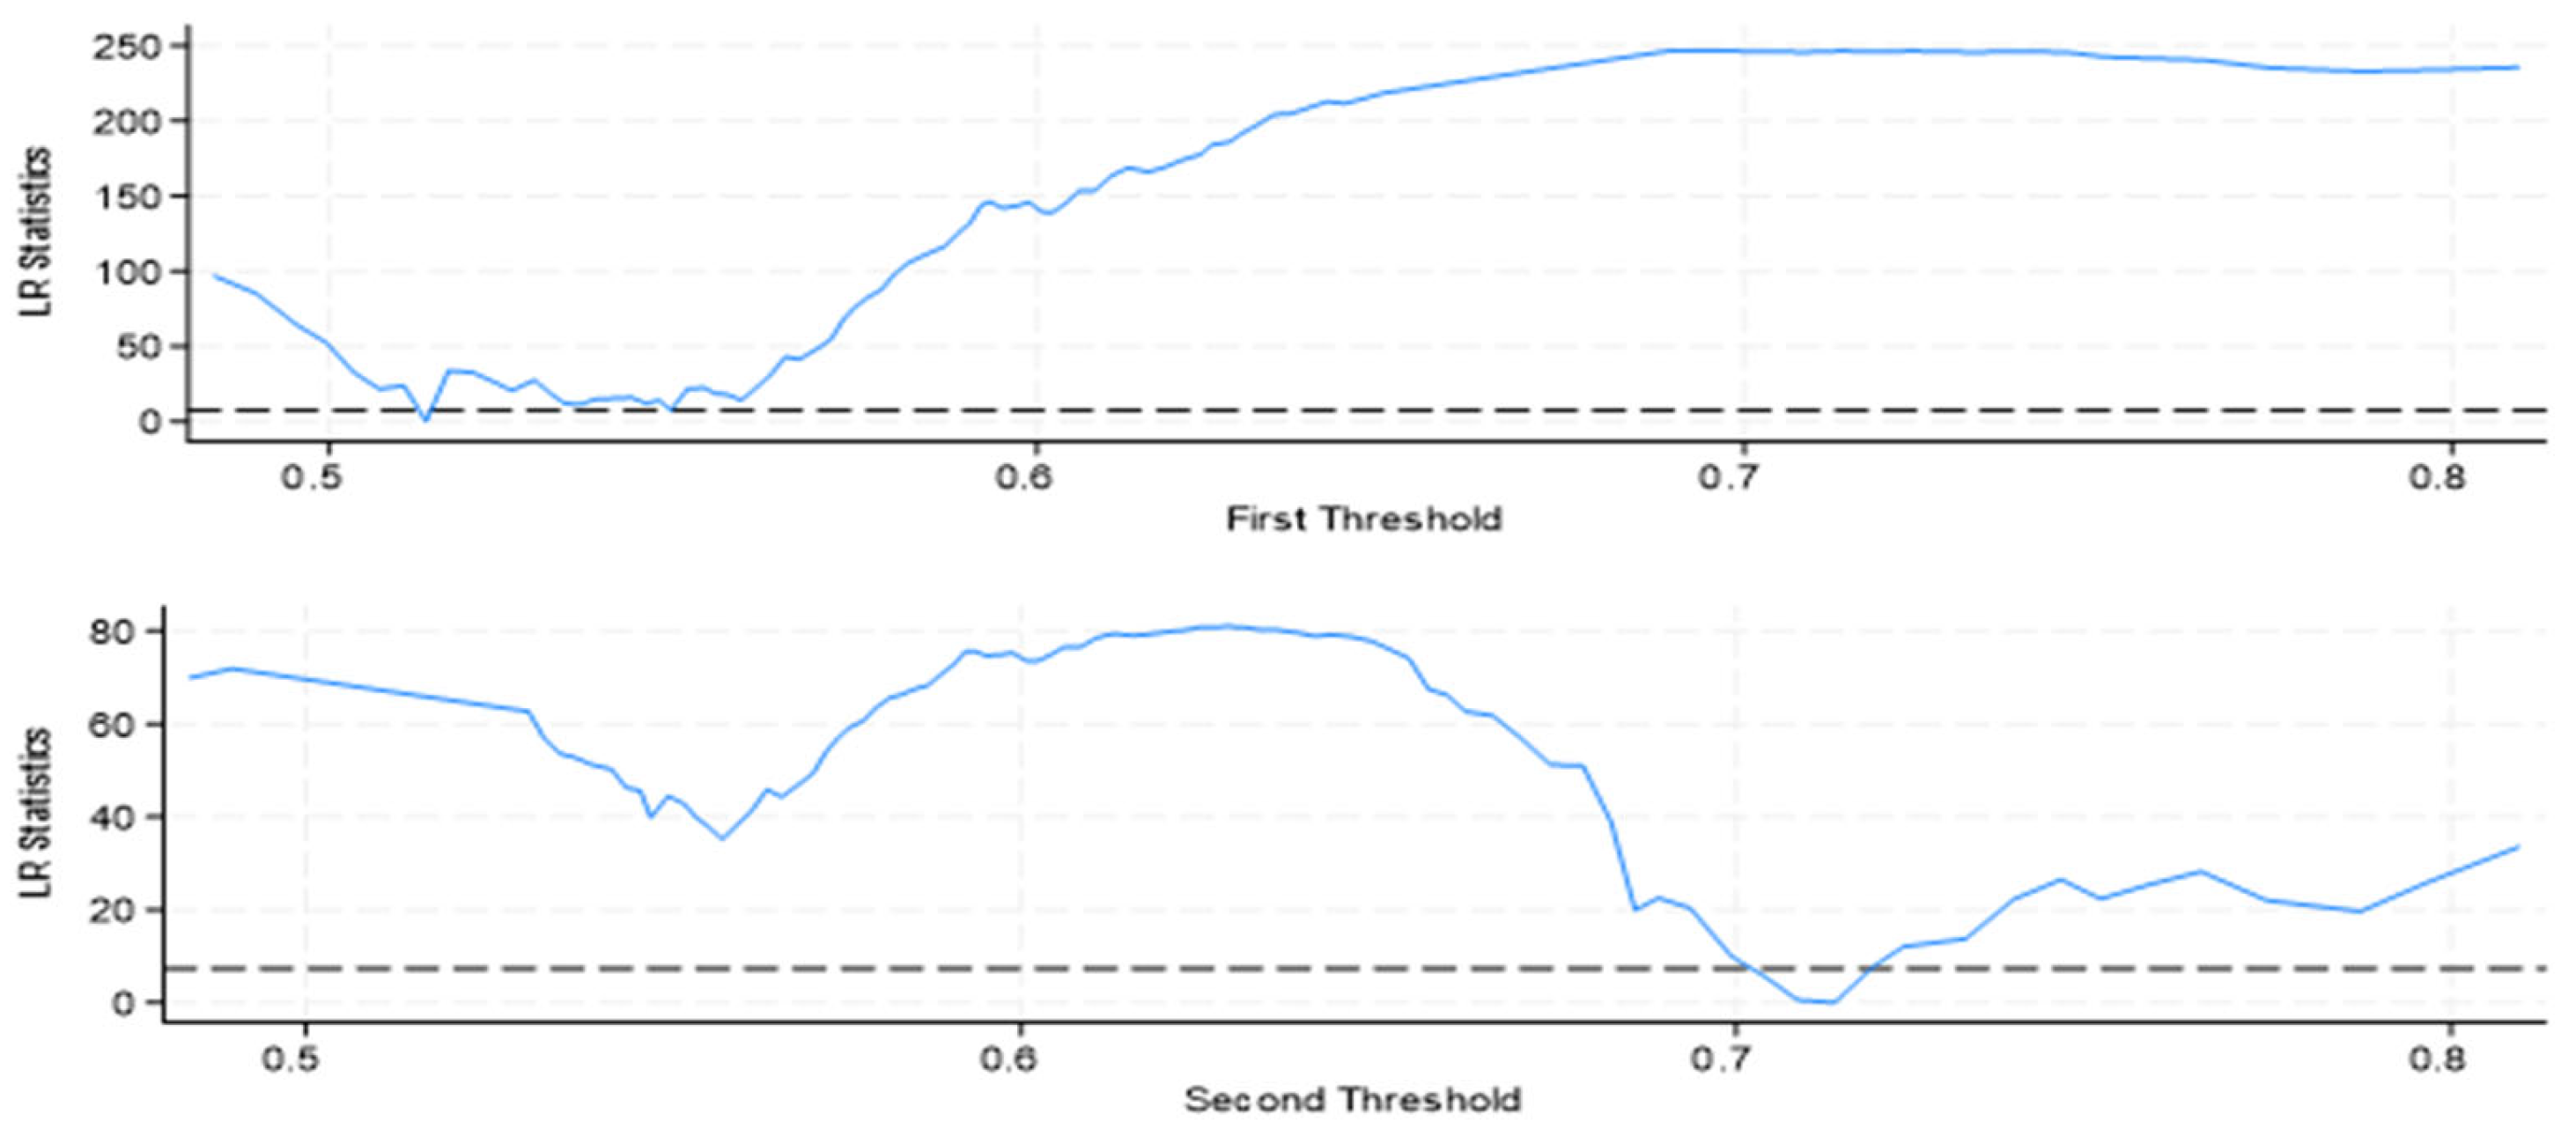
Secondly, LR statistics are utilized to estimate and verify these double thresholds.
Figure 2 presents the likelihood function graph for the digital economy’s double threshold. The dotted line on the graph indicates the critical value of LR statistics at the 5% significance level (7.3523). The graph reveals a clear minimum in LR statistics, with intersections on both sides of this minimum with the dotted line. It identifies the double thresholds at 0.548 and 0.714 (see
Table 7). The 95% confidence interval further substantiates the reliability of these double-threshold estimates.
The regression results uncover a nonlinear impact of the digital economy on public service efficiency. Specifically, when public service efficiency falls below 0.548, the digital economy’s coefficient is 0.044 (p < 0.01), signifying a significant positive effect. For efficiency levels between 0.548 and 0.714, the coefficient decreases to 0.017 (p < 0.01), reflecting a diminished impact. When efficiency exceeds 0.714, the coefficient rises to 0.032 (p < 0.01), indicating a renewed strengthening of the positive effect. It means that the digital economy’s effect on public service efficiency is not uniform—it is more impactful when efficiency is either low or high, and less so at moderate levels. This nonlinear link sheds light on how digital technology affects public service efficiency in varying contexts.
5.5. Spatial Econometric Analysis
Before applying econometric models, conducting spatial autocorrelation tests on the independent and dependent variables is crucial. This study employs the global Moran index to evaluate the spatial autocorrelation of the digital economy and public service efficiency. The results reveal that the global Moran indices for both variables are significantly positive at the 1% level across all years (in
Table 8). It suggests that Chinese cities’ digital economy development and public service efficiency are not randomly distributed. Instead, cities with similar levels of digital economy development and public service efficiency tend to cluster spatially. Essentially, cities in close geographical proximity often display comparable levels of digital economy development and public service efficiency.
Spatial econometric models come in many forms, and choosing the right one needs strict tests based on research needs. This chapter uses LM, Wald, and LR tests in a special–general and back sequence to pick the best spatial econometric model.
Table 9 shows the LM test results. The Lagrange multiplier stats from the LM—Error and Robust LM—Error tests are significant at the 1% level, while those from the LM—Lag and Robust LM—Lag tests are not. It means that the spatial spillover effects of the urban digital economy mainly come from the model’s error term.
Based on the LM test results, we chose the Spatial Error Model (SEM) for spatial econometric analysis (
Table 10). A common geographical distance-based type was used for the spatial weight matrix. The SEM regression results show that the spatial error term’s regression coefficient (lambda) is significantly positive at the 1% level. It indicates that China’s public service efficiency exhibits significant spatial spillover effects, primarily through the error term. It implies that a city’s development of its digital economy does not directly enhance the efficiency of its public services in neighboring cities.
5.6. Heterogeneity Analysis
5.6.1. Heterogeneity in Government Attention
The release of the “Broadband China” Strategy and Implementation Plan in 2013 was a milestone, deploying digital infrastructure systematically through a “three-phase advancement” mechanism (speeding up from 2013 to 2015, popularization from 2014 to 2015, and upgrading from 2016 to 2020). By 2023, the country had built 3.837 million 5G base stations, with over 180 million gigabit users, laying the foundation for application innovation. Since 2013, the central government has introduced 27 specialized digital economy policies, forming a policy transmission system of “central coordination—local pilot—industry implementation.” This policy focus has generated significant spillover effects: in the household domain, FTTR (Fiber to the Room) users have exceeded 20 million, supporting immersive applications such as 8K/3D; in the public service domain, explorations in fields such as AI healthcare and VR education have accelerated.
Based on the characteristics of policy evolution, this paper conducts empirical analysis with 2013 as the dividing point for government attention. The period from 2011 to 2013 is set as the low government attention group, while 2014 to 2022 is designated as the high government attention experimental group. The regression results in
Table 8 show that in the low government attention group, the effect of the digital economy on improving public service efficiency is insignificant. In contrast, in the high government attention group, the digital economy development level coefficient is significantly positive at the 5% level. This indicates that under high government attention, the role of the digital economy in enhancing public service efficiency is strengthened. This can be attributed to the fact that government attention has mitigated obstacles to applying the digital economy in the public service sector. It has created a more conducive policy environment and provided more substantial support for transforming and applying related fields.
5.6.2. Geographical Spatial Heterogeneity
China’s vast territory results in regional differences in natural capacity, resource endowment, and economic foundations. It leads to multi-dimensional regional imbalances, such as uneven industrial output, energy use, and pollution emissions [
78]. Previous studies have also indicated significant regional disparities in digital economy development [
79].
This study divides Chinese cities into southern and northern groups using the Qinling-Huaihe River line. Separate regressions for these groups reveal that the digital economy significantly and positively impacts public service efficiency in both regions at the 1% level, with coefficients of 0.018 and 0.010, respectively (columns (3) and (4),
Table 11). The inter-group difference coefficient is significantly positive at the 5% level. This suggests that while the digital economy enhances public service efficiency in both regions, its effect is more substantial in the south. The digital economy’s potential to boost public service efficiency in northern cities remains underutilized.
6. Further Analysis
This study examines four mechanisms through which the digital economy influences public service efficiency: political environment, local government autonomy, innovation capacity, and social attention. The empirical analysis results are presented in
Table 9.
The results in column (1) of
Table 12 indicate that the digital economy is positively and significantly associated with public service efficiency at the 1% level. In comparison, foreign investment is negatively and significantly associated with it at the 10% level. Additionally, the interaction term between the digital economy and foreign investment is positively and significantly linked to public service efficiency at the 1% level. This suggests that a higher level of digital economy development can enhance public service efficiency, whereas higher levels of foreign investment may have the opposite effect. However, increasing foreign investment can intensify the digital economy’s positive impact on public service efficiency. High levels of foreign investment can directly reduce public service efficiency, primarily due to increased management complexity and resource competition. Nevertheless, increasing foreign investment can also introduce technology, capital, and expertise that complement the digital economy, enhancing its positive effect on public service efficiency. These results confirm Hypothesis 2.
The results in column (2) of
Table 12 show that the digital economy is positively and significantly associated with public service efficiency at the 5% level. Fiscal decentralization is positively and significantly related to public service efficiency at the 10% level, and the interaction between the digital economy and fiscal decentralization is significantly positive at the 10% level. This indicates that fiscal decentralization positively moderates the relationship between the digital economy and public service efficiency. As fiscal decentralization increases, the digital economy’s positive impact on public service efficiency grows. This is consistent with the theoretical analysis of the impact mechanism discussed earlier, enhancing urban public service efficiency and thus confirming Hypothesis 3.
The results in column (3) of
Table 12 indicate a positive and significant relationship between the digital economy and public service efficiency at the 1% level. While the number of authorized invention patents shows a negative relationship with public service efficiency, this relationship is not statistically significant. However, the interaction term between the digital economy and the number of invention patents is positively and significantly associated with public service efficiency at the 10% level. This indicates that while invention patents may not directly affect public service efficiency, they can indirectly influence the relationship between the digital economy and public service efficiency. In cities with more invention patent grants, the digital economy’s role in enhancing public service efficiency becomes more pronounced. As the number of invention patent grants increases, the digital economy’s positive impact on public service efficiency grows. It aligns with previous theoretical analysis. These results confirm Hypothesis 4.
The results in column (4) of
Table 12 indicate a significant positive correlation between the digital economy and public service efficiency at the 1% level. Social attention exhibits a negative yet statistically non-significant relationship with public service efficiency. However, the interaction term of the digital economy and the number of invention patents is significantly positive at the 5% level in relation to public service efficiency. It suggests that while social attention may not directly affect public service efficiency, it can positively moderate the relationship between the digital economy and public service efficiency. Specifically, in cities with high levels of social attention, the digital economy plays a more pronounced role in enhancing public service efficiency, and its positive impact intensifies as social attention increases. It aligns with prior theoretical analysis. These findings confirm Hypothesis 5.
7. Conclusions and Policy Recommendations
Basic public services are essential for people’s welfare and vital for sustainable social development. This study examines the impact of the digital economy on public service efficiency, using a two-way fixed-effects model and panel data from 288 Chinese cities (2011–2022). It reveals a nonlinear relationship between them, explores the institutional mechanisms involved, and provides new theoretical perspectives on sustainable development in the digital age.
Prior studies on public service efficiency have considered factors like population density, education level, government capacity, tax policy, and so on [
80,
81]. Existing research findings differ on the impact of the digital economy: some scholars argue that digital economic development reduces the efficiency of public health services [
82], while others maintain it has a positive effect [
33]. This study, examining overall public service efficiency, finds that digital economic development enhances public service efficiency. This conclusion can be attributed to the digital economy’s facilitation of the precise matching of public service supply with public demand.
Compared to Tian’s [
68] (2024) study, this research further refines the understanding of the impact mechanism of the digital economy on public service efficiency. His study focuses on the inverted-U relationship between the digital economy and public service delivery. By introducing a threshold effect model, this study reveals differences in the impact of the digital economy on cities with varying efficiency levels. The digital economy’s role in improving public service efficiency is not uniform but is closely related to a city’s existing public service efficiency. This finding offers more targeted guidance for policymakers, suggesting that when formulating digital economy development strategies, due consideration should be given to a city’s current public service efficiency to maximize the digital economy’s positive impact on public service efficiency.
Spatial spillover analysis indicates that China’s public service efficiency exhibits spatial spillover effects, which are primarily reflected in the error term. This finding contrasts with the views of other scholars who argue that the high mobility and strong permeability of the digital economy can generate spatial spillover effects [
83]. These scholars have found evidence of such effects in fields such as common prosperity [
84] and carbon emission reduction [
85]. However, our study reveals that urban–rural structure and other city-specific factors play a more significant role in the spatial spillover of public service efficiency. This suggests that the development of the digital economy should be adapted to local conditions rather than relying solely on technology diffusion to enhance public service efficiency. The results of the heterogeneity analysis further support this conclusion, showing that the positive impact of the digital economy on public service efficiency is more pronounced in southern regions where urban development is more advanced.
This study reveals that enhancing the political environment, local government autonomy, urban innovation capacity, and social attention can amplify the positive relationship between the digital economy and public service efficiency. These research results are deeply embedded in China’s unique institutional context: the central government sets the political direction through top-level design, while local governments leverage a “tournament-like promotion” mechanism to enhance governance efficiency. Within the novel national system, technological elements are seamlessly integrated. This “politically centralized yet administratively decentralized” system breeds a distinctive digital-empowered public governance model, characterized by party-driven digital reforms and the coordinated interplay of technology markets. When conducting cross-national research, it is crucial to recalibrate theoretical parameters. As key moderators, variables like national capacity structure, intergovernmental power distribution, and innovation governance must be incorporated. The effective transfer of research conclusions can be realized by employing comparative institutional analysis to construct adaptively equivalent functional models.
This study proposes three targeted policy interventions. First, the Chinese government should strategically develop the digital economy as a catalyst for improving public service efficiency. This necessitates prioritized reforms in three areas: streamlining regulatory frameworks to optimize the business ecosystem, modernizing governance protocols to meet digital-age standards, and establishing innovation pipelines that bridge the gap between technological breakthroughs and practical implementation. Second, policymakers must maintain adaptive vigilance toward the evolving digital economy, proactively formulating and periodically updating national digital roadmaps. These strategic blueprints should provide concrete incentives for channeling digital innovations toward critical social infrastructure and public welfare sectors. Third, provincial and municipal authorities are advised to develop context-specific digitalization strategies aligned with local institutional capacities and service delivery baselines, guarding against indiscriminate replication of models that might compromise equitable service distribution.
While contributing novel insights, this research has three principal constraints. The analysis emphasizes static correlations between digital economy development and service efficiency gains while not fully capturing their dynamic interdependencies over time. Methodologically, future investigations could incorporate structural equation modeling to quantitatively differentiate the digital economy’s direct and mediated impacts from other contributing factors. Furthermore, the current framework applies a management-centric perspective to digital public services, which may underrepresent the complex multi-stakeholder governance dynamics inherent in digital transformation processes.


