Article

Does Urban Renewal Mitigate the Disease of Cities? An Empirical Study Based on a PSM-DID Model

School of Civil Engineering and Architecture, Wuhan University of Technology, Wuhan 430070, China
*
Author to whom correspondence should be addressed.
Sustainability 2025, 17(11), 5214; https://doi.org/10.3390/su17115214
Submission received: 17 April 2025 / Revised: 29 May 2025 / Accepted: 3 June 2025 / Published: 5 June 2025

Abstract

:
The rapid pace of urbanization has led to severe urban problems, with urban renewal emerging as an effective strategy to mitigate them. The City Betterment and Ecological Restoration (CBER) pilot scheme was an experimental policy aimed at urban renewal. Based on an optimized propensity score matching difference-in-differences model, the impact of the CBER pilot scheme on urban disease was examined. The results were threefold. (1) The CBER pilot scheme significantly alleviated urban disease in pilot cities. (2) The impact of the CBER pilot scheme was more pronounced in eastern and central regions of China, as well as in cities with high economic development, robust government capacity and abundant human resource. (3) Industrial structure optimization, infrastructure development and consumption upgrading were all effective pathways for mitigating urban disease through urban renewal. The findings offer valuable insights for other countries and regions to address urban problems and advance urbanization.

1. Introduction

Over the past several decades, China has undergone a rapid process of urbanization, with the urbanization rate reaching 66.16% by 2024. This rapid urbanization has also given rise to a series of urban problems, such as environmental pollution and resource scarcity [1,2,3]. These increasingly prominent urban problems, collectively termed “urban disease”, are severely impeding the sustainable development of Chinese cities. Some studies have indicated that the problems prevalent in urban areas also exert negative impacts on the health of urban residents [4,5], thereby endangering public well-being. China’s urbanization has garnered extensive international attention [6]. The Nobel laureate in economics, Joseph E. Stiglitz, said that high-tech development in the United States and China’s urbanization would be two key factors affecting the process of human society development in the 21st century [7]. Investigating the challenges encountered in China’s urbanization and distilling the resultant experiences can serve as a reference for other countries in their urbanization endeavors and efforts to address urban problems, thereby contributing to the sustainable development of cities. To facilitate urban transformation and alleviate urban disease, China has implemented numerous urban renewal strategies and conducted pilot schemes in cities. Consequently, assessing the effects of current urban renewal policies in mitigating urban disease is of substantial theoretical and practical importance.
According to Northam (1979), urban disease is more prevalent when urbanization rate is between 30% and 70% [8]. The National New-Type Urbanization Plan (2014–2020) outlined six critical problems in cities that must be addressed, and four of them were related to environmental and resource sectors [9]. Urban disease has become impediments to the socio-economic development of cities. Urban renewal offers a potential solution by enhancing resource efficiency and mitigating environmental pollution [10]. It can help to meet the socio-economic goals of urban development [11], which has become a significant urban governance policy in many parts of the world. For example, urban renewal can facilitate the efficient use of land resources, thereby alleviating population congestion [12]. Moreover, urban renewal can enhance societal inclusivity for vulnerable groups by improving the social environment [13]. However, past urban renewal efforts, often driven by strong economic motives, have not significantly contributed to alleviating urban disease [14]. Therefore, it is crucial to evaluate the effectiveness of urban renewal policies in mitigating urban disease.
With the slowing pace of urbanization in China, the focus of urban development is beginning to shift towards urban renewal. Between 2015 and 2017, the City Betterment and Ecological Restoration (CBER) pilot scheme was implemented, serving as an experimental initiative for urban renewal. This scheme encompassed various domains, including ecological environments, green space systems, infrastructure, public spaces, transportation networks, aging residential areas, historical culture and urban aesthetics. It was deemed a crucial measure for addressing urban disease. Utilizing the CBER pilot scheme as a proxy for urban renewal, this study tested the impact of urban renewal on urban disease. Population congestion (PC), resource scarcity (RS) and air pollution (AP) are challenges that necessitate resolution in cities and have attracted widespread attention from scholars. Consequently, this study divided assessment of urban disease (UD) into these three aspects.
This paper makes several key contributions to the existing literature. Firstly, we developed a multidimensional evaluation framework for assessing urban disease, focusing on population congestion, resource scarcity and air pollution. This framework was applied to evaluate the impact of the CBER pilot scheme on urban disease. Secondly, this study employed an optimized propensity score matching (PSM) method to match treatment and control groups. By integrating characteristic variables from all pre-policy years into a unified sequence, this method ensured that the treatment and control groups were comparable prior to policy implementation, thus addressing potential sample selection bias. Thirdly, a stratified regression approach was adopted to investigate heterogeneous effects of the CBER pilot scheme across cities at different stages of development, which could explore the underlying factors contributing to the impact of urban renewal policies.

2. Literature Review and Theoretical Analysis

2.1. Urban Disease

Rapid urbanization has caused severe urban problems, including environmental degradation and resource scarcity [1,2], collectively termed “urban disease”. Investigations into the etiology of urban disease are categorized into three primary domains: the coupled coordination between urbanization and ecological environments, urban metabolic imbalances, and the inadequacy of ecosystem service provision [9]. The Environmental Kuznets Curve (EKC) depicts an inverted U-shaped correlation between urban ecological quality and economic growth [15]. The EKC has been widely employed in urban studies, particularly in analyzing the coupled dynamics between urbanization and air pollution [16,17,18]. Urban metabolism framework conceptualizes cities as integrated ecosystem [19]. Numerous studies have adopted this perspective to conduct comprehensive assessments of urban disease [20,21,22,23]. Some scholars attribute urban disease to deficiencies in ecosystem services [24,25]. The ecosystem footprint model constructed by Burkhard et al. (2012) has been extensively applied in the evaluation of urban ecosystems [26].
Quantitative measurement of urban problems, such as air pollution [16,27], resource scarcity [25] and traffic congestion [28,29,30], has been a focal point. Single indicator and composite indicators are two prevalent methods. Due to variations in trends existing among different indicators, the method of composite indicators offers a more accurate reflection of urban disease. For instance, Zhao and Wang (2022) conducted a comprehensive evaluation of air pollution using sulfur dioxide and particulate matter emissions [27]. Despite considerable scholarly attention, research on urban disease still has some limitations. Firstly, prior research has primarily focused on measuring urban disease from a single dimension, overlooking its multifaceted nature. Secondly, the impact of urban renewal on urban disease has not been adequately investigated from a sustainable development perspective.

2.2. The Evaluation of Policy Effects on Urban Disease

A series of policies targeting urban disease provides scholars with rich research samples. The difference-in-differences (DID) method is usually used for the estimation of policy effects [31,32]. Air pollution and carbon emissions are focal issues, with research primarily focusing on the effects of new urbanization policies [31], regional integration policies [33] and various air quality control measures [23,34,35]. Additionally, scholars have also employed the DID method to estimate policy effects on urban problems such as environmental pollution [20,36], resource consumption [37,38] and traffic congestion [39,40].
Employing a PSM-DID model, this study investigates the mitigating effects of the CBER pilot scheme on urban disease. The DID model is widely utilized to estimate the effects of external shocks [33,37,41,42]. A key assumption of the DID model is the random selection of samples for the treatment and control groups. Otherwise, results of estimation will be significantly biased [23]. The PSM method can effectively address sample selection bias [43,44]. However, conventional PSM method is typically applied to cross-sectional data. Prior research has often decomposed panel data, treating data from the same city across different years as independent observations. Although this approach can partially alleviate sample selection bias, it may also result in self-matching and mismatching issues [45]. Consequently, this study employs an optimized matching approach, which integrates characteristic variables from all pre-policy years into a unified sequence. Through this, each treatment group city is matched with a control group city that exhibits a similar trend in terms of becoming a pilot city.

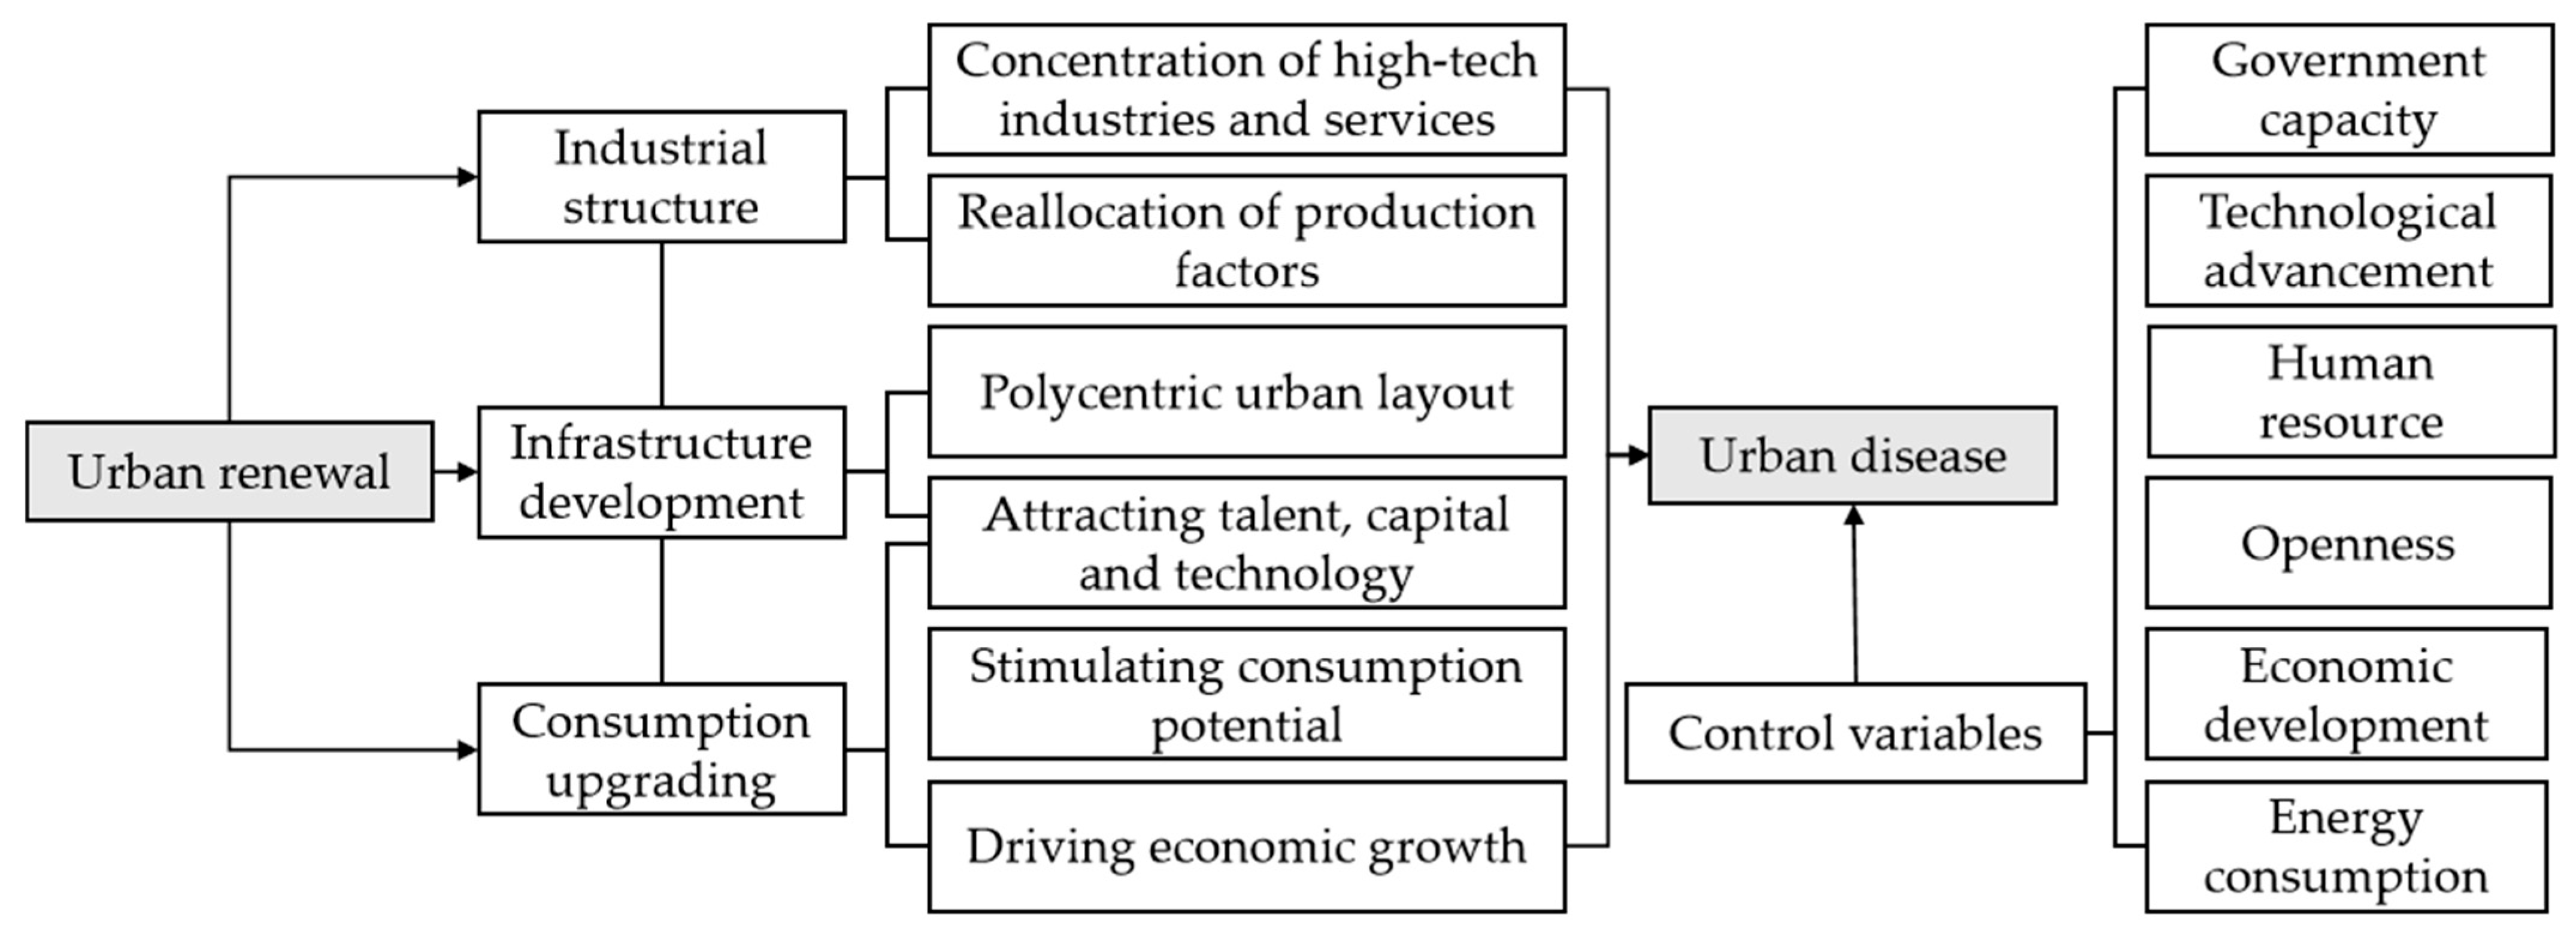
2.3. How Urban Renewal Affects the Disease in Cities

According to current research, this study has raised three hypotheses about the pathways for mitigating urban disease through urban renewal (Figure 1).
Hypothesis 1: 
Industry-driven mechanism.
The integration of urban renewal and industrial development can invigorate urban vitality and enhance the metabolic efficiency of cities [46]. This process facilitates the concentration of high-tech industries and services in central urban areas, serving as a pivotal driver in refining urban spatial layouts, utilizing resources efficiently and reducing pollution emissions [47]. Firstly, urban renewal drives the concentration of high-tech industries and services in city centers, promoting a transformation of urban industrial structure towards advancement and rationalization, thereby enhancing resource efficiency and reducing pollution emissions. Subsequently, urban renewal fosters the reallocation of production factors, such as labor and land, optimizing the urban spatial structure. This process in turn alleviates urban congestion and resource scarcity [48].
Hypothesis 2: 
Infrastructure-driven mechanism.
Urban renewal can also enhance infrastructure development of cities, addressing issues of aging and inadequacy in utilities, sanitation and road networks. The upgrading of traditional infrastructure can facilitate a polycentric urban layout [49], which is conducive to rational planning of urban space and resources. This can help to mitigate traffic congestion and enhance the efficiency of public resource utilization. For instance, a polycentric layout can significantly reduce commuting distances for citizens, alleviating road traffic issues. Moreover, the transformation and enhancement of infrastructure in transportation, healthcare and education can attract talent, capital and technology to concentrate in the city, reducing resource consumption and air pollution emissions [50].
Hypothesis 3: 
Consumption-driven mechanism.
Urban renewal can stimulate commercial vitality of cities, guiding high-quality commerce to concentrate in cities [51]. Premium commerce can refresh consumption concepts of citizens and enhance their consumption experience, which stimulates consumption potential and drives economic growth [52]. The upgrading of consumption signifies an improvement in the quality of life for citizens, which attracts talent, capital and technology. Consequently, the process of consumption upgrading is often accompanied by reduced resource consumption, increased production efficiency and innovation in management models.

3. Materials and Methods
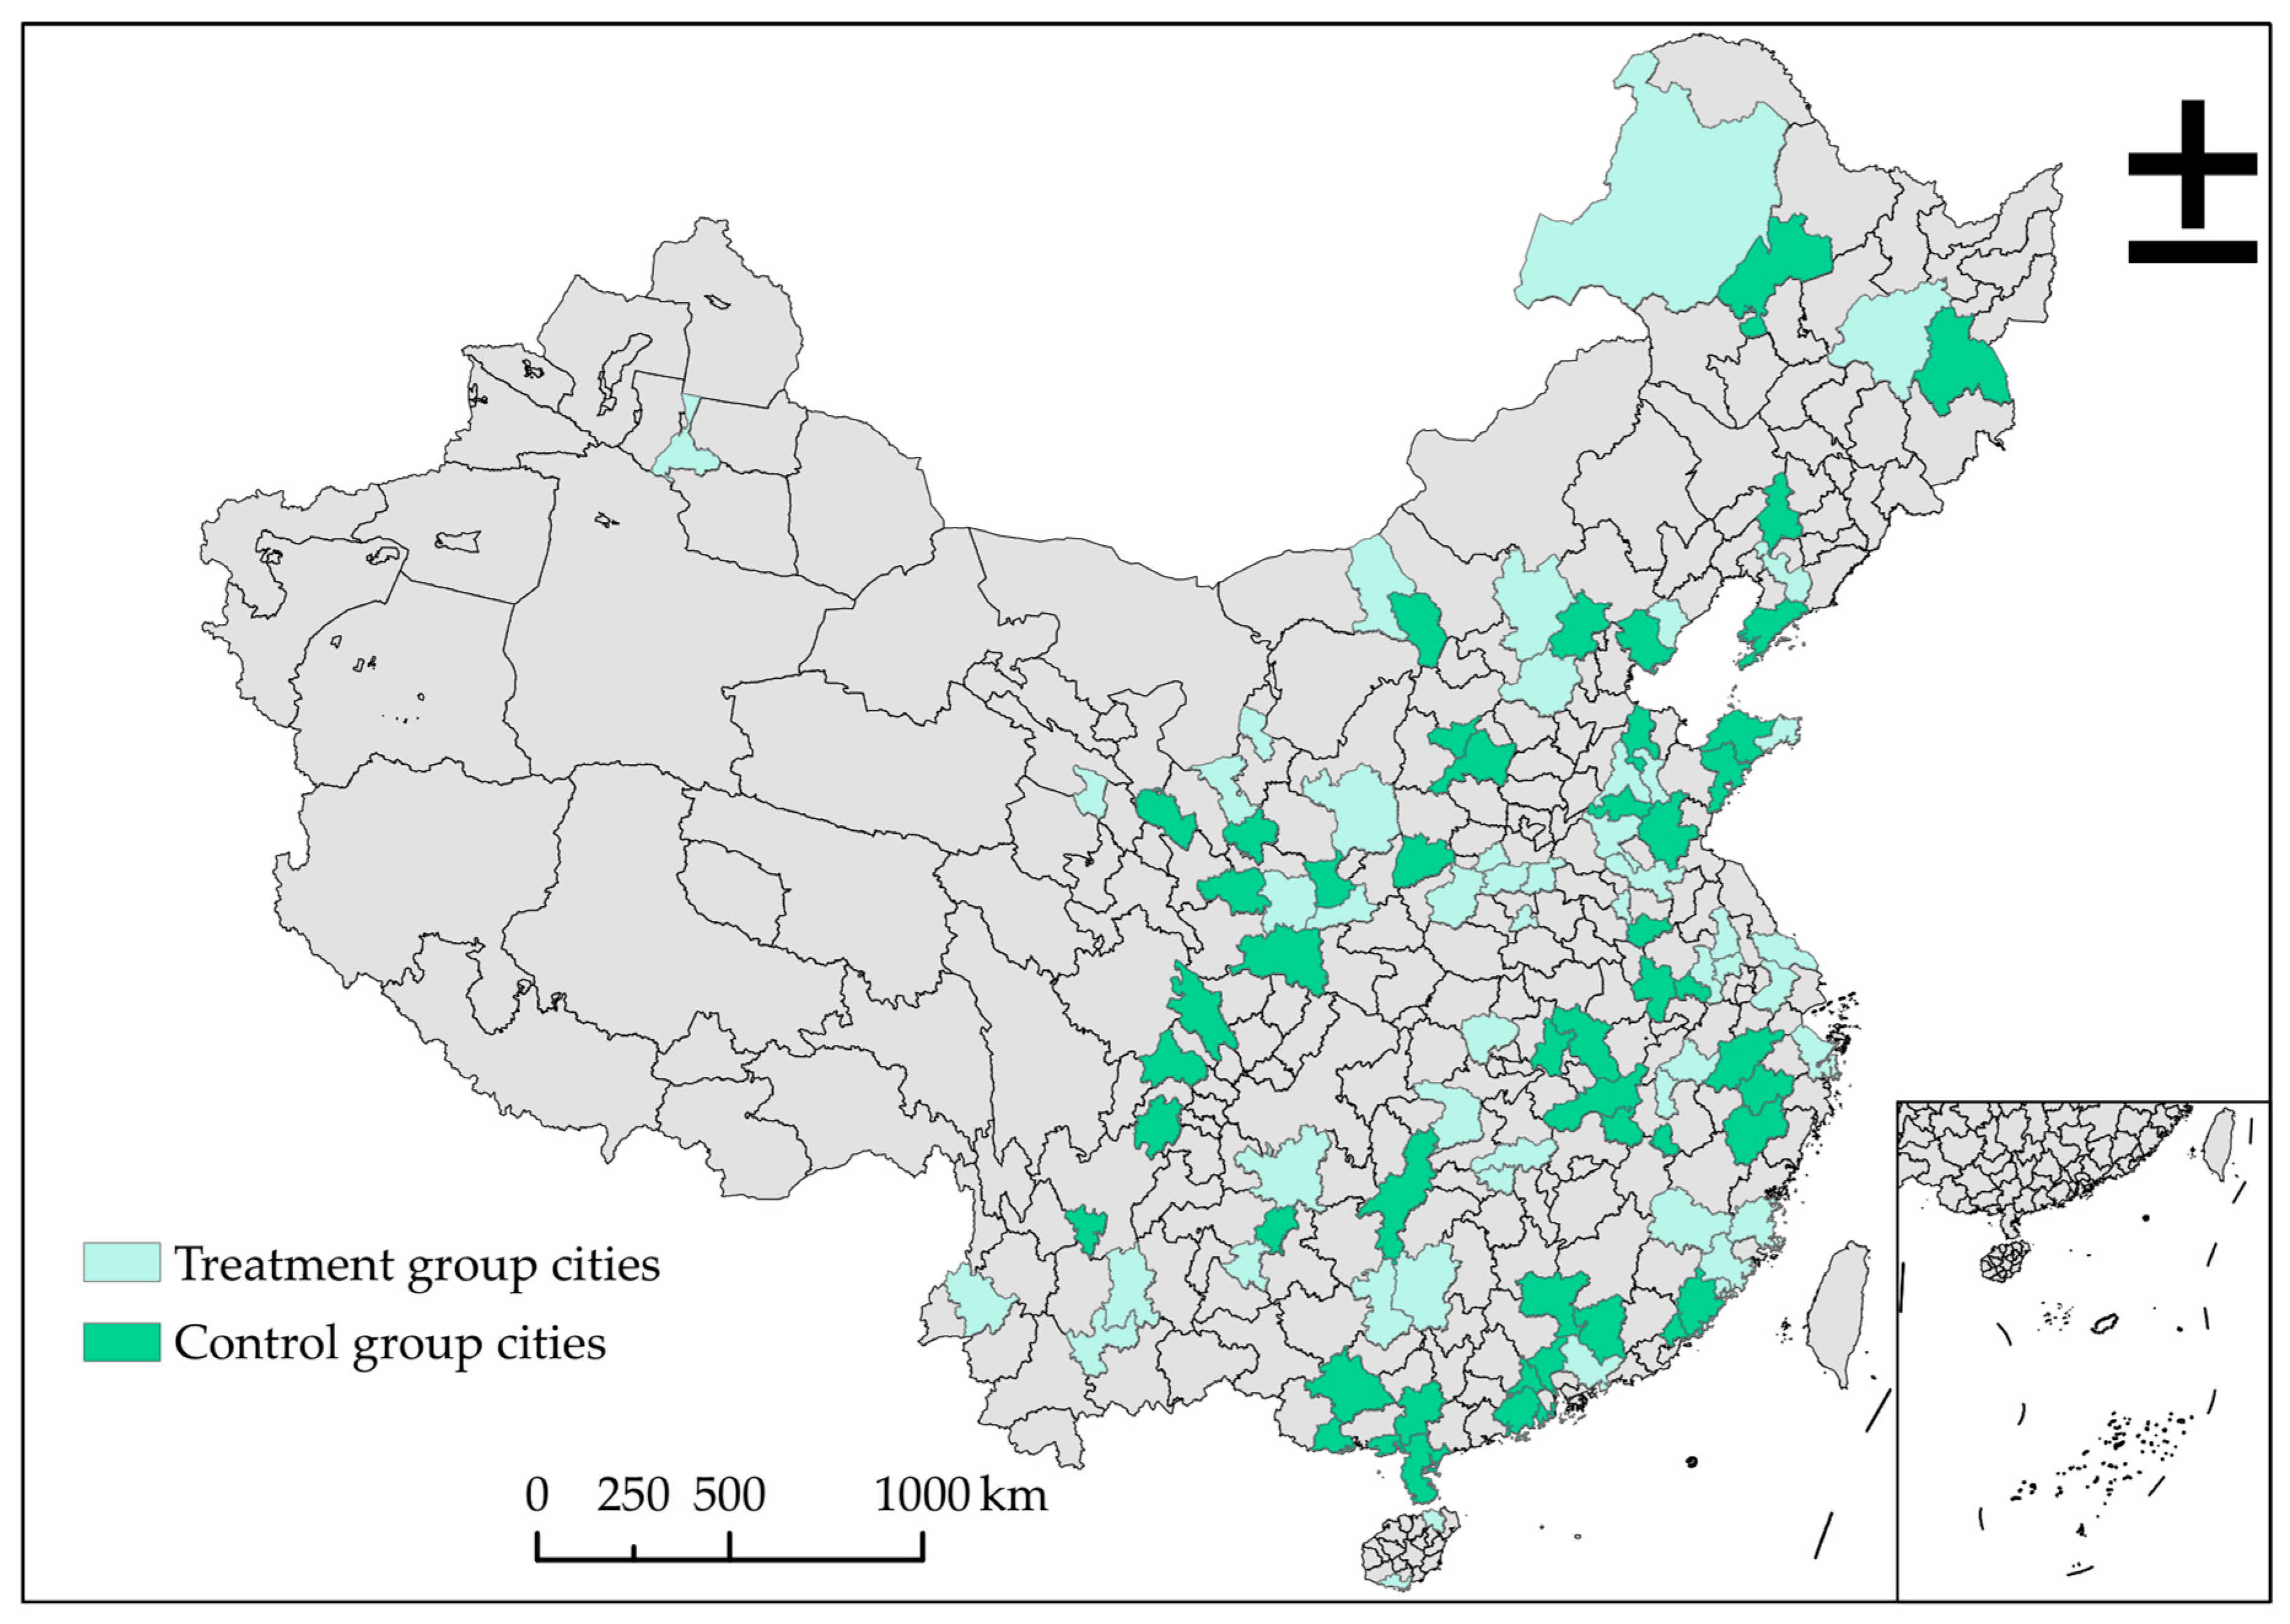
3.1. Data

This study utilized a panel dataset spanning the years 2012 to 2022, encompassing 285 Chinese cities, to estimate the impact of the CBER pilot scheme on urban disease. Cities with significant data gaps were excluded from the sample. Information regarding the CBER pilot scheme was obtained from the official website of China’s Ministry of Housing and Urban–Rural Development. As illustrated in Figure 2, the pilot cities are distributed across diverse regions of China. The CBER pilot program was implemented in three phases, and our sample period covers all three. After excluding county-level cities, a total of 51 pilot cities were designated as the treatment group. PM2.5 data for the sample cities were sourced from the regional raster data provided by the Atmospheric Composition Analysis Group at Dalhousie University [53]. Other data were extracted from the China City Statistical Yearbook (2013–2023).

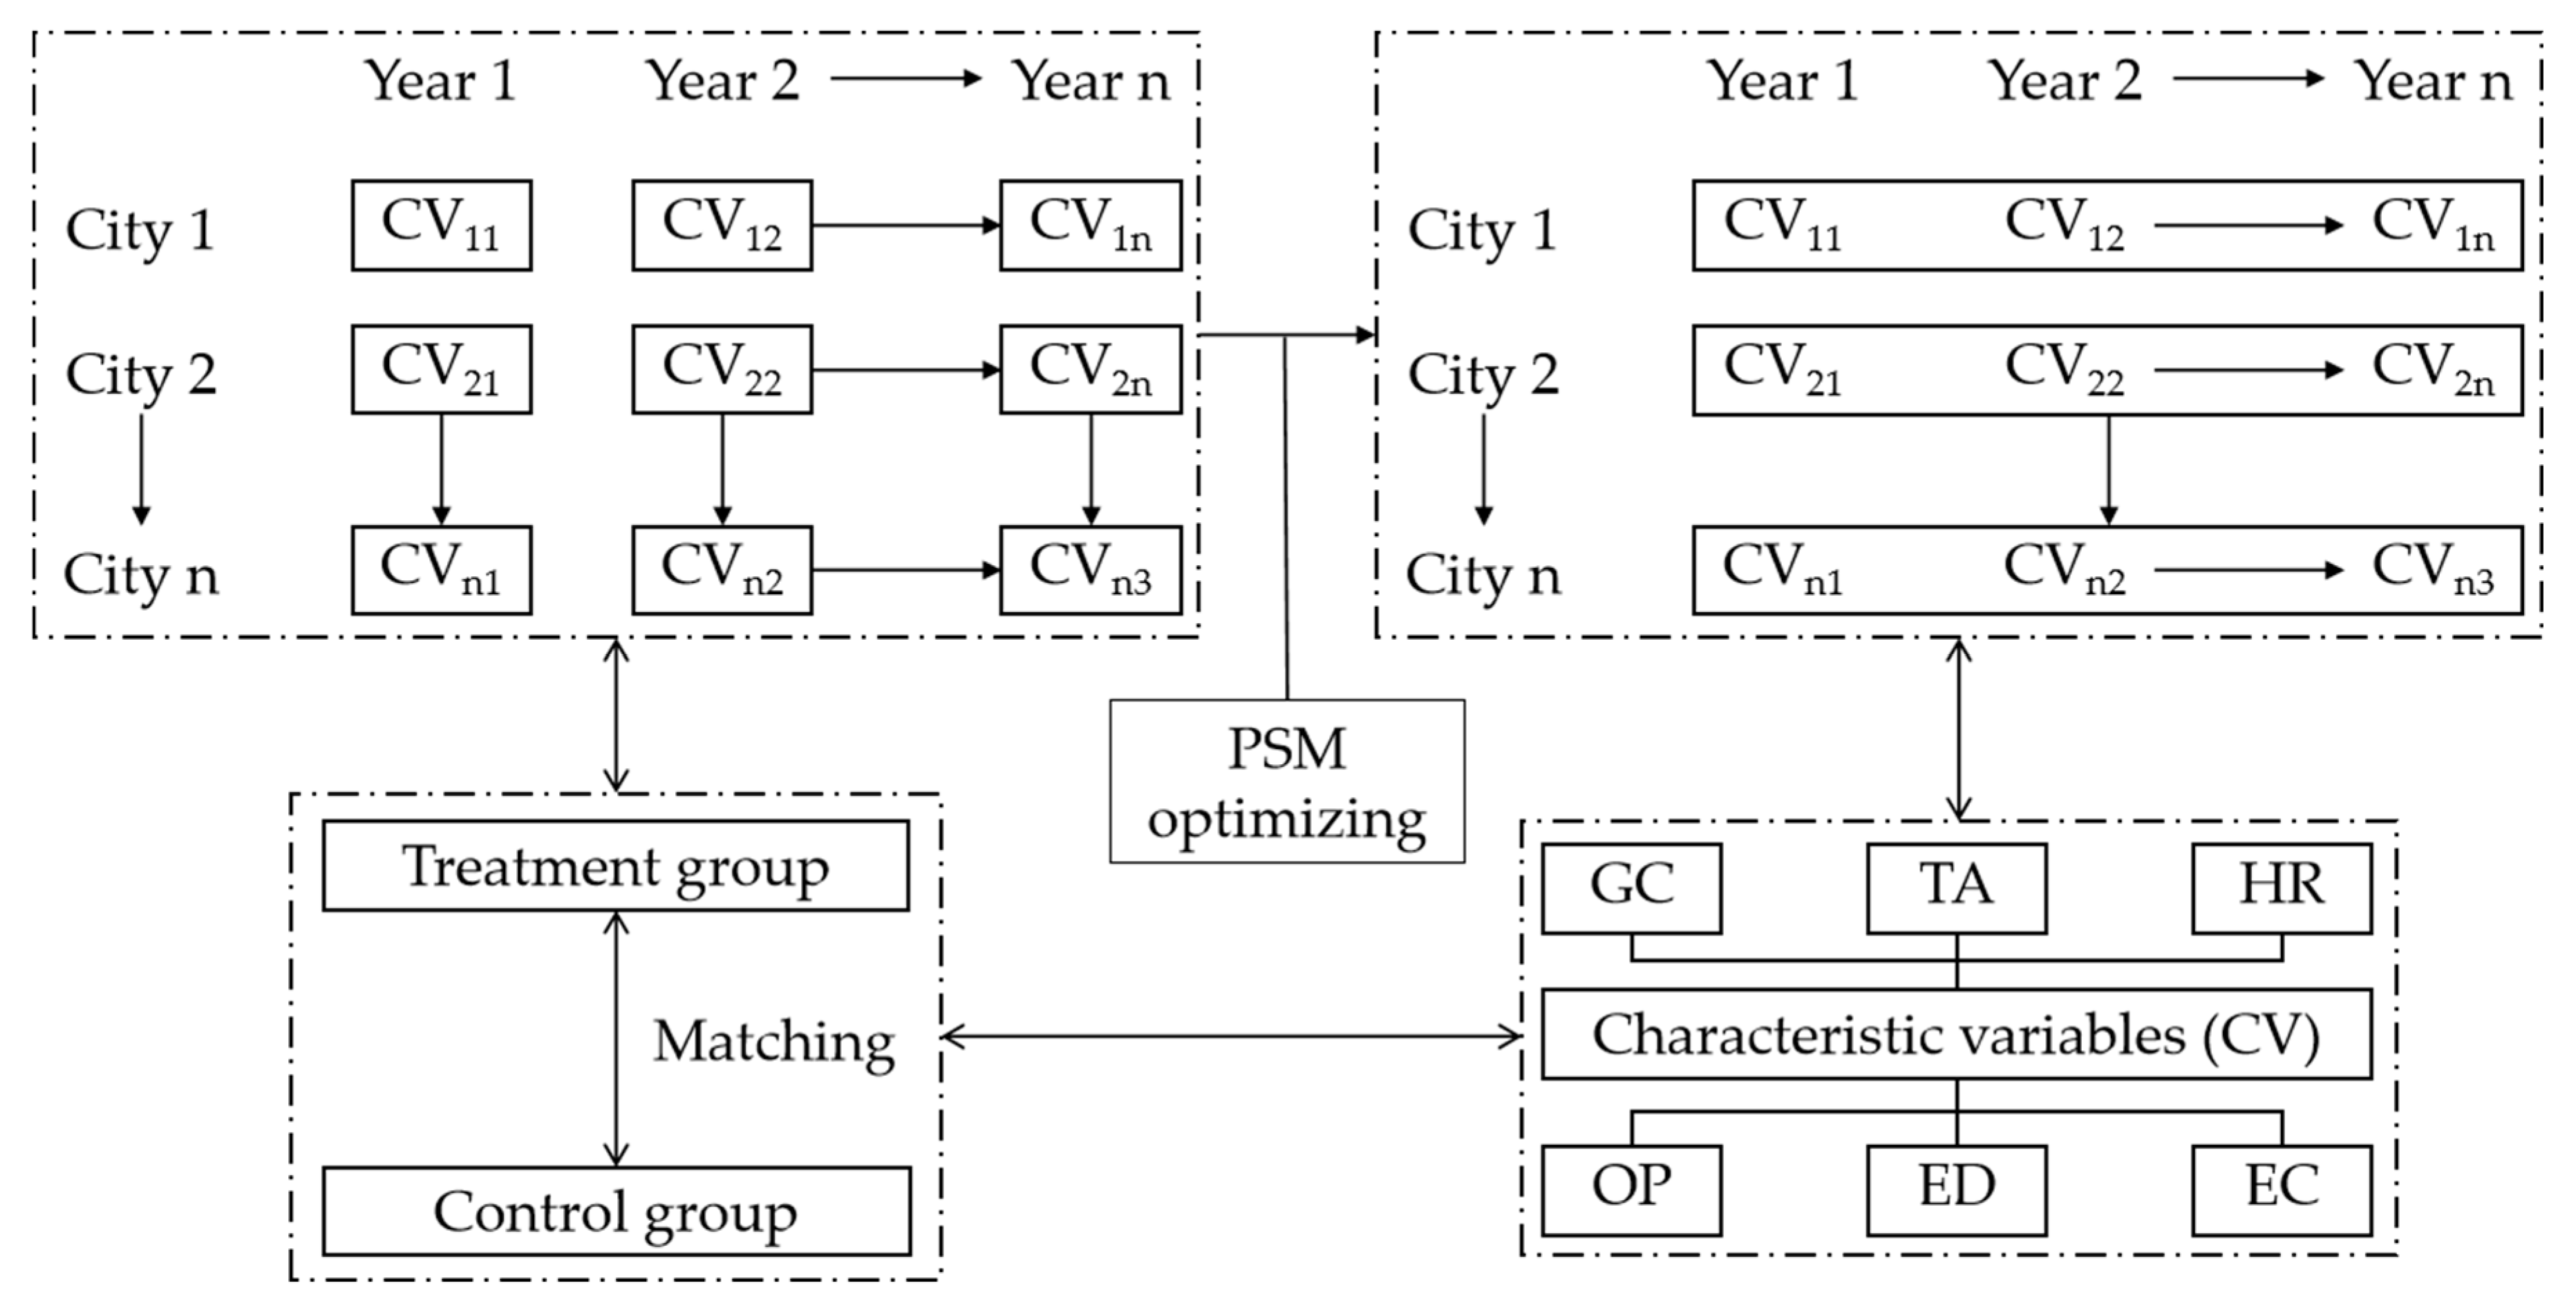
3.2. Variable Selection and Data Processing

3.2.1. Urban Disease Indicators

Referring to current research on urban disease, this study divided assessment on urban disease (UD) into three aspects: population congestion (PC), resource scarcity (RS) and air pollution (AP) [16,54,55]. PC has been considered a major driver of economic and social challenges caused by population growth in cities [56]. With the progression of urbanization, housing and traffic have become increasingly pressing issues for urban residents [28,57]. Consequently, the paper used per capita residential land area and per capita urban road surface area to measure PC. RS encompasses the scarcity of both natural and social resources. Electricity, an indispensable natural resource in contemporary life, is gauged in terms of per capita electricity consumption to measure the reserve of natural resources. The number of doctors per thousand individuals, the student-to-teacher ratio in secondary education and the student-to-teacher ratio in primary education were utilized to evaluate the scarcity of social resources. AP has consistently been a focal topic in urban studies [33,58]. Following Sun et al. (2023), this study selected concentrations of PM2.5, sulfur dioxide emissions and particulate matter emissions as metrics for measuring air pollution levels [16].

3.2.2. Core Explanatory Variable

This study has estimated the impact of the CBER pilot scheme on urban disease. Two dummy variables were introduced: TREAT is a variable indicating whether a city is selected as the CBER pilot cities. TIME is year dummy variable indicating implementation of the CBER pilot scheme. The interaction term TREAT × TIME of the two dummy variables was used in this paper to represent the CBER pilot scheme, whose coefficient showed the effect of the CBER pilot scheme on urban disease.

3.2.3. Control Variables

To avoid the endogeneity problems caused by omitted variables, this study controlled for other factors that could potentially influence urban disease: government capacity (GC), technological advancement (TA), human resource (HR), openness (OP), economic development (ED) and energy consumption (EC).
Government capacity: Considering that local government can intervene in the management of urban disease through policies and financial support, this paper selected fiscal spending as a proxy for government capacity based on the method of Fan and Zhang (2021) [37].
Technological advancement: With the increase in governmental expenditure on science and technology, firms are inclined to engage in a greater number of green innovations [59]. Technological innovation can also facilitate the advancement of urban management system. Consequently, per capita science and technology expenditure were used to indicate technological advancement.
Human resource: Given that high level of human capital can catalyze the urban vitality, the number of students in high education was used to control for the impact of the human resource on urban disease.
Openness: The impact of openness on urban disease is complicated. On the one hand, openness facilitates the import of advanced foreign technology and management system [60], thereby enhancing the efficacy of urban governance; on the other hand, openness may lead to a decrease in entry standard for foreign capital in some cities, potentially resulting in pollution and overpopulation [61]. The actual amount of foreign capital served as a metric for openness.
Economic development: Considering the correlation of gross domestic product (GDP) and environmental pollution according to the Kuznets hypothesis [15], this paper used per capita GDP to measure economic development.
Energy consumption: Energy consumption is expected to increase pollution and other urban problems [16]. Electricity consumption per unit of GDP was used to represent energy consumption.
This paper took the logarithm of the original values to reduce heteroscedasticity. The summary statistics of data can be seen in Table 1.

3.2.4. Data Processing

This study used balanced panel data for the regression. It is necessary to compute a comprehensive urban disease index based on selected indicators. To eliminate the influence of different measurement units and magnitudes across varying urban disease indicators, the min–max normalization method was utilized to transform the initial data to fall within the range of [0, 1].
u i j t = x i j t m i n j x i j t / m a x j x i j t m i n j x i j t ,   i f   u i j t   i s   a   p o s i t i v e   i n d i c a t o r m a x j x i j t x i j t / m a x j x i j t m i n j x i j t ,   i f   u i j t   i s   a   n e g a t i v e   i n d i c a t o r
where uijt is the normalized value of the initial value for indicator j of city i in year t (xijt). For a positive indicator, the higher the indicator value is, the higher the level of urban disease is.
After normalizing the indicator data, it is necessary to assign weights to different indicators to compute the comprehensive index of the three urban diseases. Common methods include subjective and objective weighting methods. The subjective weighting method is highly contingent on individual judgment, which may diminish the manipulability of data and make outcomes biased [62]. The objective weighting method assigns weights based on intrinsic characteristics of data, with the entropy weight method and principal component analysis being commonly employed. Principal component analysis needs us to give explanations to the principal components [63]. Sub-dimensions of the three urban diseases have already been identified in this paper. Hence, this study employed the entropy weight method to determine the weights of indicators, capitalizing on the disorder of data to enhance the discriminability of comprehensive index [64]. The calculation steps are as follows:
Step 1: Calculate the proportion of the indicator j of city i in year t (pijt).
p i j t = u i j t t = 1 k i = 1 m u i j t
where k and m denote the total number of years and cities, respectively.
Step 2: Calculate entropy value for the indicator j (ej).
e j = 1 l n ( k m ) t = 1 k i = 1 m p i j t × l n ( p i j t )
Step 3: Calculate the weight for the indicator j (wj).
w j = 1 e j j = 1 n 1 e j
where n denotes the total number of indicators.
Step 4: Calculate the score of city i in year t (sit).
s i t = j = 1 n u i j t × w j × 10
Accordingly, the weighting values for the three urban diseases can be obtained, as shown in Table 2. The distribution of weighting values is relatively average. After calculating scores of the three urban diseases, the comprehensive score of urban disease (Sit) can be obtained:
S i t = s 1 + s 2 + s 3 3
where s1, s2 and s3 denote the score of PC, RS and AP, respectively.

3.3. Methodology

The difference-in-differences (DID) model is widely acknowledged as an effective way to study quasi-natural experiment and estimate the influences of external shocks [23]. This study employed the DID model to estimate the impact of the CBER pilot scheme on urban disease. The benchmark regression model is described as follows:
U D i t = α 0 + α 1 T R E A T i t × T I M E i t + β j X i t + ε i t
where UDit is the explanatory variable that denotes the level of urban disease of city i in year t. TREATit × TIMEit is the intersection of dummy variables mentioned in Section 3.2.2. Xit are the control variables that potentially affect the urban disease, including GC, TA, HR, OP, ED and EC. εit denotes random error.
Since this study was based on panel data, both time-fixed effects and city-fixed effects were considered. The enhanced model is shown as follows:
U D i t = α 0 + α 1 T R E A T i t × T I M E i t + β j X i t + μ i + ν t + ε i t
where μi is the city-fixed effects, denoting all the characteristics in cities that are time-invariant; vt is the time-fixed effects, denoting the yearly influences that affect all cities.
The most crucial prerequisite for using the DID model is that the treatment and control groups meet the parallel trend assumption [65]. Additionally, the DID model needs a completely random selection between the treatment and control groups, or the results will be largely biased [23]. The PSM-DID method proposed by Heckman et al. (1997) could effectively relieve these problems [43]. The propensity score matching (PSM) method creates a control group with similar individual characteristics to the treatment group, solving the “counterfactual” problem and effectively reducing sample selection bias. A growing number of studies have employed PSM and DID together to estimate the impact of policy implementation.
The PSM method only applies to cross-sectional data, necessitating the conversion of panel data into a cross-sectional format. Some studies have typically transformed panel data into cross-sectional data and then proceeded with the matching process, treating observations of the same entity at different time points as independent entities. This process may give rise to self-matching and mismatching issues. For instance, post-policy treatment group samples may be matched with control group objects from the post-policy period. This could amplify the impact of time-fixed effects on regression outcomes, potentially biasing the subsequent estimates of the DID model.
Hence, an optimized matching approach was employed (Figure 3). This study integrated characteristic variables across all pre-policy years into a unified sequence, which serves as the criterion for matching. Through this process, matched control group cities could be treated as treatment group cities that has not experienced policy implementation, serving as counterfactual outcomes. One-to-one nearest neighbor matching can pair each treatment group sample with a control group sample having the most similar propensity score, which finds a most suitable counterfactual outcome for each treatment group sample. Thus, this study conducted one-to-one nearest neighbor matching for sample cities.
The logit model based on the optimized PSM method is set as follows:
L o g i t T r e a t i = 1 = β 0 + t = 1 a β j t X i t + ε i
where Treati is the dummy variable of the CBER pilot scheme, and city i is a pilot city when Treati is 1. The covariates Xit are introduced in our model, including GC, TA, HR, OP, ED and EC. a denotes the total number of pre-policy years, and there are 6 × a covariates for each city i. εi denotes random error. Each pilot city was matched to an object in the control group based on Logit (Treati = 1) after using a one-to-one nearest neighbor matching method.
Consequently, 51 control group samples were matched to 51 pilot cities, resulting in a total of 102 cities participating in the subsequent study. The distribution of matched control group cities is illustrated in Figure 2.

4. Results and Discussion

4.1. Urban Disease in China

The spatiotemporal characteristics of urban disease in China during the study period are illustrated in Figure 4. It is obvious that urban disease is severe in central and southwestern regions of China. Temporally, there has been a mitigating trend of urban disease in China. Compared to Figure 2, pilot cities in the CBER pilot scheme were predominantly located in regions with severe urban disease, suggesting a scientific and representative selection for pilot cities in this scheme. Following policy implementation, there has been a marked decrease in urban disease.

4.2. Test for Model Assumptions
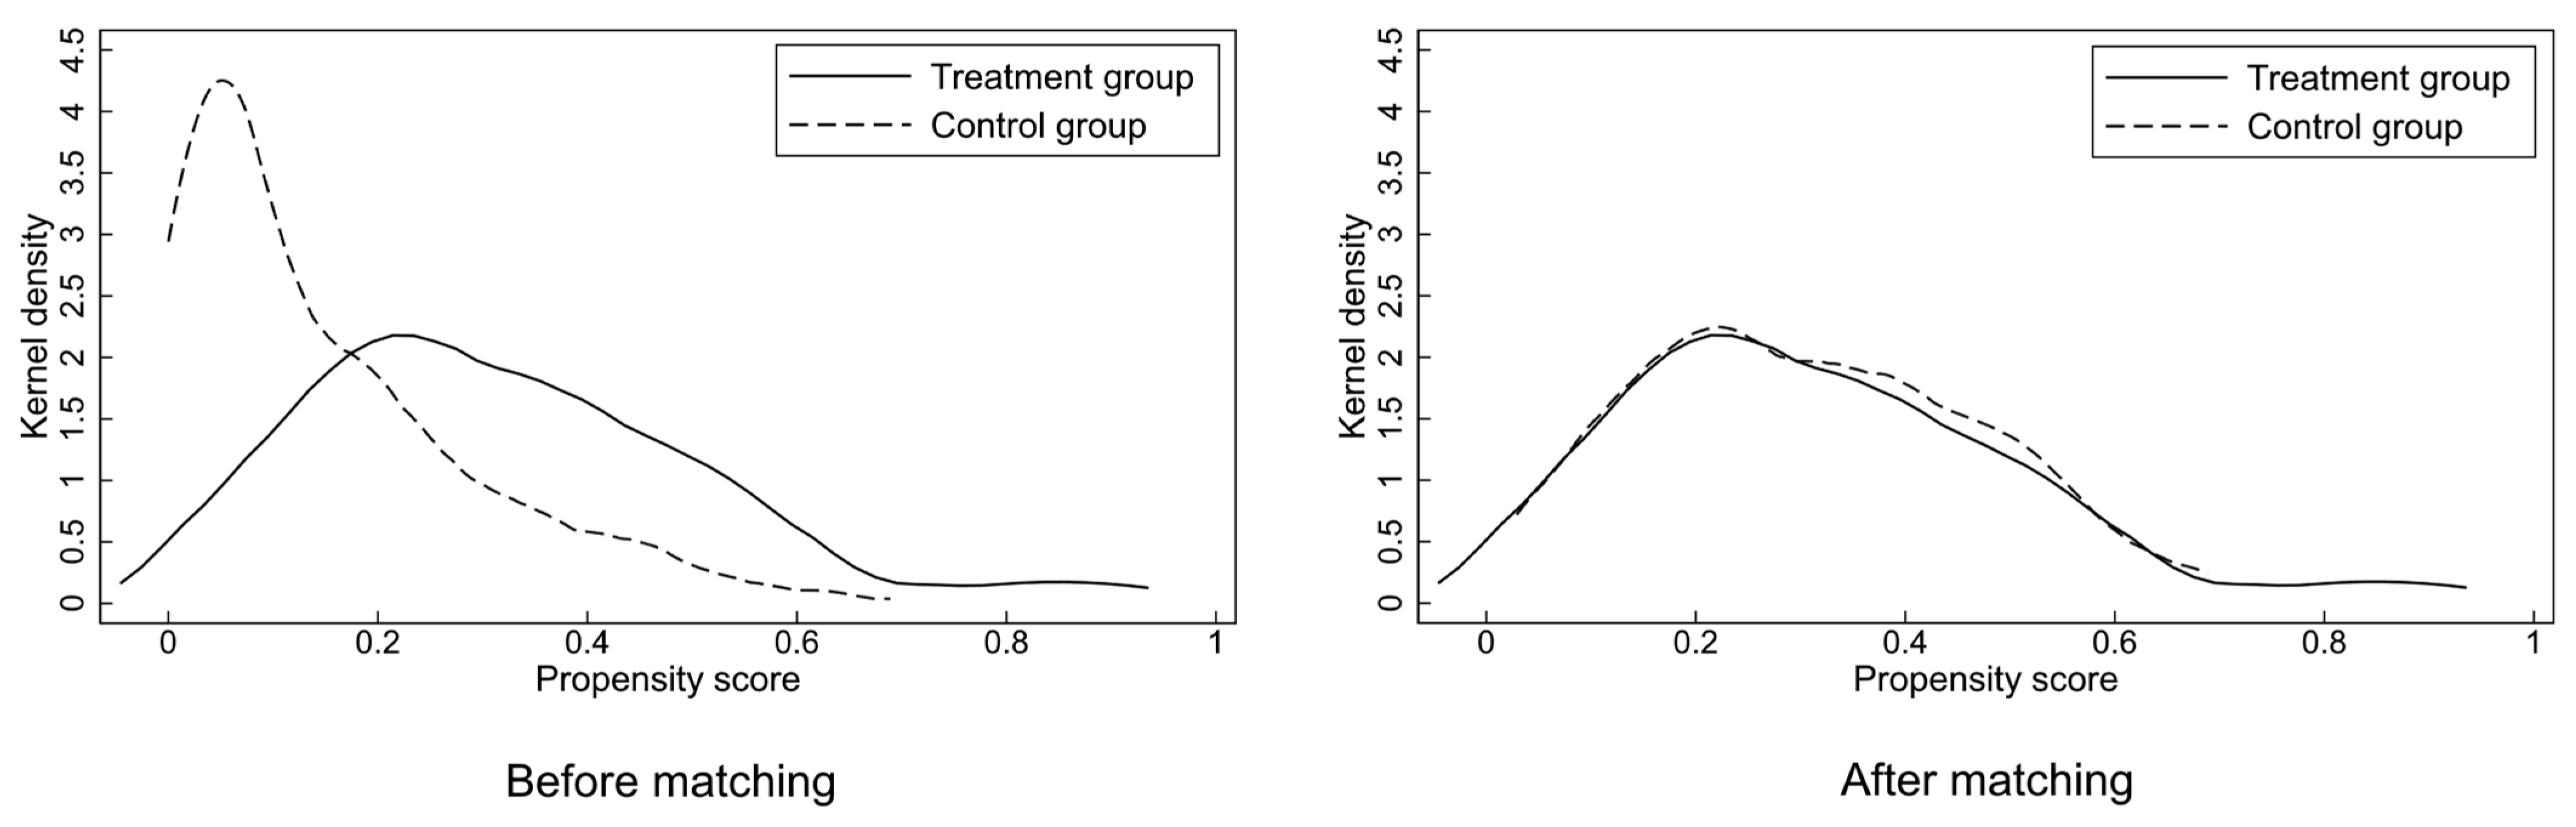
Four tests were conducted before using the DID model to estimate the impact of the CBER pilot scheme on urban disease: a balance test for matching, a multicollinearity test for variables, a Hausman test for estimators and a parallel trend assumption test for DID method (Figure 5).

4.2.1. Balance Test

After matching, 51 control group samples were matched to 51 pilot cities. It is necessary to test whether significant differences exist in the matched covariables between treatment and control groups [66]. This study calculated the percentages of bias for covariates between treatment and control groups before and after matching. Their absolute values decreased by 2–99.1% after matching, as shown in Table 3.
The paper also compared the kernel density distributions of the propensity scores between treatment and control groups (Figure 6). Before matching, the kernel density distributions of the propensity scores were significantly different, and the distribution center of the non-pilot cities was higher than that of pilot cities. The results of estimation were sure to be biased. After matching, the distribution curve of the propensity scores for non-pilot cities was shifted to right, and the difference in the kernel density distributions of the propensity scores was substantially reduced. Thus, the matching effect was relatively ideal.

4.2.2. Multicollinearity Test

The reliability of estimation may decrease if there exists a certain linear relationship between core explanatory variable and control variables [67]. The Variance Inflation Factor (VIF) is typically used to test the multicollinearity between core explanatory variable and control variables. If the VIF value is higher than 10, it suggests that there exists the multicollinearity between selected variables. This study calculated the VIF values in the regression model (Table 4), and all of them were below 4, indicating the rationality of control variables selecting.

4.2.3. Hausman Test

The random-effects model and fixed-effects model are generally used to deal with panel data. This study employed a Hausman test to decide which model to use for regressions [68]. The results are shown in Table 5, and all of them refute null hypothesis, indicating that the fixed-effects model should be employed.

4.2.4. Parallel Trend Assumption Test

One prerequisite for the DID model is parallel trend assumption, which needs that treatment and control groups have similar variation trends in urban disease before the implementation of the CBER pilot scheme. This study extended Model (7) to follow the event study specification for testing:
U D i t = α 0 + α b b = 4 5 D i t b + β j X i t + ε i t
where Dit represents the dummy variables of the policy effects for several years (2012–2022), and the year of 2016 was excluded to mitigate issue of multicollinearity in explanatory variables.
The results are shown in Figure 7. Firstly, this study calculated the average values of urban disease for treatment and control groups. The trend of urban disease for the treatment and control groups is analogous before policy implementation, as shown in the left sub-figure. However, the levels of urban disease for the treatment group exhibit a more significant decreasing trend than that for the control group after policy implementation. Furthermore, Model (10) was employed to test the coefficients of the time dummy variables, as shown in the right sub-figure. The black lines represent 95% confidence interval of coefficients. All coefficients of the year dummy variables before policy implementation are statistically and economically insignificant, indicating that the trend of urban disease for the treatment and control groups is analogous in the pre-policy years. In contrast, all coefficients of the dummy variables in the post-policy years are significantly negative, showing a steady impact of the CBER pilot scheme.

4.3. Baseline Results

Given the tests in above sections, the selected samples meet the requirements for the DID model. Then, this study estimated the impact of the CBER pilot scheme on urban disease (UD), as shown in Table 5. In Column (1), both city and time fixed effects and control variables (ln GC, ln TA, ln HR, ln OP, ln ED and ln EC) were not controlled for. Then, this study added them to the regression model in order, as shown in Columns (2)–(4). The coefficients of policy effects in Columns (1)–(4) are all significantly negative, indicating that the CBER pilot scheme has significantly relieved urban disease. The effects of urban renewal have been evidenced by many cases. For example, in the Superblocks scheme of Barcelona, governments expanded green spaces and redesigned neighborhoods into car-free zones, which have improved public health and social equity. The effective methods in urban renewal initiatives can provide valuable insights, serving to address urban problems.
Additionally, this study estimated different effects of the CBER pilot scheme on various urban diseases, as shown in Table 6. The effects of policy implementation on population congestion (PC), resource scarcity (RS) and air pollution (AP) are shown in Columns (1), (2) and (3), respectively. The CBER pilot scheme has a significantly negative impact on both PC and RS, indicating that urban renewal has mitigated these issues to some extent. However, the impact of it on AP is not significant. Despite the implementation of a series of air pollution control measures, China’s air pollution issue has remained severe [35,69]. The air pollution control measures within the CBER pilot scheme have not effectively alleviated the widespread air pollution in cities. Governments still need to explore more strategies for addressing air pollution.

4.4. Robustness Checks

To ensure the robustness of estimation, this study conducted a series of robustness checks:
First, a placebo test was conducted to assess whether some accidental factors influenced results of benchmark regression. In total, 51 cities were randomly selected from the samples to serve as pilot cities, and a dummy variable for the CBER pilot scheme was constructed based on these selected cities to re-estimate Model (8). This study repeated the above steps 500 times and plotted the distribution of coefficients obtained from the 500 regressions in Figure 8. The horizontal dashed line denotes 10% confidence interval, while the vertical dashed line denotes the coefficient obtained from the regression using actual data. The coefficients obtained from the 500 regressions are mostly smaller in magnitude than the coefficient obtained from the regression using actual data, and most of these coefficients fall outside 10% confidence interval. Consequently, the results of the benchmark regression are unlikely to be caused by some accidental factors.
Second, this study generated another four new interaction terms by multiplying the year dummy variables (2013, 2015, 2019 and 2021) and TREAT to replace the interaction term TREAT×TIME in Model (8). If these year dummy variables significantly relieve urban disease of pilot cities as well, our previous arguments will be rejected. The results are shown in Table 7. All coefficients of the four dummy interaction terms are insignificant, indicating that the CBER pilot scheme has a negative impact on urban disease only in 2017.
Third, this paper excluded samples in and after 2021. The first batch of pilot cities for urban renewal has been selected in 2021, marking comprehensive initiation of urban renewal efforts nationwide. This suggests that urban disease of Chinese cities may be relieved broadly after 2021. Our sample interval covers these years, indicating that the impact of the CBER pilot scheme might be magnified. Consequently, samples in and after 2021 were excluded to re-estimate Model (8). As shown in Column (1) of Table 8, the scheme continues to exert a significant mitigating impact on urban disease, and the coefficient is higher than before. This may be because of the diminishing effects of the CBER policy, which has neutralized the impact of comprehensive initiation of urban renewal nationwide.
Fourth, this study ruled out the impact of another policy that has been implemented during the same period. The Renovation of Aged Residential Quarters (RARQ) is recognized as a crucial component of urban renewal strategies, and it similarly underwent policy piloting in 2017. The RARQ and the CBER scheme did not entirely overlap in the selection of pilot cities, which may lead to an overestimation for the impact of the CBER pilot scheme. Consequently, an interaction term for dummy variable representing the RARQ was added to Model (8) to estimate the coupled impact of these two schemes on urban disease. The results are shown in Column (2) of Table 8, indicating that the CBER pilot scheme continues to relieve urban disease significantly.
Fifth, this study excluded samples of municipalities and economically developed cities (Beijing, Shanghai, Chongqing, Tianjin, Guangzhou and Shenzhen). These cities possess policy and economic advantages relative to other cities, which may bias our estimation. As indicated in Column (3) of Table 8, after exclusion, the negative impact of the CBER pilot scheme remains statistically significant.
Sixth, this paper investigated sensitivity to the time of the policy by adjusting the time interval of policy intervention to identify whether the effects of the CBER pilot scheme vary with years. This study selected samples one year, two years, three years and four years before and after policy implementation. The results are shown in Columns (1)–(4) of Table 9, respectively. The CBER pilot scheme has a significantly negative impact on urban disease. Additionally, it can be seen that values of coefficients decrease with the extension of time interval, indicating that the effects of the CBER pilot scheme may diminish with time.

4.5. Heterogeneity Test

Cities in different regions have different patterns of development. Additionally, the effects of the CBER pilot scheme also exhibit regional heterogeneity due to the different development of cities. This study categorized sample cities into three regions (eastern, central and western) according to the National Bureau of Statistics’s standard. Given that matched control group cities using all samples may not be in the same region as the pilot cities, the outcomes of intra-group regression would be potentially affected. Consequently, an intra-group matching was performed between the treatment and control groups. In this process, this study conducted three PSM methods within eastern, central and western regions, respectively, to ensure that pilot cities and their matched control group cities are in same region. The results of intra-group matching are shown in Figure 9.
The results of intra-group regressions in eastern, central and western regions are shown in Columns (1)–(3) of Table 10, respectively. The impact of the CBER pilot scheme on urban disease exhibited a regional heterogeneity. Specifically, it was more pronounced in eastern and central regions of China. Regional development in China is unbalanced. Overall, the development in western region is relatively slow, with less pronounced urban disease (Figure 4). The increase in levels of urbanization may amplify the governance role of the CBER scheme, with cities of higher urbanization benefiting more from policy interventions due to their geographical and policy resource advantages. This is evidenced by the selection of pilot cities for the CBER scheme, which are predominantly concentrated in eastern and central regions. Cities at different stages of development will respond differently to urban renewal policies.
The motivation for urban renewal is to coordinate the conflict between economic development and environmental protection. In regions with high economic development, the promotion and application of efficient production technology and a management model are more comprehensive. Therefore, the CBER pilot scheme could enhance the allocation capability of resource and technology in cities with high economic development. Additionally, urban renewal involves the transformation of government functions and the development of talent market, which is conductive to urban problems addressing.
In order to verify the reasons for regional heterogeneity in the effects of the CBER pilot scheme, this study conducted stratified regressions on sample cities based on their economic development, government capacity and human resource, estimating different effects of urban renewal on cities at various stages of development. Sample cities were stratified based on per capita GDP, fiscal spending and the number of students in high education. The results are shown in Figure 10. It is obvious that the effects of urban renewal in alleviating urban disease is significant in cities with high economic development, robust government capacity and rich human resource. In contrast, if a city’s economic growth is slow, government capacity is limited or human resource is deficient, urban renewal will be ineffective in alleviating urban disease. Clearly, economic development, government capacity and human resource are all important factors affecting the effects of urban renewal policies.

4.6. Influence Path Analysis

Next, this study investigated the factors through which the scheme relieves urban disease. The mediating effects model was employed:
M i t = α 0 + c T R E A T i t × T I M E i t + β j X i t + μ i + ν t + ε i t
U D i t = α 0 + α 1 T R E A T i t × T I M E i t + d M i t + β j X i t + μ i + ν t + ε i t
where Mit denotes mediating variables. The effects of urban renewal on mediating variables are shown in Model (11). Additionally, the effects of mediating variables and urban renewal on urban disease are shown in Model (12). c and d are coefficients of mediating effects. There exist mediating effects if c and d are both significant.
This study selected three mediating variables: industrial structure (the ratio of tertiary to secondary industry), infrastructure development (per capita pipeline length) and consumption upgrading (per capita retail sales of social consumption goods). The results of influence path analysis are shown in Table 11. The coefficients in Columns (1), (3) and (5) indicate that urban renewal has a significantly positive influence on industrial structure, infrastructure development and consumption upgrading, respectively. Based on this, the coefficients in Columns (2), (4) and (6) show that urban renewal, along with the three mediating variables, has a significantly negative impact on urban disease. Consequently, these three mediating variables are all crucial intermediate links in the relationship between urban renewal and urban disease.

4.7. Comparison with Other Studies

This study investigated the impact of the CBER pilot scheme on urban disease, and the robustness of results was verified by a series of tests. Related studies have also estimated the effects of urban renewal on urban problems. Urban renewal can help to address socio-economic problems in urban development [11], such as the use of land resources and societal inclusivity for vulnerable groups [12,13]. Urban renewal policies that were inclusive of vulnerable groups were less likely to result in gentrification and more likely to enhance public health [70]. In many parts of the world, urban renewal has become a significant urban governance policy. For example, in Rome (Italy), study has found that urban renewal could moderate the effects of urban decay on property values [71]. Additionally, sustainable urban development can help to realize sustainable urban renewal practices. They reinforce each other [72]. These findings suggest that urban renewal exhibits mitigating effects on urban problems.

5. Conclusions and Policy Implications

5.1. Conclusions

Utilizing the entropy weight method, this study calculated urban disease levels of Chinese cities. Urban disease is particularly pronounced in central and southwestern regions of China. Based on this, the impact of the CBER pilot scheme on urban disease was estimated through the PSM-DID model. The conclusions are threefold.
(1)
The CBER pilot scheme effectively mitigated urban disease in China, and this affect remained significant after a series of robustness tests.
(2)
The impact of the CBER pilot scheme was more pronounced in eastern and central regions of China, as well as in cities with high economic development, robust government capacity and abundant human resource.
(3)
Industrial structure optimization, infrastructure development and consumption upgrading were all effective pathways for mitigating urban disease through urban renewal.

5.2. Policy Implications

The policy implications based on our findings are as follows:
(1)
The CBER pilot scheme significantly alleviated urban disease, confirming its effectiveness in concepts and governance methods. Consequently, local governments can address urban problems referring to methods of the CBER pilot scheme. Specifically, the concepts of the CBER scheme can be divided into two aspects. Firstly, governments should restore the degraded natural environment and topography to enhance the living quality of residents using the concept of ecological regeneration. Then, they can rehabilitate urban infrastructure, spatial environment and landscape aesthetic to improve characteristics and vitality of cities using the concept of urban renewal and infill.
(2)
The CBER pilot scheme did not effectively mitigate air pollution, indicating that governments should pay greater attention to this problem and continue exploring effective ways to handle it. For example, the development of new urbanization can effectively address the issue of air pollution [27,31].
(3)
The effects of the CBER pilot scheme exhibited regional heterogeneity. The variation in these mitigating effects was associated with the selection of pilot cities, with a denser distribution of pilot cities in regions where mitigating effects were better. Consequently, reasonable policy piloting can leverage the driving force of advantageous cities and eliminate regional barriers, facilitating urban problems addressing. Moreover, the development of economic levels, improvement of government functions and expansion of talent introduction are effective means to enhance the effects of urban renewal policies.
(4)
Governments should explore multi-dimensional pathways for urban renewal to alleviate urban disease. The potential of industrial innovation, infrastructure development and consumption upgrading can be fully harnessed to address problems in cities by combining urban renewal with them. For example, driving the concentration of high-tech industries and services in city centers through urban renewal can promote a transformation of urban industrial structure towards advancement, reducing pollution emissions and increasing production efficiency.

5.3. Limitations

Several limitations exist in our study.
(1)
The measurement of urban disease in this study has been limited to three dimensions constrained by the accessibility of data. The challenges faced by urban development are diverse. Some scholars have considered difficulties and well-being of residents as indicators for assessing urban disease. Future research can adopt a more comprehensive system of indicators to measure urban disease.
(2)
This study employed an optimized PSM method to match samples, considering overall characteristics of cities in pre-policy years as criteria for propensity score calculating. However, selected characteristic variables still inadequately reflect the propensity of a city being chosen as a pilot city. Future research should endeavor to align with real conditions. By using criteria used by governments for pilot cities selecting, propensity score calculating can better serve in the PSM-DID model.
(3)
This study revealed that the effects of urban renewal in alleviating urban disease exhibited heterogeneity. The relationship between urban renewal and urban disease features spatial interaction and phase-specific characteristics. Many regression models can be employed to investigate these issues. For example, future research can consider exploring this relationship using spatial autocorrelation models and threshold effect models.

Author Contributions

T.L.: writing—original draft, visualization, validation, software, methodology, investigation, formal analysis, data curation and conceptualization. H.Y.: writing—review and editing and formal analysis. Z.G.: visualization and data curation. All authors have read and agreed to the published version of the manuscript.

Funding

This work was supported by the Wuhan Urban Construction Science and Technology Program, China (grant No. 20222s0011).

Institutional Review Board Statement

Not applicable.

Informed Consent Statement

Not applicable.

Data Availability Statement

Data will be made available on request.

Conflicts of Interest

The authors declare that they have no known competing financial interests or personal relationships that could have appeared to influence the work reported in this paper.

Abbreviations

The following abbreviations are used in this manuscript:
CBERThe City Betterment and Ecological Restoration
UDUrban Disease
PCPopulation Congestion
RSResource Scarcity
APAir Pollution
RARQRenovation of Aged Residential Quarters
GCGovernment Capacity
TATechnological Advancement
HRHuman Resource
OPOpenness
EDEconomic Development
ECEnergy Consumption

References

  1. Li, M.; Li, C.; Zhang, M. Exploring the spatial spillover effects of industrialization and urbanization factors on pollutants emissions in China’s Huang-Huai-Hai region. J. Clean. Prod. 2018, 195, 154–162. [Google Scholar] [CrossRef]
  2. Wu, G.; Miao, Z.; Shao, S.; Jiang, K.; Geng, Y.; Li, D.; Liu, H. Evaluating the construction efficiencies of urban wastewater transportation and treatment capacity: Evidence from 70 megacities in China. Resour. Conserv. Recy. 2018, 128, 373–381. [Google Scholar] [CrossRef]
  3. Wang, Y.; Li, X.; Kang, Y.; Chen, W.; Zhao, M.; Li, W. Analyzing the impact of urbanization quality on CO2 emissions: What can geographically weighted regression tell us? Renew. Sust. Energ. Rev. 2019, 104, 127–136. [Google Scholar] [CrossRef]
  4. Gasana, J.; Dillikar, D.; Mendy, A.; Forno, E.; Vieira, E.R. Motor vehicle air pollution and asthma in children: A meta-analysis. Environ. Res. 2012, 117, 36–45. [Google Scholar] [CrossRef]
  5. Shah, A.S.; Langrish, J.P.; Nair, H.; McAllister, D.A.; Hunter, A.L.; Donaldson, K.; Newby, D.E.; Mills, N.L. Global association of air pollution and heart failure: A systematic review and meta-analysis. Lancet 2013, 382, 1039–1048. [Google Scholar] [CrossRef]
  6. Yang, X.J. China’s rapid urbanization. Science 2013, 342, 310. [Google Scholar] [CrossRef]
  7. Guan, X.; Wei, H.; Lu, S.; Dai, Q.; Su, H. Assessment on the urbanization strategy in China: Achievements, challenges and reflections. Habit. Int. 2018, 71, 97–109. [Google Scholar] [CrossRef]
  8. Northam, R.M. Urban Geography; Wiley: Hoboken, NJ, USA, 1979. [Google Scholar]
  9. Wang, X.; Li, S. Progress and prospects of diagnostic analysis and risk prediction of urban problems based on multiple perspectives. Prog. Geogr. 2017, 36, 231–243. (In Chinese) [Google Scholar]
  10. Adams, D.; Hastings, E.M. Urban renewal in Hong Kong: Transition from development corporation to renewal authority. Land Use Policy 2001, 18, 245–258. [Google Scholar] [CrossRef]
  11. Lee, G.K.L.; Chan, E.H.W. The analytic hierarchy process (AHP) approach for assessment of urban renewal proposals. Soc. Indic. Res. 2008, 89, 155–168. [Google Scholar] [CrossRef]
  12. Ho, D.C.W.; Yau, Y.; Poon, S.W.; Liusman, E. Achieving sustainable urban renewal in Hong Kong: Strategy for dilapidation assessment of high rises. J. Urban Plan Dev. 2012, 138, 153–165. [Google Scholar] [CrossRef]
  13. Chan, E.H.W.; Yung, E.H.K. Is the development control legal framework conducive to a sustainable dense urban development in Hong Kong? Habitat Int. 2004, 28, 409–426. [Google Scholar] [CrossRef]
  14. Couch, C.; Dennemann, A. Urban regeneration and sustainable development in Britain: The example of the Liverpool Ropewalks Partnership. Cities 2000, 17, 137–147. [Google Scholar] [CrossRef]
  15. Grossman, G.M.; Krueger, A.B. Economic growth and the environment. Q. J. Econ. 1995, 110, 353–377. [Google Scholar] [CrossRef]
  16. Sun, B.; Fang, C.; Liao, X.; Guo, X.; Liu, Z. The relationship between urbanization and air pollution affected by intercity factor mobility: A case of the Yangtze River Delta region. Environ. Impact Asses. 2023, 100, 107092. [Google Scholar] [CrossRef]
  17. Wang, X.; Tian, G.; Yang, D.; Zhang, W.; Lu, D.; Liu, Z. Responses of PM2.5 pollution to urbanization in China. Energ. Policy 2018, 123, 602–610. [Google Scholar] [CrossRef]
  18. Martínez-Zarzoso, I.; Maruotti, A. The impact of urbanization on CO2 emissions: Evidence from developing countries. Ecol. Econ. 2011, 70, 1344–1353. [Google Scholar] [CrossRef]
  19. Wolman, A. The metabolism of cities. Sci. Am. 1965, 213, 178–193. [Google Scholar] [CrossRef]
  20. Du, M.; Antunes, J.; Wanke, P.; Chen, Z. Ecological efficiency assessment under the construction of low-carbon city: A perspective of green technology innovation. J. Environ. Plann. Man. 2022, 65, 1727–1752. [Google Scholar] [CrossRef]
  21. Zucaro, A.; Ripa, M.; Mellino, S.; Ascione, M.; Ulgiati, S. Urban resource use and environmental performance indicators. An application of decomposition analysis. Ecol. Indic. 2014, 47, 16–25. [Google Scholar] [CrossRef]
  22. Zhang, Y.; Xia, L.; Fath, B.D.; Yang, Z.; Yin, X.; Su, M.; Liu, G.; Li, Y. Development of a spatially explicit network model of urban metabolism and analysis of the distribution of ecological relationships: Case study of Beijing, China. J. Clean. Prod. 2016, 112, 4304–4317. [Google Scholar] [CrossRef]
  23. Fu, Y.; He, C.; Luo, L. Does the low-carbon city policy make a difference? Empirical evidence of the pilot scheme in China with DEA and PSM-DID. Ecol. Indic. 2021, 122, 107238. [Google Scholar] [CrossRef]
  24. Xie, G.; Chen, W.; Cao, S.; Lu, C.; Xiao, Y.; Zhang, C.; Li, N.; Wang, S. The outward extension of an ecological footprint in city expansion: The case of Beijing. Sustainability 2014, 6, 9371–9386. [Google Scholar] [CrossRef]
  25. Gao, Y.; Feng, Z.; Li, Y.; Li, S. Freshwater ecosystem service footprint model: A model to evaluate regional freshwater sustainable development—A case study in Beijing–Tianjin–Hebei, China. Ecol. Indic. 2014, 39, 1–9. [Google Scholar] [CrossRef]
  26. Burkhard, B.; Kroll, F.; Nedkov, S.; Müller, F. Mapping ecosystem service supply, demand and budgets. Ecol. Indic. 2012, 21, 17–29. [Google Scholar] [CrossRef]
  27. Zhao, C.; Wang, B. How does new-type urbanization affect air pollution? Empirical evidence based on spatial spillover effect and spatial Durbin model. Environ. Int. 2022, 165, 107304. [Google Scholar] [PubMed]
  28. Ewing, R.; Tian, G.; Lyons, T. Does compact development increase or reduce traffic congestion? Cities 2018, 72, 94–101. [Google Scholar] [CrossRef]
  29. Chow, A.H.F.; Santacreu, A.; Tsapakis, I.; Tanasaranond, G.; Cheng, T. Empirical assessment of urban traffic congestion. J. Adv. Transport. 2014, 48, 1000–1016. [Google Scholar]
  30. Levy, J.I.; Buonocore, J.J.; Stackelberg, K.V. Evaluation of the public health impacts of traffic congestion: A health risk assessment. Environ. Health 2010, 9, 65. [Google Scholar] [CrossRef]
  31. Xu, A.; Song, M.; Wu, Y.; Luo, Y.; Zhu, Y.; Qiu, K. Effects of new urbanization on China’s carbon emissions: A quasi-natural experiment based on the improved PSM-DID model. Technol. Forecast. Soc. 2024, 200, 123164. [Google Scholar] [CrossRef]
  32. Ryan, A.M.; Burgess Jr, J.F.; Dimick, J.B. Why we should not be indifferent to specification choices for difference-in-differences. Health. Serv. Res. 2015, 50, 1211–1235. [Google Scholar] [CrossRef]
  33. Xiao, R.; Tan, G.; Huang, B.; Li, J.; Luo, Y. Pathways to sustainable development: Regional integration and carbon emissions in China. Energy Rep. 2022, 8, 5137–5145. [Google Scholar] [CrossRef]
  34. Luo, C.; Qiang, W.; Lee, H.F. Does the low-carbon city pilot policy work in China? A company-level analysis based on the PSM-DID model. J. Environ. Manage 2023, 337, 117725. [Google Scholar] [CrossRef]
  35. Liu, H.; Liu, J.; Li, M.; Gou, P.; Cheng, Y. Assessing the evolution of PM2.5 and related health impacts resulting from air quality policies in China. Environ. Impact Assess. 2022, 93, 106727. [Google Scholar] [CrossRef]
  36. Yang, X.; Lin, S.; Li, Y.; He, M. Can high-speed rail reduce environmental pollution? Evidence from China. J. Clean. Prod. 2019, 239, 118135. [Google Scholar] [CrossRef]
  37. Fan, F.; Zhang, X. Transformation effect of resource-based cities based on PSM-DID model: An empirical analysis from China. Environ. Impact Asses. 2021, 91, 106648. [Google Scholar] [CrossRef]
  38. Zhou, A.; Wang, S.; Chen, B. Impact of new energy demonstration city policy on energy efficiency: Evidence from China. J. Clean. Prod. 2023, 422, 138560. [Google Scholar] [CrossRef]
  39. Huang, G.; Xu, D. The last mile matters: Impact of dockless bike-sharing services on traffic congestion. Transp. Res. Part D Transp. Environ. 2023, 121, 103836. [Google Scholar] [CrossRef]
  40. Guo, Y.; Tang, Z.; Guo, J. Could a smart city ameliorate urban traffic congestion? A quasi-natural experiment based on a smart city pilot program in China. Sustainability 2020, 12, 2291. [Google Scholar] [CrossRef]
  41. Yuan, C.; Jiang, H.; Chen, C. Differences in returns to cross-border and domestic mergers and acquisitions: Empirical evidence from China using PSM-DID. Financ. Res. Lett. 2023, 55, 103961. [Google Scholar] [CrossRef]
  42. Ye, M.; Liao, L.; Fu, T.; Lan, S. Do establishment of protected areas and implementation of regional policies both promote the forest NPP? Evidence from Wuyi Mountain in China based on PSM-DID. Glob. Ecol. Conserv. 2024, 55, e03210. [Google Scholar] [CrossRef]
  43. Heckman, J.J.; Ichimura, H.; Todd, P.E. Matching as an econometric evaluation estimator: Evidence from evaluating a job training programme. Rev. Econ. Stud. 1997, 64, 605–654. [Google Scholar] [CrossRef]
  44. Yu, Y.; Chen, X.; Zhang, N. Innovation and energy productivity: An empirical study of the innovative city pilot policy in China. Technol. Forecast. Soc. Change 2022, 176, 121430. [Google Scholar] [CrossRef]
  45. Xie, S.; Fan, P.; Wan, Y. Improvement and application of classical PSM-DID model. Stat. Res. 2021, 38, 146–160. [Google Scholar]
  46. Li, X.; Zhang, G.; Li, W.; Xie, J. Some issues in urban regeneration from industrial development viewpoint. Planners 2021, 2021, 34–40. (In Chinese) [Google Scholar]
  47. Chang, J.; Wang, W.; Liu, J. Industrial upgrading and its influence on green land use efficiency. Sci. Rep. 2023, 13, 2813. [Google Scholar] [CrossRef]
  48. Dai, M.; Zhang, H.; Luo, W. The theory and practice of urban development and transformation. With a discussion on Shenzhen’s developmental transformation. Urban Issues 2013, 2013, 84–88. (In Chinese) [Google Scholar]
  49. Banister, D.; Anderton, K.; Bonilla, D.; Givoni, M.; Schwanen, T. Transportation and the environment. Annu. Rev. Env. Resour. 2011, 36, 247–270. [Google Scholar] [CrossRef]
  50. Sun, C.; Luo, Y.; Yao, X. Transport infrastructure and urban air pollution. Empirical evidence from China. Econ. Res. 2019, 54, 136–151. (In Chinese) [Google Scholar]
  51. Zhao, J.; Zhu, Y. The influence of the change of residents’ consumption structure on environmental efficiency from the perspective of investment. Resour. Sci. 2021, 43, 1764–1777. (In Chinese) [Google Scholar]
  52. Chen, Z.; Ma, Y. A study on the influence of urban renewal on residents’ well-being in China. Based on genetic algorithm projection pursuit and panel spatial quantile model. Manag. Rev. 2022, 34, 43–53. (In Chinese) [Google Scholar]
  53. Hammer, M.S.; Van Donkelaar, A.; Li, C.; Lyapustin, A.; Sayer, A.M.; Hsu, N.C.; Levy, R.C.; Garay, M.J.; Kalashnikova, O.V.; Kahn, R.A.; et al. Global estimates and long-term trends of fine particulate matter concentrations (1998–2018). Environ. Sci. Technol. 2020, 54, 7879–7890. [Google Scholar] [CrossRef] [PubMed]
  54. Hodge, D.C. Urban congestion: Reshaping urban life. Urban Geogr. 1992, 13, 577–588. [Google Scholar] [CrossRef]
  55. Furnham, A.; McClelland, A. The allocation of scarce resources: Social housing. Soc. Behav. Personal. 2004, 32, 45–53. [Google Scholar] [CrossRef]
  56. Li, J.; Lu, M.; Lu, T. Constructing compact cities: How urban regeneration can enhance growth and relieve congestion. Econ. Model. 2022, 113, 105828. [Google Scholar] [CrossRef]
  57. Airgood-Obrycki, W.; McCue, D. The Housing Shortage Is Still Out There. Hous. Policy Debate 2024, 2024, 1–5. [Google Scholar] [CrossRef]
  58. Mayer, H. Air pollution in cities. Atmos. Environ. 1999, 33, 4029–4037. [Google Scholar] [CrossRef]
  59. Gan, T.; Liang, W.; Yang, H.; Liao, X. The effect of Economic Development on haze pollution (PM2.5) based on a spatial perspective: Urbanization as a mediating variable. J. Clean. Prod. 2020, 266, 121880. [Google Scholar] [CrossRef]
  60. Jiang, L.; Zhou, H.; Bai, L.; Zhou, P. Does foreign direct investment drive environmental degradation in China? An empirical study based on air quality index from a spatial perspective. J. Clean. Prod. 2018, 176, 864–872. [Google Scholar] [CrossRef]
  61. Liu, Q.; Wang, S.; Zhang, W.; Li, J.; Dong, G. The effect of natural and anthropogenic factors on PM2.5: Empirical evidence from Chinese cities with different income levels. Sci. Total Environ. 2019, 653, 157–167. [Google Scholar] [CrossRef]
  62. Feng, Y.; Li, G. Interaction between urbanization and eco-environment in the Tibetan Plateau. J. Geogr. Sci. 2021, 31, 298–324. [Google Scholar] [CrossRef]
  63. Yu, B. Ecological effects of new-type urbanization in China. Renew. Sust. Energ. Rev. 2021, 135, 110239. [Google Scholar] [CrossRef]
  64. Yang, L.; Sun, Z.C. The development of western new-type urbanization level evaluation based on entropy method. Econ. Probl. 2015, 3, 115–119. (In Chinese) [Google Scholar]
  65. Xu, Y. Generalized synthetic control method: Causal inference with interactive fixed effects models. Polit. Anal. 2017, 25, 57–76. [Google Scholar] [CrossRef]
  66. Wang, J.; Ran, M.; Li, Y.; Zhan, H. Is venture capital a catalyst for innovative entrepreneurship in China? Empirical analysis based on the PSM-DID method. Manag. Decis. Econ. 2022, 43, 1039–1058. [Google Scholar] [CrossRef]
  67. Kovács, P.; Petres, T.; Tóth, L. A new measure of multicollinearity in linear regression models. Int. Stat. Rev. 2005, 73, 405–412. [Google Scholar] [CrossRef]
  68. Hausman, J.A. Specification tests in econometrics. Econome. J. Econ. Soc. 1978, 46, 1251–1271. [Google Scholar] [CrossRef]
  69. Lu, X.; Zhang, S.; Xing, J.; Wang, Y.; Chen, W.; Ding, D.; Wu, Y.; Wang, S.; Duan, L.; Hao, J. Progress of air pollution control in China and its challenges and opportunities in the ecological civilization era. Engineering 2020, 6, 1423–1431. [Google Scholar] [CrossRef]
  70. Mehdipanah, R.; Marra, G.; Melis, G.; Gelormino, E. Urban renewal, gentrification and health equity: A realist perspective. Eur. J. Public Health 2018, 28, 243–248. [Google Scholar] [CrossRef]
  71. Anelli, D.; Morano, P.; Tajani, F.; Sabatelli, E. Impacts of Urban Decay on the Residential Property Market: An Application to the City of Rome (Italy). In Proceedings of the International Conference on Computational Science and Its Applications, Hanoi, Vietnam, 1–4 July 2024; pp. 36–48. [Google Scholar]
  72. Maculan, L.S.; Dal Moro, L. Strategies for inclusive urban renewal. In Sustainable Cities and Communities; Springer: Berlin/Heidelberg, Germany, 2020; pp. 662–672. [Google Scholar]
Figure 1. Conceptual model of the impact of urban renewal on urban disease.
Sustainability 17 05214 g001
Figure 2. CBER pilot cities and their locations.
Sustainability 17 05214 g002
Figure 3. Optimized PSM method.
Sustainability 17 05214 g003
Figure 4. Spatiotemporal variation of UD during 2012–2022.
Sustainability 17 05214 g004
Figure 5. Test for model assumptions.
Sustainability 17 05214 g005
Figure 6. Distributions of propensity scores for treatment and control groups.
Sustainability 17 05214 g006
Figure 7. Results of parallel trend assumption test.
Sustainability 17 05214 g007
Figure 8. Results of placebo test.
Sustainability 17 05214 g008
Figure 9. Results of intra-region matching.
Sustainability 17 05214 g009
Figure 10. Results of stratified regressions.
Sustainability 17 05214 g010
Table 1. Summary statistics.
VariablesStd. Dev.MeanMinMaxCount
PC0.6438.8190.989103135
RS0.6064.2451.6868.6193135
AP0.5101.4810.3407.2653135
lnGC1.05413.99910.10118.3583135
lnTA1.4384.8811.7729.4093135
lnHR1.32910.6364.18714.2143135
lnOP3.2449.0535.72633.5043135
lnED0.55211.0288.32715.6753135
lnEC0.9666.3821.53516.3233135
Notes: The processed data are shown in this table.
Table 2. Weighting values of indicators.
VariablesSpecific IndicatorsWeighting Values
PCPer capita residential land area0.897
Per capita urban road surface area0.103
RSPer capita electricity consumption0.033
The number of doctors per thousand individuals0.092
The student-to-teacher ratio in secondary education0.158
The student-to-teacher ratio in primary education0.717
APPM2.5 concentrations0.306
Sulfur dioxide emissions0.167
Particulate matter emissions0.527
Notes: Stata 16 was used for data processing.
Table 3. Balance test for matching.
Year 2012 2013 2014 2015 2016
VariablesStatusBias (%)RPBias (%)RPBias (%)RPBias (%)RPBias (%)RP
lnGCUnmatching56.897.161.390.658.099.161.193.862.795.4
Matching1.65.80.53.82.9
lnTAUnmatching56.997.560.187.463.998.661.698.561.792.4
Matching1.47.6−0.90.94.7
lnHRUnmatching77.193.676.990.678.392.477.593.673.592.1
Matching−5.0−7.2−5.9−5.0−5.8
lnOPUnmatching11.220.817.246.325.762.029.971.432.574.7
Matching−8.9−9.3−9.8−8.5−8.2
lnEDUnmatching57.772.565.485.262.078.868.488.749.196.2
Matching15.99.713.17.7−1.9
lnECUnmatching31.623.826.916.021.62.025.823.222.410.5
Matching24.122.621.219.820.0
Notes: RP is Reduction Percentage of bias after matching (%). Stata was used for data processing.
Table 4. Multicollinearity test for control variables.
VariablesVIF1/VIF
lnGC3.740.2675
lnTA2.430.4122
lnHR2.570.3898
lnOP1.610.6211
lnED2.000.5005
lnEC1.150.8668
TREAT×TIME1.120.8923
Mean VIF2.09
Notes: Stata was used for data processing.
Table 5. Impact of the CBER pilot scheme on urban disease.
Dependent VariableUD
(1)(2)(3)(4)
CBER pilot scheme−0.207 ***
(0.020)
−0.253 ***
(0.017)
−0.045 **
(0.020)
−0.041 **
(0.020)
Constant4.914 ***
(0.011)
4.927 ***
(0.007)
4.999 ***
(0.017)
3.715 ***
(0.533)
City fixed effectsNoYesYesYes
Time fixed effectsNoNoYesYes
Control variablesNoNoNoYes
R20.08310.18390.40250.4165
Hausman test 16.51 ***22.15 ***21.49 ***
Notes: ** and *** represent significance at 5% and 1% levels, respectively. Standard errors are in parentheses. R2 is the adj-R2 for Column (1) and the within-R2 for Columns (2), (3) and (4). Stata was used for data processing.
Table 6. Impact of the CBER pilot scheme on PC, RS and AP.
Dependent VariablePCRSAP
(1)(2)(3)
CBER pilot scheme−0.057 *
(0.032)
−0.065 **
(0.034)
−0.010
(0.019)
Constant6.835 ***
(0.491)
5.949 ***
(0.523)
0.951 ***
(0.298)
City fixed effectsYesYesYes
Time fixed effectsYesYesYes
Control variablesYesYesYes
R20.05930.03440.6886
Notes: *, ** and *** represent significance at 10%, 5% and 1% levels, respectively. Standard errors are in parentheses. R2 is the within-R2. Stata was used for data processing.
Table 7. Robustness checks: effects of year dummy variables on urban disease.
Dependent VariableUD
(1)(2)(3)(4)
CBER pilot scheme−0.043
(0.035)
−0.011
(0.023)
−0.045
(0.023)
−0.018
(0.035)
Constant3.730 ***
(0.534)
3.717 ***
(0.534)
3.693 ***
(0.533)
3.708 ***
(0.534)
City fixed effectsYesYesYesYes
Time fixed effectsYesYesYesYes
Control variablesYesYesYesYes
R20.41510.41430.41650.4144
Notes: *** represents significance at 1% level. Standard errors are in parentheses. R2 is the within-R2. Stata was used for data processing.
Table 8. Robustness checks: samples excluding and other policy effects.
Dependent VariableUD
(1)(2)(3)
CBER pilot scheme−0.042 *
(0.022)
−0.039 *
(0.020)
−0.039 *
(0.021)
RARQ scheme
−0.024
(0.031)
Constant4.126 ***
(0.612)
3.772 ***
(0.538)
3.712 ***
(0.533)
City fixed effectsYesYesYes
Time fixed effectsYesYesYes
Control variablesYesYesYes
R20.34490.41690.4146
Notes: * and *** represent significance at 10% and 1% levels, respectively. Standard errors are in parentheses. R2 is the within-R2. Stata was used for data processing.
Table 9. Robustness checks: policy effects varying with years.
Dependent VariableUD
(1)(2)(3)(4)
CBER pilot scheme−0.060 **
(0.028)
−0.049 **
(0.024)
−0.055 **
(0.023)
−0.037 *
(0.022)
Constant4.144 ***
(0.886)
4.456 ***
(0.731)
3.647 ***
(0.705)
3.660 ***
(0.618)
City fixed effectsYesYesYesYes
Time fixed effectsYesYesYesYes
Control variablesYesYesYesYes
R20.12440.29550.36200.4063
Notes: *, ** and *** represent significance at 10%, 5% and 1% levels, respectively. Standard errors are in parentheses. R2 is the within-R2. Stata was used for data processing.
Table 10. Heterogeneity test: scheme effects in different regions.
Dependent VariableUD
(1)(2)(3)
CBER pilot scheme−0.026 *
(0.025)
−0.156 ***
(0.035)
0.112
(0.041)
Constant5.006 ***
(0.768)
3.137 ***
(0.905)
4.304 ***
(0.853)
City fixed effectsYesYesYes
Time fixed effectsYesYesYes
Control variablesYesYesYes
R20.59800.50620.4386
Notes: * and *** represent significance at 10% and 1% levels, respectively. Standard errors are in parentheses. R2 is the within-R2. Stata was used for data processing.
Table 11. Influence path analysis.
Dependent VariableIndust.
Struc.
UDInfras.
Dev.
UDConsu.
Upg.
UD
(1)(2)(3)(4)(5)(6)
CBER pilot scheme0.048 *
(0.029)
−0.045 ***
(0.017)
0.037 *
(0.028)
−0.046 ***
(0.017)
0.013 *
(0.009)
−0.044 ***
(0.017)
Indust. Struc.
−0.021 **
(0.011)
Infras. Dev. −0.049 ***
(0.022)
Consu. Upg. −0.032 ***
(0.011)
Constant3.847 ***
(0.453)
4.660 ***
(0.263)
1.926 ***
(0.438)
4.675 ***
(0.260)
6.846 ***
(0.449)
4.798 ***
(0.270)
City fixed effectsYesYesYesYesYesYes
Time fixed effectsYesYesYesYesYesYes
Control variablesYesYesYesYesYesYes
R20.41940.34740.24560.35120.34330.3485
Notes: *, ** and *** represent significance at 10%, 5% and 1% levels, respectively. Standard errors are in parentheses. R2 is the within-R2. Stata was used for data processing.
Disclaimer/Publisher’s Note: The statements, opinions and data contained in all publications are solely those of the individual author(s) and contributor(s) and not of MDPI and/or the editor(s). MDPI and/or the editor(s) disclaim responsibility for any injury to people or property resulting from any ideas, methods, instructions or products referred to in the content.

