
Weather Index Insurance and Input Intensification: Evidence from Smallholder Farmers in Kenya


Abstract
1. Background
2. Weather Index Insurance in Kenya
3. Methodology
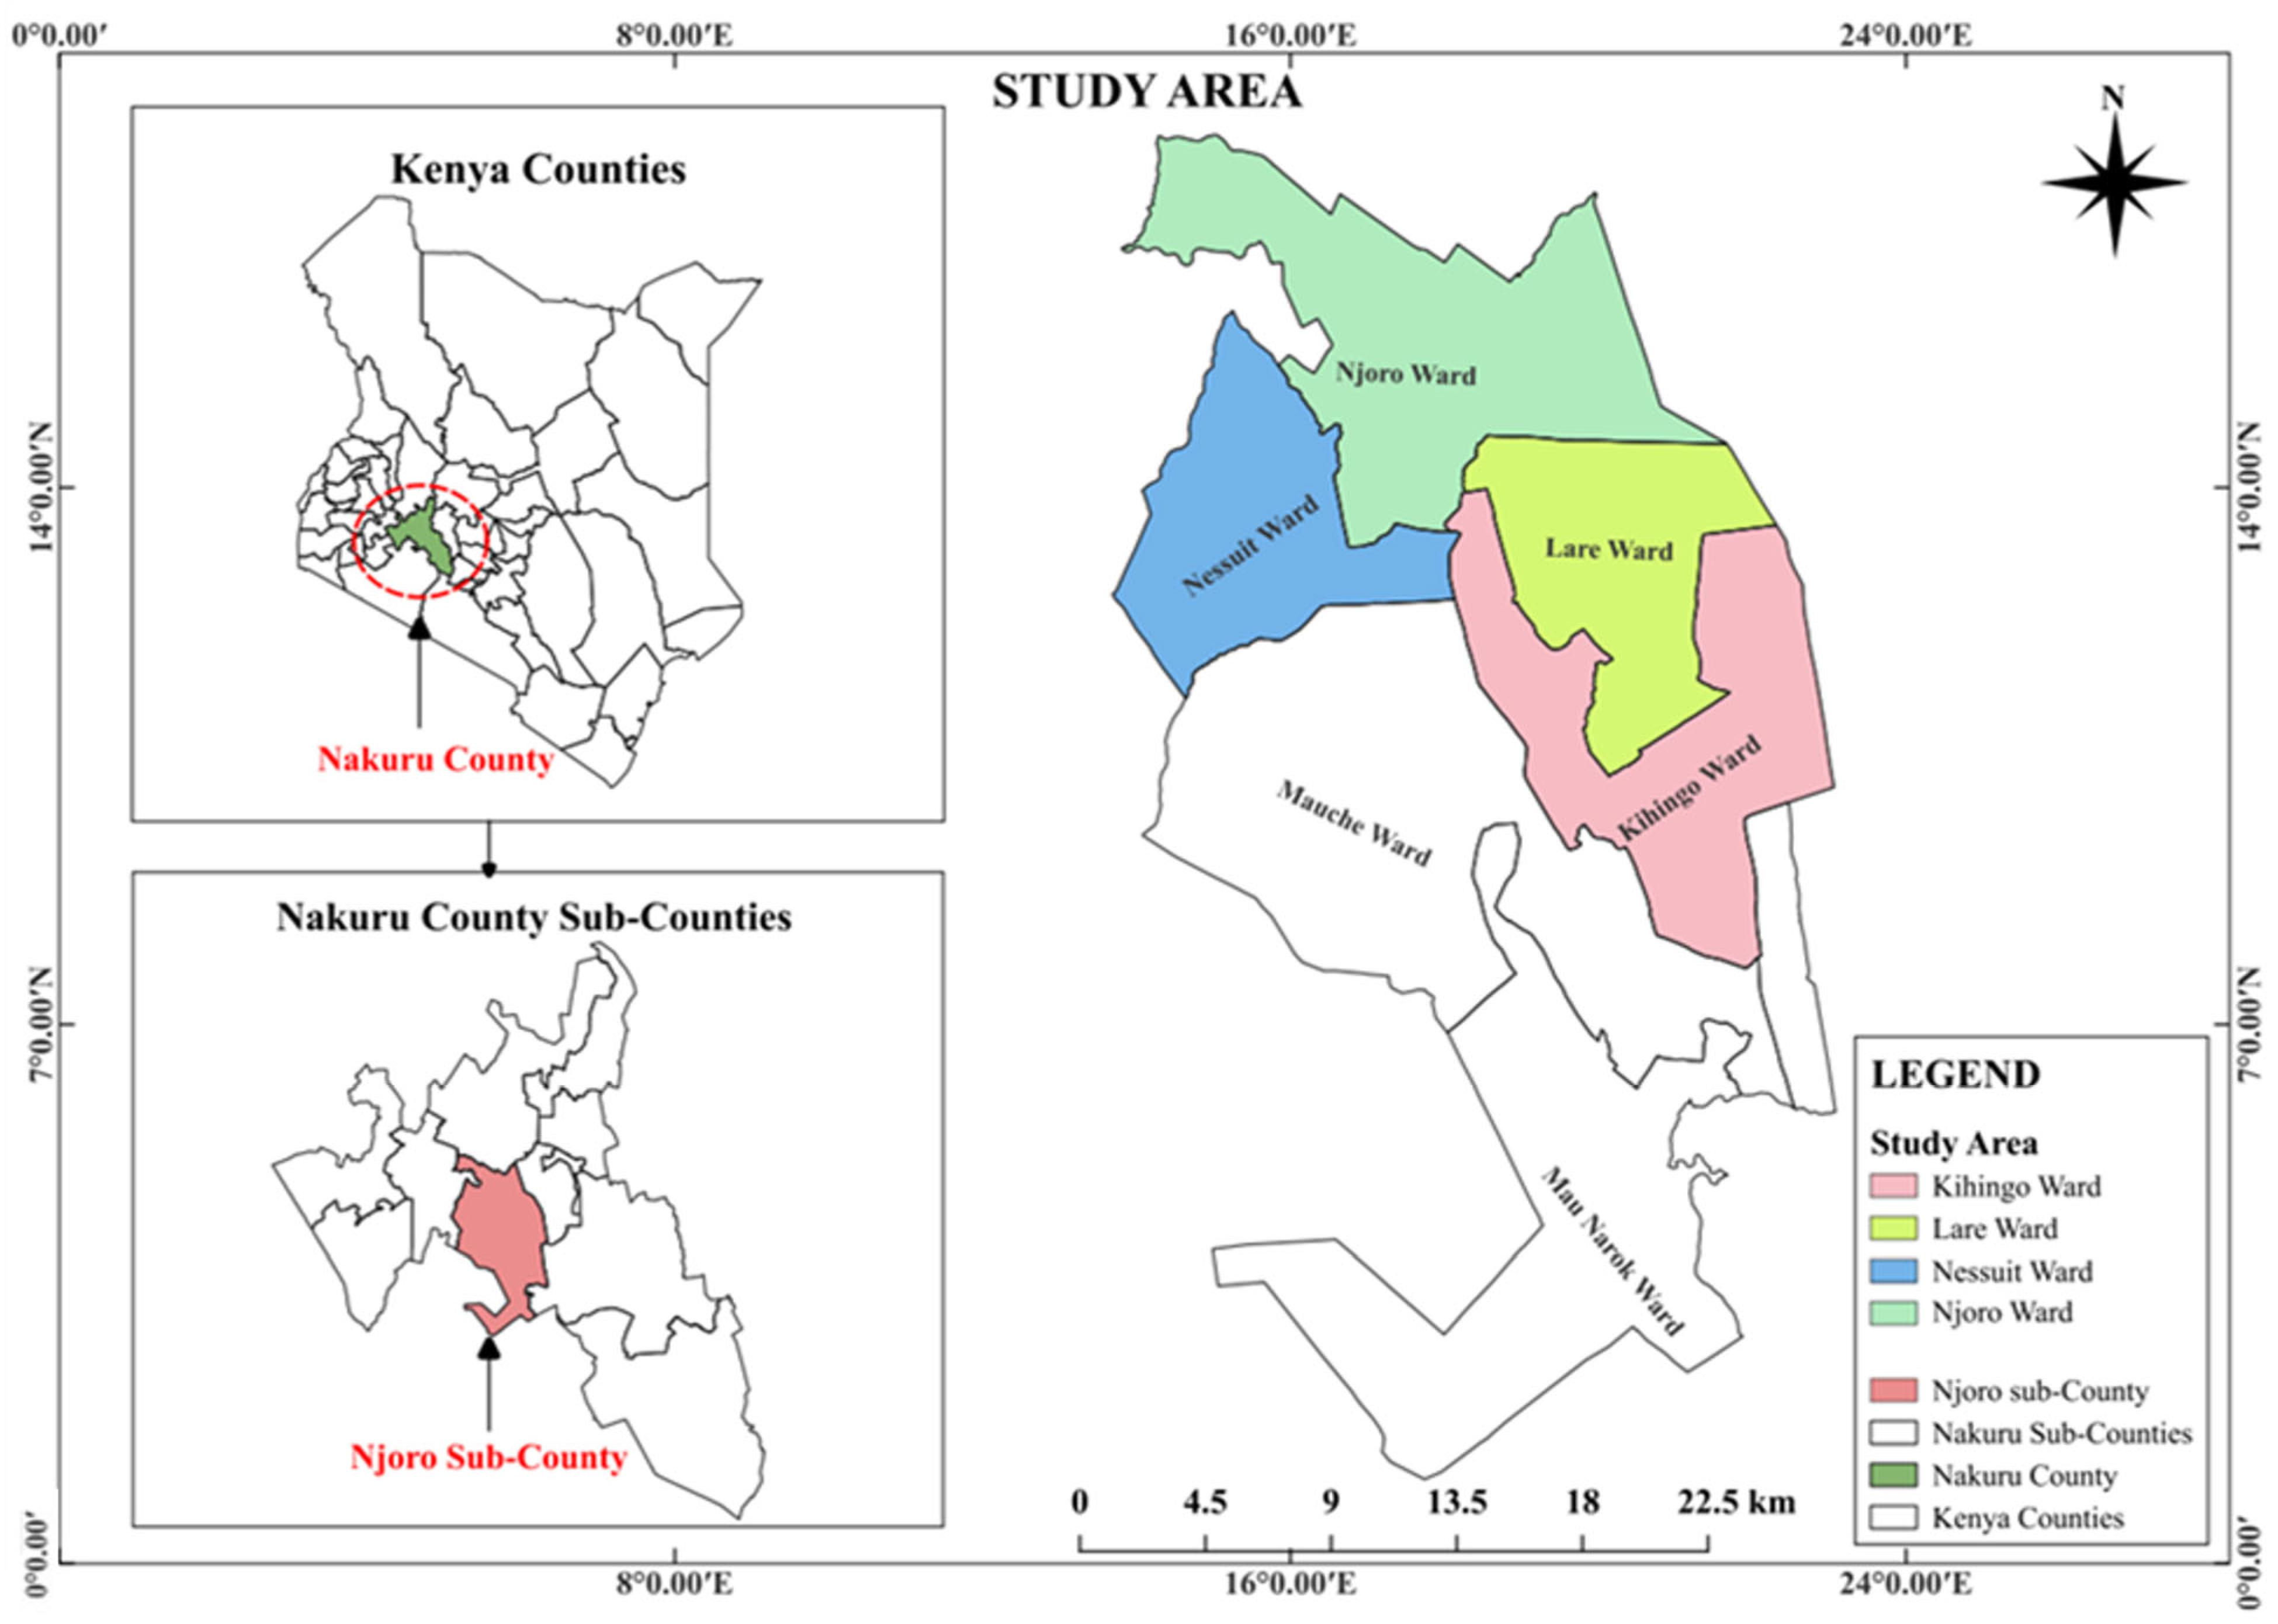
3.1. Study Area
3.2. Sample Size Determination
- Z = 1.96 (95% confidence level);
- p = 0.5 (conservative estimate when population proportion is unknown);
- ε = 0.05 (5% margin of error).
3.3. Sampling Procedure
3.4. Data Collection and Management
3.5. Empirical Framework
- First-stage regression (endogenous variable equation)
- Second-stage regression (outcome equation)
4. Results and Discussion
4.1. Weather Index Insurance and Adoption of Agricultural Inputs
4.1.1. Descriptive Statistics of Insured and Non-Insured Smallholder Farmers
4.1.2. Descriptive Statistics of General Input Use Patterns Among Insured and Non-Insured Farmers
4.1.3. Descriptive Statistics of Input Use Patterns for Active Users Among Insured and Non-Insured Farmers
4.1.4. The Effectiveness of Weather Index Insurance in Promoting Input Adoption
4.1.5. Effect of Weather Index Insurance on Agricultural Input Quantities for Active Users
5. Conclusions and Policy Recommendations
Author Contributions
Funding
Institutional Review Board Statement
Informed Consent Statement
Data Availability Statement
Conflicts of Interest
References
- FAO. The Impact of Disasters on Agriculture and Food Security: Avoiding and Reducing Losses Through Investment in Resilience; FAO: Rome, Italy, 2023. [Google Scholar]
- World Bank. Climate Shocks and Agriculture: A Review of Losses and Adaptation in Sub-Saharan Africa; World Bank: Washington, DC, USA, 2023. [Google Scholar]
- IPCC. Climate Change 2023: Synthesis Report. In Contribution of Working Groups I, II, and III to the Sixth Assessment Report (AR6); IPCC: Geneva, Switzerland, 2023. [Google Scholar]
- Kenya National Bureau of Statistics, Economic Survey 2022; Kenya National Bureau of Statistics: Nairobi, Kenya, 2022.
- World Bank. Kenya Secures $250 Million to Help 500,000 Smallholder Farmers Enhance Value Addition and Access Markets; World Bank: Washington, DC, USA, 2022. [Google Scholar]
- Government of Kenya. National Climate Risk Assessment Report 2023: Impacts on Agriculture and Food Security; Government of Kenya: Nairobi, Kenya, 2023.
- Pingali, P.; Sunder, N. Transitioning Toward Nutrition-Sensitive Food Systems in Developing Countries. Annu. Rev. Resour. Econ. 2017, 9, 439–459. [Google Scholar] [CrossRef]
- Sheahan, M.; Black, R.; Jayne, T. Are Kenyan farmers under-utilizing fertilizer? Implications for input intensification strategies and research. Food Policy 2013, 41, 39–52. [Google Scholar] [CrossRef]
- Schröder, D.; Freedman, G.G. Decision making under uncertainty: The relation between economic preferences and psychological personality traits. Theory Decis. 2020, 89, 61–83. [Google Scholar] [CrossRef]
- Janzen, S.A.; Carter, M.R. After the Drought: The Impact of Microinsurance on Consumption Smoothing and Asset Protection. Am. J. Agric. Econ. 2019, 101, 651–671. [Google Scholar] [CrossRef]
- Meza, I.; Rezaei, E.E.; Siebert, S.; Ghazaryan, G.; Nouri, H.; Dubovyk, O.; Gerdener, H.; Herbert, C.; Kusche, J.; Popat, E.; et al. Drought risk for agricultural systems in South Africa: Drivers, spatial patterns, and implications for drought risk management. Sci. Total Environ. 2021, 799, 149505. [Google Scholar] [CrossRef] [PubMed]
- Powell, D.; Goldman, D. Disentangling moral hazard and adverse selection in private health insurance. J. Econ. 2021, 222, 141–160. [Google Scholar] [CrossRef]
- Kuhn, S.; Hazell, P.; Hess, U. Innovations and Emerging Trends in Agricultural Insurance. 2016. Available online: https://www.researchgate.net/profile/Peter-Hazell/publication/283089244_Innovations_and_emerging_Trends_in_Agricultural_Insurance/links/567ebcdd08ae051f9ae657d2/Innovations-and-emerging-Trends-in-Agricultural-Insurance.pdf (accessed on 10 February 2025).
- Central Bank of Kenya. Report on the Agriculture Sector Survey—September 2023; Central Bank of Kenya: Nairobi, Kenya, 2023.
- World Bank. Weather index insurance for agriculture: Guidance for development practitioners. In Agriculture and Rural Development Discussion Paper 50; World Bank: Washington, DC, USA, 2011. [Google Scholar]
- Benso, M.R.; Gesualdo, G.C.; Silva, R.F.; Silva, G.J.; Rápalo, L.M.C.; Navarro, F.A.R.; Marques, P.A.A.; Marengo, J.A.; Mendiondo, E.M. Review article: Design and evaluation of weather index insurance for multi-hazard resilience and food insecurity. Nat. Hazards Earth Syst. Sci. 2023, 23, 1335–1354. [Google Scholar] [CrossRef]
- Sun, Y. Enhanced Weather-Based Index Insurance Design for Hedging Crop Yield Risk. Front. Plant Sci. 2022, 13, 895183. [Google Scholar] [CrossRef]
- Isaboke, H.; Qiao, Z.; Nyarindo, W. The effect of weather index based micro-insurance on food security status of smallholders. Agric. Resour. Econ. Int. Sci. E-Journal 2016, 2, 5–21. [Google Scholar] [CrossRef]
- Belissa, T.K. Effects of weather index insurance adoption on household food consumption and investment in agricultural inputs in Ethiopia. J. Agric. Food Res. 2024, 16, 101043. [Google Scholar] [CrossRef]
- Mobarak, A.M.; Rosenzweig, M.R. Informal Risk Sharing, Index Insurance, and Risk Taking in Developing Countries. Am. Econ. Rev. 2013, 103, 375–380. [Google Scholar] [CrossRef]
- Castaing, P.; Gazeaud, J. Do Index Insurance Programs Live up to their Promises? Aggregating Evid. Mult. Exp. 2022, 175. [Google Scholar] [CrossRef]
- Aizaki, H.; Furuya, J.; Sakurai, T.; Mar, S.S. Measuring farmers’ preferences for weather index insurance in the Ayeyarwady Delta, Myanmar: A discrete choice experiment approach. Paddy Water Environ. 2021, 19, 307–317. [Google Scholar] [CrossRef]
- Tang, Y.; Cai, H.; Liu, R. Farmers’ Demand for Informal Risk Management Strategy and Weather Index Insurance: Evidence from China. Int. J. Disaster Risk Sci. 2021, 12, 281–297. [Google Scholar] [CrossRef]
- Sibiko, K.W.; Qaim, M. Weather index insurance, agricultural input use, and crop productivity in Kenya. Food Secur. 2020, 12, 151–167. [Google Scholar] [CrossRef]
- Dalhaus, T.; Musshoff, O.; Finger, R. Phenology Information Contributes to Reduce Temporal Basis Risk in Agricultural Weather Index Insurance. Sci. Rep. 2018, 8, 46. [Google Scholar] [CrossRef]
- International Finance Corporation. Agriculture and Climate Risk Enterprise (ACRE)—Kilimo Salama—Kenya, Rwanda, Tanzania; International Finance Corporation: Washington, DC, USA, 2015. [Google Scholar]
- Seuret, E. Kilimo Salama: Micro Crop Insurance Through Mobile. 2010. Available online: http://kilimosalama.wordpress.com/ (accessed on 12 February 2025).
- Kenya Meteorological Department (KMD). State of Kenya’s Climate 2023; Kenya Meteorological Department (KMD): Nairobi, Kenya, 2023.
- Government of Kenya; Government of Kenya (GoK). Agriculture Sector Transformation and Growth Strategy (ASTS) 2019–2029; Ministry of Agriculture, Livestock, Fisheries, and Cooperatives: Nairobi, Kenya, 2019.
- Government of Kenya. Nakuru County First County Integrated Development Plan (2018–2022): Kenya Vision 2030—Towards a Globally Competitive and Prosperous Nation; Government of Kenya: Nairobi, Kenya, 2022.
- Sande, J.B.; Ghosh, M. Endogeneity in survey research. Int. J. Res. Mark. 2018, 35, 185–204. [Google Scholar] [CrossRef]
- Bastardoz, N.; Matthews, M.J.; Sajons, G.B.; Ransom, T.; Kelemen, T.K.; Matthews, S.H. Instrumental variables estimation: Assumptions, pitfalls, and guidelines. Leadersh. Q. 2023, 34, 101673. [Google Scholar] [CrossRef]
- Jensen, N.D.; Mude, A.G.; Barrett, C.B. How basis risk and spatiotemporal adverse selection influence demand for index insurance: Evidence from northern Kenya. Food Policy 2018, 74, 172–198. [Google Scholar] [CrossRef]
- Fonta, W.M.; Sanfo, S.; Kedir, A.M.; Thiam, D.R. Estimating farmers’ willingness to pay for weather index-based crop insurance uptake in West Africa: Insight from a pilot initiative in Southwestern Burkina Faso. Agric. Food Econ. 2018, 6, 11. [Google Scholar] [CrossRef]
- Taherdoost, H. A review of technology acceptance and adoption models and theories. Procedia Manuf. 2018, 22, 960–967. [Google Scholar] [CrossRef]
- World Bank. Financial Inclusion Overview; World Bank: Washington, DC, USA, 2025. [Google Scholar]
- IFA. The Hidden Risks of Being Poor: The Poverty Premium in Insurance; IFA: Tokyo, Japan, 2021. [Google Scholar]
- Maccheroni, F.; Marinacci, M.; Wang, R.; Wu, Q. Risk Aversion and Insurance Propensity. Am. Econ. Rev. 2025, 115, 1597–1649. [Google Scholar] [CrossRef]
- Cacho, O.J.; Moss, J.; Thornton, P.K.; Herrero, M.; Henderson, B.; Bodirsky, B.L.; Humpenöder, F.; Popp, A.; Lipper, L. The value of climate-resilient seeds for smallholder adaptation in sub-Saharan Africa. Clim. Change 2020, 162, 1213–1229. [Google Scholar] [CrossRef]
- Shiva, V. The Seed Emergency: The Threat to Food and Democracy. 2015. Available online: https://www.aljazeera.com/opinions/2012/2/6/the-seed-emergency-the-threat-to-food-and-democracy/ (accessed on 10 March 2025).
- Karlan, D.; Osei, R.; Osei-Akoto, I.; Udry, C. Agricultural Decisions after Relaxing Credit and Risk Constraints *. Q. J. Econ. 2014, 129, 597–652. [Google Scholar] [CrossRef]
- Government of Kenya. Kenya Cereal Enhancement Programme (KCEP): Climate Resilient Agricultural Livelihoods Annual Report 2020–2021; Government of Kenya: Nairobi, Kenya, 2021.
- Njora, B.; Yılmaz, H. Analysis of The Impact of Agricultural Policies on Food Security in Kenya. Eurasian J. Agric. Res. 2021, 5, 66–83. [Google Scholar]
- Carter, M.R.; Cheng, L.; Sarris, A. Where and how index insurance can boost the adoption of improved agricultural technologies. J. Dev. Econ. 2016, 118, 59–71. [Google Scholar] [CrossRef]
- Emerick, K.; De Janvry, A.; Sadoulet, E.; Dar, M.H. Technological Innovations, Downside Risk, and the Modernization of Agriculture. Am. Econ. Rev. 2016, 106, 1537–1561. [Google Scholar] [CrossRef]
- Kenya Markets Trust. Scratch-Off Labels for Seed: KMT Agri-Inputs Case Study; Kenya Markets Trust: Nairobi, Kenya, 2012. [Google Scholar]
- Feliciano, D. A review on the contribution of crop diversification to Sustainable Development Goal 1 “No poverty” in different world regions. Sustain. Dev. 2019, 27, 795–808. [Google Scholar] [CrossRef]
- Agarwal, B. Gender and Land Rights Revisited: Exploring New Prospects via the State, Family and Market. J. Agrar. Change 2003, 3, 184–224. [Google Scholar] [CrossRef]
- Wossen, T.; Berger, T.; Di Falco, S. Social capital, risk preference and adoption of improved farm land management practices in Ethiopia. Agric. Econ. 2015, 46, 81–97. [Google Scholar] [CrossRef]
- Dercon, S.; Christiaensen, L. Consumption risk, technology adoption and poverty traps: Evidence from Ethiopia. J. Dev. Econ. 2011, 96, 159–173. [Google Scholar] [CrossRef]
- Ficiciyan, A.; Loos, J.; Sievers-Glotzbach, S.; Tscharntke, T. More than Yield: Ecosystem Services of Traditional versus Modern Crop Varieties Revisited. Sustainability 2018, 10, 2834. [Google Scholar] [CrossRef]
- Lei, X.; Yang, D. Cultivating Green Champions: The Role of High-Quality Farmer Training in Sustainable Agriculture. J. Knowl. Econ. 2024, 16, 2016–2046. [Google Scholar] [CrossRef]
- Anderson, C.L.; Reynolds, T.W.; Biscaye, P.; Patwardhan, V.; Schmidt, C. Economic Benefits of Empowering Women in Agriculture: Assumptions and Evidence. J. Dev. Stud. 2020, 57, 193–208. [Google Scholar] [CrossRef]
- Ellis, F. Rural Livelihoods and Diversity in Developing Countries; Oxford University Press: Oxford, UK, 2000. [Google Scholar] [CrossRef]
- Suri, T. Selection and Comparative Advantage in Technology Adoption. Econometrica 2011, 79, 159–209. [Google Scholar] [CrossRef]
- Nandy, A.; Tiwari, C.; Kundu, S. India’s Rural Employment Guarantee Scheme—How does it influence seasonal rural out-migration decisions? J. Policy Model. 2021, 43, 1181–1203. [Google Scholar] [CrossRef]
- McAuliffe, R.E. Minimum Efficient Scale. In Wiley Encyclopedia of Management; Cooper, C.L., McAuliffe, R.E., Eds.; Wiley: Hoboken, NJ, USA, 2015. [Google Scholar] [CrossRef]
- Assunção, J.J.; Braido, L.H.B. Testing Household-Specific Explanations for the Inverse Productivity Relationship. Am. J. Agric. Econ. 2007, 89, 980–990. [Google Scholar] [CrossRef]
- Sadeghpour, A.; Afshar, R.K. Livestock manure: From waste to resource in a circular economy. J. Agric. Food Res. 2024, 17, 101255. [Google Scholar] [CrossRef]
- Shamdasani, Y. Rural road infrastructure & agricultural production: Evidence from India. J. Dev. Econ. 2021, 152, 102686. [Google Scholar] [CrossRef]
- Gao, R.; Duan, Y.; Zhang, J.; Ren, Y.; Li, H.; Liu, X.; Zhao, P.; Jing, Y. Effects of long-term application of organic manure and chemical fertilizer on soil properties and microbial communities in the agro-pastoral ecotone of North China. Front. Environ. Sci. 2022, 10, 993973. [Google Scholar] [CrossRef]
- Marenya, P.P.; Barrett, C.B. Soil quality and fertilizer use rates among smallholder farmers in western Kenya. Agric. Econ. 2009, 40, 561–572. [Google Scholar] [CrossRef]
- Phiri, K.; Nhliziyo, M.; Madzivire, S.I.; Sithole, M.; Nyathi, D. Understanding climate smart agriculture and the resilience of smallholder farmers in Umguza district, Zimbabwe. Cogent Soc. Sci. 2021, 7, 1970425. [Google Scholar] [CrossRef]
- Tofu, D.A.; Woldeamanuel, T.; Haile, F. Smallholder farmers’ vulnerability and adaptation to climate change induced shocks: The case of Northern Ethiopia highlands. J. Agric. Food Res. 2022, 8, 100312. [Google Scholar] [CrossRef]
- IPCC. Climate Change 2022: Impacts, Adaptation, and Vulnerability; IPCC: Geneva, Switzerland, 2022. [Google Scholar]
- Shin, S.; Magnan, N.; Mullally, C.; Janzen, S. Demand for Weather Index Insurance among Smallholder Farmers under Prospect Theory. J. Econ. Behav. Organ. 2022, 202, 82–104. [Google Scholar] [CrossRef]
- Magrini, M.-B.; Béfort, N.; Nieddu, M. Technological lock-in and pathways for crop diversification in the bio-economy. In Agroecosystem Diversity; Academic Press: Cambridge, MA, USA, 2019; pp. 375–388. [Google Scholar]
- Rizzo, G.; Migliore, G.; Schifani, G.; Vecchio, R. Key factors influencing farmers’ adoption of sustainable innovations: A systematic literature review and research agenda. Org. Agric. 2024, 14, 57–84. [Google Scholar] [CrossRef]
- Doss, C.R. Women and Agricultural Productivity: What Does the Evidence Tell Us? Yale University Economic Growth Center Discussion Paper, (1051). 2015. Available online: https://ageconsearch.umn.edu/record/212153?v=pdf (accessed on 10 March 2025).
- Touch, V.; Tan, D.K.; Cook, B.R.; Li Liu, D.; Cross, R.; Tran, T.A.; Utomo, A.; Yous, S.; Grunbuhel, C.; Cowie, A. Smallholder farmers’ challenges and opportunities: Implications for agricultural production, environment and food security. J. Environ. Manag. 2024, 370, 122536. [Google Scholar] [CrossRef]
- Guido, Z.; Zimmer, A.; Lopus, S.; Hannah, C.; Gower, D.; Waldman, K.; Krell, N.; Sheffield, J.; Caylor, K.; Evans, T. Farmer forecasts: Impacts of seasonal rainfall expectations on agricultural decision-making in Sub-Saharan Africa. Clim. Risk Manag. 2020, 30, 100247. [Google Scholar] [CrossRef]

| Variables | Total (n = 400) | Insured (n = 166) | Non-Insured (n = 234) | p-Value | |
|---|---|---|---|---|---|
| Mean (SD) | Mean (SD) | Mean (SD) | |||
| Socio-economic characteristics | |||||
| Age | 49.38 (8.29) | 50.60 (7.65) | 48.52 (8.62) | 0.013 ** | |
| Gender (%) | 69.75 (45.93) | 74.10 (43.81) | 66.67 (47.14) | 0.111 | |
| Schooling (years) | 13.37 (4.20) | 13.81 (4.47) | 13.06 (3.99) | 0.081 * | |
| Household size | 6.07 (2.47) | 6.45 (2.55) | 5.80 (2.37) | 0.009 *** | |
| Log of annual average income (ksh) | 12.78 (0.63) | 13.03 (0.58) | 7.61 (0.62) | 0.000 *** | |
| Participation in lottery games (%) | 34.50 (47.54) | 62.05 (48.53) | 14.96 (35.67) | 0.000 *** | |
| Experienced financial constraints (%) | 95.50 (20.73) | 92.77 (25.90) | 97.44 (15.81) | 0.027 ** | |
| Farm characteristics | |||||
| Maize farming (years) | 14.66 (10.66) | 16.51 (10.16) | 13.35 (10.83) | 0.003 *** | |
| Total land owned (acres) | 1.77 (1.38) | 2.32 (1.59) | 1.38 (1.05) | 0.000 *** | |
| Number of plots | 1.34 (1.22) | 1.41 (0.95) | 1.41 (1.38) | 0.565 | |
| Institutional characteristics | |||||
| Accessed loan (credit) (%) | 39.00 (48.77) | 39.16 (48.81) | 38.89 (48.75) | 0.957 | |
| Farmer group membership (%) | 50.75 (50.00) | 59.04 (49.18) | 44.87 (49.74) | 0.005 *** | |
| Distance to nearest market (km) | 2.61 (0.97) | 2.47 (0.93) | 2.72 (0.99) | 0.010 ** | |
| Distance to financial institution (km) | 2.93 (1.54) | 1.47 (0.54) | 3.97 (1.12) | 0.000 *** | |
| Distance to weather station (km) | 2.86 (1.28) | 1.80 (0.58) | 3.61 (1.11) | 0.000 *** | |
| Weather index insurance training (%) | 23.25 (42.24) | 43.37 (49.56) | 8.97 (2.86) | 0.000 *** | |
| Weather/Weather-shock-related characteristics | |||||
| Experienced weather shocks (%) | 77.75 (41.59) | 50.00 (50.00) | 97.44 (15.81) | 0.000 *** | |
| Access to weather information (%) | 98.75 (11.11) | 99.40 (7.74) | 98.29 (12.96) | 0.326 | |
| Average yield loss to weather shocks | 83.78 (36.86) | 75.51 (43.00) | 87.88 (32.64) | 0.017 *** | |
| Variables | Total | Insured (n = 166) | Non-Insured (n = 234) | p-Value |
|---|---|---|---|---|
| (n = 400) | ||||
| Mean (SD) | Mean (SD) | Mean (SD) | ||
| Used chemical fertilizer (%) | 46.50 (49.94) | 86.75 (34.01) | 17.95 (38.46) | 0.000 *** |
| Chemical fertilizer quantity (kg/acre) | 28.06 (35.80) | 58.98 (33.47) | 6.13 (15.39) | 0.000 *** |
| Used manure (%) | 49.00 (50.05) | 42.77 (49.62) | 53.42 (49.88) | 0.036 ** |
| Manure quantity (kg/acre) | 25.97 (31.92) | 15.21 (19.28) | 33.60 (36.61) | 0.000 *** |
| Used improved maize seeds (%) | 59.50 (49.15) | 89.76 (30.41) | 38.03 (48.65) | 0.000 *** |
| Improved maize seeds (kg/acre) | 6.04 (5.59) | 10.23 (4.24) | 3.07 (4.41) | 0.000 *** |
| Used traditional maize seeds (%) | 69.75 (45.99) | 46.99 (50.06) | 85.90 (34.88) | 0.000 *** |
| Traditional maize seeds (kg/acre) | 5.62 (4.81) | 2.69 (3.46) | 7.69 (4.56) | 0.000 *** |
| Hired labor (%) | 83.00 (37.61) | 95.78 (20.16) | 73.93 (43.99) | 0.000 *** |
| Labor (person-days/acre) | 23.64 (15.37) | 32.36 (13.63) | 17.45 (13.42) | 0.000 *** |
| Average maize yield (bags/acre) | 12.05 (5.56) | 16.44 (5.26) | 8.94 (3.15) | 0.000 *** |
| Cultivated maize (acres) | 1.16 (0.67) | 1.49 (0.67) | 0.92 (0.56) | 0.000 *** |
| Number of maize plots | 1.39 (1.22) | 1.34 (0.95) | 1.41 (1.38) | 0.565 |
| Total | Insured | Not Insured | p-Value | ||||
|---|---|---|---|---|---|---|---|
| No. of Users | Mean Usage | No. of Users | Mean Usage | No. of Users | Mean Usage | ||
| Chemical fertilizer quantity (kg/acre) | 186 | 60.35 | 144 | 67.99 | 42 | 34.14 | 0.000 *** |
| Manure quantity (kg/acre) | 196 | 53.00 | 71 | 35.56 | 125 | 62.90 | 0.000 *** |
| Improved maize seed quantity (kg/acre) | 238 | 10.16 | 149 | 11.40 | 89 | 8.08 | 0.000 *** |
| Traditional maize seed quantity (kg/acre) | 279 | 8.05 | 78 | 5.73 | 201 | 8.95 | 0.000 *** |
| Variables | First-Stage Regression | Second-Stage Regression | ||||||||
|---|---|---|---|---|---|---|---|---|---|---|
| WII Uptake | Chemical Fertilizer | Manure | Improved Maize Seeds | Traditional Maize Seeds | ||||||
| Coefficients (Robust S.E.) | p-Value | Coefficients (Robust S.E.) | p-Value | Coefficients (Robust S.E.) | p-Value | Coefficients (Robust S.E.) | p-Value | Coefficients (Robust S.E.) | p-Value | |
| Distance to the nearest weather station | −3.731 (0.622) | 0.000 *** | - | - | - | - | - | - | - | - |
| Training on insurance products | 2.977 (0.512) | 0.000 *** | - | - | - | - | - | - | - | - |
| WII uptake | - | - | 1.230 (0.366) | 0.001 *** | −0.383 (0.304) | 0.208 | 1.001 (0.327) | 0.002 *** | −1.249 (0.330) | 0.000 *** |
| Age | 0.189 (0.185) | 0.306 | −0.083 (0.098) | 0.401 | 0.041 (0.088) | 0.64 | 0.038 (0.098) | 0.697 | −0.127 (0.093) | 0.171 |
| Age squared | −0.002 (0.002) | 0.267 | 0.001 (0.001) | 0.472 | 0.000 (0.001) | 0.819 | 0.000 (0.001) | 0.720 | 0.001 (0.001) | 0.149 |
| Gender | 0.514 (0.348) | 0.139 * | 0.030 (0.172) | 0.86 | 0.298 (0.148) | 0.044 ** | −0.100 (0.165) | 0.544 | 0.046 (0.171) | 0.787 |
| Schooling | −0.143 (0.048) | 0.003 *** | −0.019 (0.024) | 0.446 | −0.013 (0.019) | 0.494 | −0.004 (0.023) | 0.858 | −0.036 (0.020) | 0.073 * |
| Training on agri-production technology | −0.926 (0.476) | 0.052 * | 0.476 (0.202) | 0.019 ** | 0.006 (0.182) | 0.976 | −0.017 (0.228) | 0.939 | 0.232 (0.200) | 0.246 |
| Total land owned | −0.490 (0.186) | 0.009 *** | 0.288 (0.126) | 0.022 ** | −0.023 (0.097) | 0.816 | 0.176 (0.138) | 0.200 | −0.034 (0.102) | 0.74 |
| Land leased out | −0.756 (0.248) | 0.002 *** | 0.058 (0.120) | 0.63 | 0.074 (0.099) | 0.455 | 0.192 (0.138) | 0.164 | 0.000 (0.100) | 0.996 |
| Wealth | 0.445 (0.153) | 0.004 *** | 0.194 (0.076) | 0.010 *** | −0.056 (0.065) | 0.392 | 0.299 (0.077) | 0.000 *** | −0.189 (0.069) | 0.006 *** |
| Household off-farm labor members | −0.157 (0.074) | 0.034 ** | 0.023 (0.040) | 0.566 | 0.019 (0.035) | 0.589 | 0.086 (0.042) | 0.043 ** | −0.004 (0.039) | 0.927 |
| Household farm labor members | −0.189 (0.192) | 0.325 | −0.088 (0.088) | 0.315 | 0.023 (0.068) | 0.732 | 0.033 (0.080) | 0.681 | 0.054 (0.086) | 0.532 |
| Rear livestock | 1.322 (0.388) | 0.001 *** | 0.004 (0.192) | 0.983 | 0.116 (0.154) | 0.448 | −0.207 (0.185) | 0.263 | 0.073 (0.176) | 0.681 |
| Distance to nearest market (km) | −0.863 (0.245) | 0.000 *** | −0.077 (0.103) | 0.453 | −0.020 (0.085) | 0.813 | −0.118 (0.095) | 0.211 | −0.059 (0.099) | 0.555 |
| Road condition | −0.497 (0.262) | 0.058 * | 0.299 (0.121) | 0.013 ** | −0.197 (0.108) | 0.068 * | 0.058 (0.124) | 0.637 | −0.166 (0.118) | 0.159 |
| Size of the largest maize plot (acres) | 2.327 (0.608) | 0.000 *** | −0.365 (0.252) | 0.147 | −0.042 (0.197) | 0.831 | −0.223 (0.265) | 0.401 | 0.257 (0.214) | 0.231 |
| Land leased in | 0.470 (0.578) | 0.416 | 0.363 (0.229) | 0.114 | −0.188 (0.217) | 0.386 | −0.025 (0.248) | 0.919 | 0.086 (0.237) | 0.716 |
| Soil fertility | 0.427 (0.361) | 0.237 | −0.342 (0.203) | 0.091 * | 0.129 (0.148) | 0.384 | 0.482 (0.163) | 0.003 *** | −0.155 (0.167) | 0.354 |
| Financial constraints | 0.432 (0.647) | 0.505 | −0.764 (0.411) | 0.063 * | −0.087 (0.333) | 0.794 | −0.376 (0.413) | 0.362 | −0.335 (0.359) | 0.352 |
| Drought in 2022 | −0.557 (0.609) | 0.361 | 0.218 (0.253) | 0.389 | −0.589 (0.220) | 0.008 *** | 0.262 (0.262) | 0.317 | −0.708 (0.286) | 0.013 ** |
| Drought in 2023 | −2.016 (0.595) | 0.001 *** | −1.434 (0.323) | 0.000 *** | 0.153 (0.215) | 0.477 | −1.429 (0.475) | 0.003 *** | 0.082 (0.237) | 0.73 |
| High-yield—weather-sensitive | 0.328 (0.444) | 0.46 | 0.071 (0.180) | 0.694 | −0.307 (0.166) | 0.065 * | 0.125 (0.197) | 0.523 | −0.317 (0.177) | 0.073 * |
| Weather Information | −2.301 (0.987) | 0.020 *** | −0.385 (0.823) | 0.64 | 0.568 (0.537) | 0.29 | −1.443 (0.745) | 0.053 * | 0.252 (0.703) | 0.72 |
| Constant | 10.168 (5.581) | 0.068 * | 3.437 (2.710) | 0.205 | −0.996 (2.266) | 0.66 | 0.447 (2.603) | 0.864 | 6.052 (2.424) | 0.013 ** |
| Wald Chi-squared | 100.21 *** | 130.1 *** | 46.43 *** | 129.51 *** | 98.83 *** | |||||
| Wald test of exogeneity | - | 7.58 *** | 0.77 | 0.29 ** | 0.08 | |||||
| Variables | First Stage | Chemical Fertilizer (kg/acre) | Manure (kg/acre) | Improved Maize Seeds (kg/acre) | Traditional Maize Seeds (kg/acre) | |||||
|---|---|---|---|---|---|---|---|---|---|---|
| Coefficient (Robust S.E.) | p-Value | Coefficient (Robust S.E.) | p-Value | Coefficient (Robust S.E.) | p-Value | Coefficient (Robust S.E.) | p-Value | Coefficient (Robust S.E.) | p-Value | |
| Distance to the nearest weather station | −3.731 (0.622) | 0.000 *** | ||||||||
| Training on insurance products | 2.977 (0.512) | 0.000 *** | ||||||||
| WII uptake | - | 28.767 (5.736) | 0.000 *** | −27.072 (4.350) | 0.000 *** | 2.549 (0.539) | 0.000 *** | −2.851 (0.637) | 0.000 *** | |
| Age | 0.189 (0.185) | 0.306 | 5.511 (2.677) | 0.041 ** | 1.456 (1.998) | 0.467 | 0.455 (0.263) | 0.086 * | −0.063 (0.288) | 0.827 |
| Age squared | −0.002 (0.002) | 0.267 | −0.055 (0.026) | 0.038 ** | −0.015 (0.019) | 0.449 | −0.004 (0.003) | 0.113 | 0.001 (0.003) | 0.823 |
| Gender | 0.514 (0.348) | 0.139 | 8.987 (4.441) | 0.045 ** | 1.276 (4.189) | 0.761 | 0.493 (0.428) | 0.251 | −0.784 (0.450) | 0.082 * |
| Schooling | −0.143 (0.048) | 0.003 *** | −0.393 (0.527) | 0.457 | 0.711 (0.508) | 0.163 | 0.073 (0.051) | 0.154 | 0.020 (0.050) | 0.689 |
| Training on Agri-production technology | −0.926 (0.476) | 0.052 * | −2.060 (4.019) | 0.609 | −1.090 (3.471) | 0.754 | 0.275 (0.398) | 0.49 | 0.357 (0.619) | 0.565 |
| Total land owned | −0.490 (0.186) | 0.009 *** | −0.133 (2.236) | 0.953 | 0.101 (1.949) | 0.959 | 0.280 (0.224) | 0.213 | 0.127 (0.265) | 0.633 |
| Land leased out | −0.756 (0.248) | 0.002 *** | −1.449 (2.435) | 0.553 | 0.373 (2.075) | 0.857 | −0.255 (0.230) | 0.268 | 0.178 (0.348) | 0.609 |
| Wealth | 0.445 (0.153) | 0.004 *** | 0.439 (1.842) | 0.812 | 0.163 (1.722) | 0.925 | 0.215 (0.168) | 0.203 | −0.169 (0.210) | 0.42 |
| Household off-farm labor members | −0.157 (0.074) | 0.034 ** | −0.498 (0.861) | 0.564 | 0.384 (0.642) | 0.55 | 0.063 (0.083) | 0.453 | −0.044 (0.103) | 0.671 |
| Household farm labor members | −0.189 (0.192) | 0.325 | −0.824 (2.018) | 0.684 | −3.581 (1.608) | 0.027 ** | −0.370 (0.177) | 0.037 ** | −0.225 (0.205) | 0.275 |
| Rear livestock | 1.322 (0.388) | 0.001 *** | 0.526 (4.494) | 0.907 | −1.646 (3.939) | 0.677 | 0.249 (0.408) | 0.542 | 0.611 (0.477) | 0.202 |
| Distance to nearest market (km) | −0.863 (0.245) | 0.000 *** | 2.219 (2.381) | 0.353 | 2.602 (1.944) | 0.182 | −0.132 (0.211) | 0.532 | 0.367 (0.245) | 0.134 |
| Road condition | −0.497 (0.262) | 0.058 * | 1.846 (3.394) | 0.587 | 2.872 (2.666) | 0.283 | 0.087 (0.299) | 0.772 | 0.171 (0.315) | 0.588 |
| Size of the largest maize plot (acres) | 2.327 (0.608) | 0.000 *** | 3.519 (3.793) | 0.355 | 1.993 (4.674) | 0.67 | −0.331 (0.444) | 0.457 | 0.431 (0.603) | 0.475 |
| Land leased in | 0.470 (0.578) | 0.416 | 1.469 (6.191) | 0.813 | 0.087 (6.108) | 0.989 | 0.823 (0.608) | 0.178 | 0.000 (0.679) | 0.988 |
| Soil fertility | 0.427 (0.361) | 0.237 | 1.825 (4.136) | 0.66 | −0.814 (3.619) | 0.822 | 0.408 (0.406) | 0.316 | −0.626 (0.426) | 0.143 |
| Financial constraints | 0.432 (0.647) | 0.505 | −16.677 (6.096) | 0.007 *** | 8.180 (4.484) | 0.070 * | 0.510 (0.615) | 0.408 | 0.937 (0.800) | 0.243 |
| Drought 2022 | −0.557 (0.609) | 0.361 | 0.716 (5.511) | 0.897 | 2.831 (3.862) | 0.464 | 0.563 (0.529) | 0.288 | 0.533 (0.629) | 0.397 |
| Drought 2023 | −2.016 (0.595) | 0.001 *** | −1.183 (4.395) | 0.788 | −6.593 (3.859) | 0.089 * | −1.106 (0.447) | 0.014 ** | 0.683 (0.615) | 0.268 |
| High-yield—weather-sensitive | 0.328 (0.444) | 0.46 | 4.256 (4.218) | 0.314 | 4.203 (3.736) | 0.262 | −0.288 (0.412) | 0.485 | −0.471 (0.532) | 0.376 |
| Weather Information | −2.301 (0.987) | 0.020 ** | 10.772 (7.164) | 0.135 | 11.122 (5.673) | 0.052 * | 0.697 (0.939) | 0.459 | 1.154 (1.578) | 0.465 |
| Constant | 10.168 (5.581) | 0.068 * | −108.060 (73.545) | 0.144 | −9.880 (53.265) | 0.853 | −6.560 (6.539) | 0.317 | 6.881 (7.670) | 0.37 |
| Endogeneity test a | χ2 = 0.987 | χ2 = 0.653 | χ2 = 0.819 | χ2 = 0.534 | ||||||
| Heteroscedasticity test b | χ2 = 2.75 * | χ2 = 2.84 * | χ2 = 26.88 *** | χ2 = 7.64 ** | ||||||
Disclaimer/Publisher’s Note: The statements, opinions and data contained in all publications are solely those of the individual author(s) and contributor(s) and not of MDPI and/or the editor(s). MDPI and/or the editor(s) disclaim responsibility for any injury to people or property resulting from any ideas, methods, instructions or products referred to in the content. |
© 2025 by the authors. Licensee MDPI, Basel, Switzerland. This article is an open access article distributed under the terms and conditions of the Creative Commons Attribution (CC BY) license (https://creativecommons.org/licenses/by/4.0/).
Share and Cite
Muleke, P.A.; Ji, Y.; Fu, Y.; Kipkogei, S. Weather Index Insurance and Input Intensification: Evidence from Smallholder Farmers in Kenya. Sustainability 2025, 17, 5206. https://doi.org/10.3390/su17115206
Muleke PA, Ji Y, Fu Y, Kipkogei S. Weather Index Insurance and Input Intensification: Evidence from Smallholder Farmers in Kenya. Sustainability. 2025; 17(11):5206. https://doi.org/10.3390/su17115206
Chicago/Turabian StyleMuleke, Price Amanya, Yueqing Ji, Yongyi Fu, and Shadrack Kipkogei. 2025. "Weather Index Insurance and Input Intensification: Evidence from Smallholder Farmers in Kenya" Sustainability 17, no. 11: 5206. https://doi.org/10.3390/su17115206
APA StyleMuleke, P. A., Ji, Y., Fu, Y., & Kipkogei, S. (2025). Weather Index Insurance and Input Intensification: Evidence from Smallholder Farmers in Kenya. Sustainability, 17(11), 5206. https://doi.org/10.3390/su17115206