Article

Circular Economy as a Driver of Sustainable Growth: Quantitative Analysis of the Role of Recycling and Secondary Raw Materials in the EU

by
Biljana Grujić Vučkovski
1,*,
Nikola V. Ćurčić
2 and
Ileana Georgiana Gheorghe
3
1
Tamiš Research and Development Institute, 26000 Pančevo, Serbia
2
Institute for Multidisciplinary Research, University of Belgrade, 11030 Belgrade, Serbia
3
Business Administration Department, Petroleum-Gas University of Ploiesti, 100680 Ploiesti, Romania
*
Author to whom correspondence should be addressed.
Sustainability 2025, 17(11), 5181; https://doi.org/10.3390/su17115181
Submission received: 30 April 2025 / Revised: 21 May 2025 / Accepted: 26 May 2025 / Published: 4 June 2025

Abstract

:
The aim of this research is to determine the significance of the impact of selected environmental protection indicators, with a focus on waste management, on the sustainability of economic growth in EU countries (21 member states) over the period 2013–2022. To conduct this analysis, four independent variables were selected, belonging to the domains of waste management the (recycling rate of municipal waste and recycling rate of packaging waste by type of packaging) and secondary raw material management (the circular material use rate and trade in recyclable raw materials, imports from outside the EU27). Sustainable economic growth was measured by gross domestic product per capita (GDP per capita), which serves as the dependent variable in this study. The aforementioned independent variables can also be categorized as circular economy (CE) indicators, which have been gaining increasing relevance in the EU context. Using a panel regression analysis, the potential influence of CE indicators on sustainable economic growth was examined both over time and across entities, through the lens of waste management. The statistical analysis was conducted by applying four econometric models: pooled OLS (POLS), fixed effects (FEs), random effects (REs), and mixed effects (MEs). The results of the analysis confirmed several specific hypotheses (depending on the model used), which posit a statistically significant positive impact of CE variables on GDP per capita.

1. Introduction

1.1. Definition and Legal Framework of the CE

The intensified degradation of land, coupled with the uncontrolled exploitation of natural resources, resulting in consequences such as climate disruptions, environmental pollution, the generation of excessive waste, and the contamination of water and air has contributed to the abandonment of the linear economic model and the emergence of a new paradigm known as the circular economy (CE) [1,2,3]. The presence of waste in natural ecosystems has led to the destruction of plant and animal species, raising serious concerns about the continued survival of humankind [4,5].
Since the linear (traditional) economy was based on the depletion of natural resources for the production of goods followed by disposal after use, there arose a need to design a new economic model that would contrast this approach, namely, a non-linear or circular economy. Unlike the linear model, the CE is centered around the revaluation and reuse of resources, with the aim of minimizing the amount of waste that ends up in the natural environment [6,7,8,9,10,11,12]. According to paper [13], one of the defining features of the CE is its “resource use efficiency”, achieved through new consumption models and innovative production approaches. Therefore, if we wish to ensure sustainable economic development in the future, we must shift the current societal model of sustainability [4], by integrating high-tech, efficient production systems [11] and adapting business models accordingly.
At the end of 2015, the European Commission (EC) introduced the EU Action Plan for the CE [14], marking the first official step toward embedding CE principles into all spheres of work and life. In 2018, the EC adopted the European strategy for plastic waste [15], highlighting the importance of recycling plastic packaging. This policy repositions plastic as a raw material, increases the share of recycled plastics in products, and further moves away from the linear mode [7]. That same year, the EU also introduced minimum recycling targets for municipal and packaging waste to be achieved by 2025 and 2030 [16,17]:
  • Recycling rate of municipal waste at least 55% by 2025 and 60% by 2030;
  • Recycling rate of packaging waste at least 65% by 2025 and 70% by 2030.
According to the EC’s 2023 report, ten EU member states are at risk of failing to meet the 2025 targets for municipal and packaging waste recycling [18].
In December 2019, the EC launched the European Green Deal [19], which aims to reduce environmental degradation and promote the broader adoption of CE principles. The Green Deal envisions Europe becoming the world’s first climate-neutral continent by 2050, with a net-zero impact on the environment.

1.2. Current Status of the Analyzed Environmental Protection and CE Indicators

Given that the CE is based on controlling the amount of waste that ends up in the natural environment, Figure 1, Figure 2, Figure 3 and Figure 4 provide an overview of the levels of waste management and secondary raw material indicators in EU member states, along with the trends in GDP per capita across the observed countries.
The first significant indicator of the CE that contributes to environmental protection is the municipal waste recycling rate, as it “represents the share of recycled municipal waste in the total municipal waste production” [20]. The highest average annual recycling rate for municipal waste was recorded by Germany (67.30%), which is above the EU average (46.34%) and the established minimum recycling rates for 2025 and 2030. The lowest average recycling rate for municipal waste was observed in Malta (11.58%).
The next important CE indicator contributing to environmental protection is the circular material use rate, which shows the share of recycled material that is reintroduced into the national economy, thereby replacing raw materials derived from the natural environment to protect the ecosystem and reduce pollution [20]. The highest annual rate during the observed period was recorded in the Netherlands (26.99%), significantly above the EU average (11.3%), followed by Belgium and Italy. The lowest rate was observed in Portugal (2.41%), which is notably below the EU average.
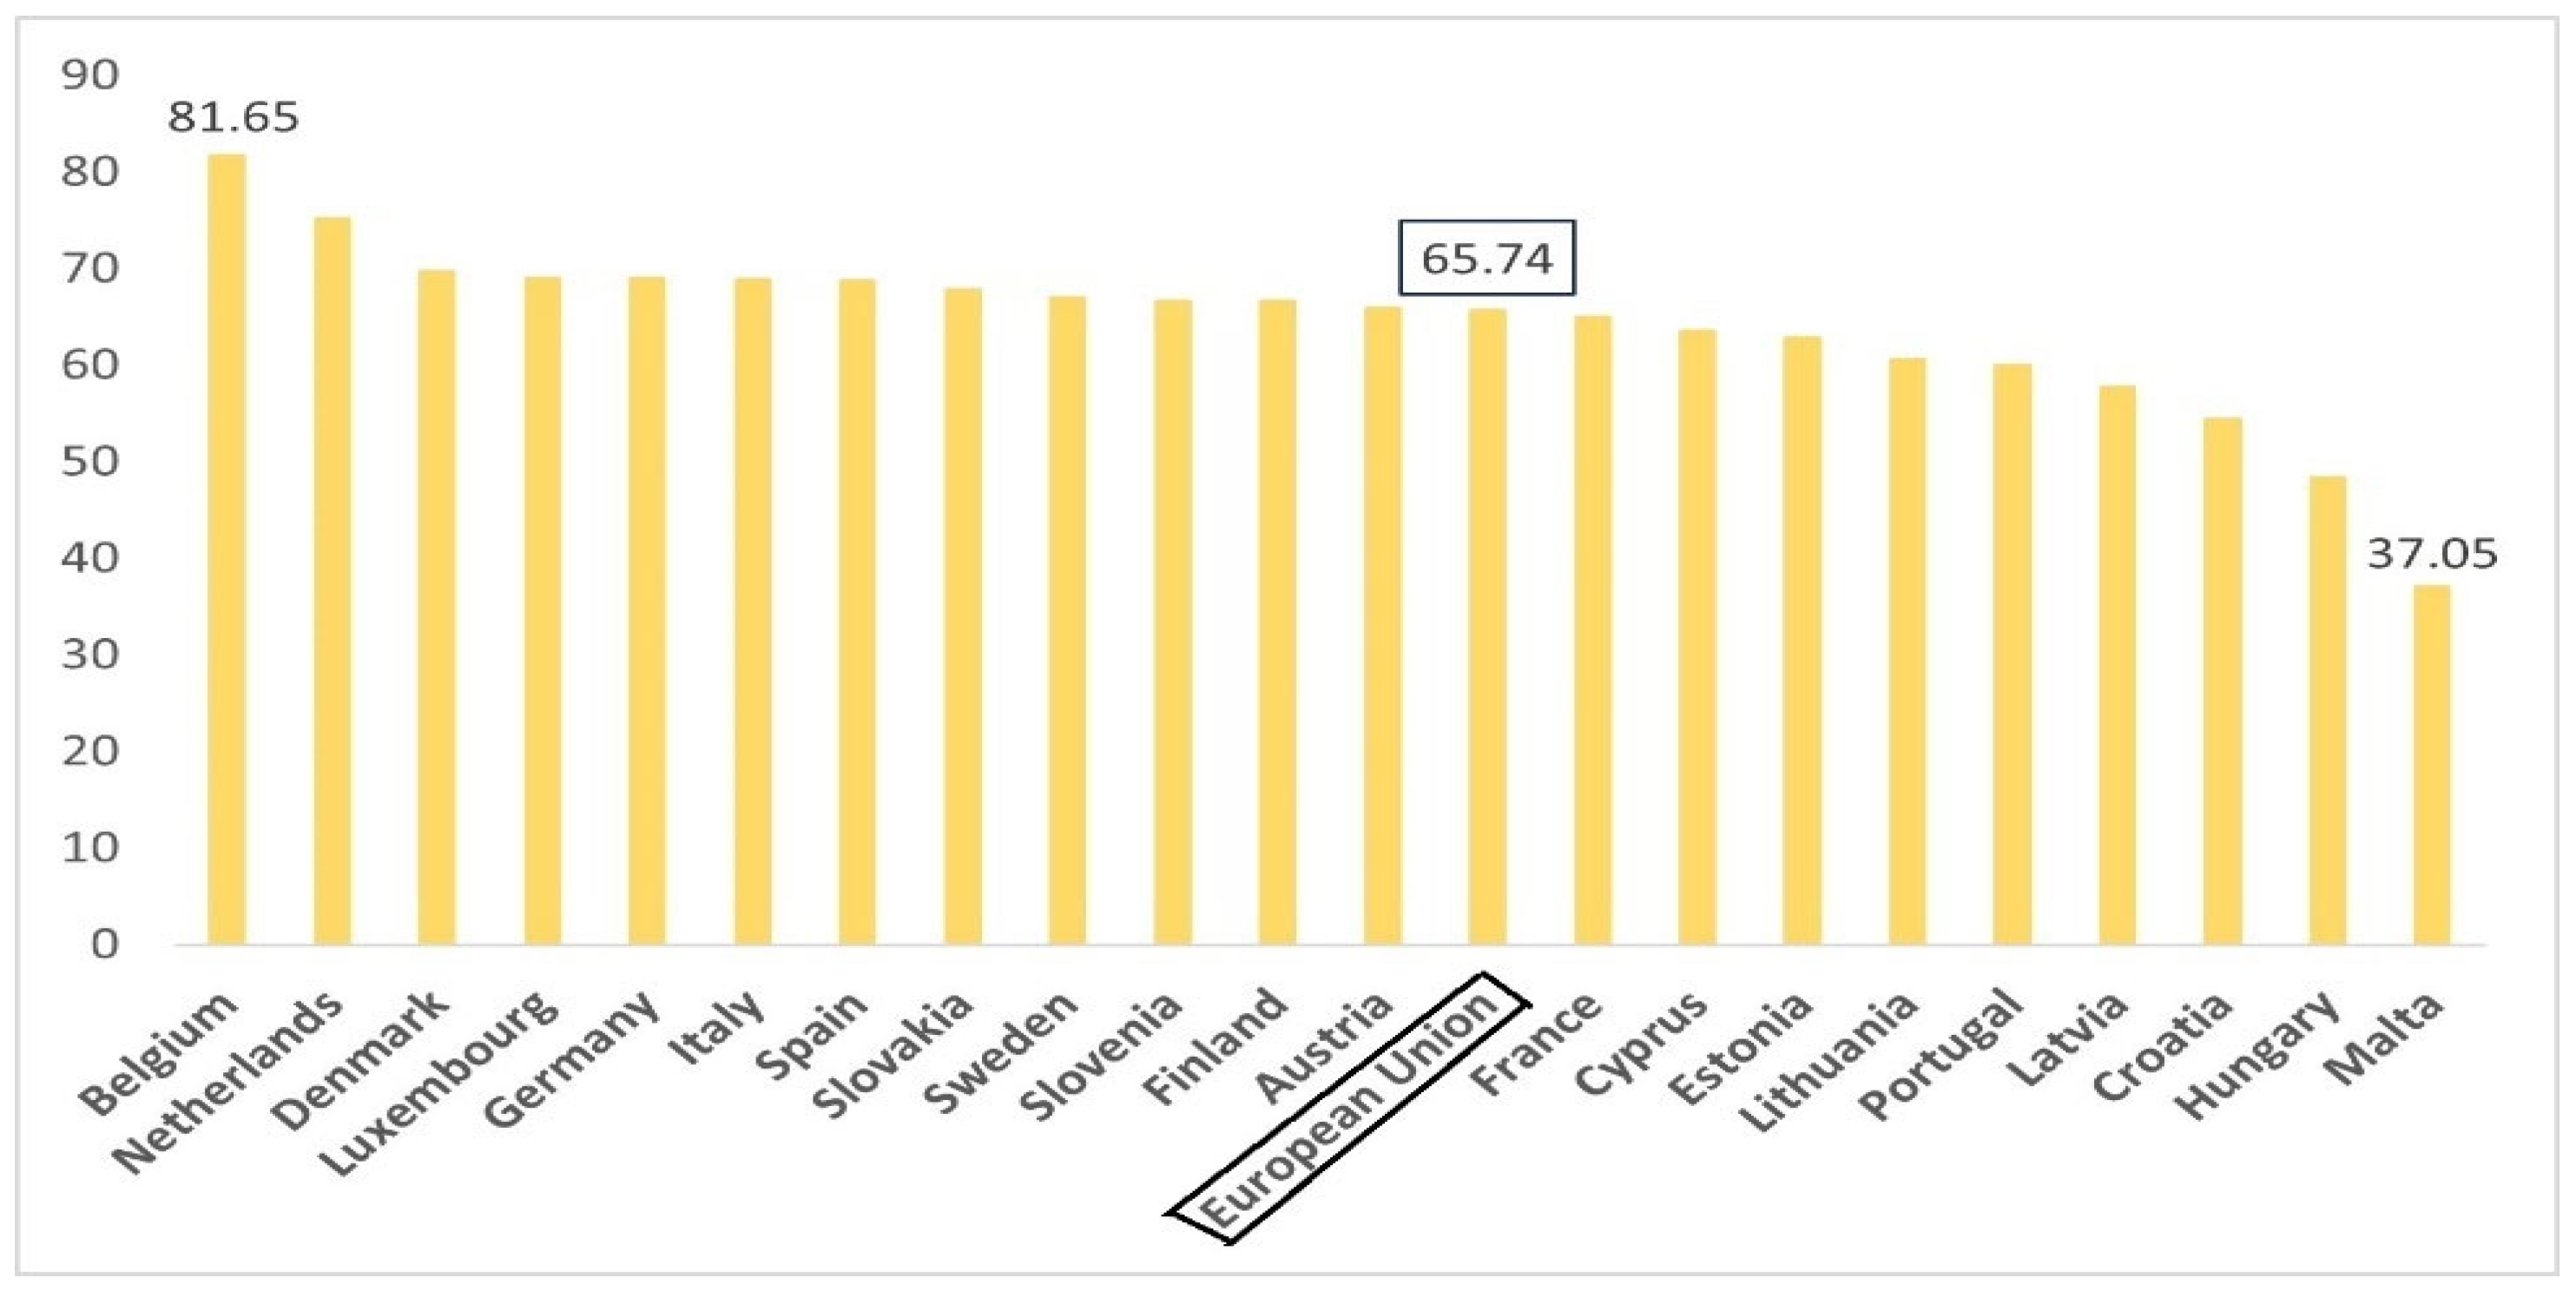
Another important indicator in the study of the impact of CE on the environment is the recycling rate of packaging waste by type of packaging (Figure 2).
The EU member states with the highest average annual recycling rates of packaging waste by type of packaging are Belgium, the Netherlands, and Denmark. These countries achieve an average rate higher than the EU average (65.74%) and the minimum recycling targets for packaging waste by type set by the EC regulation for 2025 and 2030. The lowest recycling rate for packaging waste by type is recorded in Malta.
Figure 3 presents data on the average imports of recyclable raw materials from non-EU countries. This indicator is significant, because it measures the value of recyclable raw materials imported from outside the EU member states.
During the observed period, the highest average annual value of imported recyclable raw materials from non-EU countries was recorded in Germany, followed by Italy and the Netherlands. The total import value of these materials for the EU level was 21,037.2 million euros. The lowest average annual value of this indicator was recorded in Malta, where the highest coefficient of variation (74.05%) was also observed.
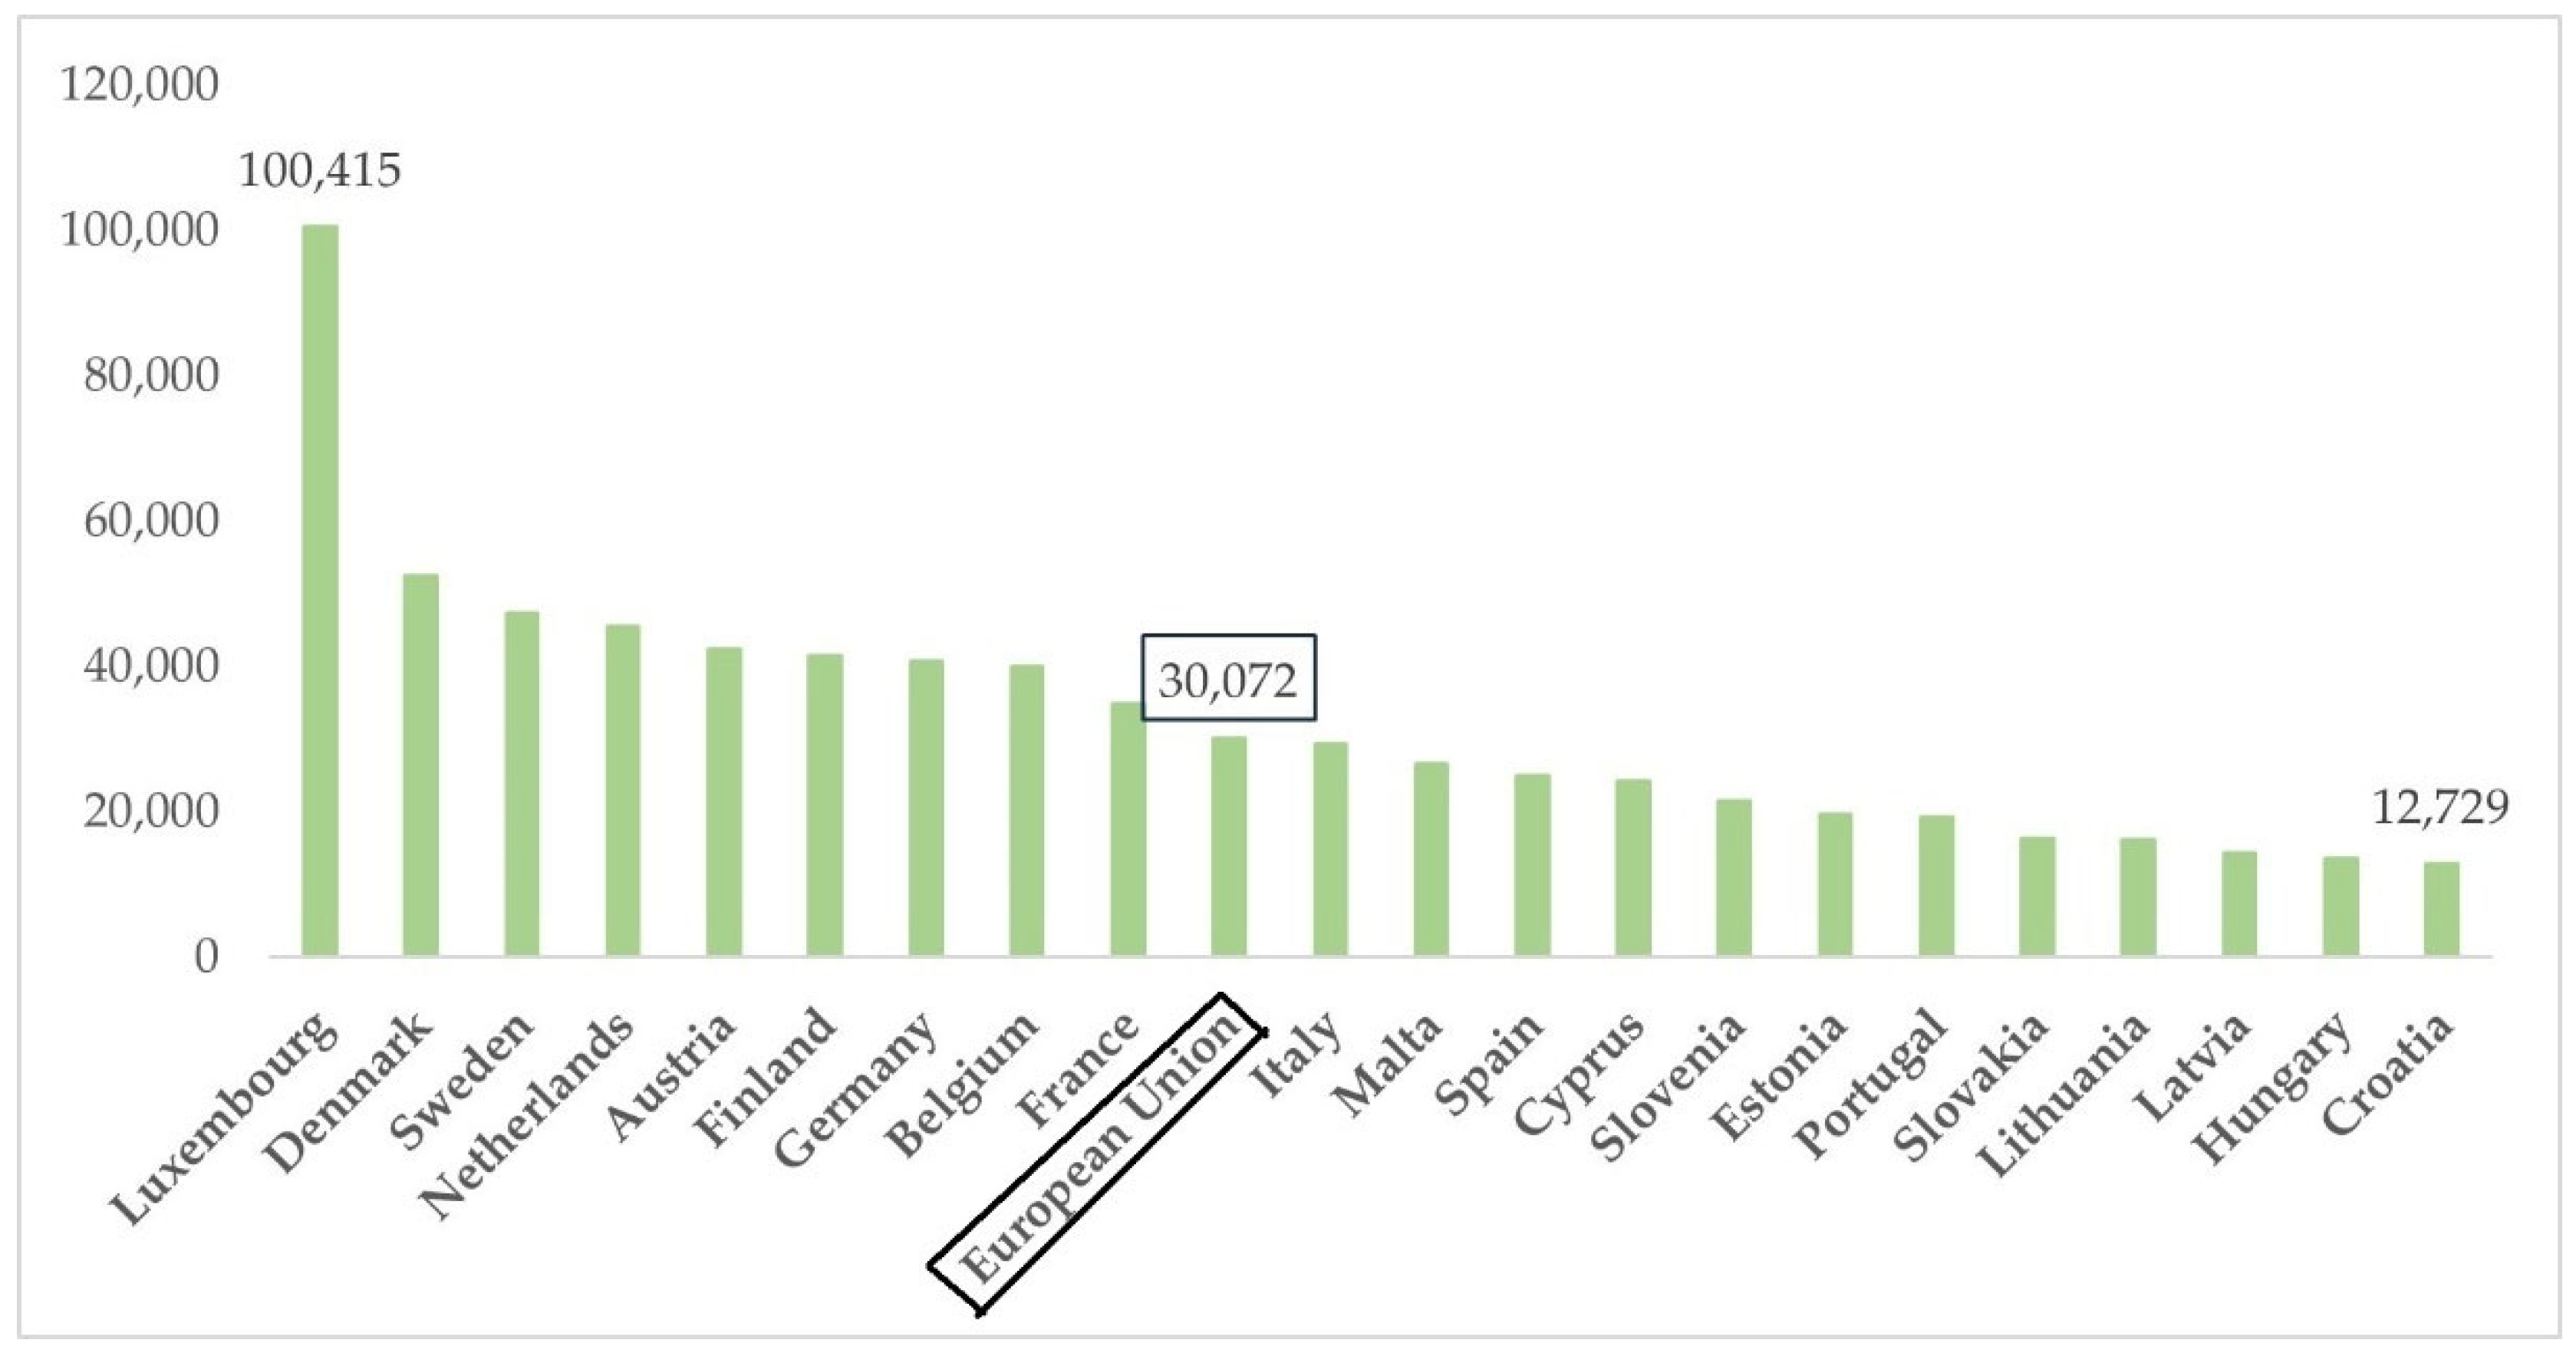
Finally, an indicator was analyzed that measures the level of economic wealth and allows for comparisons between countries based on economic strength [21]. In our research, this indicator was analyzed in terms of the introduction and application of the previously mentioned CE indicators across EU member states (Figure 4).
From Figure 4, it is evident that Luxembourg has the highest average GDP per capita, which is significantly above the average value for the EU region, which stands at 30,072.00 euro per capita. The same graph also shows that Croatia and Hungary have the lowest average GDP per capita, significantly below the EU average for the observed period.
The results of the analysis of the aforementioned indicators show that the greatest attention to environmental protection, particularly in terms of waste management, is given by the member states of the Benelux political–economic union (Belgium, the Netherlands, and Luxembourg), as well as Germany, the largest country in Central Europe. The reason for such high participation is that these countries fully implement regulations concerning prescribed recycling rates for waste by 2025 and 2030, as well as investing heavily in raising public awareness about the importance of recycling and waste management for environmental protection. Additionally, we believe that this approach can ensure sustainable economic growth for these countries by protecting biodiversity and landscapes [22].

1.3. Literature Review

Sustainable growth is a multifaceted concept encompassing economic, environmental, and social dimensions. Nonetheless, most quantitative studies employ GDP per capita as the standard macroeconomic indicator of economic progress, often in conjunction with environmental metrics. GDP per capita may influence or be influenced by various environmental indicators to differing extents [23]. Although this approach does not capture every facet of sustainability, it provides a robust and comparable measure of the fundamental relationship between economic activity and environmental protection.
The CE has increasingly been recognized within the EU as a model for sustainable development, owing to its capacity to integrate ecological objectives with economic growth. However, significant gaps persist in the literature concerning the quantitative assessment of CE’s economic impacts, particularly at the level of EU member states.
A substantial body of research has explored the nexus between economic growth and variables related to waste management and secondary raw materials in diverse global contexts. Many of these studies also confirm that higher levels of economic growth lead to a greater generation of waste due to increased consumption. Nevertheless, the existing literature largely focuses on individual CE aspects, such as municipal waste recycling rates or secondary raw material use rates, and only a few studies adopt an integrative perspective to examine multiple CE indicators and their combined effect on economic growth, especially within the EU.
Waste management, as a key proxy for a country’s environmental awareness, is of particular importance, since it is well established that higher rates of economic growth are proportionally associated with an increased generation of waste, much of which ultimately impacts the environment [24,25].
Accordingly, the results of a panel study conducted in 285 cities in China [26], and a panel study conducted in OECD countries [27], confirmed the hypothesis that with economic growth, consumer consumption also increases, which linearly affects the rise in waste. In 2004, a study was conducted on 30 OECD member countries, which found that if national income were to increase by 1%, the amount of municipal waste would increase by 0.69% [28,29]. The authors [30] concluded that five observed CE indicators (ecological, economic, and social) have a significant impact on the economic growth of EU member states, measured by GDP per capita.
According to [31,32], the implementation of CE indicators can reduce dependence on primary resources and improve production-system efficiency, yet the direct relationship between CE indicators and GDP per capita remains underexplored. The authors of [33], employ panel regression techniques on EU data to demonstrate significant causal links between several CE indicators, most notably recycling rates and economic growth. The authors of [34] highlight the lack of standardized CE metrics, which complicates any assessment of their macroeconomic impacts. Although the EC has defined a core set of CE indicators, Ref. [35] argues that these measures require revision and extension, particularly for economic evaluation purposes.
The literature also points to substantial spatial heterogeneity in the implementation of CE policy, which further limits the generalizability of the findings [36]. For example, some member states exhibit high secondary raw material use rates, while others lag behind, potentially affecting aggregate economic indicators. From this perspective, an empirical analysis of multiple CE indicators, such as recycling rates of municipal waste, recycling rates of packaging waste by type of packaging, the circular material use rate, and extra-EU27 imports of recyclable raw materials, against GDP per capita offers an opportunity to uncover the mechanisms through which CE contributes to sustainable economic growth.
Despite numerous studies of individual CE aspects, few have examined their combined effects on economic performance using quantitative panel models. The authors of [33] apply FE, RE, and POLS models but emphasize the need for more robust specifications that jointly account for both temporal and cross-sectional variation. Such an approach is essential to distinguish changes in GDP per capita driven by CE practices from those attributable to other external factors.
Furthermore, there is a segment of the academic literature that confirms opposing views, i.e., that with economic growth, the amount of municipal waste increases to a certain level, after which economic growth continues on an upward trajectory, while environmental degradation follows a downward trend [37,38,39]. The authors of [32] analyzed the impact of waste on GDP movement in EU countries and found that there is a strong correlation between the analyzed CE indicators and the economic development of a country. Specifically, they concluded that the introduction of CE principles into everyday business can contribute to the creation of new jobs, which has a positive impact on the country’s economic strength. Numerous scholars have reported results indicating that using waste as a raw material (input) can contribute to greater economic growth in countries, while simultaneously protecting the environment [40,41], as waste is treated as a valuable resource [33,42,43].
The authors of [3] analyzed the level of coordination between 11 selected CE indicators and GDP in EU countries, where they found that coordination levels vary significantly and fluctuate between positive and negative statuses. The strongest positive correlation was observed between “patents related to recycling and secondary raw materials” and the GDP of the countries.
The choice of indicators of waste management and secondary raw materials as key indicators of CE is based on the classification used by the European Commission. Although CE covers a wider range of activities (eg energy efficiency, sustainable design), indicators such as recycling rates and imports of secondary raw materials represent concrete and measurable variables whose changes can be directly related to economic performance.
As previous studies did not sufficiently consider the combined effect of indicators of waste management and secondary raw materials on the economic growth of the country, this study aims to fill that gap and contribute to a better understanding of the role of CE in sustainable economic development.
Namely, insufficient empirical research systematically evaluates whether CE indicators, viewed through quantitative indicators, can contribute to the sustainability of economic growth. It is precisely from this need that the goal of this research arises, i.e., to examine the impact of observed CE indicators on GDP per capita.
According to the literature review, we can ask the following research question: “Do CE indicators have a statistically significant impact on the sustainability of economic growth in EU countries?” In accordance with the topic and methodology, we can formulate a more precise research question, which is, “Which panel regression analysis model (POLS, FE, RE, ME) best explains the relationship between CE indicators and economic growth (GDP per capita)?” Empirical analysis, based on the application of panel regression models, provides the basis for answers to these questions, which are presented and discussed in detail in the Results and Discussion chapters.

2. Materials and Methods

This section presents and statistically analyzes all independent variables serving as CE indicators, with the aim of assessing their potential impact on the dependent variable GDP per capita. Accordingly, it is organized into three subsections: Section 2.1, Section 2.2, and Section 2.3.

2.1. Sample Under Investigation

This study includes 21 EU member states: Austria, Belgium, Croatia, Cyprus, Denmark, Estonia, Finland, France, Germany, Hungary, Italy, Latvia, Lithuania, Luxembourg, Malta, the Netherlands, Portugal, Slovakia, Slovenia, Spain, and Sweden. The dataset include ten years (2013–2022), yielding a total of 210 observations. The primary data source is the Eurostat database. The dependent variable is GDP per capita, and the independent variables (CE indicators) are recycling rate of municipal waste; circular material use rate; recycling rate of packaging waste by type of packaging; and imports of recyclable raw materials (extra EU27).

2.2. Methodology Used for Data Analysis

The dataset for panel regression analysis was constructed from secondary data obtained from [20] for the selected variables across EU member states. The methodological procedure comprised the following steps:
  • Descriptive statistics were computed both before and after data standardization to center all variables around their means (step 1);
  • Multicollinearity diagnostics were performed to detect potential collinear relationships among the independent variables (step 2);
  • Panel regression models were estimated, including POLS, FE, RE, and ME (step 3);
  • Diagnostic tests, specifically the Lagrange multiplier (Breusch–Pagan) test and the Hausman test, were conducted to assess the presence and suitability of RE specification (4. step).
The key characteristics of the panel regression framework are illustrated in Figure 5.
In the first two steps, we conducted descriptive statistics (mean, standard deviation, median) and assessed multicollinearity among the independent variables. This preliminary analysis ensured the logical consistency and qualitative coherence of the data and confirmed that our regression models would yield reliable estimates.
Following these diagnostics, we estimated a POLS model on the full panel dataset (step 3). We then applied a FE specification, which produced stronger explanatory power for our hypothesized relationships. To formally compare POLS and FE, we performed an F-test: the results favored the FE model, indicating significant heterogeneity across countries. So, the RE model was applied because it considers certain effects of random variables. The RE model and the FE model are essentially not different, but they have different aspects of analysis within the given framework and set statistical model [44]. With the RE model, individual effects are considered as random variables that should be incorporated into the established statistical model [44], which is not the case with the FE model. Finally, the ME model was applied as an alternative to the previous models, because it combines the FE and RE models that are present in the data, has a more adequate access to the data, and provides a more robust analysis of the results.
Then, in step 4, the Lagrange multiplier Breusch–Pagan test was applied for the appropriate choice between the POLS and RE models [25,45], in order to see if RE is also present in the set model. The test showed that there is a significant influence of RE, because the FE model does not provide a certain level of degrees of freedom, as the parameters are fixed [46]. In order to determine which model achieves a better impact (the FE or RE model), the Hausman test was applied [25].
Unlike the POLS approach, the FE and RE models report three distinct R-squared measures [47]:
  • R-squared (within): Explains variation within individual entities over time;
  • R-squared (between): Explains variation between entities, disregarding the time dimension;
  • R-squared (overall): Combines both between-entity and within-entity (over time) variation.
In our analysis, the FE and RE models exhibit generally high values for R-squared (between) and R-squared (overall) but low values for R-squared (within). This pattern indicates that the selected independent variables are more effective at explaining long-term differences across countries than short-term changes within each country. Consequently, accurately predicting within-entity dynamics likely requires the consideration of additional factors, such as economic policy, technological development, or poverty rates.
The interpretation of the test results for choosing the FE or RE model relies on the p-value, and the way the results are interpreted is given in Table 1 [33].
In line with the defined methodology and selected variables, the following general hypothesis was formulated:
  • H0: There is no statistically significant effect of the CE indicators (municipal waste recycling rate, circular material use rate, packaging waste recycling rate by type of packaging, and imports of recyclable raw materials from outside the EU) on GDP per capita in EU member states over the period 2013–2022 (p > 0.05);
  • H1: There is a statistically significant effect of these CE indicators on GDP per capita in EU member states during the observed period (p < 0.05).
In addition to the general hypothesis, the following specific hypotheses were posed in accordance with each independent variable, highlighting their relationship with the dependent variable (Table 2).
Given the nature of the available data, panel regression analysis was chosen as the most appropriate analytical framework. This approach accommodates both temporal and cross-sectional variation, thereby enhancing the precision of our estimates and uncovering effects that would remain hidden if only time-series or cross-sectional methods were employed. To capture different facets of the relationship between variables and to test alternative assumptions regarding the distribution and correlation of entity-specific effects with the independent variables, we implemented four distinct models (POLS, FE, RE, and ME). Collectively, these models provide a more comprehensive understanding of the dynamics linking CE indicators to sustainable economic growth and allow us to assess the robustness of our findings across model specifications.
Although our primary models are specified to evaluate the impact of CE indicators on GDP per capita, we acknowledge the possibility of reverse causality: higher income levels may drive greater investment in recycling, circular material use, packaging recycling, and imports of secondary raw materials, and thus they may influence the very CE indicators under study.
All data processing and econometric analyses were carried out in Python (version 3.11, released 24 October 2022), utilizing specialized libraries and packages for panel regression, hypothesis testing, and model diagnostics.

2.3. Variables with Descriptive Statistics

The study employs the following variables, each denoted by a symbol and measured in the specified unit (Table 3).
Based on the variables defined in Table 3, we specify the following baseline panel regression equation (Equation (1)), in line with the data used by [46,48].
Y c , t = β 0 + β 1 X 1 c , t + β 2 X 2 c , t + β 3 X 3 c , t + β 4 X 4 c , t + ε c , t
In the specified regression model, the remaining symbols from Equation (1) have the following meanings: β—represents the vector of coefficients, c—represents the EU member states, t—represents the years of observation, and ε—represents the model’s error term.
The equation for the application of the RE model (Equation (2)) is as follows [49]:
Y c , t = β 0 + β 1 X 1 c , t + β 2 X 2 c , t + β 3 X 3 c , t + β 4 X 4 c , t + u c , t + ε c , t
where uc,t—the random residual over time and by entities. The remaining symbols are unchanged.
The form of the equation when applying the ME model (Equation (3)) is as follows [50]:
Y c , t = X c , t   ×   b + Z c , t   ×   v c , t + ε c , t
where Xc,t—matrix of FE, b—vector of FE, Zc,t—matrix of RE, vc,t—vector of RE, while the remaining symbols are unchanged.
Descriptive statistics of observed variables before and after the data standardization of the analyzed sample, with the aim of centralizing the data around the mean values, are shown in Table 4.
The results of the standardization of the initial data, viewed through the lens of the median, show that there are no significant deviations from the mean values.
After analyzing the descriptive statistics results, a check for the presence of multicollinearity and potential correlations between the analyzed variables in the set model was performed, and the results are presented in Table 5.
Given that the results in Table 5 show that there are no values greater than 0.7, we can conclude that there is no presence of multicollinearity in the given data, and that there will be no issue in isolating the contributions of independent indicators to the dependent variable [51].
Within this research, control variables (population, education level of the population, unemployment rate, openness to trade, etc.) were not included in the regression models, since the focus was exclusively on examining the impact of CE indicators on the economic growth of countries.

3. Results

The results of the panel regression analysis, obtained using the POLS, FE, RE and ME models, are presented in the tables below. Each model provides insights into the potential effects of CE indicators on GDP per capita in the observed EU member states.
First, we started with the POLS technique in the data analysis, and the results are shown in Table 6.
Based on the results presented in Table 6, it is evident that the model is statistically significant, since the p-value < 0.05 (p = 2.90 × 10⁻¹⁴). The R2 value ( R ² = 0.286 ) indicates that using the POLS technique, we explained 28.6% of the variation in the specified model. Since this technique did not account for individual effects on the dependent variable, further investigation involved the application of the FE model (Table 7), which serves as an alternative to the POLS technique.
Given that the p-value = 0.0000 and the value of the F-statistic is 24.031, we can conclude that the model is statistically significant, since p < 0.05 (p = 0.0000), indicating that the observed predictors significantly affect the dependent variable. The results from the application of the FE method show a higher R2 within ( R ² = 0.3419 ) compared to the POLS technique, meaning that individual specificities that may influence the dependent variable have been accounted for. The R2 between parameter explains 59.81% of the variation with the observed variables, while R2 overall explains the variation over time with a participation of 59.57%, indicating the moderately strong fit of the model. R2 between and R2 overall in our model are more relevant for explaining long-term differences between entities than for changes within the entities themselves.
The results of the F-test (Table 8) after applying this method show a significant impact of the FE model on the established model in comparison to the POLS model.
Given that the FE model contains several limitations regarding data bias, despite the sufficiently large sample size, the group of authors in [52] presented twelve limitations in the application of the FE model. Therefore, the Lagrange multiplier Breusch–Pagan test was applied to check for the possible presence of heteroscedasticity and to determine whether the RE model should be considered in the model (Table 9).
The Lagrange multiplier value indicates the presence of the RE model ( p = 0.000 ), and the results of applying this method are presented in Table 10.
Given that the p-value = 0.0000 and the F-statistic value is 38.708, we can state that the model is statistically significant (p < 0.05), which indicates that the observed predictors significantly influence the dependent variable. R2 overall (R2 = 0.7372) tells us that about 73.72% of the total variation in the dependent variable is explained by the analyzed variables, R2 between explains 74.11% of the variation with the observed variables, which is relevant for the set statistical model.
Finally, we determined whether there is a significant difference between the estimates of the FE and RE models, and for this purpose, we used the Hausman test (Table 11).
By applying the Hausman test, we determined that the RE model yields better results and is more significant than the FE model, as the p-value is greater than 0.05 ( p = 0.4126 ). Finally, the ME model was applied to achieve a better precision in and interpretation of the results (Table 12).
The results of the applied ME model indicate a high degree of robustness among the variables, with most independent variables showing a statistically significant impact on the dependent variable. The model successfully incorporates both FE and RE, providing it with an analytical advantage due to its ability to account for variations across both time and entities. The high value of the Group Variance ( G r o u p   V a r = 391,513,117.471 ) suggests substantial heterogeneity among the groups, while the Log-likelihood value (Log-likelihood = −2044.2009) indicates that the model is appropriate and can be reliably used for comparison with other models.

4. Discussion

The results obtained from the application of the POLS technique indicate that the specified multiple regression model is statistically significant, with three out of the four observed independent variables (X1, X2, and X4) having a significant impact on the dependent variable (Y). The influence of the independent variable X3 on the dependent variable Y requires further investigation due to its borderline statistical significance ( p = 0.051 ).
The interpretation of the results for individual independent variables after applying the FE model (Table 7) is as follows:
  • The recycling rate of municipal waste has a statistically significant positive effect on GDP per capita ( p = 0.0000 ). An increase in the recycling rate of municipal waste by 1% is associated with an increase in GDP per capita of EUR 241.27;
  • The circular material use rate also has a statistically significant positive effect on GDP per capita ( p = 0.0000 ). An increase in this rate by 1% corresponds to an increase in GDP per capita of EUR 523.76;
  • The recycling rate of packaging waste by type of packaging does not have a statistically significant effect on GDP per capita and is not significantly associated with the dependent variable, as p > 0.05 ( p = 0.9604 );
  • Trade in recyclable raw materials, imports from extra-EU27 countries, has a highly statistically significant positive effect on GDP per capita ( p = 0.0000 ). Each EUR 1000 increase in imports of recyclable raw materials is associated with an increase in GDP per capita of EUR 0.0018.
Given the confirmed presence of the RE model in the specified statistical model, the interpretation of the results for individual independent variables (Table 10) is as follows:
  • The recycling rate of municipal waste has a statistically significant positive effect on GDP per capita ( p = 0.0000 ). A 1% increase in the recycling rate is associated with an approximate increase of EUR 252.76 in GDP per capita;
  • The circular material use rate shows a statistically significant positive impact ( p = 0.0000 ). A 1% increase in the circular material use rate leads to an increase in GDP per capita of approximately EUR 552.14;
  • The recycling rate of packaging waste by type of packaging shows a statistically significant positive effect on GDP per capita, as p < 0.05 ( p = 0.0218 ). Thus, a 1% increase in packaging waste recycling is associated with a GDP per capita increase of EUR 115.07;
  • Trade in recyclable raw materials, imports from extra-EU27, has a statistically significant positive effect on GDP per capita, with p < 0.05 ( p = 0.0001 ). An increase of EUR 1000 in imports of recyclable raw materials corresponds to an increase in GDP per capita of EUR 0.0019.
Finally, based on the results of the ME model (Table 12), we interpret the findings as follows:
  • The recycling rate of municipal waste is statistically significant ( p = 0.0000 ), with a 1% increase resulting in an approximate GDP per capita increase of EUR 251.602;
  • The circular material use rate is also statistically significant ( p = 0.0000 ), with a 1% rise increasing GDP per capita by approximately EUR 550.443;
  • The recycling rate of packaging waste by type of packaging is marginally significant, with a p-value close to the 0.05 threshold ( p = 0.054 ), and could potentially increase GDP per capita by EUR 105.502;
  • Trade in recyclable raw materials, imports from extra-EU27, shows a positive and statistically significant effect ( p < 0.05 ,   p = 0.000 ), despite a very small coefficient. Accordingly, each EUR 1000 increase in imports of recyclable raw materials may lead to a GDP per capita increase of EUR 0.002.
The results of testing the specified regression model confirm that the observed variables significantly influence the country’s economic growth, and that the model is statistically significant. In other words, the recycling rate of municipal waste, the circular material use rate, and imports of recyclable raw materials from outside the EU27 positively impact GDP per capita in the observed countries, which supports the acceptance of the alternative hypothesis (H1). These findings were also recorded by [33]. The variable “recycling rate of packaging waste by type of packaging” shows borderline significance, requiring further investigation. Hence, the null hypothesis (H0) may be accepted for this variable, although under the RE model this variable is statistically significant and therefore supports the alternative hypothesis (H1). Furthermore, it can be concluded that integrating the analyzed CE indicators is essential to ensure the appropriate economic and environmental potential of the state, as also confirmed by the authors of [53].

5. Conclusions

Following the application of the previously discussed multiple panel regression models, we conclude that three out of the four independent variables exert a positive influence on GDP per capita. The exception is the recycling rate of packaging waste by type of packaging, which requires further analysis due to its marginal statistical significance in the ME model and the lack of significance in the FE model.
This analysis suggests that municipal waste recycling, circular material use, and imports of recyclable raw materials may play a significant role in shaping GDP per capita in the analyzed EU countries in the following ways:
  • The development of public policies that promote higher recycling rates and increased material circulation can enhance economic performance;
  • Trade in recyclable raw materials, specifically imports in this study, has a strong impact on GDP per capita, contributing to the economic stability of a country;
  • Such activities can also foster innovation in the long run.
The RE model shows that all independent variables have a positive and statistically significant effect on GDP per capita, where (a) higher recycling and circular economy rates contribute substantially to GDP growth; (b) trade in recyclable raw materials has a smaller but still significant effect; and (c) the RE model provides strong evidence to support policy initiatives aimed at promoting recycling and circular material use for the purpose of economic growth.
Therefore, we suggest that countries should increase the share of recycled materials in everyday production and processing activities, as well as the share of secondary raw materials, since this study has confirmed the hypothesis that these factors may influence economic growth.
Investing in innovation and education is essential, as is fostering entrepreneurship based on circular economy principles. While researchers may face challenges in exploring this topic, we believe that individual studies can make a valuable contribution to the relevance and advancement of the field.
This study has identified several limitations that could be addressed in future research. First, it is evident that GDP per capita does not provide a complete picture of a country’s sustainable growth. Therefore, alternative dependent variables such as the Human Development Index (HDI), Genuine Progress Indicator (GPI), and Inclusive Wealth Index (IWI) could be used as complementary indicators. Second, this study does not include control variables (e.g., population size, unemployment rate, trade openness, education level), which may affect the comprehensiveness of the analysis of factors influencing sustainable economic growth. Third, other environmental protection indicators (e.g., greenhouse gas emissions, share of renewable energy sources) were not included, although they are important for assessing the preservation of the natural environment. Fourth, due to the potential for reciprocal relationships, future research should consider incorporating endogenous factors and methodological approaches to assess bidirectional causality, such as simultaneous equation models or instrumental variables, to explore whether GDP per capita also influences the observed circular economy indicators. These limitations may affect the reliability of the results obtained.

Author Contributions

Conceptualization, B.G.V. and N.V.Ć.; methodology, B.G.V. and N.V.Ć.; software, B.G.V. and N.V.Ć.; validation, B.G.V. and N.V.Ć.; formal analysis, B.G.V., N.V.Ć. and I.G.G.; investigation, B.G.V.; resources, B.G.V., N.V.Ć. and I.G.G.; data curation, B.G.V.; writing—original draft preparation, B.G.V. and N.V.Ć.; writing—review and editing, B.G.V., N.V.Ć. and I.G.G.; visualization, B.G.V., N.V.Ć. and I.G.G.; supervision, B.G.V., N.V.Ć. and I.G.G. All authors have read and agreed to the published version of the manuscript.

Funding

This research received no external funding.

Institutional Review Board Statement

Not applicable.

Informed Consent Statement

Not applicable.

Data Availability Statement

All data are available at the Eurostat database, https://ec.europa.eu/eurostat/data/database, accessed on 20 March 2025. Other data sources included in the investigation are referenced in the text.

Acknowledgments

This research was supported by the Ministry of Science, Technological Development and Innovation of the Republic of Serbia, grant number 451-03-136/2025-03/200054.

Conflicts of Interest

The authors declare no conflicts of interest.

References

  1. Mitrović, Ð.; Manić, E. Transition to circular economy in the EU countries—Convergence or divergence. Econ. Ideas Pract. 2020, 38, 27–48. [Google Scholar]
  2. Huysman, S.; De Schaepmeester, J.; Ragaert, K.; Dewulf, J.; De Meester, S. Performance indicators for a circular economy: A case study on post-industrial plastic waste. Resour. Conserv. Recycl. 2017, 120, 46–54. [Google Scholar] [CrossRef]
  3. Kaivo-Oja, J.; Vehmas, J.; Luukkanen, J. Economic Growth and Circular Economy in the European Union: Novel Empirical Synergy Analyses Between Key Variables of Circular Economy and Gross Domestic Growth (GDP) and Gross National Income (GNI). OIDA Int. J. Sustain. Dev. 2022, 15, 23–36. [Google Scholar]
  4. Čađenović, A. Transition from linear to circular economy—Initial steps of Serbia and experience of EU member states. Econ. Ideas Pract. 2023, 50, 71–84. [Google Scholar]
  5. Vukadinović, P. Ekologija između linearne i cirkularne ekonomije. Ecologica 2018, 24, 231–236. [Google Scholar]
  6. Vukelić, I.; Milošević, S.; Đurđević, D.; Racić, G.; Tot, V. Sustainable transition of the Republic of Serbia: Measuring capacity for circularity in agriculture and rural areas. Energy Sustain. Soc. 2023, 13, 34. [Google Scholar] [CrossRef]
  7. Ćurčić, G. Challenges in addressing microplastics in the environment. In Proceedings of the Scientific Conference (Bio) Economy and Green Transition of the Economy of the Republic of Serbia, Sremska Kamenica, Serbia, 17 October 2024; Educons University: Sremska Kamenica, Serbia, 2024; pp. 27–36. [Google Scholar]
  8. Ješić, J.; Radovanović, M.; Vukadinović, S. Transitioning AP Vojvodina towards a circular economy: Evaluating knowledge levels and strategic inputs for eco-innovations. In Proceedings of the Scientific Conference (Bio) Economy and Green Transition of the Economy of the Republic of Serbia, Sremska Kamenica, Serbia, 17 October 2024; Educons University: Sremska Kamenica, Serbia, 2024; pp. 17–26. [Google Scholar]
  9. Tan, E.C.; Lamers, P. Circular bioeconomy concepts—A perspective. Front. Sustain. 2021, 2, 701509. [Google Scholar] [CrossRef]
  10. Busu, M. Adopting Circular Economy at the European Union Level and Its Impact on Economic Growth. Soc. Sci. 2019, 8, 159. [Google Scholar] [CrossRef]
  11. Vasiljević, D.; Petrović, D. Report on the Conducted ex Ante Impact Analysis for the Area of Circular Economy; Policy and Legal Advice Centre—PLAC III EuropeAid/139295/DH/SER/RS; Ministry of European Integration of the Republic of Serbia: Belgrade, Serbia, 2020.
  12. Korhonen, J.; Honkasalo, A.; Seppälä, J. Circular economy: The concept and its limitations. Ecol. Econ. 2018, 143, 37–46. [Google Scholar] [CrossRef]
  13. Avdiushchenko, A.; Zając, P. Circular Economy Indicators as a Supporting Tool for European Regional Development Policies. Sustainability 2019, 11, 3025. [Google Scholar] [CrossRef]
  14. COM/2015/614; Closing the Loop—An EU Action Plan for the Circular Economy. European Commission (EC): Brussels, Belgium, 2015.
  15. COM/2018/028; A European Strategy for Plastics in a Circular Economy. European Commission (EC): Brussels, Belgium, 2018.
  16. COM/2018/851; Directive (EU) of the European Parliament and of the Council of 30 May 2018 Amending Directive 2008/98/EC on Waste. European Commission (EC): Brussels, Belgium, 2018.
  17. COM/2018/852; Directive (EU) of the European Parliament and of the Council of 30 May 2018 Amending Directive 94/62/EC on Packaging and Packaging Waste. European Commission (EC): Brussels, Belgium, 2018.
  18. COM/2023/304; Identifying Member States at Risk of Not Meeting the 2025 Preparing for Re-Use and Recycling Target for Municipal Waste, the 2025 Recycling Target for Packaging Waste and the 2035 Municipal Waste Landfilling Reduction Target. European Commission (EC): Brussels, Belgium, 2023.
  19. COM/2019/640; The European Green Deal. European Commission (EC): Brussels, Belgium, 2019.
  20. EUROSTAT Database. EU Policies, Circular Economy Indicators, Waste Management, Secondary Raw Materials, National Accounts. 2025. Available online: https://ec.europa.eu/eurostat/data/database (accessed on 20 March 2025).
  21. Grujić Vučkovski, B.; Paraušić, V.; Kljajić, N. Impact of realized investments in new fixed assets on Gross Domestic Product in Serbia. Econ. Agric. 2023, 70, 737–753. [Google Scholar] [CrossRef]
  22. Grujić Vučkovski, B.; Simonović, Z.; Ćurčić, N.; Miletić, V. The role of agriculture in the economic structure of Serbia and budget support for rural development of Kladovo municipality. Econ. Agric. 2022, 69, 863–876. [Google Scholar] [CrossRef]
  23. Dědeček, R.; Dudzich, V. Exploring the limitations of GDP per capita as an indicator of economic development: A cross-country perspective. Rev. Econ. Perspect. 2022, 22, 193–217. [Google Scholar] [CrossRef]
  24. Blagoeva, N.; Georgieva, V.; Dimova, D. Relationship between GDP and municipal waste: Regional disparities and implication for waste management policies. Sustainability 2023, 15, 15193. [Google Scholar] [CrossRef]
  25. Jorge, E. Exploring the impact of population aging, population density, and GDP on municipal waste generation in European OECD Countries-When do mediation effects matter? Soc. Sci. Humanit. Open 2025, 11, 101432. [Google Scholar] [CrossRef]
  26. Gui, S.; Zhao, L.; Zhang, Z. Does municipal solid waste generation in China support the Environmental Kuznets Curve? New evidence from spatial linkage analysis. Waste Manag. 2019, 84, 310–319. [Google Scholar] [CrossRef]
  27. Yılmaz, F. Is there a waste Kuznets curve for OECD? Some evidence from panel analysis. Environ. Sci. Pollut. Res. 2020, 27, 40331–40345. [Google Scholar] [CrossRef]
  28. Johnstone, N.; Labonne, J. Generation of household solid waste in OECD countries: An empirical analysis using macroeconomic data. Land Econ. 2004, 80, 529–538. [Google Scholar] [CrossRef]
  29. Kinnaman, T.C. The economics of municipal solid waste management. Waste Manag. 2009, 29, 2615–2617. [Google Scholar] [CrossRef]
  30. Hysa, E.; Kruja, A.; Rehman, N.U.; Laurenti, R. Circular Economy Innovation and Environmental Sustainability Impact on Economic Growth: An Integrated Model for Sustainable Development. Sustainability 2020, 12, 4831. [Google Scholar] [CrossRef]
  31. Ghisellini, P.; Cialani, C.; Ulgiati, S. A review of circular economy: The expected transition to a balanced interplay of environmental and economic systems. J. Clean. Prod. 2016, 114, 11–32. [Google Scholar] [CrossRef]
  32. Sverko Grdic, Z.; Krstinic Nizic, M.; Rudan, E. Circular economy concept in the context of economic development in EU countries. Sustainability 2020, 12, 3060. [Google Scholar] [CrossRef]
  33. Georgescu, I.; Kinnunen, J.; Androniceanu, A.M. Empirical evidence on circular economy and economic development in Europe: A panel approach. J. Bus. Econ. Manag. 2022, 23, 199–217. [Google Scholar] [CrossRef]
  34. Saidani, M.; Yannou, B.; Leroy, Y.; Cluzel, F.; Kendall, A. A taxonomy of circular economy indicators. J. Clean. Prod. 2019, 207, 542–559. [Google Scholar] [CrossRef]
  35. Pacurariu, R.L.; Vatca, S.D.; Lakatos, E.S.; Bacali, L.; Vlad, M.A. Critical Review of EU Key Indicators for the Transition to the Circular Economy. Int. J. Environ. Res. Public Health 2021, 18, 8840. [Google Scholar] [CrossRef]
  36. Smol, M.; Kulczycka, J.; Avdiushchenko, A. Circular economy indicators in relation to eco-innovation in European regions. Clean. Technol. Environ. Policy 2017, 19, 669–678. [Google Scholar] [CrossRef]
  37. Arbulu, I.; Lozano, J.; Rey-Maquieira, J. Tourism and solid waste generation in Europe: A panel data assessment of the environmental curve. Waste Manag. 2015, 46, 628–636. [Google Scholar] [CrossRef]
  38. Mazzanti, M.; Zoboli, R. Municipal waste kuznets curves: Evidence on socioeconomic drivers and policy effectiveness from the EU. Environ. Resour. Econ. 2009, 44, 203–230. [Google Scholar] [CrossRef]
  39. Stern, D.I. The rise and fall of the environmental Kuznets curve. World Dev. 2004, 32, 1419–1439. [Google Scholar] [CrossRef]
  40. Schaffartzik, A.; Mayer, A.; Gingrich, S.; Eisenmenger, N.; Loy, C.; Krausmann, F. The global metabolic transition: Regional patterns and trends of global material flows. Glob. Environ. Change 2014, 26, 87–97. [Google Scholar] [CrossRef]
  41. Haas, W.; Krausmann, F.; Wiedenhofer, D.; Heinz, M. How circular is the global economy? An assessment of material flows, waste production, and recycling in the European Union and the world in 2005. J. Ind. Ecol. 2015, 19, 765–777. [Google Scholar] [CrossRef]
  42. Murray, A.; Skene, K.; Haynes, K. The Circular Economy: An interdisciplinary exploration of the concept and application in a global context. J. Bus. Ethics 2017, 140, 369–380. [Google Scholar] [CrossRef]
  43. Rizos, V.; Tuokko, K.; Behrens, A. The Circular Economy: A Review of Definitions, Processes and Impacts (CEPS Papers 12440). Centre for European Policy Studies. 2017. Available online: https://circulareconomy.europa.eu/platform/sites/default/files/rr2017-08_circulareconomy_0.pdf (accessed on 20 March 2025).
  44. Mouchart, M. The Econometrics of Panel Data; Institute of Scientific Catholic University of Louvain: Ottignies-Louvain-la-Neuve, Belgium, 2009. [Google Scholar]
  45. Baltagi, B.H.; Feng, Q.; Kao, C. A Lagrange Multiplier test for cross-sectional dependence in a fixed effects panel data model. J. Econom. 2012, 170, 164–177. [Google Scholar] [CrossRef]
  46. Biorn, E. Econometrics of Panel Data: Methods and Applications; Oxford University Press: Oxford, UK, 2017. [Google Scholar]
  47. Torres-Reyna, O. Panel data analysis fixed and random effects using Stata (v. 4.2). Data Stat. Serv. Priceton Univ. 2007, 112, 1–40. [Google Scholar]
  48. Araiza-Aguilar, J.A.; Rojas-Valencia, M.N.; Aguilar-Vera, R.A. Forecast generation model of municipal solid waste using multiple linear regression. Glob. J. Environ. Sci. Manag. 2020, 6, 1–14. [Google Scholar] [CrossRef]
  49. Zulfikar, R.; STp, M.M. Estimation model and selection method of panel data regression: An overview of common effect, fixed effect, and random effect model. JEMA: J. Ilm. Bid. Akunt. 2018, 9, 1–10. [Google Scholar] [CrossRef]
  50. Helwig, N.E. Linear Mixed-Effects Regression; University of Minnesota: Minneapolis, MN, USA, 2017; Available online: https://users.stat.umn.edu/~helwig/notes/lmer-Notes.pdf (accessed on 20 March 2025).
  51. Johnston, R.; Jones, K.; Manley, D. Confounding and collinearity in regression analysis: A cautionary tale and an alternative procedure, illustrated by studies of British voting behaviour. Qual. Quant. 2018, 52, 1957–1976. [Google Scholar] [CrossRef]
  52. Hill, T.D.; Davis, A.P.; Roos, J.M.; French, M.T. Limitations of fixed-effects models for panel data. Sociol. Perspect. 2020, 63, 357–369. [Google Scholar] [CrossRef]
  53. Sikder, M.; Wang, C.; Rahman, M.M.; Yeboah, F.K.; Alola, A.A.; Wood, J. Green lsogistics and circular economy in alleviating CO2 emissions: Does waste generation and GDP growth matter in EU countries? J. Clean. Prod. 2024, 449, 141708. [Google Scholar] [CrossRef]
Figure 1. Average recycling rate of municipal waste and circular material use rate in EU member states, 2013–2022 (in %).
Sustainability 17 05181 g001
Figure 2. Average recycling rate of packaging waste by type of packaging in EU member states, 2013–2022 (in %).
Sustainability 17 05181 g002
Figure 3. Average trade in recyclable raw materials, imports extra-EU, in EU member states 2013–2022 (in thousand euro).
Sustainability 17 05181 g003
Figure 4. Average GDP per capita in EU member states, 2013–2022 (in euro per capita).
Sustainability 17 05181 g004
Figure 5. Characteristics of panel regression analysis.
Sustainability 17 05181 g005
Table 1. Evaluation of the results of the conducted tests.
Lagrange multiplier value p > 0.05 Does not exist RE in model, the best model is PLOS
p < 0.05 Exist RE in model
Hausman test value p > 0.05 Select the RE model
p < 0.05 Select the FE model
Table 2. Research hypotheses in accordance with the expected relations of independent and dependent variables.
Independent VariablesGeneral HypothesisAlternative Hypothesis
I Recycling rate of municipal wasteThe municipal waste recycling rate does not have a statistically significant impact on GDP per capita.The municipal waste recycling rate has a statistically significant impact on GDP per capita.
II Circular material use rateThe rate of use of circular materials does not have a statistically significant impact on GDP per capita.The rate of use of circular materials has a statistically significant impact on GDP per capita.
III Recycling rate of packaging waste by type of packagingThe recycling rate of packaging waste by type of packaging does not have a statistically significant impact on GDP per capita.The recycling rate of packaging waste by type of packaging has a statistically significant impact on GDP per capita.
IV Imports of recyclable raw materials (extra EU27)The import of recyclable raw materials from outside the EU does not have a statistically significant impact on GDP per capita.The rate of use of circular materials has a statistically significant impact on GDP per capita.
Table 3. Description of the following variables.
VariablesDescriptionUnit of MeasureSourceType
YGDP per capitaCurrent prices, euro per capitaEUROSTAT DatabaseDependent variable
X 1 Recycling rate of municipal wastePercentageEUROSTAT DatabaseIndependent variable
X 2 Circular material use ratePercentageEUROSTAT DatabaseIndependent variable
X 3 Recycling rate of packaging waste by type of packagingRateEUROSTAT DatabaseIndependent variable
X 4 Trade in recyclable raw materials, imports extra EU27Thousand euroEUROSTAT DatabaseIndependent variable
Table 4. Descriptive statistics of observed variables before and after data standardization.
VariablesResults Before the Data StandardizationResults After the Data Standardization
MeanStdMedianMeanStdMedian
Y32,487.2919,861.9727,735.000.01.0−0.239837
X140.2814.9741.40−0.01.00.075264
X210.166.428.550.01.0−0.250790
X364.289.8466.60−0.01.00.236805
X4874,927.191,324,656.51199,667.350.01.0−0.510980
Table 5. Verification of multicollinearity.
YX1X2X3X4
Y1.0000000.4815740.2975110.4036140.154508
X10.4815741.0000000.4238620.6329700.530557
X20.2975110.4238621.0000000.4431270.529876
X30.4036140.6329700.4431271.0000000.435354
X40.1545080.5305570.5298760.4353541.000000
Table 6. Results of the analysis of the specified model after the application of the POLS technique.
Dep. VariableYR-squared0.286
MethodLeast SquaresAdj. R-squared0.272
No. observations210F-statistic20.57
Df residuals205Prob. (F-statistic)2.90 × 10⁻¹⁴
Df model4Log-likelihood−2340.3
CoefficientStd. Errt p > I t I [0.0250.975]
Intercept−1.31 × 1048358.702−1.5670.119−2.96 × 1043378.915
X1578.7856108.8465.3180.000364.190793.381
X2518.0520224.4102.3090.02275.604960.500
X3312.3011159.1821.9620.051−1.542626.144
X4−0.00350.001−3.0680.002−0.006−0.001
Table 7. Results of the application of the FE model.
Dep. VariableYR-squared0.3419
ModelOLSR-squared (between)0.5981
No. observations210R-squared (within)0.3419
Log-likelihood−1976.9F-statistic24.031R-squared (overall)0.5957
p-value0.0000DistributionF(4, 185)
Parameter estimates
ParameterStd. ErrT-statp-valueLower CIUpper CI
X1241.2741.7185.78330.0000158.97323.57
X2523.76115.174.54760.0000296.54750.99
X3−3.185764.064−0.04970.9604−129.58123.20
X40.00180.00053.91020.00010.00090.0028
Table 8. F-statistic results.
F-statistic317.9329
p-value0.0000
Table 9. Lagrange multiplier statistic results.
Lagrange multiplier value27.357
p-value0.000
Table 10. Key metrics of the application of the RE model.
Dep. VariableYR-squared0.4291
EstimatorRER-squared (between)0.7411
No. observations210R-squared (within)0.3267
Log-likelihood−1991.8Distribution F(4, 206)R-squared (overall)0.7372
F-statistic38.708p-value0.0000
CoefficientStd. Errtp-value
X1252.7642.1076.0030.0000
X2552.14115.194.7930.0000
X3115.0749.7732.3120.0218
X40.00190.00053.9210.0001
Table 11. Results of the Hausman test.
Hausman test statistic3.9517
p-value0.4126
Table 12. Results of the application of the ME model.
Dep. VariableYMethodREML
ModelMixedLMScale10,147,058.6924
No. observations210Log-likelihood−2044.2009
CoefficientStd. Errz p > I z I [0.0250.975]
X1251.60241.8506.0120.000169.578333.626
X2550.443114.4844.8080.000326.060774.827
X3105.50254.8301.9240.054−1.963212.967
X40.0020.0003.9600.0000.0010.003
Group Var391,513,117.47145,003.804
Disclaimer/Publisher’s Note: The statements, opinions and data contained in all publications are solely those of the individual author(s) and contributor(s) and not of MDPI and/or the editor(s). MDPI and/or the editor(s) disclaim responsibility for any injury to people or property resulting from any ideas, methods, instructions or products referred to in the content.

