Article

Exploring the Link Between Digital Readiness and Sustainable Development: A Cluster Analysis of EU Countries

by
Martina Košíková
and
Petra Vašaničová
*
Faculty of Management and Business, University of Prešov, 080 01 Prešov, Slovakia
*
Author to whom correspondence should be addressed.
Sustainability 2025, 17(11), 5080; https://doi.org/10.3390/su17115080
Submission received: 30 April 2025 / Revised: 23 May 2025 / Accepted: 30 May 2025 / Published: 1 June 2025

Abstract

:
This paper explores the relationship between digital readiness and sustainable development in European Union (EU) countries through a two-level cluster analysis based on the 2024 Network Readiness Index (NRI) and selected Sustainable Development Goals (SDGs). The first analysis groups countries by digital maturity across the NRI pillars: Technology, People, Governance, and Impact. The second focuses on SDG performance in areas such as health, education, gender equality, clean energy, and sustainable cities. Results reveal significant disparities between digital readiness and SDG achievements: some digitally advanced countries underperform in sustainability, while others with lower digital scores excel in SDG outcomes. The study identifies regional patterns, confirms a moderate positive correlation between NRI and SDG clusters (rs = 0.526), and underscores the need for integrated digital and sustainability policies. Recommendations are provided for targeted policymaking and international cooperation.

1. Introduction

Digital transformation is one of the defining phenomena of the 21st century, reshaping economic and social processes globally. A country’s digital readiness reflects its capacity to effectively utilize information and communication technologies (ICTs) to foster economic growth and enhance quality of life. In the current era, digital readiness plays a crucial role in advancing sustainable development. In Europe, digitalization has become a priority for policymakers, the business sector, and academia, as it is closely tied to economic growth, innovation, and competitiveness [1]. Beyond its economic benefits, digital technologies can significantly support the achievement of the Sustainable Development Goals (SDGs), particularly in areas such as good health and well-being (SDG 3), quality education (SDG 4), and sustainable cities and communities (SDG 11) [2].
Common indices used to assess countries’ digital readiness include the Network Readiness Index (NRI), the Digital Economy and Society Index (DESI), the Global Innovation Index (GII), and the AI Readiness Index (AIRI). These tools provide insights into countries’ digital competitiveness, technology adoption capacity, and preparedness for the digital economy [3].
In the European context, understanding how digital readiness influences progress toward the 2030 Agenda’s SDGs is increasingly important. Research shows that digital innovations can enhance social inclusion, economic prosperity, and environmental sustainability [4]. Countries with higher digital readiness often perform better in SDG-related areas such as quality education (SDG 4), good health and well-being (SDG 3), and sustainable cities and communities (SDG 11). For example, Nosratabadi et al. [5] found that the social sustainability of digital transformation in EU-27 countries is positively correlated with SDG achievement. Nations like Finland, the Netherlands, and Denmark exhibit the highest levels of socially sustainable digital transformation, which contributes to stronger progress toward achieving the SDGs.
Despite high levels of digitalization in many EU countries, significant disparities in digital infrastructure, skills, and access to technology remain. These inequalities can hinder not only economic growth but also countries’ ability to achieve the SDGs [6].
This study aims to analyze the relationship between digital readiness and sustainable development performance in EU countries using cluster analysis. This approach helps identify homogeneous groups of countries with similar levels of digital maturity and their potential advance to sustainable development. The results may provide valuable insights for policymakers seeking to promote digital transformation and integrate it into sustainable development strategies. This research is guided by the following hypothesis:
Hypothesis 1. 
There is a significant relationship between a country’s digital readiness and its ability to contribute to the SDGs.
While previous studies have explored the connection between digital readiness and sustainable development, few have analyzed the internal structure of the NRI and its alignment with SDG outcomes using clustering methods. This paper addresses that gap by combining multidimensional digital readiness data with selected SDG indicators (3, 4, 5, 7, and 11) to identify country groupings and evaluate convergence or divergence in digital and sustainability outcomes. This study adds value by using an integrative, dual-clustering approach to assess both digital readiness and sustainability performance. While earlier research has examined digitalization and SDG progress separately, few studies have explored how they align using hierarchical classification across EU member states. By merging multidimensional NRI data with selected SDG indicators, this paper offers a novel perspective on how digital and sustainability profiles converge or diverge. This contributes to comparative policy analysis and enhances understanding of strategic digital development in the context of the 2030 Agenda.
The remainder of the paper is organized as follows: Section 2 reviews the relevant literature on digital readiness and its connection to sustainable development. Section 3 outlines the data sources and methodological approach, including the clustering framework. Section 4 presents the results of the correlation and cluster analyses. Section 5 discusses key findings, highlighting consistencies and discrepancies between NRI and SDG groupings. Section 6 offers conclusions, policy implications, and directions for future research.

2. Literature Review

2.1. Digitalization as a Key Driver of Economic Growth and Social Development

The impact of digital transformation extends beyond the technological sphere, fundamentally reshaping the functioning of economic actors, public administration, and social interactions [1]. Studies indicate that countries with a high degree of digitalization tend to exhibit higher GDP per capita, increased labor productivity, and greater financial inclusion, all of which can indirectly enhance the efficiency of public services [7]. Belyaev and Lopatkova [3] found a strong correlation between the level of digitalization and a country’s capacity to implement technological innovations, which in turn influences its competitiveness in the global market. The importance of digitalization for economic growth is further reflected in a country’s ability to attract foreign investment and develop digital infrastructure [8]. Investments in the digital economy not only directly support job creation but also enhance the broader business environment [9]. Moreover, digital technologies facilitate more efficient resource allocation, leading to increased productivity and reduced transaction costs [10]. Higher levels of digitalization are also evident in the public sector, where digital tools help streamline administrative processes, enhance decision-making transparency, and strengthen public trust in institutions [6]. For these reasons, digitalization is increasingly recognized not only as a driver of technological advancement but also as a strategic instrument for promoting long-term sustainable economic growth, social inclusion, and the modernization of public administration [11,12].
However, the effective management and oversight of digital capabilities require accurate and multidimensional measurement tools. Several indices monitor and assess the level of digitalization, providing objective evaluations of countries’ digital readiness. The most prominent include the NRI, which evaluates the deployment and use of digital technologies across sectors [13,14,15]; the DESI, which tracks EU countries’ progress in connectivity, digital skills, and e-government [1,6,16,17,18,19]; the GII, which assesses innovation capacity and implementation [3,20,21,22]; and the World Digital Competitiveness Ranking (WDCR), which measures digital technological competitiveness [23,24]. Additional indices include the AIRI [25], the Digital Quality of Life Index (DQL) [26], the OECD Digital Government Index (DGI) [27], and the E-Government Development Index (EGDI) [28], each offering a distinct perspective on a country’s digital performance from technical, societal, and institutional perspectives. These indices provide complementary insights into countries’ digital readiness, covering aspects such as technological infrastructure, digital skills, innovation potential, and the level of e-governance. Due to their multidimensional nature, they serve as reliable tools for assessing countries’ ability to leverage digital tools in support of inclusive and sustainable development.
Methodologically, selecting the right digital readiness indicators is crucial for understanding broader development dynamics. This study focuses on the NRI because it offers not only a comprehensive view of digital maturity across four key pillars—Technology, People, Governance, and Impact—but also includes sub-indicators directly related to the SDGs. This makes it well-suited to our analytical framework, which aims to bridge the digital and sustainability domains using a comparative, cluster-based approach.

2.2. Digitalization and Its Influence on the SDGs

Digital technologies can contribute to the achievement of the SDGs in various ways, with their potential most evident in areas such as health, education, energy, gender equality, and sustainable cities:
  • Good Health and Well-Being (SDG 3)–Digital transformation in healthcare improves access to services through telemedicine, artificial intelligence, and health analytics [29]. Digital solutions also enable more efficient management of healthcare systems and optimize the allocation of resources, including medications [30].
  • Quality Education (SDG 4)–Digital learning platforms and expanded access to online education enhance educational opportunities, enable personalized distance learning, and support lifelong learning [4]. Moreover, digital technologies reduce barriers to education and facilitate inclusive, personalized learning approaches [31].
  • Gender Equality (SDG 5)–Digitalization is a key tool for promoting sustainable social development, particularly by improving access to economic opportunities for disadvantaged groups, such as women [32]. As demonstrated by Takahashi et al. [33], technologies like low-code platforms can promote gender equality by enabling women without technical backgrounds to participate in ICT development and by lowering barriers to the digital labor market.
  • Affordable and Clean Energy (SDG 7)–Digital technologies can improve the efficiency of energy networks and support the integration of renewable energy sources [34]. Smart grid systems and artificial intelligence help optimize energy consumption and reduce CO2 emissions [31].
  • Sustainable Cities and Communities (SDG 11)–Smart cities use digital solutions to optimize transportation, manage waste, and monitor environmental factors [6]. Research shows that digitalization in urban environments can significantly contribute to sustainable development—particularly by lowering energy consumption, improving public services, and enhancing quality of life—while playing a central role in smart city development [18].
While digitalization offers significant opportunities for sustainable development, it also introduces challenges. Key concerns include digital inequality, data privacy, ethical issues, and environmental impacts. As noted by Ionescu et al. [20], disparities in the digital transformation level across EU countries may hinder SDG progress. Additionally, Pérez-Martínez et al. [4] caution that increased digital technology use can lead to higher energy consumption, greater electronic waste, and negative environmental outcomes. This study focuses on SDG indicators most directly impacted by digital transformation. By integrating digital and SDG metrics into a unified clustering model, this study aims to assess not only digital readiness but also the actual sustainability performance of EU Member States.

2.3. Bibliometric Analysis of Digital Readiness in the Context of the SDGs

Research on digital readiness and its connection to sustainable development has evolved steadily over recent decades. While early contributions were limited, academic interest in this area has grown significantly in recent years. To examine the field’s development and theoretical foundations, a bibliometric analysis was conducted using data from the Web of Science database. The aim was to identify key thematic trends, the most frequently used keywords, and interconnections within the literature—offering a structured overview and highlighting underexplored research gaps. This analysis is not presented in isolation; rather, it underscores the fragmented nature of existing research and the potential for more integrative methodological approaches. It also supports the selection of specific indices (e.g., NRI, GII, DESI) by demonstrating their prominence in recent academic discourse. Thus, the analysis adds both contextual and conceptual clarity to our research design.
The bibliometric query employed a broad set of keywords representing digital readiness indices and their links to sustainability. Using the Topic Search feature, 332 relevant publications from 1994 to 2025 were identified. These works span disciplines including Environmental Sciences, Green Sustainable Technology, Business, Economics, and Management. Keyword co-occurrence was mapped using VOSviewer 1.6.20, applying a minimum threshold of five occurrences. The final map includes 66 keywords, grouped into five clusters (Figure 1).
Each cluster represents a specific research area in which the issue of digital readiness is explored. Specifically:
  • Red cluster (18 keywords)—Focusing on macroeconomic factors and sustainability indicators, this cluster includes concepts such as the following: climate change, covid-19, DESI, digitalization, e-government, economic growth, economic-growth, economy, environmental sustainability, future, indicators, productivity, quality, SDGs, sustainable development, sustainable development goals, technologies, yield.
  • Green cluster (14 keywords)—This cluster reflects quantitative methods of performance evaluation and measurement, including terms such as the following: consumption, data envelopment analysis, digital economy, digital transformation, efficiency, emissions, energy, impact, life-cycle assessment, model, performance, perspective, systems, trends.
  • Blue cluster (13 keywords)—Focusing on digital adoption, barriers, and innovation, this cluster includes terms such as the following: adoption, barriers, business, challenges, circular economy, context, design, dynamics, framework, ICT, information, innovation, technology.
  • Yellow cluster (12 keywords)—This cluster examines the social aspects of digitalization and equal opportunities, including concepts such as the following: corporate social responsibility, DEI, diversity, diversity management, equity, health, inclusion, issues, justice, policy, social sustainability, supply chain management.
  • Violet cluster (9 keywords)—This cluster focuses on the competitiveness and digital development of countries, including terms such as the following: competitiveness, countries, development, GCI, global competitiveness, growth, management, SMEs, sustainability.
Figure 1 presents a bibliometric map illustrating the thematic structure of research on digital readiness and sustainable development. In this visualization, node size corresponds to keyword frequency—larger nodes indicate more commonly occurring terms. The thickness of the lines between nodes indicates the strength of keyword co-occurrence, with thicker lines denoting stronger thematic connections. This map highlights dominant research themes and their interrelations, revealing how digital readiness intersects with broader sustainability issues. Among the most frequently occurring keywords are sustainability, innovation, impact, performance, diversity, model, sustainable development, equity, information, and DEI. These results suggest that sustainability and innovation are central themes at the intersection of digital readiness and broader economic and social development.
By mapping these patterns, the analysis reinforces the relevance of integrating digital and sustainability dimensions within this study. While previous research has often treated digitalization and sustainability as separate domains, there is a noticeable gap in comparative, country-level analyses that explore their alignment or divergence. This study seeks to fill that gap through a structured, data-driven clustering approach that examines the relationship between digital readiness and SDG performance across EU member states.

3. Materials and Methods

This study examines the relationship between digital readiness and sustainable development performance among EU countries using hierarchical cluster analysis. The objective is to identify homogeneous groups of countries with similar profiles based on two dimensions: (i) scores across the four pillars of the NRI—Technology (A), People (B), Governance (C), and Impact (D); and (ii) performance in five SDG-related indicators—SDG 3 (Good Health and Well-Being), SDG 4 (Quality Education), SDG 5 (Women’s Economic Opportunity), SDG 7 (Affordable and Clean Energy), and SDG 11 (Sustainable Cities and Communities). These SDG indicators are drawn from the “SDG Contribution” sub-pillar of the NRI. The NRI is structured into four main pillars, each comprising three sub-pillars. For example, the Technology pillar includes Access, Content, and Future Technologies, while the Governance pillar includes Regulation, Trust, and Inclusion. A full list of sub-pillars and indicators is available in the public NRI dataset and was used to maintain consistency in measurement across countries.
The dataset, sourced from the Network Readiness Index 2024 [15], includes detailed scores for all four pillars and the SDG-related sub-indicators. The analysis covers 26 EU Member States, with the Netherlands excluded due to missing data. All figures reflect performance in 2024, the most recent year available.
Prior to analysis, the dataset was reviewed to ensure completeness and consistency. No imputation or data transformation was applied. Variables were organized into two subsets: NRI pillars and SDG indicators. Each country was assigned corresponding scores. Descriptive statistics and Pearson correlation coefficients (r) were calculated to assess internal relationships and support variable selection for clustering.
Given the multidimensional nature of the NRI, hierarchical cluster analysis was chosen for its ability to uncover latent groupings based on structural similarities. This method is well-suited for comparative policy research and regional digital convergence studies. Ward’s method was used, as it minimizes the total within-cluster variance. The distance between units was calculated using Euclidean distance. This combination is appropriate when working with standardized scores and relatively small sample sizes, as in this study.
The analysis produced two parallel country classifications: one based on digital readiness (across the four NRI pillars) and another based on sustainable development contributions (using the selected SDG indicators).
To determine the optimal number of clusters, the Duda–Hart index (Je(2)/Je(1)) and the associated pseudo-T2 statistic were applied. These metrics identify the point at which further merging of clusters yields diminishing returns. Specifically, Je(1) denotes the within-cluster sum of squares for the original cluster, while Je(2) refers to the total within-cluster sum of squares after splitting into two clusters. The ratio Je(2)/Je(1) represents the relative change in within-cluster variability between clustering stages, and the pseudo-T2 statistic evaluates the separation between the merged clusters. Lower pseudo-T2 values, combined with peaks in the Duda–Hart index, suggest optimal breakpoints. These criteria were selected to ensure robust and interpretable cluster solutions. This procedure enabled the identification of the optimal number of clusters for both the NRI pillar structure and the SDG indicators.
The resulting clusters were visualized using heatmaps, dendrograms, and cartographic maps, providing both statistical and geographical perspectives. A comparative analysis was then conducted to evaluate the alignment and divergence between country groupings based on digital readiness and those based on SDG performance. To assess the relationship between these two classification frameworks, Spearman’s rank correlation coefficient (rs) was calculated, providing a non-parametric measure of the monotonic association between country rankings across the two sets of clusters.
The entire methodological process—from data selection and preparation, through correlation diagnostics and clustering—was designed for clarity, reproducibility, and analytical consistency. A visual overview of this process is provided in Figure 2 (methodological flowchart). While this study does not incorporate predictive econometric or machine learning models, the chosen classification approach yields meaningful country typologies based on statistical relationships. Future extensions may consider advanced methods such as latent profile analysis, mixture modeling, or dynamic clustering techniques to capture temporal patterns and deepen theoretical insight into the digital–sustainability nexus.
By comparing the two classification results (NRI vs. SDG), the study explores the extent to which digital maturity aligns with sustainable development outcomes and highlights patterns of convergence and divergence across EU countries.
The data were processed using professional statistical software, such as Microsoft Excel, Statistica 14, and Stata 18. However, the methodology is fully transferable and can be implemented using any standard statistical tool.

4. Results

This section presents the empirical findings of the study, following the structure of the analytical framework. It begins with a correlation analysis to examine statistical relationships between the four main pillars of digital readiness (as defined by the NRI) and five selected SDG indicators. This step assesses the internal coherence of the NRI and explores whether countries with higher levels of digital maturity also demonstrate stronger performance in specific sustainability domains.
Building on these results, hierarchical cluster analysis is applied to group countries based on two dimensions: (i) their digital readiness profiles and (ii) their performance on the selected SDG indicators. The resulting clusters are then compared to identify patterns of convergence or divergence between digitalization and sustainability outcomes. This comparative approach enables an evaluation of how closely digital readiness aligns with SDG achievement at the national level.

4.1. Correlation Analysis

Before conducting the cluster analysis, a correlation analysis was performed to explore the relationships between the four main pillars of the NRI (Technology (A), People (B), Governance (C), and Impact (D)) and selected SDGs (SDG 3, SDG 4, SDG 5, SDG 7, and SDG 11). This analysis served two purposes: first, to assess the internal consistency and interconnection among the NRI pillars; and second, to evaluate whether higher digital maturity corresponds with stronger sustainability performance.
The analysis used the scores for each variable to accurately reflect the intensity of differences across countries. Relationships were assessed using Pearson correlation coefficients, providing the statistical foundation for the subsequent cluster analysis and enabling a test of Hypothesis 1—that a country’s digital readiness is significantly linked to its ability to contribute to the SDGs.
The results are summarized in Table 1, which presents the Pearson correlation coefficients between the four NRI pillars and the selected SDG indicators. Correlation coefficients above 0.70 are interpreted as strong positive correlations, values between 0.40 and 0.69 as moderate correlations, and values below 0.40 as weak or insignificant correlations.
The correlation matrix (Table 1) indicates strong internal consistency among the NRI pillars. The highest correlation was observed between the Technology pillar and the Impact pillar (r = 0.8312), suggesting a close link between technological advancement and the societal outcomes of digitalization. Significant correlations also emerged between other pillars, for example, between the Technology and People pillars (r = 0.8249) and between the Governance and Impact pillars (r = 0.7570). These findings confirm that the four pillars form a cohesive and interconnected framework of digital readiness. Despite these strong interrelationships, no correlation approaches perfect multicollinearity (r = 1.0), indicating that each pillar contributes uniquely. Importantly, each pillar shows a distinct pattern of association with the SDG indicators, reinforcing the multidimensional nature of the digital–sustainability relationship.
These findings confirm that each NRI pillar captures a distinct dimension of digital readiness: Technology (A) reflects infrastructure, People (B) denotes human capital and digital skills, Governance (C) pertains to regulatory quality, and Impact (D) represents the societal and economic effects of digitalization. The high inter-pillar correlations indicate internal consistency without suggesting statistical redundancy or collinearity. Each pillar offers a unique but complementary perspective on a country’s digital maturity.
Regarding the relationships between the digital pillars and selected SDGs, the most significant link was observed between the Impact pillar (D) and SDG 11 (r = 0.7647). Similarly, the Technology pillar (A) also showed a strong correlation with SDG 11 (r = 0.7456), suggesting that digitally advanced countries are more capable of fostering the development of smart and sustainable cities. Moderate-to-strong correlations between SDG 11 and the other two pillars reinforce the idea that digital capacity, governance, and human capital collectively support urban sustainability.
Strong correlations were identified between the Technology pillar (A) and SDG 3 (r = 0.7079), as well as between the Governance pillar (C) and SDG 4 (r = 0.7119). These findings suggest that countries’ digital readiness—particularly in the areas of technology and governance—may be a relevant predictor of their performance in key areas of sustainable development. This supports the assumption that investments in digital infrastructure and public services can enhance not only economic outcomes but also access to education and healthcare.
In contrast, the correlation between the Governance pillar (C) and SDG 3 (r = 0.3866) is relatively low. This weak association may indicate that the quality of digital governance and the regulatory environment do not have a direct or immediately measurable impact on health outcomes. Instead, health performance is likely shaped by broader structural factors such as healthcare system financing, demographic profiles, and long-term public health policies—elements that extend beyond the scope of digital governance. Moreover, while digital tools may contribute to more efficient healthcare delivery, their influence may not be fully captured by aggregate indicators such as SDG 3.
SDG 5 consistently shows a moderately strong positive correlation with all four NRI pillars (ranging from 0.53 to 0.59). This suggests that higher digital readiness—across all dimensions—is generally associated with improved conditions for women’s economic participation. Digitalization may facilitate this by expanding access to flexible work, digital entrepreneurship, and inclusive service platforms, thereby helping to reduce structural barriers in the labor market.
In contrast to other SDGs, SDG 7 shows no statistically significant correlation with any of the NRI pillars. For example, the correlation coefficient with the Technology pillar (A) is almost zero (r = −0.0091); with the People pillar (B), it is slightly negative (r = −0.1634); and neither the Governance pillar (C) (r = −0.0801) nor the Impact pillar (D) (r = 0.1047) shows a statistically significant relationship with SDG 7. These findings suggest that a country’s degree of digitalization is not yet directly linked to its performance in the energy transition. This disconnect may stem from the fact that renewable energy development, energy efficiency improvements, and emissions reduction are primarily driven by environmental, industrial, and infrastructure policies, which are not always aligned with national digital strategies. Moreover, the clean energy transition often requires long-term investment in physical infrastructure, which is not necessarily tied to the digital maturity of a country’s population, government, or economy. The weak correlations, therefore, highlight a potential thematic disconnection between the digital agenda and the green transition while also emphasizing the need for better integration of these domains in national policy frameworks. Although digital tools—such as smart grids, AI-based energy management, and digital solutions for renewables—have the potential to accelerate progress on SDG 7, this potential is not yet systematically reflected in actual performance data [35].
These findings also illustrate that SDGs vary in their sensitivity to digital readiness. While goals like SDG 3, SDG 4, SDG 5, and SDG 1 show clear positive associations with digital indicators, SDG 7 remains largely disconnected from digital performance metrics. This highlights the importance of a differentiated and goal-specific approach when evaluating the digital–sustainability nexus.
The next phase of analysis—hierarchical cluster analysis—builds on these findings by identifying groups of countries with similar profiles in terms of both digital readiness (NRI) and SDG performance. This approach reveals regional patterns, typologies, and potential development trajectories while also providing a foundation for targeted policy recommendations that account for differences in digital capacity and socio-environmental needs.

4.2. Cluster Analysis

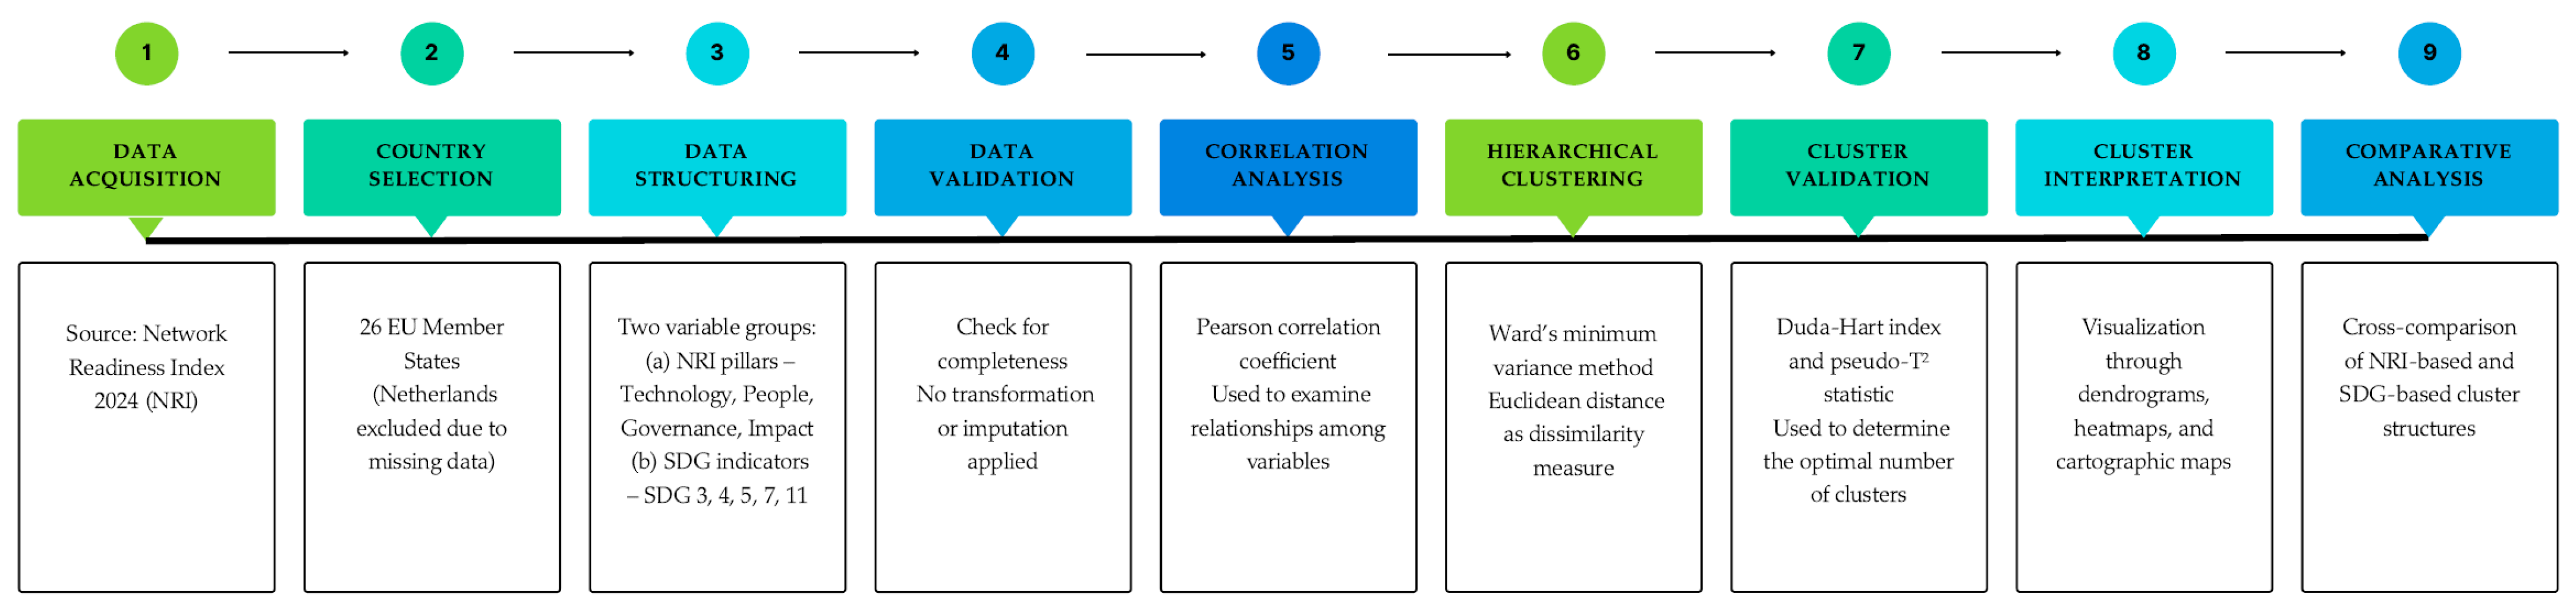
Following the correlation analysis—which identified statistically significant relationships between the pillars of digital readiness (NRI) and selected SDGs—a hierarchical cluster analysis was conducted. The objective was to group countries into homogeneous clusters based on two dimensions: (1) their digital profiles (Pillars A–D of the NRI) and (2) their performance in relation to selected SDGs (SDG 3, SDG 4, SDG 5, SDG 7, and SDG 11).
This clustering approach offers a deeper understanding of regional patterns, highlighting similarities and differences among EU countries in terms of both digital maturity and sustainability performance. It also provides a valuable framework for identifying digital and sustainability “leaders” and “laggards” across the region. Moreover, the results serve as a practical foundation for designing targeted policies that address the specific development needs of different country groups—helping to align digital transformation with the SDG agenda more effectively.
The next section presents the results of two separate clustering procedures: one based on the four NRI pillars and the other on the selected SDG indicators. The results are interpreted based on the dendrogram outputs and the distribution of countries across the clusters.

4.2.1. Cluster Analysis Considering Pillars of NRI

We first focused on the four main pillars of the NRI: Technology, People, Governance, and Impact. To determine the optimal number of clusters in the hierarchical cluster analysis, we used the Duda–Hart index in combination with the pseudo-T² value. This method identifies the most meaningful cluster distribution based on changes in the Duda–Hart index (Je(2)/Je(1)), where a higher index value and a simultaneously lower pseudo-T² value indicate the optimal number of clusters. Table 2 shows that the most significant breakpoint occurred when dividing countries into seven clusters, which was subsequently used for further analysis and interpretation.
A dendrogram was generated based on the cluster analysis (Figure 3) to visually represent similarities among EU countries across the four pillars of the NRI (Technology, People, Governance, Impact). This hierarchical tree diagram groups countries according to their standardized scores on these pillars, using Ward’s method to minimize within-cluster variance and Euclidean distance as the dissimilarity metric. In the dendrogram, countries connected at lower levels of the hierarchy exhibit greater similarity in their digital development, while those joined higher up are more distinct. The optimal number of clusters—determined to be seven—was identified using the Duda–Hart index and pseudo-T2 statistics, and is indicated by the main horizontal cut in the dendrogram. Each resulting cluster was then analyzed based on the average NRI scores for its member countries, reflecting their digital performance in 2024. Vertical line lengths in the dendrogram illustrate the degree of difference between clusters, and labeled boxes were added to enhance the clarity of country groupings.
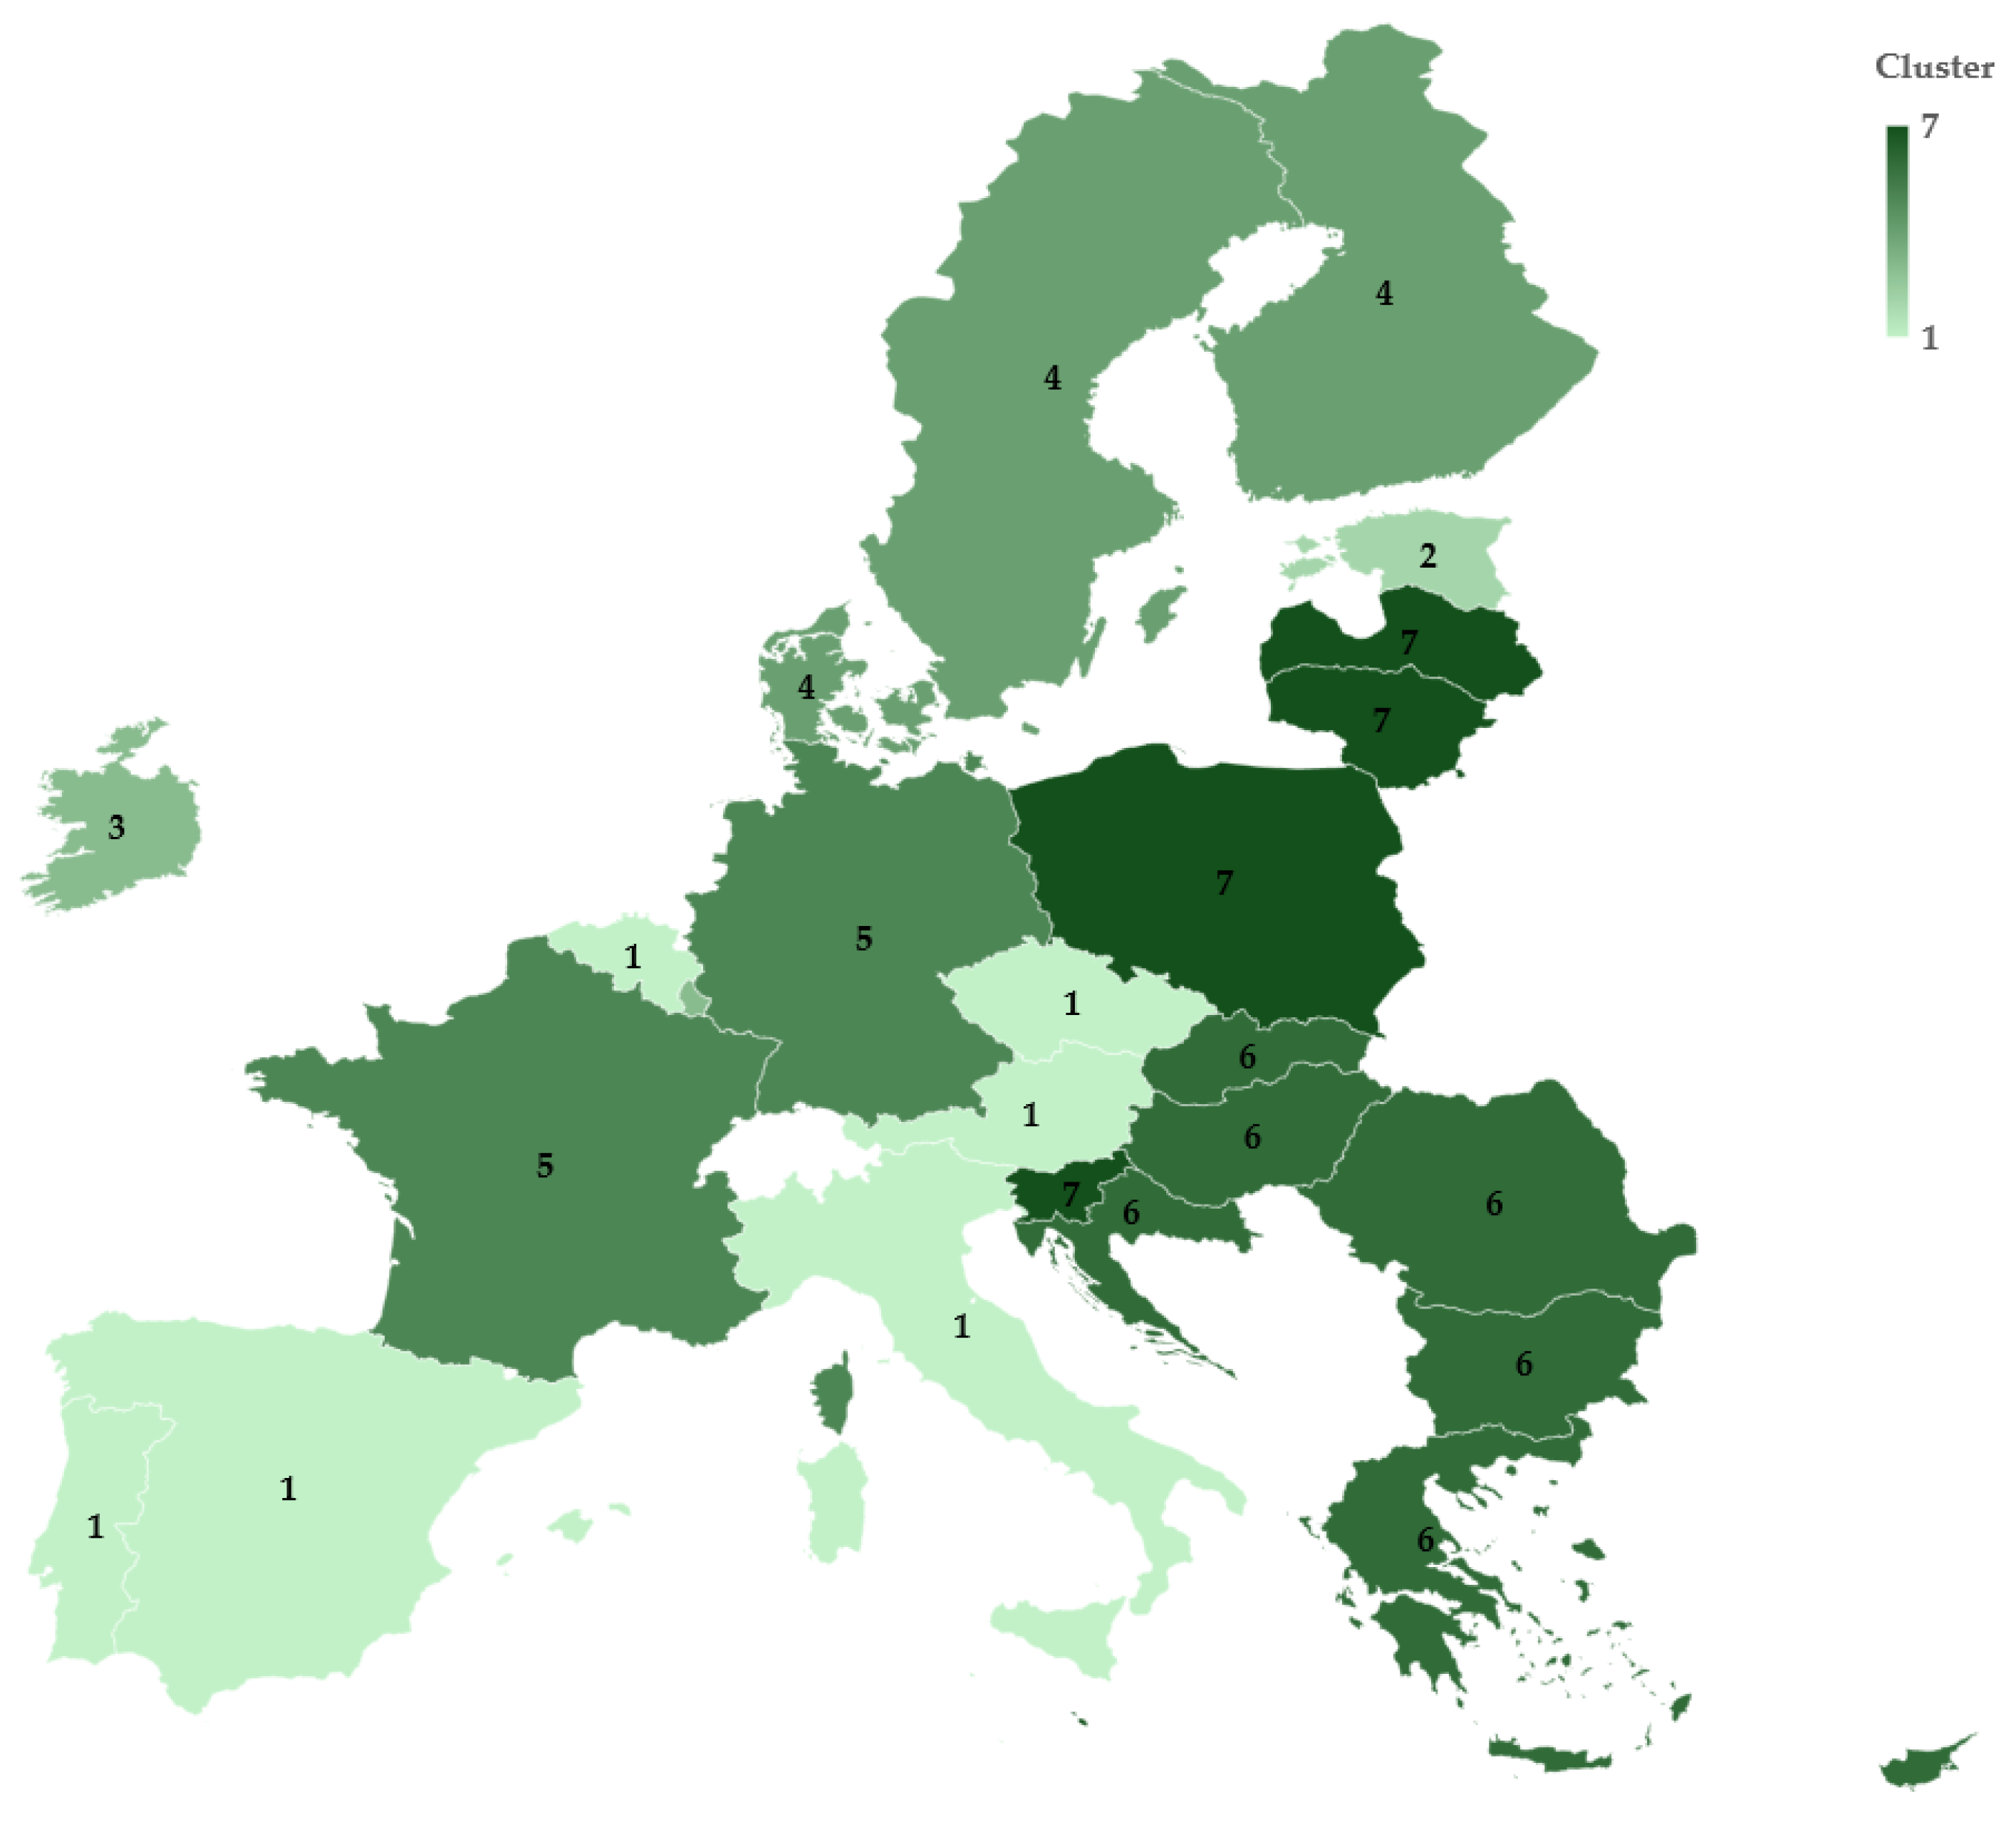
To complement the dendrogram, a cartogram (Figure 4) was created to visualize the geographic distribution of digital readiness clusters. This map-based visualization illustrates how countries are grouped spatially, revealing regional patterns and potential commonalities in digital development. The use of color-coding for clusters enables quick identification of regional concentrations of digitally advanced or lagging countries. While the dendrogram highlights structural similarities, the cartogram emphasizes the spatial dimension, offering insight into how digital readiness aligns—or diverges—from regional or continental boundaries.
To better understand the structure of the identified clusters, the average values of the four NRI pillars (Technology, People, Governance, and Impact) were calculated for each group. These values are presented in Table 3, accompanied by a color-coded heatmap that offers a quick visual summary of each cluster’s strengths and weaknesses. The heatmap uses color gradients to indicate relative performance across the dimensions of digital readiness, with greener shades representing higher scores. This visualization facilitates rapid identification of which dimensions are most dominant within each cluster, helping to highlight key areas of digital maturity or deficiency across the EU country groupings.
The results of the cluster analysis indicate that Cluster 4 and Cluster 5 achieve the highest average scores across most NRI pillars. Cluster 4 (Denmark, Finland, Sweden) emerges as one of the top-performing groups, with the highest score in the Governance pillar (89.06) and very high scores in the Impact pillar (81.30) and the People pillar (59.70). Its Technology pillar score (67.87) is also well above average. This cluster represents comprehensively digitally advanced countries, marked by strong institutions, widespread societal benefits from digitalization, robust digital infrastructure, and a digitally skilled population. These countries are likely among Europe’s digital leaders and may serve as models for other regions. Their well-balanced digital profile positions them to lead in promoting best practices in digital transformation, smart governance, and the integration of technology into sustainable development strategies.
Cluster 5 (France, Germany) is similarly high-performing, with the highest scores in the Technology pillar (68.72) and the People pillar (62.02), indicating exceptional digital infrastructure and human capital. Its Governance pillar (81.12) and Impact pillar (72.65) scores, while slightly lower than those of Cluster 4, remain well above average. This cluster likely represents countries with advanced technology sectors and highly skilled populations but with relatively less maturity in institutional governance or in the broader societal application of digital tools. These countries could benefit from enhanced policy coordination and a stronger focus on maximizing the regulatory and societal impact of digital technologies.
In contrast, Cluster 6 and Cluster 7 show the lowest performance across most NRI pillars. Cluster 6 (Bulgaria, Croatia, Greece, Cyprus, Hungary, Slovakia, Romania) records the lowest scores in the Technology pillar (45.68), the People pillar (40.94), and the Impact pillar (57.14), indicating limited digital infrastructure, low levels of digital skills, and minimal societal impact of digitalization. While its Governance pillar score (72.05) is the lowest among all clusters, it is not critically low, suggesting that the basic institutional foundations for improvement exist but are not yet being fully leveraged. This cluster would benefit from comprehensive support, particularly in infrastructure development, digital education, and the more effective implementation of digital strategies.
Cluster 7 (Latvia, Lithuania, Malta, Poland, Slovenia) performs slightly better than Cluster 6 but still ranks among the lowest-performing groups. Scores in the Technology pillar (50.15), the People pillar (45.55), and the Impact pillar (63.23) remain well below average. However, its Governance pillar score (78.42) is significantly higher than that of Cluster 6, which may indicate stronger institutional capacities despite slower progress in technology adoption and digital literacy. For this cluster, strengthening the link between policy strategies and tangible actions in education, innovation, and technical infrastructure may be key to improvement. Together, Clusters 6 and 7 comprise the largest number of countries in the dataset (12 out of 27), underscoring the importance of tailored support for these regions to avoid deepening the digital divide within the broader international context.
Cluster 1 and Cluster 3 show slightly above-average to high scores in the Technology pillar (58.57 and 58.72) and the Governance pillar (79.96 and 83.19). Cluster 3 (Ireland, Luxembourg) is particularly interesting, as it has the second-lowest score in the People pillar (45.16), yet demonstrates relatively high scores in the other pillars, including the second-highest score in the Impact pillar (76.24). This suggests a strong technological and institutional foundation, though human capital development remains underdeveloped. These countries may have successfully implemented digital solutions at the system level, yielding tangible social benefits, but they are still lagging in investing in digital skills and broader citizen participation in the digital transformation.
In contrast, Cluster 1 (Austria, Belgium, Italy, Spain, Czech Republic, Portugal) displays a similar performance to Cluster 3 in the Technology pillar (58.57) and the Governance pillar (79.96) but shows a more balanced profile with higher scores in the People pillar (52.22) and the Impact pillar (66.50). This cluster may represent countries with solid, steady progress in all areas of digital readiness, without extremes in either direction. Their performance is stable and balanced, with no major weaknesses but also no outstanding strengths. These countries could be considered the ‘middle class’ of digital development, with the potential to join the digital leaders by focusing on strengthening specific areas, such as increasing the societal impact of digitalization or enhancing the regulatory framework. Overall, Cluster 1 can be seen as a group of countries on a positive trajectory in digital transformation, with balanced capabilities. There remains significant potential for further development, particularly through the strategic intensification of selected pillars. Given their stability and absence of major weaknesses, these countries may be ideal candidates for pilot programs in international cooperation or for testing innovative digital policies within the EU.
Cluster 2 (Estonia) is distinguished by a high score in the Governance pillar (88.28), reflecting strong digital governance, effective institutions, and a well-developed regulatory framework. These outcomes likely stem from long-term strategies focused on public sector digitalization, transparency, cybersecurity, and the protection of digital rights. The People pillar also scores well (60.42), indicating a relatively advanced level of human capital, particularly in terms of digital skills within the population. However, scores in the Technology pillar (53.56) and the Impact pillar (69.12) are slightly below the cluster average, suggesting that, despite strong governance and a digitally prepared population, Estonia’s technological infrastructure and the broader societal impact of digitalization may not yet fully reflect its institutional strengths. This profile points to the need for greater investment in technology and applied innovation to translate institutional capacity into tangible societal benefits.
More broadly, the Governance pillar shows the highest average values across all clusters, highlighting notable progress in digital governance and regulatory development among EU countries.
These results provide a valuable foundation for further analysis of policy implications. They enable targeted interventions in areas where countries are most lagging—such as digital skills development or technological infrastructure—and support the promotion of cooperation among countries with similar digital development profiles.
The cluster analysis confirmed the existence of groups of countries with similar characteristics in terms of digital readiness. The most advanced countries demonstrate high scores across all pillars, which aligns with their strong performance in the selected SDGs. In contrast, less developed countries exhibit notable disparities, particularly in the areas of human capital and the societal impact of digitalization. These insights provide a valuable foundation for designing targeted digital policies and fostering international cooperation among countries with similar development profiles.

4.2.2. Cluster Analysis Considering SDGs

The second part of the cluster analysis focuses on the assessment of selected SDGs, specifically, SDG 3, SDG 4, SDG 5, SDG 7, and SDG 11. The objective was to identify homogeneous groups of EU countries that demonstrate similar performance in these key areas of sustainability.
To determine the optimal number of clusters, the Duda–Hart index was once again applied in combination with the pseudo-T2 statistic. This approach identifies the most appropriate cluster division based on significant changes in the variance ratio and corresponding pseudo-T2 values. As shown in Table 4, a clear breakpoint was observed when dividing into seven clusters, which also aligned with visual patterns identified in the dendrogram (
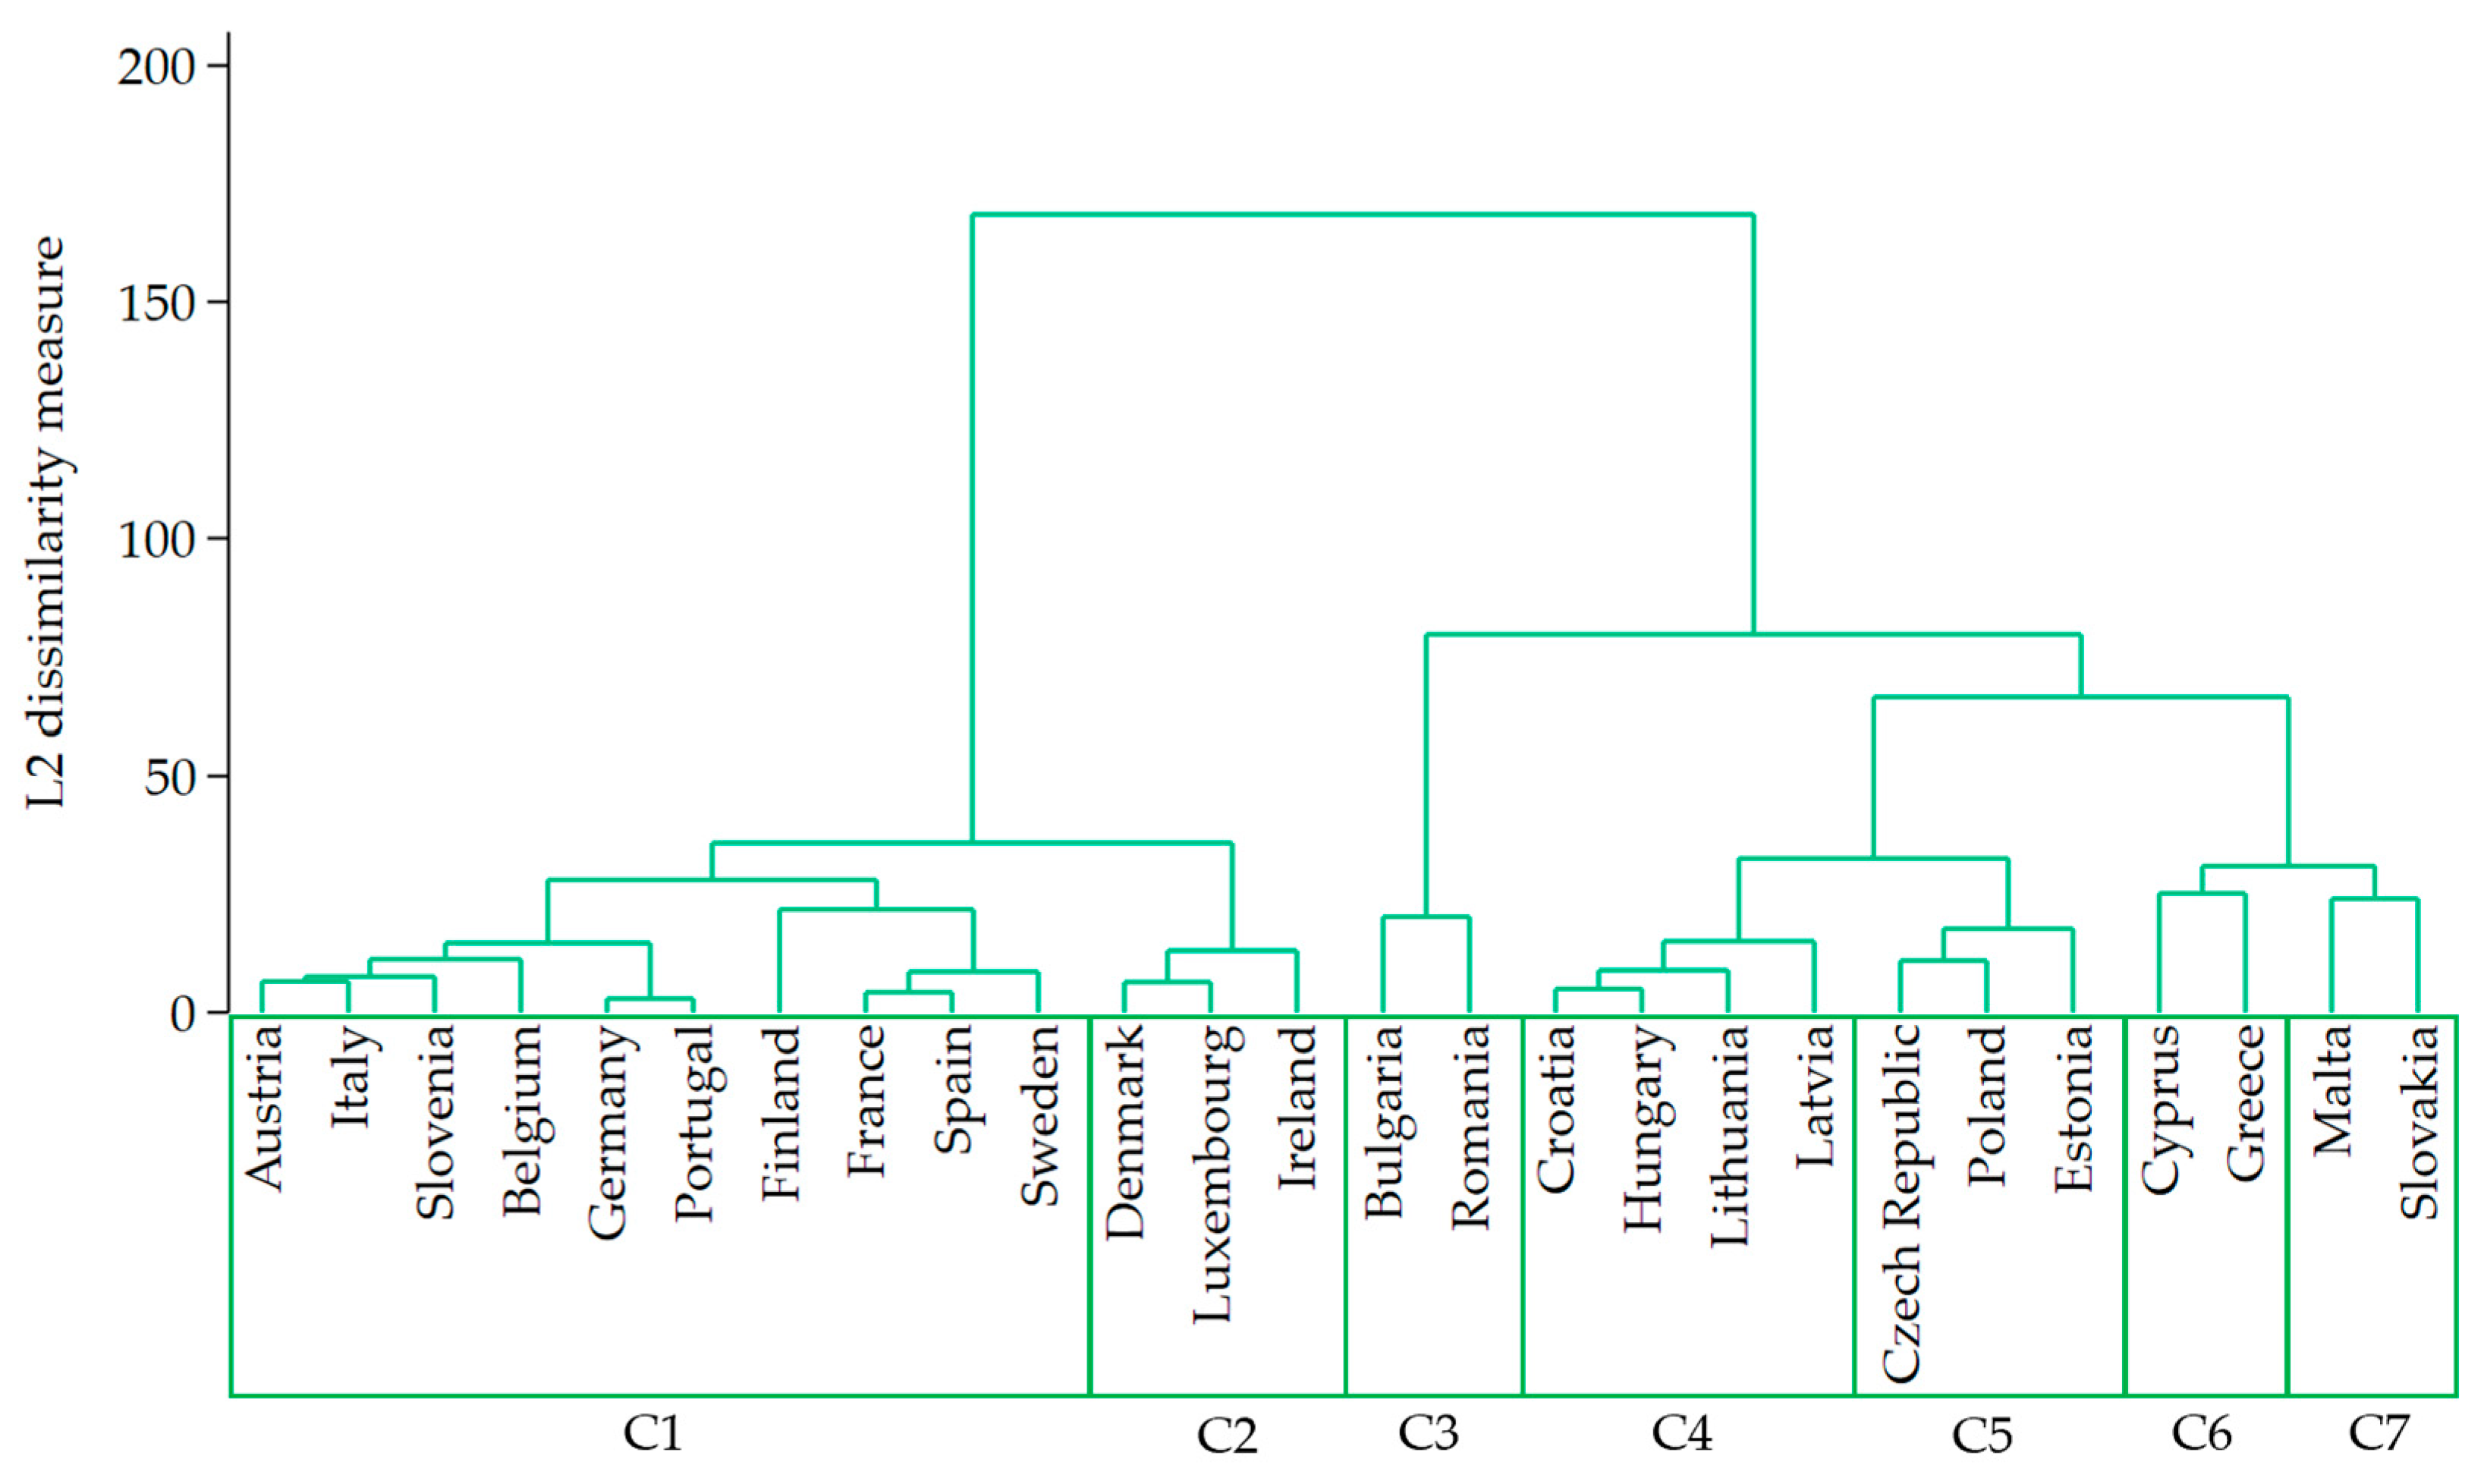
Figure 5). This cluster count was therefore used as the basis for subsequent analysis and interpretation. The dendrogram has been enhanced with labeled boxes to improve the clarity of country groupings within each cluster.
Figure 5 visualizes the hierarchical clustering of countries based on their performance across five SDG-related indicators: SDG 3 (Good Health and Well-Being), SDG 4 (Quality Education), SDG 5 (Women’s Economic Opportunity), SDG 7 (Affordable and Clean Energy), and SDG 11 (Sustainable Cities and Communities). As in the digital readiness analysis, Ward’s method was applied to minimize within-cluster variance, using Euclidean distance as the dissimilarity metric. The dendrogram illustrates how countries group according to similarities in sustainability outcomes. Lower-level branch connections indicate closer alignment, while higher-level merges reflect greater divergence. The optimal number of clusters—set at seven—was determined using the Duda–Hart index and pseudo-
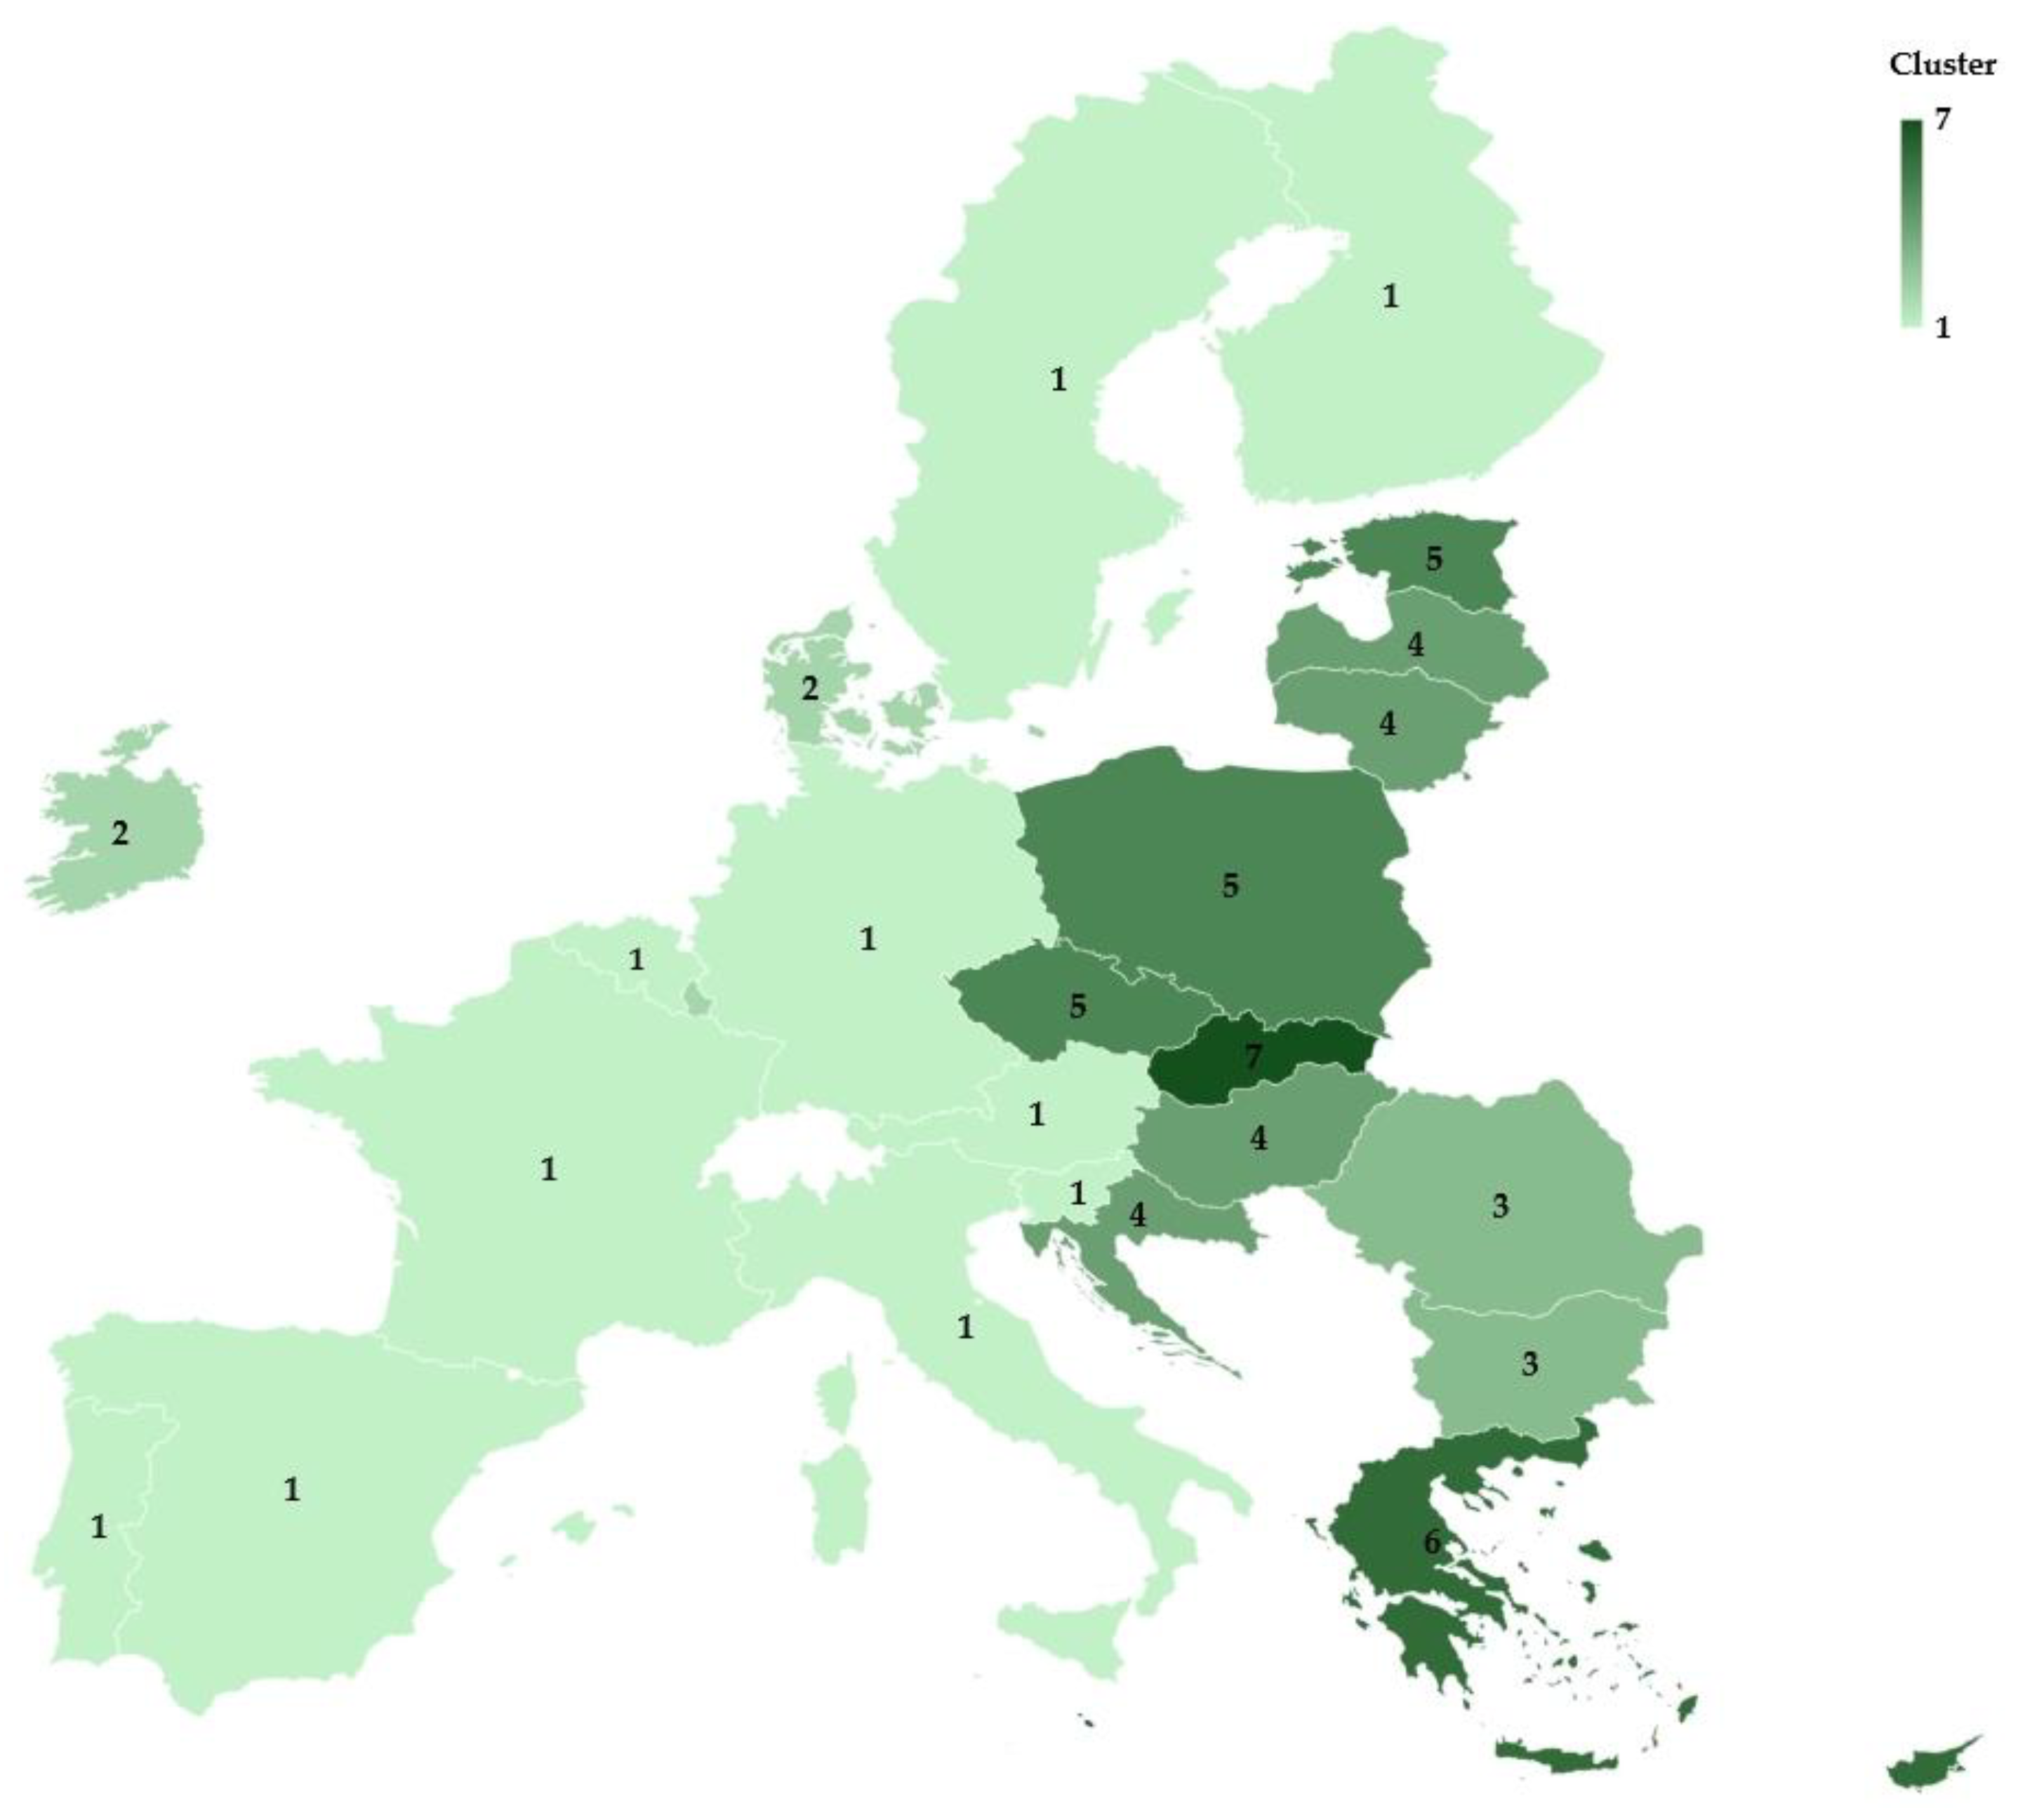
T² statistic, and is also visually evident in the dendrogram’s horizontal segmentation. This clustering structure forms the basis for analyzing common patterns and divergences in sustainability performance among EU countries. All SDG performance data refer to 2024, based on the latest available edition of the NRI. To complement the dendrogram, the clusters are also depicted in a cartogram (Figure 6).
To better understand the performance of individual clusters, a heatmap (Table 5) was created to visualize the average values for each SDG. This graphical representation highlights the strengths and weaknesses of each cluster. Higher values (indicated by dark green) reflect stronger performance by a given group of countries in a specific SDG indicator.
Table 5 shows that the best-performing clusters in terms of the overall average across the selected SDGs are Cluster 1 and Cluster 2. Cluster 2, which includes Denmark, Luxembourg, and Ireland, achieves the highest values in most of the monitored SDG indicators. It stands out particularly in the areas of gender equality (SDG 5), affordable and clean energy (SDG 7), and sustainable cities and communities (SDG 11). These countries demonstrate significant progress in both environmental sustainability and social inclusion. Cluster 1, which includes Austria, Italy, Slovenia, Belgium, Germany, Portugal, Finland, France, Spain, and Sweden, also demonstrates a very strong profile—excelling particularly in SDG 3 and achieving high scores in SDG 5 and SDG 7. This cluster represents a group of traditional sustainability leaders whose performance is consistently high across multiple goals.
On the other hand, Cluster 3 (Bulgaria and Romania) shows the lowest average values in most SDG indicators, particularly in the areas of education (SDG 4: 34.61) and sustainable cities (SDG 11: 47.24). These countries may face structural challenges related to public investment, insufficient social infrastructure, and limited access to quality public services.
Cluster 4, which includes countries such as Croatia, Hungary, Lithuania, and Latvia, shows diverse performance across individual SDG indicators. In health (SDG 3), it achieves a relatively solid score (77.82), as well as in energy (SDG 7: 85.26). However, it shows weaker results in the areas of quality education (SDG 4: 58.18) and sustainable cities (SDG 11: 66.17). This cluster demonstrates balanced, though not outstanding, performance. Countries in this group may still have room for improvement, particularly in social infrastructure and urban development. Investments in local government and a systemic strengthening of education and urban policies could yield significant benefits for these countries.
The countries in Cluster 5 (Czech Republic, Poland, and Estonia) are also notable for their specific performance. While they do not stand out with extreme values, they achieve balanced performance across all SDGs. Notably, they score relatively high in the area of health and have the highest performance among the monitored countries in the area of quality education.
Cluster 6 (Greece and Cyprus) demonstrates a distinctive profile with relatively high scores in energy (SDG 7: 89.11) and sustainable cities (SDG 11: 79.45), reflecting progress in environmental and urban development. However, extremely low scores in education (SDG 4: 34.15) highlight significant challenges in the education system, indicating a pressing need for reforms in human capital development. For this cluster, focusing on education policy reform and its alignment with inclusive growth and digital transformation goals is essential. At the same time, strengths in energy efficiency and urban development provide a solid foundation for integrated development strategies.
Cluster 7, comprising Malta and Slovakia, shows mixed performance—excelling in some areas (SDG 3: 87.90; SDG 7: 88.41) but lagging in others (SDG 5: 85.47; SDG 4: 50.04). This cluster can be described as a “potential challenger”, as these countries have relatively strong results in health and energy but face challenges in promoting gender equality and improving educational outcomes. These countries could benefit from targeted support to build social cohesion, with a particular focus on gender equality and enhancing the quality of education systems.
In conclusion, the cluster analysis using SDG values reveals significant diversity among EU countries in their progress toward selected SDGs. While countries such as Sweden, Denmark, Finland, Luxembourg, Austria, and France achieve exceptionally strong results in areas like energy and social equality, others, including Bulgaria, Romania, Greece, and Cyprus, lag behind, particularly in education and sustainable urban planning. These disparities create opportunities for more targeted EU policies and support tailored to the specific challenges faced by individual countries. The identified clusters can also serve as a foundation for thematic partnerships between countries with similar development profiles within the framework of the 2030 SDG strategy.

4.3. Comparison of Country Classification Based on NRI (Pillars A–D) and SDGs

Following two separate cluster analyses—one based on the four pillars of digital readiness according to the NRI (Technology, People, Governance, Impact), and the other focusing on the performance of countries in selected SDGs (3, 4, 5, 7, and 11)—countries were grouped into clusters that reflect their profiles in either digitalization or sustainability. These classifications enable a comparison of how well digital readiness aligns with sustainable development performance. Table 6 presents the assignment of countries to the respective NRI and SDG clusters.
To assess the degree of alignment between the two classification frameworks, Spearman’s rank correlation was employed to measure the monotonic relationship between countries’ rankings in the digital readiness and SDG performance clusters. The resulting correlation coefficient (rs = 0.526) indicates a moderately strong positive correlation, suggesting that, overall, countries with higher levels of digital maturity tend to achieve above-average results in the selected SDGs. However, this relationship is not strictly linear, and notable deviations from this trend are still observed.
The greatest consistency between the rankings was observed for countries such as Austria, Belgium, Spain, Portugal, Italy, Finland, France, Germany, and Sweden. These countries, which are leaders in digital readiness (Clusters 1, 4, and 5), also perform highly on the SDGs (Cluster 1). Conversely, countries such as Bulgaria, Romania, Slovakia, and Lithuania, which are classified as digitally less advanced (Clusters 6 and 7), also rank lower in the SDG clusters (Clusters 3, 4, 6, and 7). This pattern suggests a potential synergistic relationship between low digital readiness and persistent sustainability challenges. For example, countries such as Bulgaria, Romania, Greece, and Cyprus—belonging to the lower-performing digital clusters (Clusters 6 and 7)—also score low in SDG clusters (Clusters 3, 4, and 6). This alignment is clearly visible in Table 6 and the contingency heatmap (Figure 7), where the co-occurrence of these clusters highlights a convergence of digital and sustainability gaps. While this relationship may not hold uniformly across all countries, the consistency of the pattern in multiple cases indicates a systemic interplay between digital underdevelopment and lagging SDG outcomes.
At the same time, the analysis revealed several interesting deviations. For example, the Czech Republic, despite being placed in one of the best-performing NRI clusters (Cluster 1), falls into the fifth SDG cluster. This discrepancy may suggest that the high level of digitalization has not yet been fully translated into effective use of technologies in areas such as education, health, or urban development. Similarly, Estonia, often considered a digital leader (NRI Cluster 2), is placed in SDG Cluster 5. This points to possible national structural specificities or differences in the way indicators are measured.
On the other hand, Slovenia is an example of a country that, despite being placed in a lower-performing digital cluster (Cluster 7), achieves the highest performance in the SDG area (Cluster 1). This case demonstrates that strong results in areas such as health, social inclusion, and urban sustainability are not necessarily dependent on the current level of digitalization.
These findings are further illustrated by a contingency heatmap (Figure 7), which visualizes the number of countries in each combination of NRI and SDG clusters. The highest concentration—five countries—appears in the combination of NRI Cluster 1 and SDG Cluster 1, indicating a strong alignment between digital readiness and sustainability performance in these cases. Other notable combinations include NRI Cluster 3 and SDG Cluster 2 (Ireland and Luxembourg), NRI cluster 4 and SDG Clusters 1 and 2 (Finland, Sweden, and Denmark), and NRI Cluster 6 and SDG Clusters 4 and 6 (Croatia, Hungary, Greece, and Cyprus). These patterns highlight the presence of developmentally consistent trajectories across multiple countries.
The results of this comparative analysis have important implications for both research and policymaking. First, they demonstrate that digital readiness is an important—but not sufficient—prerequisite for strong SDG performance. What matters most is how digital tools are integrated into broader systemic strategies that address social, environmental, and economic challenges. Second, the divergences between clusters highlight the need for targeted support to countries exhibiting uneven development across the digital and sustainability dimensions. In these cases, adopting innovations from countries excelling in both areas can be an effective approach. Finally, the cluster combinations identified in the heatmap can serve as a foundation for establishing thematic partnerships and networks among countries with similar profiles. Countries such as Sweden, Finland, Germany, and France can serve as models for developing integrated strategies that connect digitalization with sustainable development.

5. Discussion

The cluster analysis confirms a moderately strong, though non-linear, relationship between the digital readiness of EU countries (measured by NRI pillars) and their performance in selected SDGs. The identified clusters highlight disparities in national maturity, shaped not only by the level of digitalization but also by how well it aligns with social and environmental goals. The Spearman correlation coefficient (rs = 0.526) suggests a synergistic effect; however, this relationship is not consistent across all countries and indicators. These findings support those of Vărzaru [16], who highlights the complex interplay between digitalization (measured by DESI) and sustainability in achieving the SDGs, particularly emphasizing the importance of high-quality public digital services and digital skills as key drivers of transformation. Similar conclusions were drawn by Bocean [36] and Brunescienė et al. [37], who stress the need for an integrated approach to digital transformation—one that links technological readiness with inclusive and sustainable development objectives as a foundation for enhancing national competitiveness.
The inclusion of countries such as Sweden, Finland, Denmark, and France in high-performing clusters across both dimensions underscores their ability to convert digital strengths into sustainable outcomes. These countries are distinguished by high levels of public investment, effective institutions, and long-term strategic planning. This aligns with the findings of researchers such as Chaparro-Banegas et al. [38] and Rindasu et al. [39], who have explored the relationship between digital maturity, social inclusion, and innovation ecosystems.
In contrast, countries like the Czech Republic and Estonia show that high digital readiness does not automatically lead to strong sustainability outcomes. In these cases, the imbalance may reflect digital strategies that focus on structural or economic modernization while overlooking social impact. Baranauskas and Raišienė [40] warn of the ‘digital illusion of progress’, where technological advances fail to enhance overall quality of life. Belyaeva and Lopatkova [3] similarly identify four country categories, including ‘catching-up countries’, each following distinct digital and sustainability trajectories.
From the perspective of Clusters 6 and 7 (e.g., Bulgaria, Slovakia, and Lithuania), which perform poorly in both digital readiness and sustainability, strengthening capacities in digital education, technological infrastructure, and the strategic implementation of the SDGs emerges as a key priority. In these countries, digitalization has the potential to serve as a lever for bridging social disparities and accelerating convergence with more advanced EU member states. Lin et al. [41] draw similar conclusions in their study of digitalization’s impact on public service delivery in Central and Eastern European countries.
Slovenia presents an interesting exception. Despite ranking in the lowest NRI cluster, it performs best in terms of SDGs. This suggests substantial progress in sustainability even without top-tier digital readiness, strong public institutions, effective policies, and a tradition of socially oriented governance. Bocean [36] supports this view, emphasizing the long-term value of investments in education, healthcare, and local government.
A key finding of this analysis is that digital maturity—while important—does not, by itself, guarantee high performance on the SDGs. For instance, high technological readiness (Pillar A) shows a positive correlation with SDG 3 (Good Health and Well-Being) and SDG 11 (Sustainable Cities and Communities) but no significant impact on SDG 7 (Affordable and Clean Energy), where the correlation was statistically insignificant or even negative. Similarly, the Governance pillar (Pillar C) shows strong correlation only with specific goals—particularly SDG 4 (Quality Education)—highlighting the role of institutional capacity in developing human capital but not necessarily in shaping health policy. These findings align with Paraschiv et al. [1] and Yu & Huarng [42], who argue that digital transformation tends to have greater influence in education and science-related employment than in healthcare or energy policy.
Another important dimension is digital equality and inclusion. Countries such as Slovakia, Romania, and Bulgaria score low in both the People pillar and Impact pillars, indicating persistent barriers in digital skills, digital participation, and the broader social impact of technologies. This supports finding by Kuś et al. [18], who argue that digital policy must be complemented by systemic support for digital education and expanded access to technology. Similarly, Ionescu-Feleaga et al. [17] warn of a ‘digital paradox’, where technically advanced countries may still fall short in social inclusion and environmental progress.
In this context, the analysis of the regulatory environment and institutional framework is also crucial. As noted by Qazi [14] and Belyaeva and Lopatkova [3], the quality of regulation, the accessibility of the legal environment, and the level of e-governance play a significant role in the integration of digital technologies into sustainability practices.
It is worth expanding the discussion to include the specifics of the activities of digitally advanced countries. As Martusewicz et al. [43] point out, digital capacity can effectively serve to disseminate proven sustainability strategies, but only if it becomes an integral part of public policy and local participation. This insight is particularly relevant for policymaking in countries like Estonia, where strong digital potential is limited by sector-specific policies that lack broader integration.
The results also support the concept of thematic ‘learning alliances’, i.e., clusters of cooperating countries with a similar development profile. Countries from Cluster 5 could serve as ‘benchmarking units’ for less developed countries in Clusters 6 and 7. A similar proposal is made by Noja et al. [31], Esses et al. [44], Miškufová and Jenčová [45], and Jenčová [46], who highlight the effectiveness of joint planning of digitalization and environmental policies within EU regions.
The cluster approach also offers a solution to the challenge of so-called ‘digital fragmentation’, which is discussed by Harangozó and Fakó [2]. They emphasize that the key to reducing regional disparities lies in the creation of strategic alliances with a high degree of coordination and data sharing.
Future research should explore the underlying causes of discrepancies between NRI and SDG classifications, especially in countries like the Czech Republic and Estonia, where notable gaps exist. Longitudinal studies would offer insights into the evolving dynamics of digital readiness and SDG performance over time. Further analysis could also benefit from mixed-method approaches (e.g., combining regression and cluster analysis) and a broader set of SDG indicators, such as SDG 9 (Industry, Innovation, and Infrastructure) and SDG 13 (Climate Action). This study is limited by its reliance on static, single-year data and a restricted selection of SDGs. Additionally, the aggregated nature of indices like the NRI and SDG scores may obscure important national-level differences.

6. Conclusions

This study examined the relationship between digital readiness and sustainable development performance in EU countries using cluster analysis. Based on the pillars of the NRI and selected SDGs (3, 4, 5, 7, and 11), countries were grouped into homogeneous clusters, which allowed us to identify both differences and similarities in the development trajectories of individual countries. We found a moderately strong positive correlation between the two dimensions, indicating their interconnectedness, but also the presence of significant deviations. This research contributes to the literature by offering an integrative, data-driven framework for exploring the intersection between digital readiness and sustainable development. Through a robust clustering methodology, the study identifies regional patterns, asymmetries, and key policy implications within the EU.
These findings show that while digital readiness contributes to higher performance on the SDGs, there is no automatic or direct correlation. The results of the correlation and clustering analyses support Hypothesis 1, confirming that digital readiness and SDG performance are positively related in most cases, although this relationship is not uniform across all countries. The decisive factor is how digital technologies and tools are integrated into public policies and sustainable development strategies. The identified clusters offer more than just a snapshot of the current landscape—they provide a basis for differentiated policy responses and thematic partnerships among countries with similar profiles.
While the findings offer valuable insights, several limitations should be acknowledged. First, the analysis relies solely on NRI data, which, despite its breadth, may not fully capture sector-specific dimensions of digital transformation. Second, the clustering outcomes are influenced by the selected indicators and methodological choices. Although standard hierarchical methods were applied using rigorous criteria (Duda–Hart index, pseudo-T²), alternative techniques might yield different groupings. Additionally, the use of cross-sectional data from a single year (2024) limits the ability to assess trends over time.
Future research could build on these findings by incorporating multi-year data to explore the temporal dynamics of convergence or divergence in digital and sustainability performance. In addition, extending the analysis to other world regions, applying network or machine learning methods to classification, or integrating qualitative institutional variables (e.g., governance models or innovation ecosystems) could further enrich the understanding of how digital readiness relates to sustainable development. A deeper sectoral or local-level focus may also uncover policy-relevant insights that are not visible at the country level.

Author Contributions

Conceptualization, M.K.; methodology, M.K. and P.V.; software, M.K. and P.V.; validation, M.K. and P.V.; formal analysis, M.K. and P.V.; investigation, M.K. and P.V.; resources, M.K.; data curation, M.K. and P.V.; writing—original draft preparation, M.K. and P.V.; writing—review and editing, M.K. and P.V.; visualization, M.K. and P.V.; supervision, M.K. and P.V.; project administration, M.K. and P.V.; funding acquisition, M.K. and P.V. All authors have read and agreed to the published version of the manuscript.

Funding

This research was funded by the EU NextGenerationEU through the Recovery and Resilience Plan for Slovakia under the project No. 09I03-03-V05-00006.

Institutional Review Board Statement

Not applicable.

Informed Consent Statement

Not applicable.

Data Availability Statement

For requests concerning the data, please contact the corresponding author.

Conflicts of Interest

The authors declare no conflicts of interest.

Abbreviations

The following abbreviations are used in this manuscript:
AIRIAI Readiness Index
DESIDigital Economy and Society Index
EUEuropean Union
GIIGlobal Innovation Index
ICTInformation and Communication Technologies
NRINetwork Readiness Index
SDGSustainable Development Goal

References

  1. Paraschiv, D.M.; Atif, M.; Petrariu, I.-R.; Gheorghe, M.; Dieaconescu, R.I.; Istudor, M. Shaping Europe’s digital and Sustainable Future: Analysis of the Digital Economy and Society Index in the pre- and post-pandemic period. Amfiteatru Econ. 2024, 26, 1012. [Google Scholar] [CrossRef]
  2. Harangozó, G.; Fakó, P. Relationship between the Desi and the SDG index in the European Union with a special focus on the Visegrad Group countries. Reg. Stat. 2024, 14, 1187–1221. [Google Scholar] [CrossRef]
  3. Belyaeva, Z.S.; Lopatkova, Y.A. Cluster assessment of European countries in terms of digitalisation and sustainable development. Econ. Reg. 2023, 19, 1–14. [Google Scholar] [CrossRef]
  4. Pérez-Martínez, J.; Hernandez-Gil, F.; San Miguel, G.; Ruiz, D.; Arredondo, M.T. Analysing associations between digitalization and the accomplishment of the Sustainable Development Goals. Sci. Total Environ. 2023, 857, 159700. [Google Scholar] [CrossRef] [PubMed]
  5. Nosratabadi, S.; Atobishi, T.; Hegedűs, S. Social Sustainability of Digital Transformation: Empirical evidence from EU-27 countries. Adm. Sci. 2023, 13, 126. [Google Scholar] [CrossRef]
  6. Garau, C.; Desogus, G.; Stratigea, A. Digitalisation process and sustainable development of vulnerable territories. Assessment of equity potentials of major Mediterranean Islands. Tematema-J. Land Use Mobil. Environ. 2023, 16, 565–593. [Google Scholar] [CrossRef]
  7. Skvarciany, V.; Lapinskaite, I.; Stasytyte, V. Efficiency of digital economy in the context of sustainable development: DEA-Tobit Approach. Prague Econ. Pap. 2023, 32, 129–158. [Google Scholar] [CrossRef]
  8. Magoutas, A.I.; Chaideftou, M.; Skandali, D.; Chountalas, P.T. Digital Progression and economic growth: Analyzing the impact of ICT advancements on the GDP of European Union countries. Economies 2024, 12, 63. [Google Scholar] [CrossRef]
  9. Huang, Y. Digital transformation of enterprises: Job creation or job destruction? Technol. Forecast. Soc. Change 2024, 208, 123733. [Google Scholar] [CrossRef]
  10. Wang, X.; Gu, Y.; Ahmad, M.; Xue, C. The impact of digital capability on Manufacturing Company Performance. Sustainability 2022, 14, 6214. [Google Scholar] [CrossRef]
  11. Tan, N.N.; Ngan, H.T.T.; Hai, N.S.; Anh, L.H. The Impact of Digital Transformation on the Economic Growth of the Countries. In Prediction and Causality in Econometrics and Related Topics. ECONVN 2021. Studies in Computational Intelligence; Ngoc Thach, N., Ha, D.T., Trung, N.D., Kreinovich, V., Eds.; Springer: Cham, Switzerland, 2022; Volume 983, pp. 670–680. [Google Scholar] [CrossRef]
  12. Aleksandrova, A.; Truntsevsky, Y.; Polutova, M. Digitalization and its impact on economic growth. Braz. J. Political Econ. 2022, 42, 424–441. [Google Scholar] [CrossRef]
  13. Hristoski, I.S.; Kostoska, O.B. System dynamics approach for the economic impacts of ICTs: Evidence from Macedonia. Inf. Dev. 2017, 34, 364–381. [Google Scholar] [CrossRef]
  14. Qazi, A. Fostering Economic Development and Sustainability: Insights into the role of regulatory quality and e-commerce legislation in future technologies. Int. J. Innov. Sci. 2025, in press. [Google Scholar] [CrossRef]
  15. Dutta, S.; Lanvin, B. Network Readiness Index 2024; Portulans Institute: Washington, DC, USA, 2024; Available online: https://networkreadinessindex.org/ (accessed on 3 February 2025).
  16. Vărzaru, A.A. Unveiling digital transformation: A catalyst for enhancing food security and Achieving Sustainable Development Goals at the European Union Level. Foods 2024, 13, 1226. [Google Scholar] [CrossRef]
  17. Ionescu-Feleagă, L.; Ionescu, B.-Ș.; Stoica, O.C. The link between digitization and the Sustainable Development in European Union countries. Electronics 2023, 12, 961. [Google Scholar] [CrossRef]
  18. Kuś, A.; Kuflewska, W.; Trocewicz, A. European vision of a gigabit society: Evidence from Poland. Sustainability 2025, 17, 1271. [Google Scholar] [CrossRef]
  19. The Digital Economy and Society Index (DESI). Shaping Europe’s Digital Future. Available online: https://digital-strategy.ec.europa.eu/en/policies/desi (accessed on 3 March 2025).
  20. Ionescu, A.M.; Clipa, A.-M.; Turnea, E.-S.; Clipa, C.-I.; Bedrule-Grigoruță, M.V.; Roth, S. The impact of innovation framework conditions on Corporate Digital Technology Integration: Institutions as facilitators for Sustainable Digital Transformation. J. Bus. Econ. Manag. 2022, 23, 1037–1059. [Google Scholar] [CrossRef]
  21. Ma, X.; Gryshova, I.; Khaustova, V.; Reshetnyak, O.; Shcherbata, M.; Bobrovnyk, D.; Khaustov, M. Assessment of the impact of scientific and technical activities on the economic growth of world countries. Sustainability 2022, 14, 14350. [Google Scholar] [CrossRef]
  22. GII Innovation Ecosystems & Data Explorer. Available online: https://www.wipo.int/gii-ranking/ (accessed on 3 March 2025).
  23. Vorontsova, N.D.; Palesheva, N.V. Analysis of the Modern Methodology of Calculating Consumer Price Index in the Russian Federation and the Perspectives of Its Digital Economy’s Sustainable Development. In Sustainable Development of Modern Digital Economy. Research for Development; Ragulina, J.V., Khachaturyan, A.A., Abdulkadyrov, A.S., Babaeva, Z.S., Eds.; Springer: Cham, Switzerland, 2021; pp. 343–350. [Google Scholar] [CrossRef]
  24. IMD. World Digital Competitiveness Ranking. Available online: https://www.imd.org/centers/wcc/world-competitiveness-center/rankings/world-digital-competitiveness-ranking/ (accessed on 3 March 2025).
  25. Oxford Insights. Government AI Readiness Index. Available online: https://oxfordinsights.com/ai-readiness/ai-readiness-index/ (accessed on 3 March 2025).
  26. Surfshark. Digital Quality of Life Index. Available online: https://surfshark.com/dql2023 (accessed on 3 March 2025).
  27. OECD Going Digital Toolkit. Available online: https://goingdigital.oecd.org/ (accessed on 3 March 2025).
  28. United Nations. E-Government Development Index (EGDI). Available online: https://publicadministration.un.org/egovkb/en-us/About/Overview/-E-Government-Development-Index (accessed on 3 March 2025).
  29. Vărzaru, A.A.; Bocean, C.G.; Simion, D.; Berceanu, D.; Mangra, M.G. Digital Revolution, sustainability, and government revenues: A transversal analysis of how Digital Transformation and Sustainable Practices Impact Sustainable Government revenues. Systems 2023, 11, 546. [Google Scholar] [CrossRef]
  30. Keesara, S.; Jonas, A.; Schulman, K. Covid-19 and Health Care’s Digital Revolution. N. Engl. J. Med. 2020, 382, e82. [Google Scholar] [CrossRef]
  31. Noja, G.G.; Cristea, M.; Panait, M.; Trif, S.M.; Ponea, C.Ș. The impact of Energy Innovations and Environmental Performance on the Sustainable Development of the EU countries in a globalized digital economy. Front. Environ. Sci. 2022, 10, 934404. [Google Scholar] [CrossRef]
  32. Jovanović, M.; Dlačič, J.; Okanović, M. Digitalization and Society’s Sustainable Development—Measures and implications. Proc. Rij. Fac. Econ. J. Econ. Bus. 2018, 36, 905–928. [Google Scholar] [CrossRef]
  33. Takahashi, N.; Javed, A.; Kohda, Y. How low-code tools contribute to diversity, equity, and inclusion (DEI) in the workplace: A case study of a large Japanese Corporation. Sustainability 2024, 16, 5327. [Google Scholar] [CrossRef]
  34. Hwang, Y.K. The synergy effect through combination of the digital economy and transition to renewable energy on Green Economic Growth: Empirical Study of 18 Latin American and Caribbean countries. J. Clean. Prod. 2023, 418, 138146. [Google Scholar] [CrossRef]
  35. Kittner, N.; Lill, F.; Kammen, D.M. Energy storage deployment and innovation for the clean energy transition. Nat. Energy 2017, 2, 1–6. [Google Scholar] [CrossRef]
  36. Bocean, C.G. Sustainable development in the digital age: Harnessing Emerging Digital Technologies to catalyze global SDG achievement. Appl. Sci. 2025, 15, 816. [Google Scholar] [CrossRef]
  37. Bruneckienė, J.; Rapsikevičius, J.; Lukauskas, M.; Zykienė, I.; Jucevičius, R. Smart Economic Development Patterns in Europe: Interaction with competitiveness. Compet. Rev. Int. Bus. J. 2021, 33, 302–331. [Google Scholar] [CrossRef]
  38. Chaparro-Banegas, N.; Ibañez Escribano, A.M.; Mas-Tur, A.; Roig-Tierno, N. Innovation Facilitators and Sustainable Development: A country comparative approach. Environ. Dev. Sustain. 2023, 26, 8467–8495. [Google Scholar] [CrossRef]
  39. Rindasu, S.-M.; Ionescu-Feleaga, L.; Ionescu, B.-S.; Topor, I.D. Digitalisation and skills adequacy as determinants of innovation for Sustainable Development in EU countries: A PLS-SEM approach. Amfiteatru Econ. 2023, 25, 968. [Google Scholar] [CrossRef]
  40. Baranauskas, G.; Raišienė, A.G. Transition to digital entrepreneurship with a quest of Sustainability: Development of a new conceptual framework. Sustainability 2022, 14, 1104. [Google Scholar] [CrossRef]
  41. Lin, Z.; Tarasova, O.; Lomakina, O.; Li, O.; Gribkova, I. Public services: Forced digitalization in a pandemic—The nuances of management. Lex Localis—J. Local Self-Gov. 2023, 21, 93–116. [Google Scholar] [CrossRef] [PubMed]
  42. Yu, T.H.-K.; Huarng, K.-H. Causal analysis of SDG achievements. Technol. Forecast. Soc. Change 2024, 198, 122977. [Google Scholar] [CrossRef]
  43. Martusewicz, J.; Wierzbic, A.; Łukaszewicz, M. Strategic transformation and sustainability: Unveiling the EFQM model 2025. Sustainability 2024, 16, 9106. [Google Scholar] [CrossRef]
  44. Esses, D.; Csete, M.S.; Németh, B. Sustainability and digital transformation in the Visegrad Group of Central European countries. Sustainability 2021, 13, 5833. [Google Scholar] [CrossRef]
  45. Miškufová, M.; Jenčová, S. Digitalizácia v rámci krajín V4 (en: Digitalization within V4 Countries). In Život v Post Covidovom Období: Nové Možnosti a Príležitosti pre Udržateľný Rozvoj a Elimináciu Bankrotov, 1st ed.; Šofranková, B., Horváthová, J., Mokrišová, M., Eds.; Bookman: Prešov, Slovakia, 2023; Volume 1, pp. 105–111. [Google Scholar]
  46. Jenčová, S. DESI ako cesta priblíženia sa digitálnej transformácii Európskej únie (en: DESI as a Way to Approach the Digital Transformation of the European Union). In Financie, Účtovníctvo, Matematické Metódy: Analýzy a Trendy, 1st ed.; Jenčová, S., Vašaničová, P., Eds.; Bookman: Prešov, Slovakia, 2021; Volume 1, pp. 40–48. [Google Scholar]
Figure 1. Bibliometric map of keyword occurrence.
Sustainability 17 05080 g001
Figure 2. Methodological workflow of the study.
Sustainability 17 05080 g002
Figure 3. Dendrogram when considering pillars of NRI. Note: C1–C7 denote designations from Cluster 1 to Cluster 7.
Sustainability 17 05080 g003
Figure 4. Cartogram when considering pillars of NRI. Note: Numbers 1–7 denote designations from Cluster 1 to Cluster 7.
Sustainability 17 05080 g004
Figure 5. Dendrogram when considering SDGs. Note: C1–C7 denote designations from Cluster 1 to Cluster 7.
Sustainability 17 05080 g005
Figure 6. Cartogram when considering SDGs. Note: Numbers 1–7 denote designations from Cluster 1 to Cluster 7.
Sustainability 17 05080 g006
Figure 7. Contingency heatmap. Higher values are shown in greener shades.
Sustainability 17 05080 g007
Table 1. Pearson correlation coefficients.
VariableABCDSDG 3SDG 4SDG 5SDG 7SDG 11
A. Technology pillar1.00000.82490.74920.83120.70790.49350.5929−0.00910.7456
B. People pillar 1.00000.69870.72370.52740.58130.5326−0.16340.5654
C. Governance pillar 1.00000.75700.38660.71190.5362−0.08010.6897
D. Impact pillar 1.00000.62830.56510.53330.10470.7647
SDG 3: Good Health and Well-Being 1.00000.41820.38280.14350.7907
SDG 4: Quality Education 1.00000.4099−0.03760.4656
SDG 5: Women’s Economic Opportunity 1.00000.26560.6001
SDG 7: Affordable and Clean Energy 1.00000.2725
SDG 11: Sustainable Cities and Communities 1.0000
Note: values in bold indicate statistically significant correlations.
Table 2. Duda–Hart Index considering pillars of NRI.
Number of Clusters123456789101112131415
Je(2)/Je(1)0.4080.4970.5220.5930.3910.4210.6080.0000.3510.4180.4820.0000.1600.2850.255
Pseudo-T234.8212.179.164.814.686.873.22 5.542.784.29 5.232.515.85
Note: values in bold indicate the most significant breakpoint.
Table 3. Map of average NRI pillar scores by cluster.
VariableCluster 1Cluster 2Cluster 3Cluster 4Cluster 5Cluster 6Cluster 7
Technology pillar58.5753.5658.7267.8768.7245.6850.15
People pillar52.2260.4245.1659.7062.0240.9445.55
Governance pillar79.9688.2883.1989.0681.1272.0578.42
Impact pillar66.5069.1276.2481.3072.6557.1463.23
Note: Higher values are shown in greener shades, while lower values are shown in redder shades. Cluster numbers correspond to those displayed in the dendrogram (Figure 3) and the cartogram (Figure 4). Each number represents one of the seven identified clusters based on the four NRI pillars.
Table 4. Duda–Hart Index considering SDGs.
Number of Clusters123456789101112131415
Je(2)/Je(1)0.6160.6280.5630.6570.4680.5620.6070.0000.0000.1800.0000.2830.3290.5880.202
Pseudo-T214.976.516.995.745.681.565.18 9.13 2.544.082.83.96
Note: values in bold indicate the most significant breakpoint.
Table 5. Map of average SDGs scores by cluster.
VariableCluster 1Cluster 2Cluster 3Cluster 4Cluster 5Cluster 6Cluster 7
SDG 3: Good Health and Well-Being91.2986.5675.0077.8284.9580.6587.90
SDG 4: Quality Education60.3363.3134.6158.1867.1534.1550.04
SDG 5: Women’s Economic Opportunity98.46100.0087.1893.5993.1697.8785.47
SDG 7: Affordable and Clean Energy84.4795.7181.9485.2680.4189.1188.41
SDG 11: Sustainable Cities and Communities89.6495.0947.2466.1775.5179.4583.21
Note: Higher values are shown in greener shades, while lower values are shown in redder shades. Cluster numbers correspond to those displayed in the dendrogram (Figure 5) and the cartogram (Figure 6). Each number represents one of the seven identified clusters based on performance in the selected SDG indicators.
Table 6. Country Classification into Clusters Based on NRI (A–D) and SDGs.
CountryNRI (A–D)SDGsCountryNRI (A–D)SDGs
Austria11Bulgaria63
Belgium11Croatia64
Czech Republic15Cyprus66
Italy11Greece66
Portugal11Hungary64
Spain11Romania63
Estonia25Slovakia67
Ireland32Latvia74
Luxembourg32Lithuania74
Denmark42Malta77
Finland41Poland75
Sweden41Slovenia71
France51
Germany51
Note: the colors in the table correspond to those used in the dendrograms (Figure 4 and Figure 6) to visually indicate the same clusters.
Disclaimer/Publisher’s Note: The statements, opinions and data contained in all publications are solely those of the individual author(s) and contributor(s) and not of MDPI and/or the editor(s). MDPI and/or the editor(s) disclaim responsibility for any injury to people or property resulting from any ideas, methods, instructions or products referred to in the content.

