1. Introduction
Open-pit mining is a common mineral extraction method involving the process of rock stripping and ore extraction through specific mining techniques and sequences. While providing essential material foundations for social development and civilizational progress, open-pit mining inevitably causes ecological damage and environmental impacts during its development. With the accelerated exploitation and utilization of mineral resources in recent years, regional resource consumption and ecological environments have faced increasing pressure. Achieving a balance between mineral resource development and ecological protection, while ensuring effective resource utilization, necessitates scientific analysis and monitoring of open-pit mining activities and their ecological impacts [
1].
Assessment of a mine’s eco-environmental effect involves comprehensive monitoring and evaluation of ecological conditions including vegetation, water bodies, and soil within and around mining areas. Recent research has primarily focused on ecosystem service value [
2,
3,
4,
5], carbon sequestration capacity, and eco-environmental quality assessment. Ecosystem service value assessment, employing methods such as the Costanza approach and gross ecosystem product (GEP) accounting, provides holistic insights into mining ecosystem services. For instance, Xiao Wu et al. demonstrated temporal variation characteristics of ecosystem service values in Shendong and Shenfu mining areas through GEP accounting [
6,
7]. Carbon sequestration studies examine vegetation and soil carbon sinks using methods like carbon density measurement and the Carnegie–Ames–Stanford approach (CASA) model-based net primary productivity (NPP) conversion. Emerging approaches utilize multi-source data; for example, Ovidiu C et al. experimentally quantified surface CO
2 emissions in mining areas using airborne and satellite remote sensing data [
8].
Since the late 1960s, remote sensing technology has accumulated over half a century of global coverage data. Its continuous technological advancement and optimized data accessibility have established it as a primary tool for monitoring mining activities and ecological environments [
9,
10,
11,
12,
13]. With recent improvements in monitoring technologies and open access to multi-source data, increasing numbers of scholars have employed remote sensing to study mining-induced ecological effects [
14,
15,
16]. The Remote Sensing Ecological Index (RSEI), derived from multispectral data, has been widely adopted for comprehensive environmental quality assessment in mining areas. Studies have validated its feasibility by directly calculating and analyzing RSEI variations. Furthermore, Zhu Dongyu et al. developed a Moving Window-based RSEI (MWRSEI) to detect gradual ecological changes, enhancing traditional RSEI’s capability [
17]. Landscape pattern analysis using remote sensing data has also gained prominence. Kang Sarula et al. analyzed landscape pattern dynamics in Heidaigou Coal Mine since the 1980s using Landsat data [
18], while Mei Zhaorong et al. employed high-resolution imagery to calculate landscape indices and assess spatial-temporal changes in a Kunming open-pit mine via sliding window analysis [
19].
However, current research on mining-induced ecological effects often simplistically attributes regional environmental conditions directly to mining activities, neglecting the integrated impacts of climate, natural conditions, and other anthropogenic factors. Comprehensive evaluation frameworks and indicator systems for mining eco-environments remain underdeveloped. Existing studies typically employ isolated ecological indicators rather than multi-element integrated models. As mining eco-environments constitute complex systems involving biotic and abiotic components in and around mining areas, accurately identifying key effect elements is crucial for scientific analysis [
20]. Specifically, mining-induced ecological effects encompass environmental systems across surface, hydrosphere, atmosphere, and biosphere—including both natural environments and mining ecosystems–addressing ecological changes and pollution issues arising from mining–environment interactions.
To enable more accurate and comprehensive assessment of open-pit mining’s ecological impacts, this study integrates characteristics of mining’s ecological effects with practical remote sensing information extraction. By acquiring eco-environmental effect elements through remote sensing data and employing the kernel principal component analysis (KPCA) method, which better captures nonlinear relationships among indicators, we propose a dynamic comprehensive evaluation model and establish the Mine Eco-environmental Effect Index (MEEI). This framework enables dynamic assessment and analysis of ecological effects in open-pit mining areas.
2. Study Area Setting
This study selected the Heidaigou Open-pit Coal Mine in Jungar Banner, Inner Mongolia Autonomous Region, China, as the research area (
Figure 1). Located in the central part of the Jungar Coalfield, the mine sits at the junction of Shanxi, Shaanxi, and Inner Mongolia, approximately 127 km north of Hohhot and 120 km west of Dongsheng District, Ordos. Currently in its operational phase, the mine covers a total area of 47.7023 km
2. Heidaigou Open-pit Mine was designated as one of the “First Batch of National Green Mine Pilot Units” in March 2011 and recognized as a “First Batch National Green Mine” in 2016 [
21].
The study area is situated in a semi-arid region characterized by a typical temperate continental semi-arid climate, with an average annual temperature of 7.3 °C and an average annual precipitation of 352 mm. The exposed strata and lithologies in the region include the Paleozoic Permian System and Mesozoic Triassic System, primarily composed of mudstone, sandstone, and conglomeratic sandstone; the Jurassic System, dominated by siltstone and mudstone interbedded with coal seams; the Cenozoic Tertiary System, featuring red mudstone; and the Quaternary System, consisting of sandy clay, sandy gravel, aeolian sand, and loess. The area is rich in mineral resources, with major exploited minerals including coal, limestone, and clay for brick and tile production.
3. Materials and Methods
3.1. Data and Preprocessing
The datasets utilized in this study primarily included Landsat multispectral data, Moderate Resolution Imaging Spectroradiometer (MODIS) satellite data, and supplementary survey/monitoring data.
3.1.1. Satellite Images
The remote sensing data utilized in this study included Landsat and MODIS imagery.
Landsat multispectral data (Landsat 5 TM and Landsat 8 OLI) served as the primary data source for extracting eco-environmental effect indicators. All data were obtained from the website of the United States Geological Survey (USGS) [
22]. To ensure temporal consistency, the selected images were acquired between July and September of each study year. We ultimately downloaded qualified images with cloud coverage less than 5%. Specifically, our preprocessing of the images includes radiometric calibration, atmospheric correction, orthorectification, and the use of an image quality assessment (QA) band to obliterate cloud-containing pixels.
To avoid systematic errors caused by different sensors, this study applies the following linear adjustment to the band values of the two sensors to ensure data consistency:
Aerosol optical depth (AOD) data were obtained from the MODIS AOD product [
23].
3.1.2. Auxiliary Data
Auxiliary data included meteorological records, field survey statistics, and digital surface models. Meteorological data (temperature, precipitation, and radiation) were sourced from the monthly average datasets available on the China Meteorological Data Service Centre (CMDC) website [
24]. Precipitation and temperature data were selected from China’s monthly surface climate datasets using the “nearest neighbor” principle, while solar radiation data were obtained from China’s monthly meteorological radiation datasets. Additional data were derived from field surveys, monitoring reports, and relevant statistical yearbooks. All datasets were temporally aligned with satellite observations to ensure synchronization.
3.2. Indicators Selection and Extraction
The selection of appropriate eco-environmental effect indicators is a prerequisite for conducting ecological impact assessments in mining areas. The mining eco-environment constitutes an integrated system comprising both biotic and abiotic ecosystems within and surrounding mining operations. Accurately identifying the elements of mining eco-environmental effects is critical for scientifically analyzing these impacts [
10]. Specifically, mining-induced ecological effects primarily encompass the following: ① environmental systems across surface, hydrospheric, atmospheric, and biospheric domains—i.e., natural environments and mining ecosystems; and ② ecological changes and pollution issues arising from interactions between mining activities and environmental systems. The selected indicators adhere to the principles of comprehensiveness, scientific rigor, regional applicability, and operational feasibility [
25], ensuring precise characterization of the study area’s ecological responses [
26].
Guided by these characteristics and referencing technical frameworks such as the Technical Specifications for Eco-environmental Status Evaluation and Technical Specifications for Remote Sensing Monitoring of Mining Environments, this study identified eight indicators to characterize mining eco-environmental effects: vegetation coverage, temperature differentiation coefficient, soil moisture, soil erosion index, mine dust pollution intensity, mine waterbody pollution index, aerosol optical depth (AOD), and topographic slope. It should be noted that the aerosol optical depth (AOD) and topographic slope indicators were directly derived from existing processed products.
3.2.1. Vegetation Coverage
Vegetation coverage, as a critical indicator in ecological monitoring, directly reflects ecosystem stability, making the rapid and accurate acquisition of vegetation growth information imperative [
27]. The Normalized Difference Vegetation Index (NDVI)-based pixel binary model is the most prevalent method for calculating regional vegetation coverage using remote sensing imagery. However, in arid and semi-arid regions with sparse vegetation, the ubiquitous presence of non-photosynthetic vegetation (NPV) introduces data misinterpretation when photosynthetic vegetation (PV) and NPV are aggregated as mixed pixels.
Although sharing similar mechanistic foundations with the pixel binary model, the pixel ternary model incorporates NPV as an independent component within mixed pixels. This enhancement better accounts for the influence of senescent vegetation in low-coverage areas, improves the discrimination between photosynthetic and non-photosynthetic vegetation, and differentiates bare soil from vegetated surfaces, significantly advancing vegetation monitoring in arid/semi-arid ecosystems [
28].
Accordingly, this study employs the pixel ternary model, which hypothesizes that mixed pixels consist of three components: photosynthetic vegetation (PV), non-photosynthetic vegetation (NPV), and bare soil (BS). These components are linearly combined as weighted coefficients to reconstruct mixed pixel information, thereby effectively characterizing vegetation coverage in the study area, as follows:
where S represents the composite information of mixed pixels,
,
and
denote the spectral signatures of photosynthetic vegetation (PV), non-photosynthetic vegetation (NPV), and bare soil endmembers, respectively, and
,
and
represent their corresponding fractional abundances.
Given the use of Landsat series data as the primary data source in this study, the NDVI and Dead Fuel Index (DFI) were employed to characterize the remote sensing signatures of photosynthetic and non-photosynthetic vegetation, respectively. The DFI was calculated as follows:
where
,
,
, and
represent the red, near-infrared, short-wave infrared 1 and 2 bands of Landsat data, respectively.
3.2.2. Temperature Differentiation Coefficient
While previous studies have predominantly employed absolute surface temperature for ecological quality assessment, this metric proves insufficient for characterizing the environmental impact intensity of mining activities. The temperature differentiation coefficient (TDC), which effectively reflects anthropogenic disturbances on natural environments and ecological functions, has been widely adopted in urban heat island (UHI) and surface thermal intensity studies [
29,
30].
Building upon this foundation, this study adapts the Thermal Field Variation Index (TFVI) methodology from UHI research. Following analogous principles, we implement TDC to quantify surface temperature differentiation patterns. The mathematical formulation is expressed as follows:
where
denotes the land surface temperature at the target location, and
represents the regional mean surface temperature.
3.2.3. Soil Moisture
Soil Moisture serves as a critical indicator for assessing soil quality and ecological conditions. The Temperature Vegetation Drought Index (TVDI) provides a robust framework for soil moisture monitoring [
31].
The TVDI enables estimation of surface soil moisture by analyzing the relationship between the NDVI and the land surface temperature (LST). The method involves plotting LST against NDVI to generate an LST-NDVI scatter diagram, where each NDVI value corresponds to maximum and minimum LST thresholds—representing the dry edge and wet edge, respectively. These edges are determined through linear regression of the respective extreme data points in the scatter plot [
32]. The TVDI is formulated as follows:
3.2.4. Soil Erosion Index
Accurate monitoring, quantitative assessment, and analysis of spatiotemporal evolution patterns of soil erosion in mining areas constitute critical foundations for the scientific management of mining-induced soil degradation [
33]. Conventional soil erosion research methods are often constrained by significant limitations and high operational costs. To address these challenges, this study employs the Revised Universal Soil Loss Equation (RUSLE) model, which enables computer-aided processing, integration of large-scale datasets, and facilitates objective acquisition of long-term soil erosion data for evaluating soil erosion rates in mining environments [
34,
35]. The model is formulated as follows:
where SE represents the soil erosion rate, R denotes the rainfall erosivity factor, K indicates the soil erodibility factor, L and S correspond to the slope length factor and slope steepness factor, respectively, C signifies the vegetation and crop management factor, and P refers to the soil conservation practice factor. All parameter values range from 0 to 1.
The R factor quantifies rainfall’s erosive impact on soil, calculated as follows:
where
is monthly precipitation (mm) and
is annual precipitation (mm).
The K factor reflects soil susceptibility to erosion, computed as follows:
where
, and
represent mass fractions of sand, silt, and clay (%), respectively.
represents soil organic carbon content (%).
= 1 −
/100. Soil types and component fractions were determined using ArcGIS (Version 10.2, developed by Environmental Systems Research Institute (Esri)) and soil databases.
These topographic factors were derived from a digital surface model (DSM), as follows:
Slope Steepness Factor (S):
This is expressed as follows:
where
represents vegetation coverage, expressed as follows:
where
represents the NDVI, with
and
denoting the minimum and maximum NDVI values within the study area, respectively.
The assigned values for nine land classes in the mining area are listed below (
Table 1).
3.2.5. Mine Dust Pollution Intensity
Dust constitutes the most severe airborne pollutant generated during open-pit mining operations. The dispersion and deposition of particulate matter onto vegetation and soil surfaces impair plant respiration and photosynthesis, inhibit vegetative growth, and induce soil contamination that adversely impacts microbial survival. Monitoring the spatial distribution of dust particles and analyzing their dispersion patterns enable quantitative assessment of pollution severity while providing critical data for subsequent ecological remediation efforts.
Through ground-based spectral measurements, dust spectral signatures have been acquired to establish robust remote sensing extraction methodologies for dust quantification. Previous studies have developed the Landsat-based Normalized Difference Mine Index (NDMI) by synthesizing hyperspectral data characteristics with corresponding Landsat multispectral bands, expressed as follows:
where
and
denote the near-infrared and shortwave infrared 1 bands of the Landsat imagery, respectively.
Building on the influence of Landsat bands 4 and 5 on ore dust reflectance, a methodology for determining the Ore Dust Index (ODI) was initially proposed. While this index effectively identifies dust contamination and partially discriminates against interfering land cover types, its reliance on normalized operations of Bands 4 and 5—akin to urban indices—results in ambiguous dual representation of distinct surface features.
To address this limitation, we enhanced the NDMI by incorporating the shortwave infrared 2 band (SWIR2), which exhibits superior sensitivity to lithological and mineralogical signatures. This integration yielded the Enhanced Mine Dust Index (EMDI), as follows:
where
,
, and
represent the near-infrared, shortwave infrared 1, and shortwave infrared 2 bands of the Landsat imagery, respectively.
Given that EMDI and NDVI are analogous indices for characterizing surface dust accumulation and vegetation growth, respectively, this study adapts the vegetation pixel dichotomy model to develop a fractional mine cover (FMC) metric for quantifying mine dust pollution intensity. The methodology is based on the following principles.
A mixed pixel containing both dust-polluted and bare soil components can be decomposed into two endmembers as follows:
where
is the spectral signature of dust-polluted areas,
is the spectral signature of non-polluted bare soil, expressed as follows:
Then, FMC can be expressed as follows:
By substituting the EMDI for the remote sensing parameters in the aforementioned equations, the final expression for quantifying mine dust pollution intensity is derived as follows:
where
denotes the EMDI value of completely bare soil or non-polluted areas, and
represents the EMDI value of fully dust-polluted pixels. The fractional mine cover (FMC) is assigned as FMC = 0 when EMDI ≤
(indicating no dust pollution); FMC = 1 when EMDI ≥
(indicating complete dust pollution).
3.2.6. Mine Water Pollution Index
Distinct from typical water contamination patterns, aquatic pollution within mining areas primarily stems from ore-derived solid suspended matter, which exacerbates water quality degradation, alters optical properties, and adversely impacts aquatic organisms and primary productivity. Analysis of Landsat band values across varying water quality conditions in the study area revealed significant spectral anomalies in the near-infrared (NIR) to shortwave infrared (SWIR) bands for mine-polluted water bodies. This phenomenon arises predominantly from backscattering caused by mineral-laden suspended particles, which elevate SWIR reflectance [
36].
While this characteristic shares superficial similarities with sediment-laden water, the reflectance spectral profiles of clay-dominated versus ore-polluted water exhibit marked differences [
37]. Consequently, this study employs a Landsat SWIR-based empirical model to derive the Mine Water Pollution Index (MWPI) as follows:
where
,
, and
represent the near-infrared, shortwave infrared 1, and shortwave infrared 2 bands of Landsat imagery, respectively.
3.3. MEEI Calculation
3.3.1. Comprehensive Evaluation Method Based on KPCA
Traditional ecological environment evaluation methods, such as the analytic hierarchy process, expert scoring, and spatial distance-based approaches, often suffer from subjective human intervention and are unsuitable for dynamic long-term temporal evaluations [
38,
39,
40,
41]. Principal component analysis (PCA) can compress multi-band information into fewer transformed components, concentrating critical information within the first principal components. Typically, the first principal component captures the highest variance. Compared with other environmental assessment methods, PCA eliminates manual weight assignment by automatically and objectively determining indicator contributions based on their variance, thereby enhancing the results’ reliability.
Building on this principle, the Remote Sensing-based Ecological Index (RSEI) was developed. RSEI integrates four key ecological indicators—greenness, heat, dryness, and wetness—derived from natural ecosystems [
42,
43]. Satellite data enable efficient acquisition of these four indicators, which are then synthesized via PCA to compute RSEI, facilitating regional ecological monitoring and assessment. Due to its data accessibility, stability, and objectivity, RSEI has been widely adopted for long-term dynamic ecological quality assessments in urban and soil erosion-prone areas [
44].
However, the eco-environmental effect indicators selected in this study may exhibit weak linear or nonlinear relationships, which linear PCA transformations struggle to address [
45]. To overcome this limitation, we employed kernel principal component analysis (KPCA) [
46], a nonlinear extension of PCA, as the primary method for dynamic evaluation of mining-induced ecological effects.
KPCA is a nonlinear data processing technique. Its core principle involves mapping raw data into a high-dimensional feature space F via a nonlinear kernel function, followed by PCA-based analysis within this transformed space. This approach effectively captures complex nonlinear relationships among indicators. This study employs the Gaussian kernel function, also known as the radial basis function (RBF) kernel, as the nonlinear mapping in KPCA. The kernel function is formulated as follows:
3.3.2. Construction of MEEI
Based on the dynamic evaluation model for the eco-environmental effects of mining established through the selection of ecological effect elements and comprehensive evaluation methods outlined earlier, the model can be expressed as a function of eight eco-environmental effect indicators. The output of this model is defined as the MEEI, formulated as follows:
The computational workflow for the MEEI based on this dynamic evaluation model is as follows:
Due to the heterogeneous dimensional scales of the selected indicators, normalization is applied to transform all values into a dimensionless range of [0, 1] prior to KPCA computation, as follows:
where
,
,
,
represent the normalized value of an indicator, original value at the pixel level, maximum value of the indicator, and minimum value of the indicator, respectively.
The normalized indicators are processed via KPCA. Based on the variance contribution analysis of KPCA components, the first principal component (PC1) is selected to construct MEEI. To ensure that higher PC1 values correspond to better eco-environmental conditions for interpretability, the initial MEEI (MEEI
0) is defined as follows:
MEEI0 is further normalized to the [0, 1] range to derive the final MEEI. A value closer to 1 indicates more favorable eco-environmental conditions, while values closer to 0 signify degraded conditions.
3.4. Comprehensive Analysis
This study employed ridge regression [
47] and centroid shift migration equations implemented in Python 3.7 to assess the dynamic changes in eco-environmental effects induced by mining activities in the study area.
Ridge regression, also known as Tikhonov regularization, is a biased estimation method specifically designed for collinear data analysis. It enhances ordinary least squares (OLS) estimation by improving stability and predictive accuracy, particularly when handling ill-conditioned datasets.
The centroid shift migration equations are formulated as follows:
where
,
represent the longitude and latitude of the centroid in year
;
represents the area of the
-th eco-environmental quality class in year
;
,
represent the geometric centroid coordinates (longitude/latitude) of the
-th eco-environmental quality patch;
represents the total number of eco-environmental quality patches.
4. Results
4.1. Comparison and Evaluation of MEEI
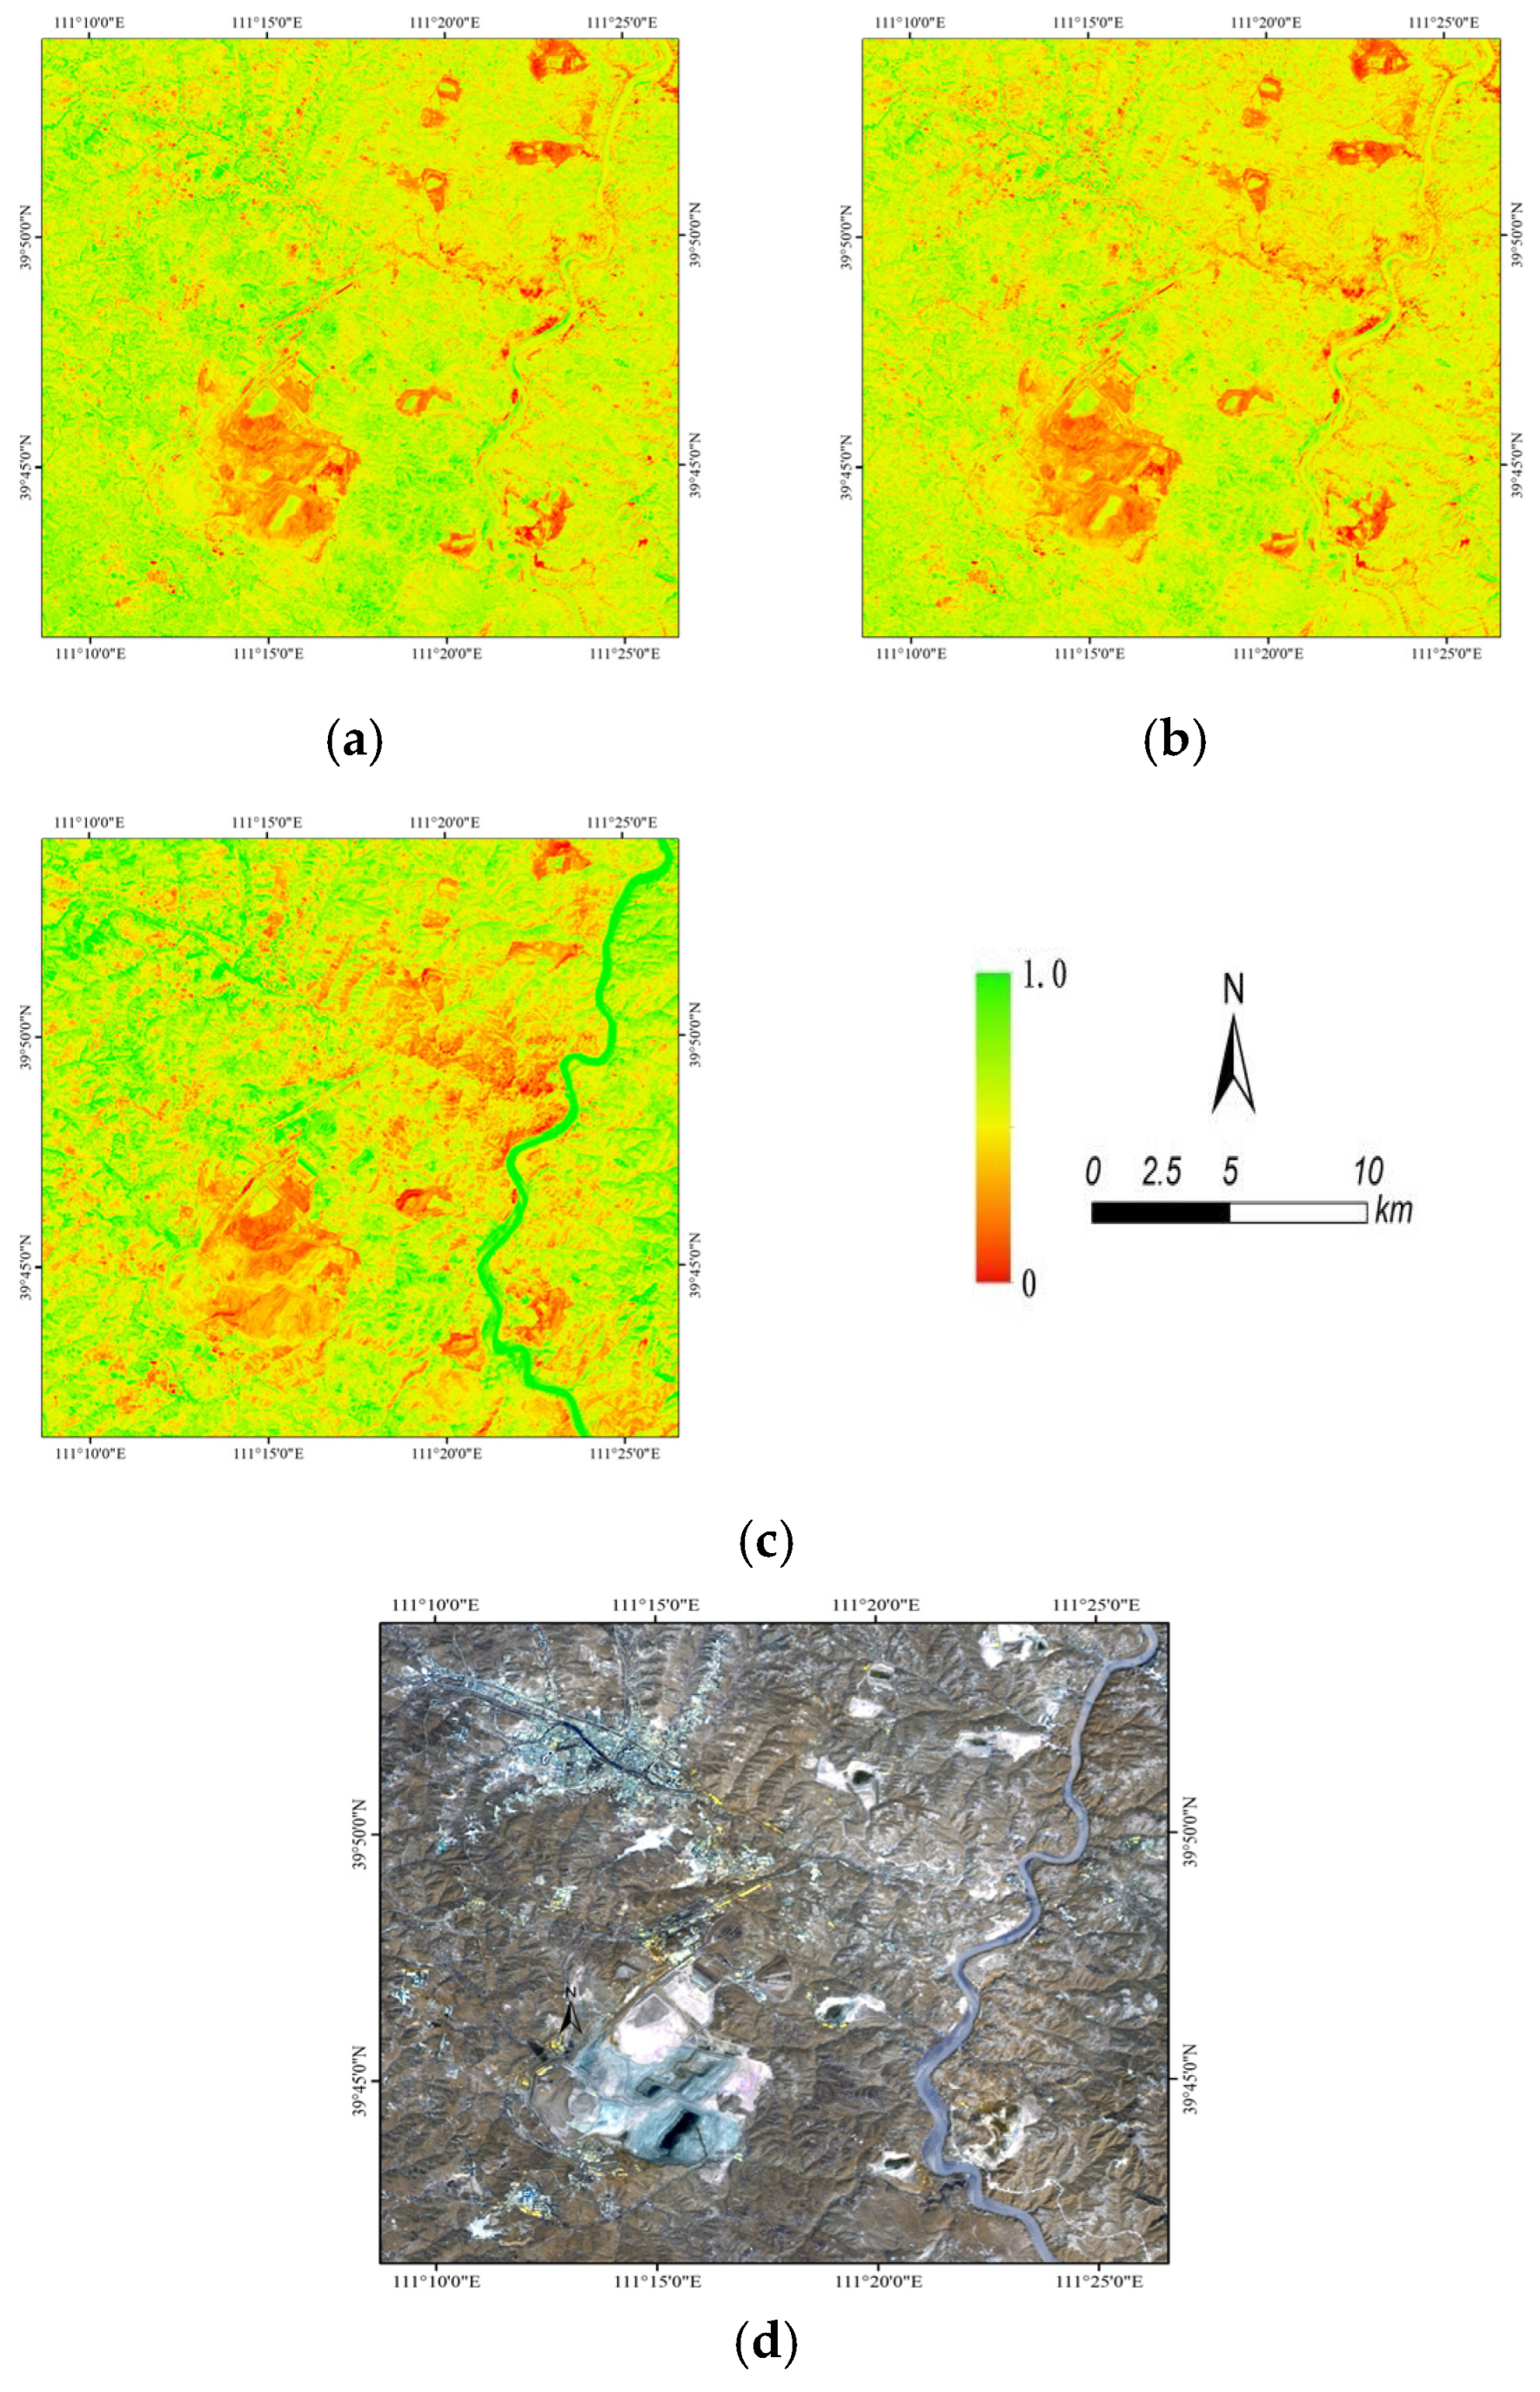
To validate the performance of the proposed dynamic evaluation model for mining eco-environmental effects, this study selected the open-pit coal mining concentration area in Xuejiawan Town, eastern Jungar Banner (September 2020) as the research subject. By collecting and computing relevant indicators, the MEEI results derived from the proposed model were compared with those obtained from PCA-based results (MEEI-PCA) and the traditional RSEI model (RSEI).
4.1.1. Visual Comparison
The evaluation results from the three methods are illustrated in
Figure 2. For intuitive comparison and to visually characterize the spatial distribution of eco-environmental effects, the MEEI values were classified into five grades, and the area proportions of each grade were statistically analyzed using equal intervals (
Table 2): Grade I (poor; 0–0.2), Grade II (suboptimal; 0.2–0.4), Grade III (moderate; 0.4–0.6), Grade IV (good; 0.6–0.8), and Grade V (excellent; 0.8–1.0).
In terms of grade area proportions, MEEI exhibited the smallest proportion of “poor” areas among the three results, primarily concentrated in active mining zones and localized water–soil erosion regions. “Suboptimal” areas were predominantly distributed within and around mining sites, urban areas, and sparsely vegetated regions. The majority of MEEI results fell into “moderate” or “good” grades, encompassing urban zones, croplands, and vegetated areas, while “excellent” grades were mainly located in undisturbed mountainous regions with dense vegetation. In contrast, MEEI-PCA showed weaker differentiation among abandoned mining areas, adjacent zones, and varying vegetation cover, leading to higher proportions of “moderate” and “good” classifications. RSEI results displayed the lowest proportions of “moderate” and “good” areas, with “poor” grades concentrated in mining sites, urban areas, and newly constructed roads, while most vegetated regions were classified as “excellent.”
Visual analysis of the result maps further revealed that MEEI effectively differentiated between active/inactive mining zones, mining peripheries, human-disturbed areas, and vegetation density gradients, while also capturing small-scale land cover features. However, its performance in aquatic environments was limited. MEEI-PCA maintained moderate differentiation across land classes but failed to resolve subtle vegetation cover variations. RSEI exhibited low sensitivity to small-scale features, producing large homogeneous patches and performing poorly in distinguishing vegetation gradients, mining impacts, and urban ecological quality.
4.1.2. Comparison of Contribution Rates
To further investigate the effectiveness of the MEEI derived from the KPCA method, this study compares the contribution rates of principal components between MEEI and MEEI-PCA (
Table 3).
The results above demonstrate that the cumulative contribution rates of the first four principal components (PCs) for both methods exceeded 98%. Specifically, the MEEI method achieved a cumulative contribution rate of 99.07 % for its first four PCs. PC1 accounted for over 85% of the variance, capturing the majority of feature information, while PC2 to PC4 contributed 9.80% cumulatively, with diminishing individual contributions. In contrast, the MEEI-PCA method yielded a cumulative contribution rate of 98.69% for its first four PCs, with PC1 contributing only 74.86%, and PC2 to PC4 collectively contributing 23.83%. Compared with MEEI-PCA, MEEI increased the contribution rate of PC1 by 14.41 percentage points. This enhancement underscores that the MEEI method integrates richer information from diverse ecological factors, thereby providing a more objective representation of the study area’s eco-environmental quality. The higher variance captured by PC1 in MEEI reflects its superior capability to synthesize nonlinear relationships among indicators, aligning with the methodological advantages of KPCA over conventional PCA.
4.2. Comprehensive Evolution Analysis of Eco-Environmental Effects
4.2.1. MEEI Results for Each Year
Based on the MEEI computational model, this study evaluated the eco-environmental effects in the study area across multiple years (
Figure 3). Analysis of eco-environmental changes over 30 years (1990–2020) revealed an overall trend of degradation during the pre-development to construction phases, followed by recovery in the stabilization phase. In the initial monitoring year of pre-development (1990), the study area exhibited moderate eco-environmental conditions (predominantly Grade III), with poorer quality in bare central and eastern regions, while mining zones maintained relatively better conditions. By the early construction phase (1992), localized degradation (Grade II) emerged in mining areas due to development activities, while other regions remained stable. During mid-construction (2002), expanded mining operations caused peripheral ecological decline (Grade I in some areas), though restored zones within mines showed gradual recovery. By late construction (2012), development of the southern Ha’erwusu mining area led to widespread suboptimal conditions (Grades I–II) in central and southern regions, while the Heidaigou mine, benefiting from extensive restoration efforts, achieved predominantly Grade IV or higher conditions. In the stabilization phase (2020), Heidaigou’s eco-environmental quality remained stable, and most Ha’erwusu areas recovered to Grade III or above except active extraction and soil stockpile zones (Grades I–II). Notably, newly developed mining sites in the eastern study area exhibited poor ecological performance. Overall, peripheral ecological quality consistently surpassed core mining zones during the development period. Open-pit coal mining caused significant localized degradation, but targeted restoration yielded rapid short-term improvements, demonstrating that timely rehabilitation minimizes long-term impacts on regional eco-environmental quality.
Table 4 summarizes the area proportions of mine eco-environmental effect grades in the study area across five key years. In 1990 (pre-development phase), Grade III dominated, covering 44.98% of the area. By 1992, eco-environmental conditions had declined, with the combined area of Grades I and II increasing by approximately 7%. In 2002, Grade III areas had decreased by 10%, while Grades I and II remained relatively stable. The overall eco-environmental quality deteriorated significantly in 2012, with Grades I and II accounting for 50.41% of the total area. By 2020, the original mining areas showed improved conditions, but newly developed active mining zones in the eastern region contributed to Grades I and II occupying 48.55% of the total mining area.
4.2.2. Dynamic Assessment
This study employed a ridge regression function to fit the eco-environmental effect outcomes across different phases in the study area, with the slope (scale) of the fitting results indicating evolutionary trends of eco-environmental quality (
Figure 4), where a scale > 0 signifies improvement and < 0 denotes degradation. The spatial heterogeneity of mining eco-environmental quality transitions was evident, showing an overall trend of degradation–recovery–stabilization from 1990 to 2020. During 1992–2002, significant ecological deterioration occurred within mining zones (b); from 2002 to 2012, southern mining areas experienced marked degradation while northern regions exhibited slowed decline (c); post-2012, partial ecological recovery and stabilization were observed in operational zones (d), with pronounced improvements in the southwestern study area. Statistical results reveal that 74% of the actual disturbed mining areas suffered ecological degradation during 1992–2002 (initial mining phase), driven by extensive vegetation destruction. Between 2002 and 2012, degraded areas accounted for 51% of disturbed zones, with 30% stabilized and 19% improved, reflecting rapid southward expansion-induced acute southern degradation alongside moderated northern deterioration and peripheral recovery. From 2012 to 2020, 41 % of mining areas showed improvement (primarily in western, northern peripheral, and central zones), while 24% degraded (mainly in newly developed eastern extraction zones). During this period, 17% of areas experienced degradation versus 36% improvement, with sustained optimization in western/central regions, stable conditions in eastern mining zones, and localized deterioration in specific areas.
Using centroid shift migration equations, the migration trajectories of eco-environmental effect centroids in the study area were mapped. As shown in
Figure 5, the centroid migration patterns of mine eco-environmental effects from 1990 to 2020 revealed significant spatial dynamics. For Grade I (poor) (a), the centroid shifted markedly northwest to southeast from 1990 to 2012, aligning with the dominant mining direction during pre-development and construction phases. From 2012 to 2020, the Grade I centroid gradually moved southeastward, reflecting the stabilization of ecological conditions in core mining zones and the emergence of scattered new extraction areas in the southeast. Grade II (suboptimal) migration (b) was primarily influenced by the distribution of bare soil and impervious surfaces. Grades III (moderate) and IV (good) exhibited opposing migration trajectories (c-d), both circulating around vegetated edges and restored zones within the mining area. The Grade IV centroid shifted substantially southwestward during 2002–2012 due to intensified mining in the southwest and large-scale restoration in the north. From 2012 to 2020, Grades III and IV centroids migrated westward and eastward, respectively, consistent with the spatial distribution of rehabilitated abandoned mines and soil stockpile zones. Grade V (excellent) experienced pronounced centroid shifts during 1992–2002 (e), transitioning from natural vegetation in the southwest to restored northern zones. Post-2012, Grade V centroids aligned with Grade IV trends, moving eastward to early-stage mining and restored stockpile areas, indicating significant ecological improvement in these regions. Field survey photographs from 2020 (
Figure 6) corroborate these findings, showing restored areas in the east with markedly enhanced eco-environmental quality compared to original conditions. Over the 30-year period, ecological improvements predominantly occurred near soil stockpile zones, while degradation concentrated in southeastern newly developed mining areas. This spatial pattern underscores the effectiveness of targeted restoration measures and the localized ecological impacts of ongoing mining activities.
By integrating the surface element classification and comprehensive eco-environmental effect evaluation results across development phases, it is evident that significant ecological changes in the mining area primarily occurred in soil stockpile zones, active mining zones, and restoration areas. To systematically analyze mining activities and their corresponding ecological impacts during each phase, key extraction and stockpile zones were numbered and mapped (
Figure 7). Spatial–temporal analysis of ecological quality from 1990 to 2020 revealed the following patterns: Zone 1 (longest operational duration) exhibited ecological improvement starting around 2002 during the construction phase, with vegetation recovery achieving near-optimal conditions by the late construction phase. By 2020, its vegetation coverage reached approximately 80%. Zone 2 showed gradual ecological enhancement during the mid-late construction phase (2002–2012), with restoration area and vegetation coverage increasing annually, culminating in 90% coverage by 2020. Zone 3 experienced substantial ecological recovery from 2002 to 2012, with vegetation coverage steadily rising to nearly 80% by 2020 during the stabilization phase. Zone 4 underwent primary restoration during the stabilization phase (2012–2020), achieving 65% vegetation coverage, though its overall restoration lagged behind Zones 1–3. Zone 5 (the largest area) has expanded continuously since 2002, with notable ecological improvements along its southeastern edge during 2002–2012 and sustained quality through 2020. Ongoing dual-purpose development and restoration in other parts caused fluctuating but overall improving conditions, reaching 60% to 70% vegetation coverage by 2020. Zone 6, operational since 2006, demonstrated progressive southeastward expansion and significant ecological recovery in its northwestern sector, achieving ~60% vegetation coverage by 2020. Degraded areas predominantly shifted southeastward, aligning with new mining expansions. Additionally, fluctuating MEEI values in peripheral zones over 30 years may reflect weather-induced variations in ecological indicators.
5. Discussion
Based on the ecological impact characteristics of open-pit mining development, this study established eight eco-environmental effect indicators for open-pit mining in accordance with four fundamental principles and constructed the MEEI using KPCA, which better captures nonlinear relationships among indicators. Experimental comparisons demonstrate that the MEEI incorporates more comprehensive indicators compared with the traditional RSEI. Furthermore, KPCA outperforms conventional PCA by more effectively integrating the characteristics of various factors, resulting in an index that objectively reflects the comprehensive eco-environmental effects of mining activities.
From the perspective of mining eco-environmental assessment, recent studies have often focused on single-element parameters, lacking synchronous observation and synergistic analysis of multi-element parameters, which hinders objective evaluation of the comprehensive ecological impacts of mineral resource extraction. The MEEI proposed in this study, based on remote sensing data, provides a methodological framework for holistically characterizing mining-induced eco-environmental effects while ensuring long-term temporal stability in ecological monitoring. This approach enables timely and effective evaluation of ecological quality across different mining phases and dynamic analysis of environmental impact evolution.
However, this study primarily focused on the open-pit coal mining cluster in eastern Jungar Banner, resulting in findings with regional specificity. Future research could extend this framework to other regions or mining types under the established technical system. By tailoring ecological impact indicators to diverse mining characteristics and building a comprehensive sample information database, a widely applicable dataset for monitoring and assessing mining-induced eco-environmental effects might be developed, thereby broadening the methodology’s applicability.
From a remote sensing perspective, this study was constrained by data limitations. Medium-resolution optical data, combined with supplementary observational datasets, formed the primary data sources. The lack of higher spatial/spectral resolution data, higher temporal frequency observations, and multi-parametric datasets restricted the ability to capture finer ecological details and limited the precision of classification and information extraction. Subsequent studies could integrate high-resolution satellite imagery, UAV (unmanned aerial vehicle) data, and aerial remote sensing to obtain more detailed and comprehensive ecological impact parameters for open-pit mining activities. Such advancements would enhance the granularity and reliability of ecological assessments while addressing current resolution-related limitations.
6. Conclusions
Rational and effective monitoring, analysis, and evaluation of mining development activities and their eco-environmental effects are critical for the rational development and management of mining resources, as well as optimizing mining spatial planning. Addressing the current limitations in ecological impact assessment indicators for open-pit mining, this study selected the concentrated coal mining area in Jungar Banner, eastern Ordos Plateau, Inner Mongolia, as the research site. It conducted research on the selection of eco-environmental effect elements and the development of a comprehensive dynamic evaluation model for open-pit mining, with the following conclusions:
An eco-environmental effect evaluation framework tailored to mining characteristics was established. This framework identifies eight eco-environmental effect indicators and determines quantitative extraction methods based on Landsat data and spectral indices. The Mine Eco-environmental Effect Index (MEEI), constructed using kernel principal component analysis (KPCA), was experimentally validated, demonstrating its accuracy and effectiveness in comprehensively assessing open-pit mining impacts;
Dynamic evaluation of eco-environmental effects was conducted for the Heidaigou Open-pit Coal Mine across five developmental phases (1990–2020). The results reveal an overall ecological trajectory of “sharp degradation → slowdown → relative stabilization.” Active mining and soil stockpile areas were identified as primary drivers of ecological deterioration, while post-mining restoration measures effectively mitigated degradation and even improved regional eco-environmental quality;
This study provides a technical framework for spatiotemporal dynamic monitoring and evaluation of mining-induced eco-environmental effects, offering actionable insights for sustainable mining practices and ecological rehabilitation.


