1. Introduction
The controlled germination of cereal grains, known as malting, is a process that is stopped by applying heat, creating a product suitable for room temperature storage [
1,
2,
3]. Roasting the malted grain further modifies flavor and color. Malthouses require barley with a minimum 98% germination rate for successful malting. This transformation is essential for brewing, as it activates enzymes (including diastases, proteases, and β-glucanases) that partially degrade the grain’s starchy endosperm. Incoming barley, with 10–12% moisture (
w/
w), is inspected, cleaned to remove impurities, and stored before the malting process, which can be divided into five key stages [
4]:
- (i)
Selection and cleaning of barley.
- (ii)
Soaking for at least 24 h.
- (iii)
Germination for about 96 h.
- (iv)
Roasting for about 24 h.
- (v)
Cleaning and selection of malt.
The malting process typically takes about nine days to complete. The conversion yield from raw barley generally requires 120–130 kg of cleaned barley to produce 100 kg of malt, depending on the grain’s quality and purity. This translates to an average barley-to-malt ratio of 1.267 kg/kg [
4].
The economic viability of the malt sector is significantly influenced by the selection of barley varieties, along with their protein content, kernel size, and moisture content. Notably, barley accounts for approximately 70% of the total malt production costs [
4].
The global malt market, valued at USD 3961 million in 2024, is projected to reach over USD 5534 million by 2034, growing at a compound annual growth rate (CAGR) of 3.4% [
5]. This growth is driven by increasing global beer production, especially the craft beer sector [
6], as highlighted by the rising number of EU breweries (9684 in 2022) [
6]. Malt’s use in food products also contributes to this expansion.
The global malt producer landscape is relatively consolidated, with major players including Soufflet Malt S.A.S (3.7 × 10
6 Mg annual capacity), Boortmalt (3.1 × 10
6 Mg), Malteurop Malting Company (2.2 × 10
6 Mg), Cargill Malt (1.25 × 10
6 Mg), and Viking Malt (0.6 × 10
6 Mg) [
4,
5,
7,
8]. These companies operate multiple malthouses globally.
In Italy, 209,595 Mg of barley malt was used for brewing in 2023 [
9], primarily through imports and two large companies: Saplo Spa in Pomezia (80,000 Mg annual capacity) and Adriatica SpA—Italmalt Plant in Melfi (65,000 Mg). Several medium- and small-sized Italian malthouses also exist [
10], such as Mastri Birrai Umbri (Gualdo Cattaneo, Perugia), Agricola Vallescura (Piozzano, Piacenza), Malteria Toscana (Vicchio, Florence), and COBI (Ancona). This Italian context, with its range of malthouse capacities, justifies the scope examined in this work.
Over the past thirty years, the malting process has undergone significant engineering innovations and process control improvements to enhance resource efficiency across raw materials, energy, water, and labor. These advancements have particularly focused on reducing energy consumption during kilning, the most energy-intensive stage, and water usage, both critical factors for sustainability and profitability in malting and brewing [
3]. However, with the increasing demand for locally sourced barley malt to support the unique characteristics of Italian craft breweries and agricultural beer producers serving local establishments, the adoption rate of these resource efficiency improvements by small-sized Italian malthouses remains unclear. To the best of our knowledge, no published paper has yet estimated the comprehensive environmental impact of malt production.
Therefore, this study aimed to, firstly, assess resource consumption in Italian malthouses of varying sizes (small, medium, and large) through questionnaires; secondly, compare the business-to-business (B2B, cradle-to-brewery gate) environmental impact of bulk barley malt transport by trucks to breweries, considering both domestic and imported malt to determine the contribution of transportation and agricultural phases; and thirdly, identify key environmental impact hotspots and propose mitigation strategies for malt production.
2. Main Barley-to-Malt Conversion Factors
The efficient use of input resources is critical for the sustainability and profitability of any production process, whether malting or brewing. Stewart [
11] provided a useful overview of energy consumption across different malting stages for three Australian malt plants with varied production scales and technologies, as shown in
Table 1. Specifically, the moisture content of barley at the end of germination was approximately 0.42 g/g, and the moisture content of malt at the end of drying was approximately 0.04 g/g. Following the work of Evans et al. [
3], Davies [
12] also undertook an examination of the impact of cereal production and malt processing on carbon footprint and explored opportunities to reduce carbon emissions by nearly 75% through supply chain cooperation and innovation. Nevertheless, the restricted accessibility of this work precluded a detailed examination of his mitigation options.
From
Table 1, it can be noted that the thermal energy consumption practically concerns the drying phase of the germinated grains, whose contribution ranges between 89 and 99% of the total consumption, while that of electricity is related for 25–26% to the germination phase, for 34–40% to the drying phase, for 21–26% to the refrigeration of the grains, and finally for 12–14% to the cleaning of the malt.
Table 2 lists the main barley-to-malt conversion factors from various malthouses across different continents, compiled from research papers [
3,
11] and reports by the Maltsters’ Association of Great Britain (MAGB) [
13] and the Danish Malting Group (DMG) [
14]. Notably, MAGB, established in 1827, represents approximately 98% of the UK malting industry, which currently purchases about 2 million Mg of barley to produce about 1.6 million Mg of malt. The DMG report focused on the Vordingborg (DK) malthouse from 2005 to 2009, where natural gas consumption data were used to estimate thermal energy consumption using the lower heating value (LHV), which is 36.6 MJ/m
3 [
15].
Table 2 reveals that the barley/malt ratio in the Danish malthouse ranged from 1.18 to 1.24 kg/kg, closely aligning with the previously mentioned average of 1.267 kg/kg. Notably, the specific water consumption in the Danish malthouse demonstrated a decrease from 2.59 m
3/Mg of malt in 2005 to 1.86 m
3/Mg in 2009, indicating improved water efficiency over time. Comparing this to the Viking Malt group’s reported decrease from 3.1 m
3/Mg in 2020 to 2.7 m
3/Mg in 2023 [
16], suggests a broader industry trend towards reduced water usage.
Regarding energy consumption, the most modern Australian malthouse (Perth) showed specific electricity (EE) and thermal energy (ThE) consumptions of 112.7 kWh/Mg and 713 kWh/Mg, respectively. In contrast, the Danish malthouse averaged 86 kWh/Mg for EE and 588 kWh/Mg for ThE during the 2005–2009 period, indicating potential differences in processing technologies or efficiencies.
Looking at the other locations, the specific water consumption shows variation. Poland and China exhibit water consumption yields as high as 4.4 and 6.8 m3/Mg, respectively, while Russia reports a lower consumption of 3.7 m3/Mg. Great Britain (GB) shows a specific water consumption of 5.18 m3/Mg, which is higher than Denmark but lower than China.
The specific electricity consumption varies, with Poland at 77 kWh/Mg, China at 124 kWh/Mg, Russia at 130 kWh/Mg, and Great Britain at 150 kWh/Mg. This suggests differences in electrical energy requirements among these malthouses. The specific thermal energy consumption (ThE) is notably higher in these locations compared to Australia (Perth) and Denmark, ranging from 665 kWh/Mg in Poland and 670 kWh/Mg in Russia to 750 kWh/Mg in Great Britain, and reaching 1066 kWh/Mg in China. This indicates potentially different heating methods or less efficient thermal processes, highlighting the impact of regional differences and technologies on resource consumption in malt production.
Preliminary cleaning and calibration of raw barley, as unloaded at the malting plant by truck, train, or elevator, is a crucial aspect of the barley-to-malt conversion process. This step removes foreign matter (stones, metal tools, etc.) and thin grains. Thin grains exhibit a faster moistening rate, mill inefficiently due to their smaller size relative to mill roller gaps, and reduced malt extract because of their higher husk-to-endosperm ratio. Consequently, maltsters anticipate a 5–10% weight loss during cleaning and grading. However, cleaning and grading are merely the initial stages of a series of processes contributing to overall malting losses.
As detailed in
Table 3, Evans et al. [
3], in their analysis of several papers dating back to 1940, highlighted that additional significant losses occur during steeping/leaching (1–1.5%), respiration (3–5%), rootlet removal (3–4%), and moisture reduction (6.0–9.5%), culminating in an approximate total malting loss of 18–30% by weight. Optimizing each stage is therefore essential to minimize losses and maximize efficiency. An overall malting loss of 20% per Mg of delivered barley is generally considered acceptable, on average [
3].
Finally, based on the 2020 sustainability report from the Viking Malt Group [
17], GHG emissions at their Danish malthouses were approximately 0.352 kg CO
2e per kg of malt produced. This figure is comparable to the emissions (0.26–0.41 kg CO
2e/kg) observed in the three Australian plants detailed in
Table 1. These estimates were derived using the following assumptions: a barley yield of 6.5 Mg/ha following an NPK fertilizer application (21-4-10) of 490 kg/ha, grain drying to a moisture content of 14.5% (
w/
w), a field-collector distance of 45 km, a barley-to-malt ratio of 1.235 kg/kg and malt delivery by truck to a brewery within 550 km, respectively [
17]. However, the 2023 sustainability report [
16], utilizing the revised Greenhouse Gas Protocol [
18], reported significantly higher overall Scope 1–3 GHG emissions, amounting to 0.737 and 0.747 kg CO
2e per kg of malt produced in 2021 and 2022, respectively.
In conclusion,
Section 2 lays the groundwork for understanding the material input required for the functional unit of our study, as extracted from the main references available in the literature. Thus, the barley-to-malt conversion and resource consumption factors are key parameters that directly link the upstream processes (barley production) to the final malt product and its associated environmental impacts.
4. Results and Discussion
4.1. Barley-to-Malt Conversion Factors in Italian Malthouses Based on Questionnaire Responses
Table 4 summarizes the overall consumption of barley, water, electricity, and thermal energy, as well as waste from cleaning, calibration, and rootlet removal, associated with the barley-to-malt conversion process in the surveyed malthouses. These data were obtained from questionnaire responses. Total methane consumption was used to estimate the thermal energy demand, calculated based on the lower heating value (LHV) of methane, which is 35.8 MJ/m
3 [
15].
To ensure a fair comparison of the environmental impact of the small-sized malthouse A with other malthouses, the cleaning and calibration phases of raw barley were included in the analysis. Since this facility processes 24 Mg of pre-cleaned and calibrated barley yearly, an average waste rate of 5% per operation (cleaning and calibration) was assumed, in line with the literature data. Consequently, the estimated actual raw barley consumption was 26.6 Mg/year, calculated as follows:
Furthermore, considering that barley cleaning and calibration typically account for 13% of total electricity consumption [
11], and assuming a total electricity requirement of 150 kWh/Mg [
13], an additional 20 kWh/Mg (150 × 0.13 ≈ 20 kWh/Mg) was attributed to malthouse A for these preliminary processing stages.
A comparative analysis of specific resource consumption (barley, water, electricity, and thermal energy) in foreign (
Table 2) and Italian (
Table 4) malthouses highlights notable differences in malting processes and efficiency levels across different production systems.
First, the barley-to-malt ratio in the surveyed facilities is close to the global average value [
4]. Minor variations among malthouses can be attributed to differences in barley varieties, cleaning efficiency, or production losses.
Regarding specific water consumption, significant differences were observed among malthouses. Reported values range from 2.0 ± 0.3 m
3/Mg for the Danish malthouse (
Table 2) to 6.7 m
3/Mg for malthouse B. Intermediate values were found for malthouse C (3.4 m
3/Mg;
Table 4) and British malthouses (5.18 m
3/Mg;
Table 2). These variations may be influenced by factors such as production process type, lack of water recycling systems, and water quality, particularly the presence of high concentrations of divalent cations (Ca and Mg), which can slow down barley hydration and increase water demand. Notably, malthouse B’s technical director reported that investments are underway to reduce specific water consumption, highlighting industry awareness of this issue.
Electricity and thermal energy consumption are closely linked to plant efficiency. The Port Adelaide and Tamworth malthouses, considered technologically outdated [
11], exhibit significantly higher energy consumption compared to DMG and malthouse C. Additionally, malthouses with lower production capacities tend to have higher specific electricity consumption.
These primary data were used to construct the barley malt network for each of the four malthouses (A–D) using SimaPro 10.2.0.0 software. As an example,
Table S4 in the electronic supplement outlines the network for malthouse C.
4.2. Cumulative Energy Demand of Malt
Table 5 reports the contribution of renewable and non-renewable energy sources used to produce 1 kg of barley malt in the four malthouses examined here, together with the Cumulative Energy Demand (CED).
The data in
Table 5 clearly indicate that the four malthouses primarily utilize fossil energy sources (non-renewable). Malthouse A exhibited the highest Cumulative Energy Demand (CED) among them, suggesting a greater energy consumption, particularly when compared to malt produced by the medium- and large-scale Italian companies (B and C). Additionally, the examined Italian malthouses (B and C) produced malt with a lower environmental impact than the German malt from malthouse D.
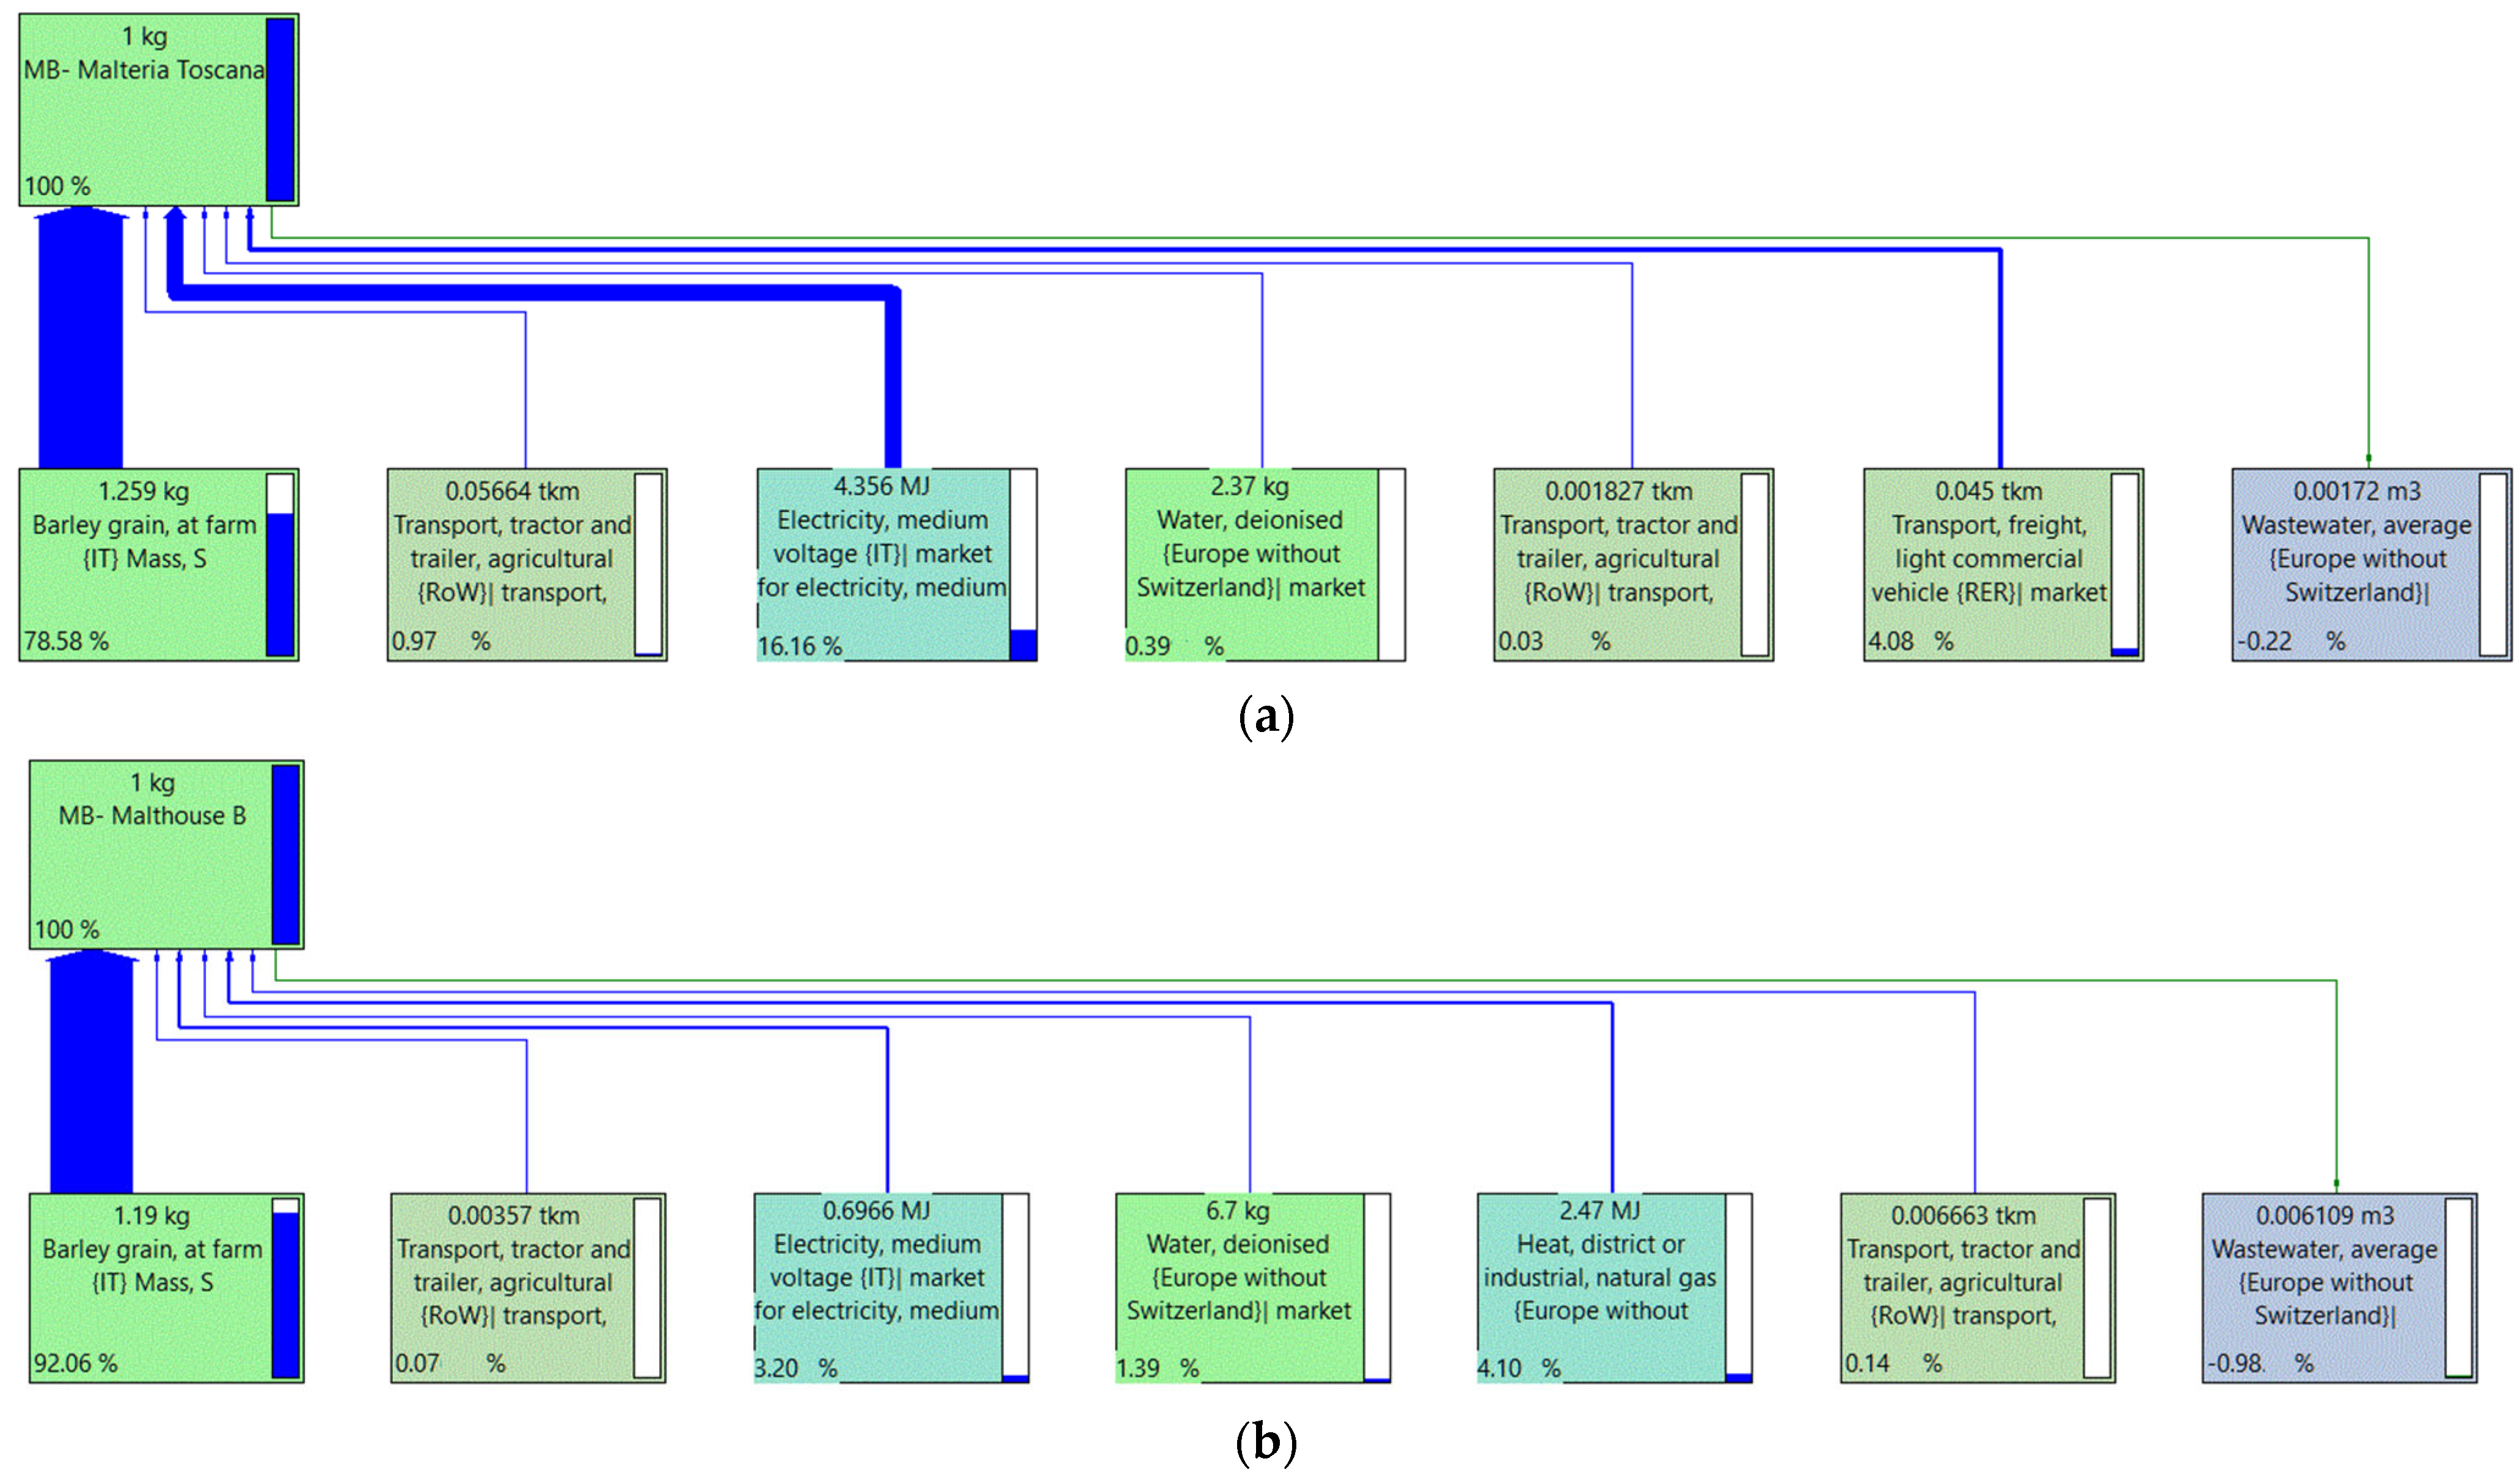
To graphically highlight the allocation of input resources (energy and materials) to produce 1 kg of barley malt at the examined malthouses and transported in bulk by truck to the gates of the respective breweries, Sankey diagrams [
29] were used, as illustrated in
Figure 2. The thickness of each arrow in
Figure 2 represents the environmental impact of each phase, with thicker arrows indicating greater impact. Accompanying percentages denote the input’s relative proportion to the final product, highlighting resource or energy consumption, as seen in barley cultivation.
Across the four examined cases, raw barley production accounts for the majority (79–92%) of the environmental impact per kg of malted barley. Thus, agriculture significantly shapes the product’s overall footprint.
Secondary hotspots vary: electricity consumption (16.2% of total impact) for small-scale malting plant A; thermal energy for kilning in Italian malting plants B and C (4.1–4.7%); and malt transport to Italian breweries for German malting plant D (9.2%). Notably, malt transport is absent in plant B due to its adjacency to the brewery, with direct transfer via conveyor belts. Tractor and trailer transport in plants A–D pertains to by-products, and in plants A and B it also pertains to raw barley due to their proximity to storage centers.
Electricity consumption ranges from 2.2 to 2.8% in larger plants (C and D), 3.2% in medium-scale plant B, and 16.2% in small-scale plant A.
Excluding the contribution of raw barley in the analysis of the Sankey diagrams (
Figure 2), distinct environmental impact profiles emerge:
- -
Malting Plant A: The use of this small-scale malting system (500 kg of barley per cycle) powered exclusively by electricity results in high electricity consumption (75.5%), making it the most impactful phase of the production process. This finding is consistent with the CED values reported in
Table 5, which show the highest energy consumption for malting plant A. Although malt transportation represents the second hotspot (19%) of the overall environmental footprint, it benefits from the proximity of consortium breweries, limiting its impact.
- -
Malting Plant B: The drying of germinated barley (51.7% of the total environmental impact) and electricity consumption (40.3%) are the most impactful phases of the production process.
Table 5 confirms approximately 50% lower energy consumption compared to malting plant A. The transport of raw barley and processing by-products contributes minimally (2.7%) to the overall environmental footprint due to the proximity of storage centers and livestock farms, highlighting good logistical management. The malt produced is used by a brewery adjacent to the malting facility, eliminating the impact of malt transportation from producer to user.
- -
Malting Plant C: Methane gas consumption for drying is the primary hotspot (41.8% of the total impact), followed by the transport of raw materials, finished products and by-products (36.3%), and electricity consumption (19.7%).
Table 5 shows a CED value that is intermediate compared to the other malting plants, indicating a moderate environmental impact.
- -
Malting Plant D: Transportation accounts for the highest environmental impact at this facility (61%), primarily due to the greater distance between the malting plant and the breweries it supplies. Consequently, the contributions of methane gas and electricity consumption are lower, at 22.8% and 15.1%, respectively. Although
Table 5 indicates a high Cumulative Energy Demand (CED) value for plant D, it is still lower than that of malting plant A.
Production scale significantly influences malting efficiency. Advanced technologies and process optimization are critical, especially for small-scale plants like A, to reduce energy consumption through renewable energy and optimized logistics. The results emphasize the importance of locating malting plants near barley production and consumption areas, minimizing the environmental impact of transportation, a critical factor especially for large malting plants.
4.3. Environmemtal Profile of Malt
The malthouses examined differ in production capacity, origin of barley (Italian or German), and distance traveled by the malt produced to the brewery. These factors significantly influence their business-to-business (B2B) environmental profiles, based on the PEF standard method (see
Table 6).
Due to its high specific electrical energy consumption (
Table 4), malthouse A exhibits the greatest impact on GHG emissions (climate change—CC). In contrast to malthouse B, malthouses A, C, and D demonstrated higher carbon footprints compared to the Viking Malt Group’s reported figures for 2021 and 2022 [
16], indicating greater carbon intensity in their operations. For malthouse B, higher energy consumption is the primary driver of its CC impact, as transportation is minimal due to its proximity to cultivation fields and the adjacent brewery. The greater transport distance of malt contributes to malthouse D having higher GHG emissions (CC) than malthouse C. The comparison of these two malthouses, with identical production capacities but different barley origins, suggests an influence of barley origin on environmental impact. Furthermore, malthouse D shows higher scores in freshwater ecotoxicity (ETFW), marine eutrophication (ME), terrestrial eutrophication (TE), and acidification (AC), likely linked to German agronomic practices for barley cultivation, as reflected in the higher numerical values for these categories.
The Sankey diagrams in
Figure 2 for each malthouse effectively illustrate the percentage contribution of each life cycle process (defined in
Figure 1) to the overall product environmental score, thus detailing the breakdown of key impact categories.
In summary,
Table 6 highlights how several factors, including energy consumption, transport distance, and barley origin, contribute significantly to the environmental footprint of malthouses, underscoring the need for targeted strategies for the sustainability of the sector.
A clearer visualization of the different environmental profiles is evident from the bar graph in
Figure 3. Each impact category (IC
j) score for malthouses B, C, and D is expressed as a ratio of the corresponding score (IC
jA) for malthouse A. This normalization facilitates a direct comparison of the relative impact magnitudes across the different malthouses for each environmental category.
Notably, malthouse D demonstrated a considerably higher relative impact in the acidification (AC) category, with its impact score being approximately 2.5 times that of malthouse A. This might potentially be attributed to differences in its energy mix or emission control technologies compared to malthouse A. Conversely, for the water use (WU) category, both malthouses B and D showed relatively lower impacts compared to malthouse A, potentially due to different barley sourcing practices. A consistent trend of smaller relative impacts for malthouses D, C, and B can be observed across several energy-related categories, such as climate change (CC) and fossil resource use (RUF). This is likely linked to variations in their energy consumption per unit of malt produced or the specific electricity grid mix they utilize. This comparative perspective can inform targeted strategies for reducing the overall environmental footprint of malt production, highlighting areas where specific malthouses could benefit from operational or technological improvements. While
Figure 3 provides a valuable comparative perspective, it is important to consider these relative differences in conjunction with the absolute impact scores presented in
Table 6 for a complete understanding of the environmental performance of each malthouse.
The Product Environmental Footprint (PEF) for barley malt produced by the four malthouses under examination was calculated. This involved normalizing the 16 impact categories listed in
Table 6 against their global impacts and then weighing each ratio using factors that reflect the perceived relative importance of each category. Weighting is a crucial step in comparing the relative significance of the different impact categories. This process yields an overall score, expressed in micro-points per kilogram (µPt/kg), which represents the combined environmental impact across all categories, as detailed in
Table 7.
Freshwater ecotoxicity (ETFW) played a predominant role, contributing 36–42% to the PEF, regardless of the characteristics of the malthouse. Climate change (CC) is the second significant factor, with a contribution of 10.7–13.8%. Land use (LU) is the third contribution for malthouses A, B, and C (8.8–10.3%), while for malthouse D, which uses German barley, acidification (AC) is the third factor (7.2%), followed by particulate matter (PM) and land use (LU). The latter appeared less relevant probably due to the higher barley grain yields per hectare recorded in Germany compared to Italy.
The overall PEF score varies from 177 µPt/kg (malthouse B) to 221 µPt/kg (malthouse A). The agricultural phase is the main responsible for the impact, contributing 79–92% of the PEF, due to the use of fertilizers, pesticides, and land consumption. The drying of germinated barley is the second hotspot for Italian malthouses (4.1–4.7%), while transport is more relevant for malthouse D (9.2%). Electricity consumption varies from 2.2 to 2.8% for malthouses C and D of greater production capacity to 16.2% for malthouse A of lower operational potential. Thanks to its proximity to the brewery, malthouse B obtained the lowest PEF (177 μPt/kg), compensating for the lower energy efficiency (881 kWh/Mg). This result was not found for beer produced in breweries of different potential, whose carbon footprint increased approximately 1.5 times, from 101 to 147 kg CO
2e/hL, as the production capacity of the brewery decreased from 10 million to 500 hL/year [
30].
4.4. Mitigation Strategies and Future Improvements
Based on the above analysis, malting sustainability can be further improved through:
Optimal barley variety selection requiring fewer inputs and yielding high-quality malt can minimize environmental impact. The development of perennial malting barley, as noted by Windes et al. [
31], offers potential long-term ecosystem service benefits, including improved soil health (enhanced structure, reduced erosion, increased water infiltration), enhanced water quality (pollutant filtration, runoff reduction), increased carbon sequestration, greater biodiversity through habitat provision, and natural weed suppression (reducing herbicide use). However, the development of perennial varieties is complex and time-intensive. More immediate sustainable management practices can also be effectively implemented with current and future annual varieties. These include no-till farming to minimize soil disturbance, double cropping (e.g., barley–soybean) for continuous ground cover, and utilizing facultative barley varieties for flexible planting. These strategies can reduce the need for annual tilling, fertilizer applications, and pesticide use. Notably, Yawson et al. [
32], using the FAO AquaCrop model under rain-fed conditions, found that simulated spring barley yields in the UK showed limited variation across low, medium, and high emission scenarios and three future time periods (2030s, 2040s, 2050s), with a maximum standard deviation of 1.08. This suggests that even under varying climate projections, sustainable management of annual varieties can contribute to relatively stable yields.
Energy efficiency: Adopting advanced technologies and process optimization to reduce energy consumption in all malting stages.
Renewable energy integration: Transitioning to renewable energy sources for malting processes, particularly drying, can significantly lower carbon footprints.
Optimizing logistics: Minimizing transportation distances by locating malting facilities near barley production and consumption areas.
By-product valorization: Exploring and implementing methods to utilize malting by-products for other applications, reducing waste and creating value.
Kilning is the primary energy-intensive stage in malting, as highlighted in
Table 1. Given the sequential nature of malting and brewing as processes of water addition and removal, using green malt—sprouted, unkilned cereal grains—presents a significant opportunity to decrease energy consumption and carbon footprint, a point thoroughly explored by Dugulin et al. [
33]. While historically and in some specialized modern applications, brewers and distillers have utilized unkilned or lightly kilned malt to achieve distinct “raw” or “fresh” flavor profiles, considerable obstacles remain. The fundamental challenge lies in green malt’s inherent instability due to its high moisture content (41–48%), leading to a limited shelf life and the need for immediate and efficient processing. This necessitates close geographical proximity between malting and brewing operations. Beyond logistics, processing presents difficulties. Existing milling, mashing, filtration, and sparging methods require modification to ensure consistent extraction and accommodate green malt’s unique properties. Furthermore, the impact of green malt on final product quality must be considered. Increased lipoxygenase (LOX) activity can accelerate staling and negatively affect foam stability, key aspects for consumer satisfaction. Adjustments to brewing water are also necessary to account for green malt’s altered composition. These challenges, however, pave the way for innovation. Green malt’s stability and shelf life can be improved through the production of malt extracts, strategic combination with 10–20% green malt alongside kilned malt or unmalted cereals, or through cold and dry storage to inhibit microbial growth [
33]. Processing methods require refinement, such as adopting wet milling systems instead of dry milling and optimizing traditional filtration and sparging for green malt’s specific characteristics. LOX-related issues can be mitigated by carefully controlling mashing conditions, maintaining strict temperature (>62 °C), pH (5.2) and near-zero oxygen levels, or by utilizing barley varieties with reduced or absent LOX activity [
33]. Ultimately, comprehensive sensory analysis and consumer testing are crucial to evaluate how these changes affect the beer’s flavor, aroma, and overall consumer experience.
Another significant challenge in malt production is the substantial water consumption and the resulting wastewater generation. The EUREKA SWAN project [
34], a collaborative initiative involving UK and French maltsters, scientists, and industry experts, investigated the potential for recycling water used during barley steeping. Firstly, the project identified a quinone [
35] as the inhibitor responsible for hindering malt quality. Effective removal of this inhibitor was achieved by integrating a membrane bioreactor with reverse osmosis. This combined system also successfully eliminated pesticides, mycotoxins, and heavy metals, enabling a realistic reuse of up to 70% of the steeping water. Notably, this recycled water proved as effective as fresh water, resulting in beers of the same high quality [
36]. The economic viability of this recycling process is dependent on local water costs [
34].
To better understand the potential environmental benefits of some of the proposed mitigation strategies, the barley supply chain for malthouse C, a significant Italian malt producer supplying 57% of its output to a single brewery 40 km away, was considered to explore several avenues for improvement.
Regarding the optimal selection of barley varieties, an analysis of the Agrifootprint v. 6.3 database revealed substantial variations in the Product Environmental Footprint (PEF) of 1 kg of barley grains at the farm gate across different regions. Values ranged from a low of 48 μPt/kg in Romania to highs of 390 and 566 μPt/kg in China and Japan. The primary environmental hotspots also differed: land use in Romania (22% of PEF) versus freshwater ecotoxicity in China and Japan (approximately 76% of PEF).
Given the absence of specific data on the impact of reduced agricultural practices on barley cultivation in Central Italy, the mitigation scenarios for malthouse C were modeled based on several assumptions:
- -
Local barley sourcing with optimized practices: Raw barley grains are sourced from Central Italy and cultivated under the same agronomic and rain-fed conditions, achieving comparable crop yields to those reported in Romania. This assumes the successful adoption of optimized agricultural practices tailored to the local context.
- -
Renewable energy integration: All electric energy consumed by the malthouse is assumed to be sourced from on-site or nearby solar photovoltaic systems.
- -
Sustainable logistics: The transportation of both raw barley to the malthouse and finished malt to the brewery is transitioned from road to rail transport.
- -
Kilning efficiency through direct use: Leveraging the proximity of the main brewery, it is assumed that 30% of the germinated barley grains are directly utilized without undergoing the energy-intensive final kilning stage.
To quantify the potential energy savings from the kilning process in the case of green malt production, we referenced data from the Tamworth malthouse (
Table 1), which has a similar production capacity to malthouse C. The Tamworth data indicates that electrical and thermal energy consumption associated with kilning represent approximately 40% and 89% of their total energy consumption, respectively. Applying the 30% direct use assumption, the overall amount of malt produced would reduce to 31,737 Mg/yr, while that of green malt with a moisture content of 40% (
w/
w) would be around 21,627 Mg/yr. Thus, the electricity consumption associated with kilning would reduce from (145.2 × 45,338.6 × 0.40) ≈ 2,632,836 kWh/yr to (145.2 × 31,737 × 0.40) ≈ 1,842,985 kWh/yr (a reduction of approximately 790 MWh/yr), while the thermal energy consumption would reduce from (604.86 × 45,338.6 × 0.89) ≈ 24,406,779 kWh/yr to (604.86 × 31,737 × 0.89) ≈ 17,084,745 kWh/yr (a reduction of approximately 7.3 GWh/yr).
The resulting impact of these assumptions on the main Product Environmental Footprint scores, that is climate change (CC), ecotoxicity freshwater (ETFW), and land use (LU), both as absolute values and when normalized and weighted, as well as the overall PEF score, are summarized in
Table 8.
Compared with the baseline scenario, each individual measure reduced the malt carbon footprint from 0.80 kg CO2e/kg to
- -
0.66 kg CO2e//kg (−17.5%) with Romanian barley sourcing;
- -
0.76 kg CO2e/kg (−5.0%) with solar photovoltaic power;
- -
0.73 kg CO2e/kg (−8.8%) with rail transport;
- -
0.74 kg CO2e/kg (−7.5%) with 30% green malt production.
Applying all four measures together compounded these gains, slashing emissions to 0.49 kg CO2e/kg—a 38.8% reduction.
Switching only to Romanian barley delivered the largest single-measure benefit in freshwater eutrophication (227 → 32 CTUe/kg) and land use (196 → 136 Pt/kg). However, the combined strategy achieved an 86% reduction in freshwater eutrophication and a 30% land use saving. These improvements are mirrored in the normalized and weighted impact scores. The overall Product Environmental Footprint fell from 192 µPt (baseline) to 81 µPt with the sustainable barley switch alone, and further to 70 µPt with all measures applied. Despite these gains, barley production remained the dominant contributor to PEF (88.7% baseline; 84.4% combined), while the share of thermal energy consumption doubled from 4.7% to 9.5% under the full mitigation package.
Although sustainable barley sourcing alone yielded substantial PEF reductions, the integrated package offered the greatest decarbonization and detoxification potential. Further site-specific analysis will refine these estimates and guide the practical implementation of these mitigation strategies.
5. Conclusions and Future Perspectives
This study highlighted how the environmental footprint of barley malt is influenced by agricultural practices, production size, and technologies employed.
Key findings include the following:
- -
Influence of agricultural practices: Differences between Italian and German farming —reflected in land use and acidification impacts—demonstrate how agronomic choices significantly affect the Product Environmental Footprint (PEF) of malt.
- -
Importance of production scale and logistics: Malthouse A, the smaller facility, registered a higher PEF (221 µPt/kg) due to greater energy consumption (1210 kWh/Mg). By contrast, malthouse B achieved the lowest PEF (177 µPt/kg) by offsetting lower energy efficiency (881 kWh/Mg) with reduced transport impacts, thanks to its proximity to the brewery.
- -
Mitigation potential through targeted measures: Operators can reduce malt PEF by promoting sustainable agriculture, adopting renewable energy, optimizing transport, and improving process efficiency. Notably, switching to sustainably sourced barley (from Romania) alone cut the carbon footprint by 17.5% and reduced freshwater eutrophication from 227 to 32 CTUe/kg, land use from 196 to 136 Pt/kg, and overall PEF from 192 to 81 µPt/kg.
While this study offers an in-depth LCA of barley malt’s environmental impact, it is important to acknowledge certain limitations. These include the representativeness of the sample and methodological assumptions, such as uncertainties in inventory data and impact models. Future research could enhance robustness through a more comprehensive cradle-to-grave analysis, encompassing waste management, alternative raw materials (e.g., organic or heritage barley), and emerging production technologies.
Ultimately, a holistic sustainability strategy for barley malt production is essential. This strategy should integrate agricultural practices, renewable energy, logistics optimization, and process efficiencies. To further guide the industry, future efforts should also integrate social and economic dimensions into LCA, expand full life cycle boundaries, and develop practical, sector-specific tools. These tools could help malthouses to benchmark performance, define comprehensive sustainability strategies, and drive continuous improvement.


