Article

Does the Carbon Emission Trading Pilot Policy Enhance Carbon Reduction Efficiency?

Business College, Yangzhou University, Yangzhou 225127, China
*
Author to whom correspondence should be addressed.
Sustainability 2025, 17(11), 5076; https://doi.org/10.3390/su17115076
Submission received: 9 May 2025 / Revised: 29 May 2025 / Accepted: 30 May 2025 / Published: 1 June 2025
(This article belongs to the Section Economic and Business Aspects of Sustainability)

Abstract

:
The creative breakthroughs in policy implementation by China hold essential practical importance for promoting global sustainability. The carbon emission trading (CET) pilot policy initiated in 2011 provides a quasi-natural experimental setting to investigate the dual impacts of market-incentivized environmental regulation on corporate carbon emissions (CEs) and capacity utilization (CU) enhancement. This study employs panel data from A-share listed manufacturing companies on the Shanghai and Shenzhen stock exchanges spanning 2007–2022, constructing a corporate carbon reduction efficiency (CRE). A Generalized difference-in-differences (DID) approach is adopted to examine the policy effects. The study reveals that the execution of the CET pilot policy has shown a notable and enduring enhancement in corporate CRE, yielding the combined advantage of advancing corporate decarbonization and improving CU. These conclusions remain resilient despite thorough sensitivity analysis. Furthermore, the pilot improves CRE via three principal avenues: augmenting corporate innovation capabilities, increasing green investment intensity, and refining managerial practices. The impacts of CET pilots are most significant in state-owned firms (SOEs), capital-intensive industries (CIEs), eastern region enterprises (EEs), and sectors with little market concentration. The findings set essential empirical standards for assessing decarbonization initiatives and guiding social progress towards sustainability.

1. Introduction

Since 1980, China has undergone swift economic growth; yet, this progress has been accompanied by considerable energy consumption [1] and enormous carbon emissions (CEs) [2]. The rise in CEs intensifies the greenhouse effect, disturbs natural equilibrium, and endangers the human habitat [3]. China has enacted various environmental regulatory measures to tackle CEs, broadly classified as command-and-control laws and market-incentive rules. China’s command-and-control environmental policies, created over an extended duration, frequently utilize methods such as firm shutdowns to attain carbon reduction [4]. Although these laws have shown some efficacy in mitigating CEs [5], their limitation is the potential for inducing CE rebound [6]. Thus, attaining CE reduction while facilitating social development has emerged as the fundamental solution to contemporary carbon reduction challenges [7].
Market-based environmental rules have opportunities to further mitigate the conflict between economic expansion and carbon reduction. To further tackle CE challenges, China commenced carbon emission trading (CET) pilots in 2011 and officially established a statewide CET market in 2021. Recent studies have performed comprehensive analyses on the implications of CET, specifically regarding their influences on circular economy [8], innovation [9], resource usage efficiency [10], and environmental regulatory standards [11]. However, the current literature predominantly focuses on the impact of single policies, failing to establish a comprehensive assessment framework that integrates environmental benefits with economic efficiency. It also lacks an examination of policy dynamic effects, thereby inadequately addressing the core contradiction of how CET pilot programs balance short-term emission reduction pressures with long-term growth demands. This deficiency renders existing conclusions insufficient to support the design of synergistic pathways between “Industry, Innovation and Infrastructure (SDG9)” and “Climate Action (SDG13)” under the United Nations Sustainable Development Goals (SDGs).
The micro-level expression of economic growth and company efficiency is seen in the simultaneous decrease in corporate inefficiency and enhancement of capacity utilization (CU). CET offers potential for advancing corporate CE reduction and improved carbon utilization via market mechanisms. This study utilizes the quasi-natural experiment of CET pilots to examine whether these mechanisms can concurrently enhance corporate CE reduction and corporate utility improvement, thereby offering strategic recommendations for achieving enduring economic/environmental synergies. This research yields three primary contributions: By consolidating CEs and CU into a singular metric of carbon reduction efficiency (CRE), it confirms that CET initiatives can improve company CRE, yielding the combined advantages of emissions reduction and CU development. Beyond baseline studies, this study employs a dynamic analytical approach to illustrate that CET promptly decreases corporate CEs in the short term, while progressively enhancing CU over the long term. Grounded in theoretical frameworks, we verify three mechanism pathways through which the policy boosts carbon abatement efficiency.
This paper introduces the carbon reduction efficiency index, elucidating the synergistic mechanisms of market-driven environmental legislation. It empirically validates that CET pilot projects confer a dual company benefit in emissions reduction and productivity improvement, hence offering policy insights for global sustainability.

2. Literature Review

The sustained surge in global CEs in recent years has drawn substantial academic scrutiny. Within the research framework of CE governance pathways, scholars have established a dual-dimensional analytical structure encompassing policy instruments [12] and non-policy measures [13,14]. The former centers on governmental regulation and market mechanisms, with representative models including CET pilot programs [15] and low-carbon urban development [16]. The latter emphasizes endogenous institutional reforms such as urban spatial restructuring [17] and corporate strategic transformations [18]. Significantly, alongside the rapid expansion of the digital economy, the interplay between digital technologies and CEs has emerged as a cutting-edge research domain in environmental economics. Existing studies confirm that advancements in digital technologies hold substantial potential for CE mitigation [19]. Current scholarly focus spans four key dimensions: the digital economy [20,21], digital innovation [22], construction of digital infrastructure [23], and digital finance [24], all demonstrating measurable inhibitory effects on CEs at municipal and enterprise levels through distinct operational mechanisms.
Environmental regulations are chiefly classified into market-incentivized, command-and-control, and voluntary categories. Since the commencement of reform and opening-up, China’s environmental regulatory structure has primarily depended on command-and-control methodologies. Chinese scholars have extensively researched CU and carbon reduction within the framework of classic command-and-control environmental legislation.
The current literature reveals conflicting results concerning the effects of environmental legislation on CU. CU, being the principal indicator for assessing overcapacity and enhancements in capacity efficiency, is acutely responsive to national policy interventions, including environmental regulations. Certain studies indicate that environmental rules substantially improve capacity use and effectively alleviate overcapacity [25,26,27]. Moreover, certain research suggests that environmental laws do not demonstrate substantial effects on CU, and their influence is inherently constrained to a limited degree [28].
Scholarly debates persist regarding the impacts of environmental regulation policies on CEs, mirroring the divergence observed in their effects on corporate CU. Certain experts contend that environmental rules directly promote CEs [29,30,31,32]. Conversely, some observe an inverted U-shaped pattern, in which emissions intensity initially increases before decreasing as controls become more stringent [33,34]. Furthermore, several scholars argue that conventional environmental restrictions lack substantial effects on CEs [35,36].
The aforementioned literature indicates that the majority of existing studies employ one-dimensional metrics, such as carbon intensity, and fail to differentiate between the diverse strategies employed by firms to comply with standards, whether through genuine emission reductions or merely by decreasing production.
Since the initial implementation of sulfur dioxide (SO2) emissions trading in China in 2002, researchers have examined the impact of domestic market-driven environmental regulations, concluding that SO2 emissions trading effectively reduces SO2 emissions [37]. The initiation of CET pilots in 2013 further broadened scholarly investigation into market-incentivized regulatory mechanisms. The primary aim of carbon trading pilots is emission reduction, leading to a significant volume of literature addressing this aspect. Current research primarily corroborates the carbon reduction impacts of these pilots, with numerous studies utilizing difference-in-differences (DID) models for verification [38,39,40]. Others utilize Synthetic Control Methods (SCMs) to corroborate these findings [41,42]. In addition to assessing carbon reduction effects, researchers have investigated market-administrative synergies and technological innovation [43,44].
Despite numerous studies on carbon trading pilot projects, the current research predominantly focuses on macro-effects while neglecting the deconstruction of micro-mechanisms, typically analyzing environmental benefits or economic impacts in isolation. This paper challenges conventional unidirectional policy assessment by demonstrating, for the first time, that market-based environmental regulation can achieve a synergistic effect of green transformation and capacity optimization, offering both theoretical advancements and practical insights from China’s context for the development of a global carbon market.

3. Theoretical Analysis and Research Hypothesis

3.1. Impact of Carbon Trading Pilots on CRE

The institutional framework of CET projects radically reconfigures the relationship between environmental control and industrial development via market processes. When CEs are classified as tradable property rights, firms with lower reduction costs benefit by selling quotas, whilst enterprises with higher reduction costs acquire quotas to sustain production. This market-oriented selection motivates companies to surpass compliance standards and attain further emission reductions. Moreover, carbon pricing mechanisms incentivize companies to overcome reliance on traditional technologies, fostering innovations in sustainable manufacturing methods and energy replacement solutions. These improvements not only decrease CEs per output unit but also alleviate internal overcapacity via technological spillovers. This paper proposes the following hypothesis:
Hypothesis 1.
The implementation of CET pilots will synergistically enhance corporate carbon reduction and capacity efficiency.

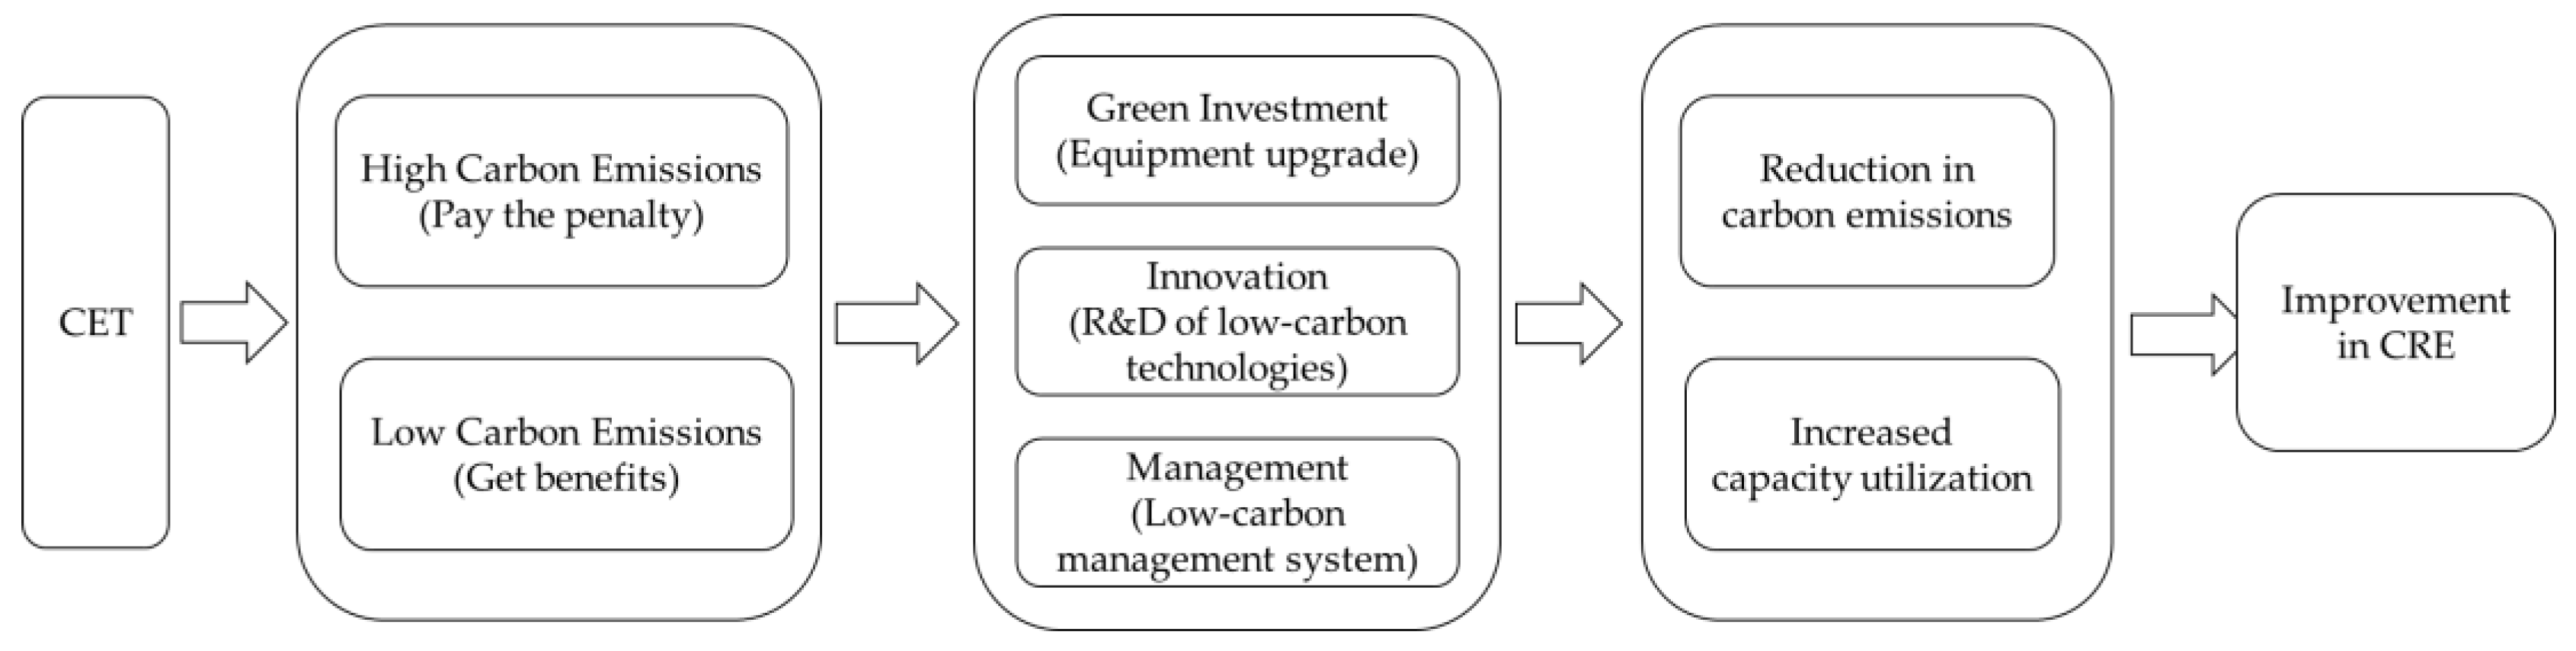
3.2. Mechanisms of CET Pilots to Promote the CRE of Enterprises

When enterprises are incorporated into CET pilots, market-incentivized environmental regulations internalize the environmental externalities generated by firms. CE quotas force enterprises to confront the reality that exceeding emission limits incurs additional costs, while improvements in CRE directly translate into profit gains. This two-way economic leverage compels firms to reassess production models. To alleviate quota-purchasing cost pressures or expand surplus quota revenues, enterprises prioritize green investment—such as retrofitting energy-intensive equipment and adopting renewable energy to reduce emissions. Concurrently, binding emission targets create technology-forcing effects, compelling firms to abandon conventional technological pathways and innovate through low-carbon technologies or digital reduction tools to achieve cost-efficient compliance. This drives the development of green production lines and process optimization.
The imperative for precise carbon accounting and real-time emissions tracking further necessitates enterprises to establish granular carbon management systems spanning supply chains and production cycles, thereby systematically enhancing resource efficiency and risk governance. Consequently, this study posits that CET pilots elevate CRE through three mechanisms: amplified green investment, technology-forcing innovation, and improved managerial efficiency.
Optimizing investment structure. The price discovery mechanism formed by the CET pilot through the shortage of carbon allowances prompts enterprises to internalize the cost of CEs into the investment decision framework [45]. When the carbon price reaches a firm’s marginal abatement cost threshold, firms will hedge the upward risk of carbon cost by shortening the depreciation life of traditional equipment. In this process, cleantech equipment has the dual attributes of a productive investment and a carbon risk hedging tool. Through the green substitution of production factors, enterprises realize production function reconstruction under the constraint of environmental carrying capacity, forming resource-intensive production capacity to replace traditional production capacity and effectively compressing the scale of CEs [46].
Innovative technological leap. CET pilots rely on the commoditization property of carbon quota to transform the R&D of emission reduction technology into a strategic asset with market value [45]. Enterprises have systematically migrated R&D resource allocation to low-carbon technology fields in the innovation system, upgraded their innovation goals from passive compliance to active acquisition of carbon asset premiums, and internalized the technology spillover effect by constructing patent alliances for low-carbon technologies. This innovation-driven mechanism reduces CEs per unit while achieving structural optimization of CU through the elimination of backward production capacity and technological efficiency improvement.
Reshaping the management system. CET pilots have forced enterprises to build carbon asset management systems by giving CE information the attributes of verifiable and tradable assets [47]. The carbon trading mechanism prompts enterprises to shift their production model from profit maximization to carbon efficiency optimization and promotes the transformation of organizational structure to a cross-sectoral synergy mode. This upgrading of management capacity enables enterprises to flexibly adjust the ratio of high- and low-carbon production capacity and achieve a stepwise decline in CE intensity while maintaining a continuous increase in CU.
Building on the above analysis, this paper proposes the following hypothesis:
Hypothesis 2.
The implementation of CET pilots improves CRE by enhancing green investment, innovation capabilities, and managerial efficiency.
The mechanism roadmap of this article is shown in Figure 1.

4. Empirical Strategy and Data Sources

4.1. Impact of Carbon Trading Pilots on CRE

4.1.1. Data Source

The Chinese government first proposed CET pilot programs in 2011, though their formal implementation began after 2013. In December 2013, Shenzhen, Beijing, Shanghai, Guangdong, and Tianjin were designated as the initial pilot regions. Chongqing and Hubei joined in 2014, followed by Fujian in 2016.
This paper chooses to take all domestic A-share listed companies in Shanghai and Shenzhen in the manufacturing industry during the period of 2007–2022 as the initial sample, and considering the uncertainty of the enterprises joining the CET pilot at a later stage, this paper chooses to take the first batch of enterprises joining the CET pilot as the experimental group and the other enterprises as the control group. The data of listed companies joining the CET pilot are manually organized based on the disclosure data of local development and reform commissions and local ecology and environment departments; the financial data of the relevant enterprises are all from the China Economic and Financial Research Database (CSMAR database); and the data of the relevant prefectural-level municipalities and industry control variables are manually organized based on the disclosure data of the statistical yearbooks of their respective provinces and the disclosure of the regional development and reform commissions. Meanwhile, in order to ensure the rationality of the data, this paper chooses to use the following ways to process the raw data:
  • Excluding enterprises with “ST” and “*ST” in their stock abbreviations, which may face specific financial difficulties and accounting treatment problems;
  • Excluding enterprises with a large number of missing financial values;
  • Excluding outliers, including missing values and unreasonable values, and shrinking all continuous variables at the 1% level.
After the above processing, 12,672 data points, including 1669 enterprises, are finally obtained. The descriptive statistics of the main variables are summarized in Table 1. The mean value of the dependent variable, CRE, is −4.493, with a minimum of −9.628 and a maximum of 0.303, reflecting substantial variation across firms. Additionally, green patent counts display significant heterogeneity, with a maximum value of 996 and a mean of 1.803, indicating limited independent development of green patents by firms. The did variable has a mean of 0.021, suggesting a low proportion of firms included in carbon trading pilots and highlighting the urgency of establishing a nationwide carbon market.

4.1.2. The Impact of CET on the CRE of Enterprises

The implementation of CET pilots induces changes in CU and CE levels of enterprises during pre- and post-implementation periods, while creating observable divergences between participating and non-participating firms. Given the staggered rollout across pilot provinces/municipalities, this study employs the carbon trading pilots as quasi-natural experiments and adopts a Generalized DID approach to evaluate their dual effects on carbon reduction and capacity efficiency enhancement. The empirical model is specified as follows:
C R E i t = β 0 + β 1 d i d i t + μ i + φ t + γ X i t + ε i t ,
The dependent variable C R E i t captures the win–win degree of carbon reduction and capacity efficiency of enterprise i in year t , defined as CRE. The policy dummy variable d i d i t is assigned a value of 1 if enterprise i is subject to the CET pilot in its registered region during year t ; otherwise, it is 0. Individual fixed effects μ i and time fixed effects φ t control for unobserved heterogeneity across firms and temporal trends, while ε i t represents the idiosyncratic error term. The vector X i t incorporates covariates such as firm size, capital intensity, and energy mix. The coefficient β 1 quantifies the causal effect of the pilot policy on CRE, isolating its dual impact through rigorous counterfactual comparisons between treated and control groups under staggered policy adoption.

4.1.3. The Impact of CET on Corporate CEs and CU

The existing literature consistently identifies lagged effects of CET pilots on multiple variables, with CEs exhibiting particularly pronounced policy response delays [48]. The current literature indicates that the CET pilot has a four-year lagged effect on corporate green innovation [49], whilst its influence on corporate energy use transformation shows a three-year lag [50]. Moreover, research has revealed a two-year delay in the pilot’s impact on carbon intensity [48]. In light of the varying temporal lag effects among variables, this paper designates a median value of three years as the threshold distinguishing long-term from short-term impacts. This study employs precise measurements of CU and CE levels, adopting a three-year threshold to distinguish short-term versus long-term impacts. We systematically quantify the differential temporal effects of carbon trading pilots on corporate CEs and CU through the following dynamic model specification:
l n C u i t = α 0 + α 1 d i d _ s h o r t i t + α 2 d i d _ l o n g i t + μ i + φ t + γ X i t 1 + ε i t 1 ,
The variable l n C u i t represents the natural logarithm of CU for enterprise i at time t . The dummy variable d i d _ s h o r t i t captures the short-term effect of the CET pilot, assigned a value of 1 if enterprise i has participated in the pilot for ≤3 years by period t ; otherwise, it is 0. Conversely, d i d _ l o n g i t measures the long-term effect, taking a value of 1 if participation duration exceeds >3 years by t ; otherwise, it is 0. Here, α 1 quantifies the impact of the pilot policy on CU within the first three years of implementation, while α 2 captures its persistent effects beyond three years. All other variables retain their economic interpretations as previously defined in the model.
l n C E i t = γ 0 + γ 1 d i d _ s h o r t i t + γ 2 d i d _ l o n g i t + μ i + φ t + γ X i t 2 + ε i t 2 ,
The variable l n C i t denotes the natural logarithm of carbon dioxide emissions for enterprise i at time t . All other variables retain their definitions consistent with the aforementioned specifications in the model.

4.2. Variable Declarations

4.2.1. Dependent Variable and Explained Variable

In Equation (1), the dependent variable C R E i t is defined as the natural logarithm of the ratio of enterprise CU to CEs. CRE implements the principle of eco-efficiency, which focuses on optimizing economic value while reducing environmental consequences. CRE integrates CU, indicative of productive efficiency, and CEs, a metric of environmental impact, to embody the dual aims of sustainable production: enhancing resource utilization and diminishing carbon intensity. This parallels the Malmquist–Luenberger (ML) index [51], which assesses productivity increase by integrating unwanted outputs (e.g., emissions). In contrast to the ML index, CRE employs a fixed ratio to highlight the trade-off between CU and CEs at a certain moment, enhancing its interpretability for policy assessment. Specifically,
C R E i t = ln C u i t / C E i t ,
C u i t denotes the CU of enterprise i at time t . To ensure methodological rationality and precision in measuring CU, this study adopts the cost function approach implemented by Morrison (1985) [52]. Recognizing the intrinsic correlation between corporate CEs and energy consumption, we augment the original cost function by incorporating energy factors.
The measurement of enterprise CU rate is conventionally defined as the ratio of actual output to potential output, expressed as
C U i t = Y i t / Y i t * ,
where C U i t denotes the CU rate of enterprise i during year t , Y i t represents the actual output, and Y i t * signifies the potential output to be estimated. The subsequent section elaborates on the computational methodology for actual output. This study specifies the enterprise production function in C o b b D o u g l a s form:
Y i t = A i t K i t α L i t β V i t γ E i t δ ,
where Y i t , K i t , L i t , V i t , and E i t , respectively, denote the total output, capital stock, labor input, intermediate input, and energy consumption of enterprise i during period t .
The firm’s objective of profit maximization implies cost minimization in the short run. Given that enterprises do not significantly adjust capital investments over short-term horizons, we fix capital input as K ¯ i in the short run. The short-run average cost function is specified as
S A T C i t = ( P K t K ¯ i + P L t L i t + P V t V i t + P E t E i t ) / Y i t ,
As established above, short-term cost minimization for enterprises constitutes an essential condition for profit-maximizing resource allocation:
max π i t = P Y t A i t K ¯ i α L i t β V i t γ E i t δ P K t K ¯ i + P L t L i t + P V t V i t + P E t E i t ,
Taking partial derivatives of π i t with respect to L i t , V i t , and E i t , respectively, and setting them equal to zero yields the first-order conditions:
V i t * = Y i t A i t 1 K ¯ i t α ( P V t / P L t ) ( β / γ ) β ( P V t / P E t ) ( δ / γ ) δ 1 / ( δ + β + γ ) ,
L i t * = ( P V t / P L t ) ( β / γ ) Y i t A i t 1 K ¯ i t α ( P V t / P L t ) ( β / γ ) β ( P V t / P E t ) ( δ / γ ) δ 1 / ( δ + β + γ ) ,
E i t * = ( P V t / P E t ) ( δ / γ ) Y i t A i t 1 K ¯ i t α ( P V t / P L t ) ( β / γ ) β ( P V t / P E t ) ( δ / γ ) δ 1 / ( δ + β + γ ) ,
Substituting the optimal input levels L i t * , E i t * , and V i t * into Equation (7) yields the corresponding short-run average total cost S A T C i t :
S A T C i t = F Y i t , P V t , P V t , P V t , P V t , K ¯ i , A i t ,
Within this framework, Y i t , A i t , β , γ , α , and δ are parameters to be estimated, while all other variables are observed. By taking the first derivative of S A T C i t with respect to Y i t and setting it to zero, we derive the firm’s potential output level under short-run cost minimization:
Y i t * = A i t K ¯ i α + β + γ + δ P K t / P L t β P K t / P V t γ P K t / P E t δ β β γ γ δ δ 1 / 1 β γ δ β + γ + δ ,
The enterprise CU can be formulated as
C u i t = Y i t / A i t K ¯ i α + β + γ + δ P K t / P L t β P K t / P V t γ P K t / P E t δ β β γ γ δ δ 1 / 1 β γ δ β + γ + δ ,
Y i t represents the actual output of enterprise i at time t . A i t denotes the total factor productivity (TFP) of enterprise i at time t . K i ¯ indicates the time-invariant capital stock of enterprise i . P K , P V , P L , and P E correspond to capital input, intermediate input, labor input, and energy input prices, respectively. α , β , γ , and δ represent the factor elasticities of capital, intermediate goods, labor, and energy inputs, which are parameters to be estimated. This study employs the established OP method [53] to estimate α , β , γ , δ , and A i t , with two-digit manufacturing industries stratified into high-pollution, medium-pollution, and low-pollution sectors for separate estimation. The values of α, β, γ, and δ obtained by the OP technique are presented in Table 2. Table 2 illustrates that energy is vital to the production process; however, as industrial pollution escalates, the significance of energy progressively declines. Figure 2 and Figure 3 illustrate the variations in CU among firms, both in total and categorized by ownership type. The research indicates a right-skewed distribution of enterprise-level capacity usage, marked by a peak displaced left of the mean and a prolonged tail extending towards elevated utilization levels. This suggests that the majority of firms function beneath the average CU, with only a minor fraction attaining comparatively high efficiency. Moreover, Figure 3 illustrates that non-state-owned firms experience more pronounced overcapacity challenges than state-owned enterprises.
C i t measures the CEs of enterprise i at time t . While the GHG Protocol Corporate Standard recommends direct measurement of enterprise-specific fuel consumption and production processes (Scope 1 emissions), primary activity data at the firm level remain unavailable for most non-pilot enterprises. To ensure methodological transparency, our sectoral allocation approach follows the GHG Protocol’s industry-level accounting guidelines for situations where entity-specific data are inaccessible. We calculate corporate CEs by multiplying the ratio of an enterprise’s operating costs to its industry’s total operating costs by industry-level CEs, where industry CEs are quantified through sectoral energy consumption multiplied by CE conversion factors. This approach aligns with the industry-level accounting principles recommended by the GHG Protocol for Scope 1 emission estimation when enterprise-specific activity data are unavailable. The specific procedure is as follows:
C O 2 = ( O p e r a t i n g C o s t s / Industry   Operating   Cos ts ) × Industry   Energy × 2.493 ,
Industry energy consumption is measured in standard coal equivalent (SCE), with a CO₂ emission coefficient of 2.493 tons per SCE.

4.2.2. Control Variables

Drawing on the research designs of existing literature [39,54] and taking into account actual specific circumstances, this paper controls for various firm-, industry-, and city-level variables that may influence corporate CRE.
Firm variables include firm capital intensity (Cap, expressed as the logarithm of the ratio of the firm’s net fixed assets to the number of employees), return on net assets (ROA, expressed as the ratio of the firm’s net profit to the owner’s equity), employee size (Emp, expressed as the logarithm of the number of employees), firm size (Size, expressed as the logarithm of the firm’s total assets), firm tax burden (Tax, expressed as the logarithm of the firm’s value added tax (VAT) payable), total factor productivity of the firm (TFP, calculated using the op method), and management shareholding (Mshare, expressed as the percentage of management shareholding).
City variables include whether the enterprise is located in a coastal city (City, 1 if the enterprise is located in a prefecture-level city with a coastal coast, and 0 if the opposite is true), the degree of intervention by the local government (Gov, expressed as the logarithm of the ratio of the government’s general fiscal expenditure to the GDP of the enterprise’s location), and the price of the carbon transaction (Price, expressed as the average price of the carbon transaction in the pilot cities of the carbon transaction); the industry control variables include whether the enterprise is located in a controlled industry (Regular, 1 if the enterprise is located in a controlled industry, and 0 if the opposite is true) and the degree of market concentration in the industry (HHI, the sum of the squares of each enterprise’s market share).

5. Analysis of Empirical Results

5.1. The Impact of CET on the CRE of Enterprises

Table 3 reports the results of the baseline regression, where Column (1) shows the effect of the CET pilot on firms’ CRE when control variables are added but time and individual are not controlled. In Column (2), this paper controls for time and individual effects while adding control variables, and the coefficient of did is 0.113 at the 5% level of significance, which indicates that, with all considerations taken into account, firms joining the CET pilot have higher CRE compared to firms not joining the pilot, and firms conducting the pilot improve their CRE by 11.3% compared to firms not conducting the pilot.

5.2. The Impact of CET on CEs and CU

Columns (3) and (4) in Table 3 present the long-term and short-term effects of the CET pilot program on corporate CEs and CU, respectively. The results in Column (3) reveal that the pilot’s impact on improving corporate CU exhibits significant dynamic heterogeneity: no significant effect is observed in the short term, but a statistically positive effect emerges in the long term. As shown in Column (4), the coefficient of d i d _ s h o r t is negative at the 10% significance level, while the coefficient of d i d _ l o n g not only demonstrates stronger statistical significance but also a markedly larger absolute magnitude. Its internal logic is as follows: enterprises facing CE limits in the early stage will give priority to reducing CE and capacity levels, while in the long term, they will consider improving corporate performance and improve their own CRE by improving the utilization rate of corporate capacity. The pilot trading policy has a deepening environmental governance effect: in the early stage of policy implementation, it can promote the CE reduction behavior of enterprises, and with the extension of the policy implementation period, the promotion of enterprise emission reduction shows a significant increase in the trend.

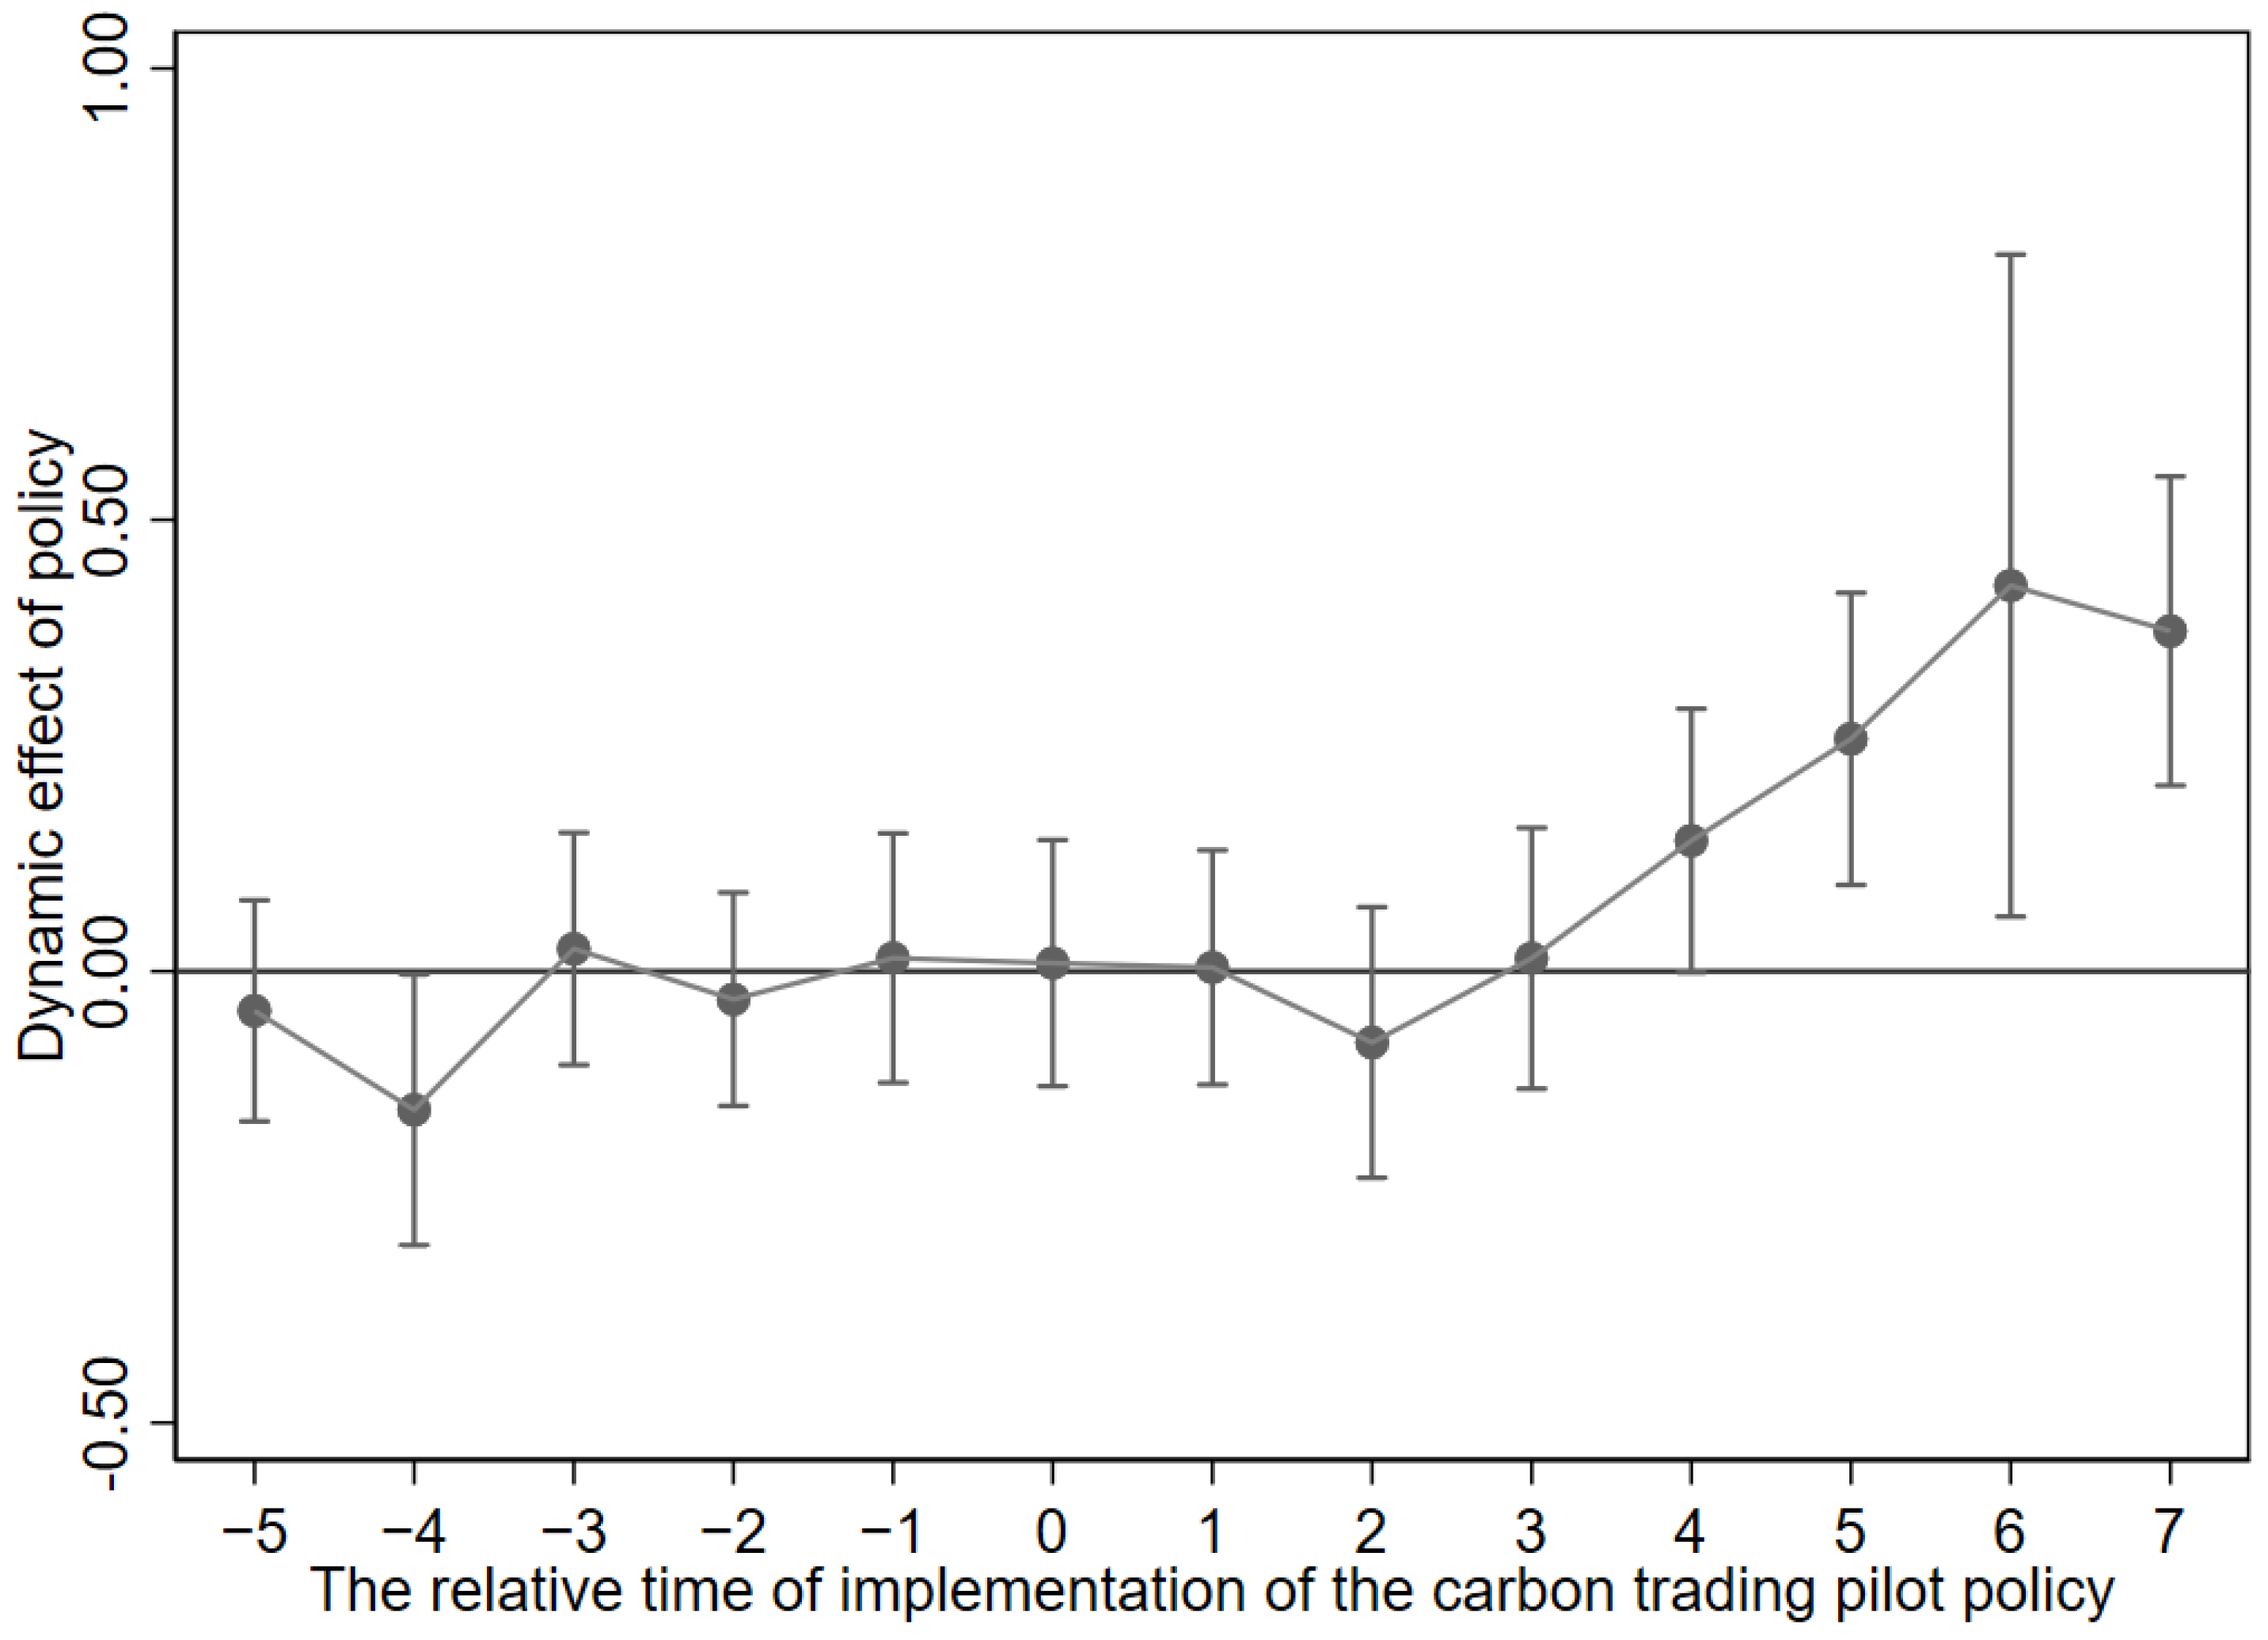
5.3. Parallel Trends Test
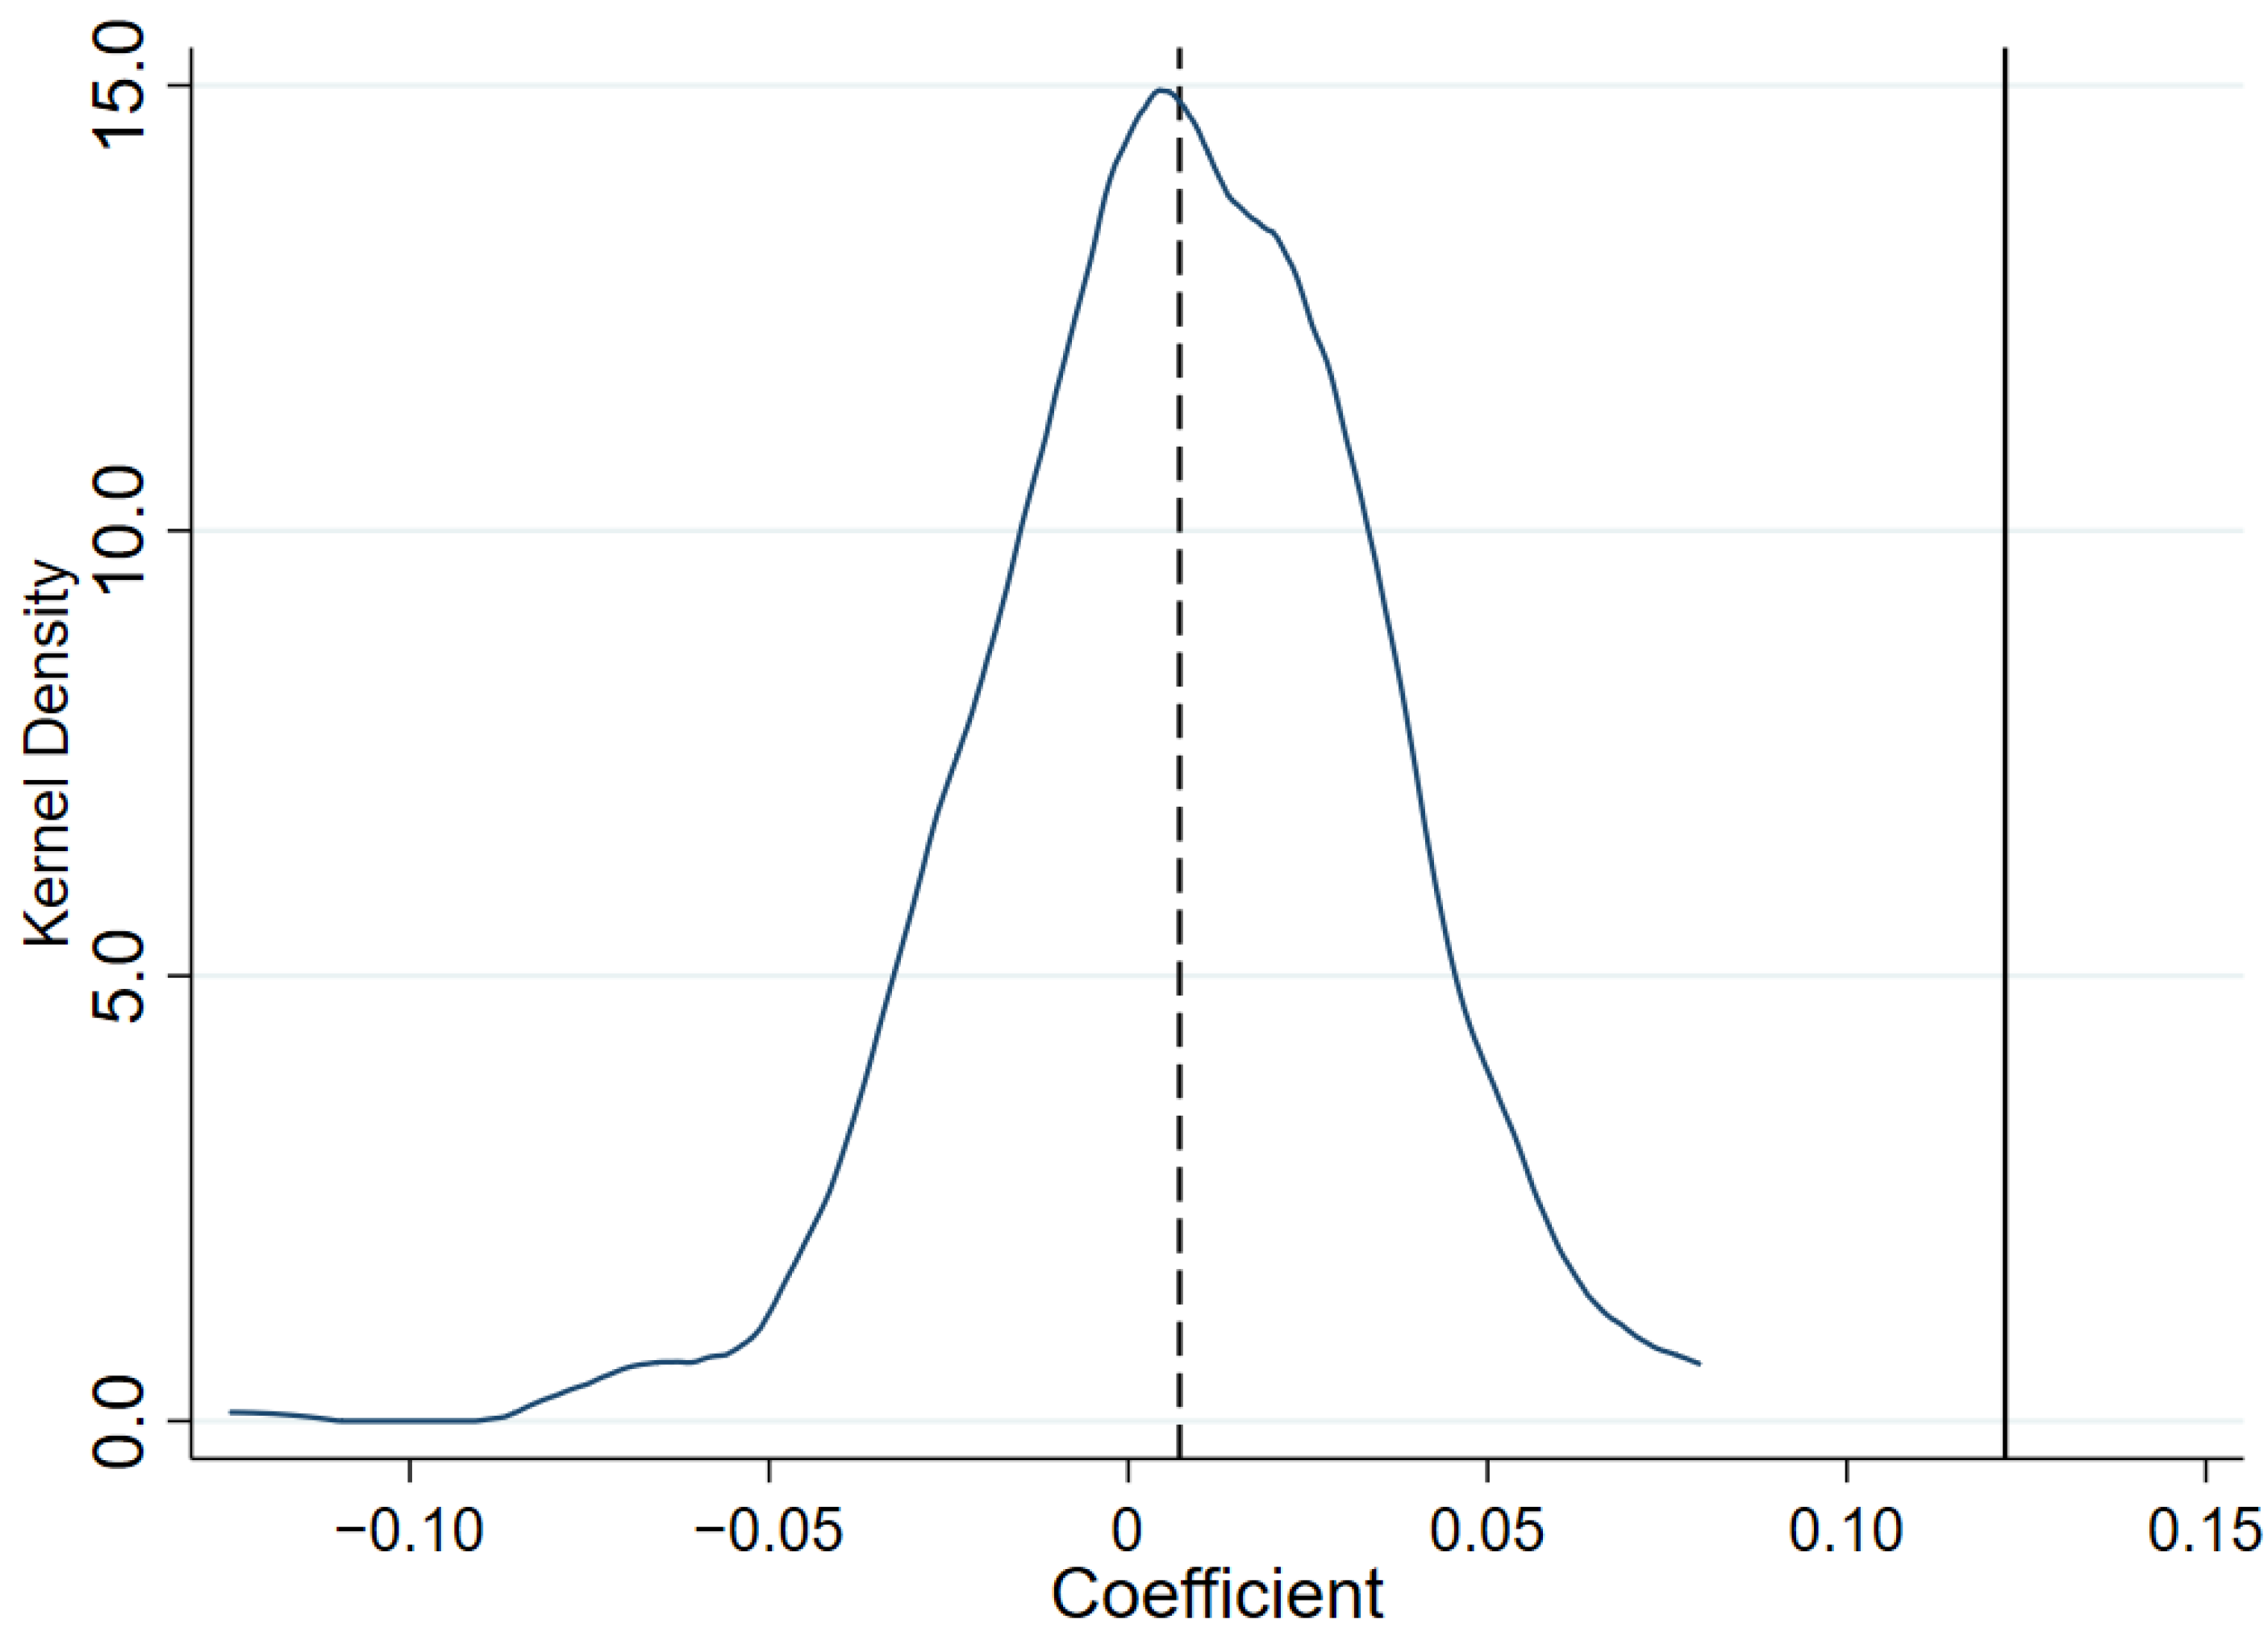
The Generalized DID model requires the parallel trend assumption to validate causal inference, which posits that the treatment and control groups exhibit parallel trends prior to policy implementation. Current methods for testing parallel trends include the event study approach, parallel trend plots, and statistical tests. This study employs the event study approach to test the parallel trend assumption. The model employed for the parallel trends test in this study is
C u _ C i t = β 0 + t = 5 7 δ t D i t + μ i + φ t + γ X i t + ε i t ,
where D i t indicates whether firm i participated in the CET pilot in period t , with a value of 1 if participating and 0 otherwise. The coefficient of interest is δ t .
Considering the scarcity of data prior to 2009 and after 2021, this paper summarizes the data for the first five years of the policy in issue −5 and the data for the seven years after the policy in issue 7. The findings of the parallel trends test, illustrated in Figure 4, indicate that the coefficients for all pre-treatment periods are statistically insignificant, signifying no systematic differences between pilot and non-pilot enterprises before the implementation of the policy. Although coefficients remain negligible from the first to third post-treatment years—aligning with our baseline regression findings—they attain significant positivity beginning in the fourth post-treatment year. This verifies that the carbon trading pilot has consistently improved corporate CRE over time.

5.4. Placebo Test

This study performs 500 random samplings of sample firms to alleviate potential confounding variables in the baseline regression results, designating the selected enterprises as the pseudo-treatment group and other cities as the control group for regression analysis. This method measures the impact of the pseudo-treatment group on enterprises’ CRE. Figure 5 illustrates that the placebo test reveals the effects of the pseudo-treatment group on CRE largely conform to a normal distribution centered at zero, greatly deviating from the baseline regression outcomes.

5.5. Robustness Test

5.5.1. Alternative CU Metrics

Unlike the cost function method, SFA does not require explicit estimation of potential capacity but instead uses optimal observed output as the benchmark [55]. This paper recalculates CU using SFA to derive a revised measure of corporate CRE and re-examines the impact of the carbon trading pilot. As shown in Table 4, Column (1), the coefficient of did remains significantly positive, confirming that the CET pilot consistently enhances corporate CRE even under alternative CU metrics. This result demonstrates that the policy achieves a win–win outcome of carbon reduction and improved CU.

5.5.2. Alternative CE Measurement

While existing datasets do not directly provide corporate CEs, sole reliance on a single calculation methodology would yield one-sided results. Consequently, we classify enterprises into two categories: The first category comprises enterprises that directly disclose their CE data, and this study utilizes such data. The second category includes enterprises that disclose their fossil energy consumption, electricity consumption, and heat consumption. For these enterprises, we manually collected their Corporate Social Responsibility (CSR) reports and Sustainability reports, and calculated their CEs based on China’s National Development and Reform Commission (NDRC)-issued Guidelines for Accounting Methods and Reporting of Greenhouse Gas Emissions by Enterprises in Different Sectors tailored to specific industries. The results in Column (2) of Table 4 show that the coefficient for the pilot remains statistically significant at the 5% level and retains its positive sign, reinforcing the robustness of the policy’s carbon reduction effect under revised emission accounting.

5.5.3. Propensity Score Matching Difference-in-Differences

This research uses the propensity score matching difference-in-differences model. To guarantee the precision of the DID estimates and mitigate potential selection bias resulting from city-level selective implementation of the carbon trading pilot, propensity score matching (PSM) is utilized. Table 5 displays specific results, with Columns (1) to (3) presenting estimates derived from nearest neighbor matching, radius matching, and kernel matching, respectively. The coefficients of the did variable in Columns (1)–(3) retain statistical significance and roughly correspond with the baseline regression outcomes.

5.5.4. Exclusion of Other Policy Interferences

There are a number of other policies that may affect the efficiency of carbon reduction by enterprises when CET policies are implemented. Among the policies currently in place, the Smart City Pilot Policy and the Low Carbon City Pilot Policy may have an impact on the CRE of enterprises. Concurrently, the “Five-Year Plan” constitutes a pivotal national policy in China. In recent years, CU and CEs have been consistently referenced in the specific programs of the central government and several provinces. In order to exclude the impact of the implementation of each policy on the CRE of enterprises, this paper, respectively, adds four policy dummy variables and their interaction terms with DID in Equation (1) to eliminate the impact of each policy on the CRE of enterprises. This methodology seeks to eradicate the impact of specific policies on enterprises’ CRE while assessing if the CET pilot can collaboratively improve CRE alongside other policies. Table 6 delineates the specific outcomes, with Columns (1) to (4) accordingly illustrating the effects of CET pilot deployment on corporate CRE following the incorporation of diverse policies and interaction terms. Table 6 illustrates that the CET pilot implementation persistently enhances corporate carbon reduction efficiency, even when integrating other policies and interaction terms, without exhibiting synergistic impacts with these policies.

5.6. Mechanism Test

This study employs the methods of Baron and Kenny’s approach to examine the validity of Hypothesis 2 by constructing the subsequent mediation effect model:
M i t = τ 0 + τ 1 d i d i t + μ i + φ t + γ X i t + ε i t ,
C R E i t = σ 0 + σ 1 d i d i t + σ 2 M i t + μ i + φ t + γ X i t + ε i t ,
Here, M i t denotes the mediating variable for enterprise i at time t, which includes green investment, green innovation, and management level, while the other variables are consistent with those previously stated.

5.6.1. Green Investment

This study collects and aggregates environmental governance- and green production-related investment expenditures from A-share listed manufacturing firms, thereby obtaining annual corporate green investment data. These values are then divided by total assets for normalization. Table 7 presents the mediating effect of green investment in Columns (1) and (2). Column (1) indicates that the adoption of CET substantially increases corporate green investment levels. Additionally, Column (2) indicates that while the coefficients for both green investment and did remain statistically positive, the coefficient for DID exhibits a decline relative to the baseline analysis. This suggests that green investment has a partial mediating effect on the influence of CET on CRE.

5.6.2. Innovation Performance

This study employs the logarithm of corporate innovation input as a measure of innovation level. Columns (3) and (4) delineate the influence of innovation on the effects of CET on CRE. The table indicates that CET substantially improves corporate innovation levels, with innovation serving as a partial mediator in the relationship between CET and CRE, akin to the impact of green investment.

5.6.3. Management Capability

This study measures corporate management efficiency using the ratio of administrative expenses to operating revenue. Columns (5) and (6) illustrate the influence of management level on the link between CET and CRE. Column (5) demonstrates that the DID coefficient is notably positive at the 5% level, signifying that CET substantially improves corporate management levels. In Column (6), the coefficient of DID is 0.0765, which stays significantly positive at the 5% level and markedly differs from its coefficient in the baseline regression. This indicates that management level partially mediates the effect of CET on CRE.

6. Heterogeneity Test

To investigate the differential impacts of carbon trading pilots across enterprise types, this study conducts heterogeneity analyses through grouped regressions based on enterprise ownership, geographical location, and industrial characteristics.
To analyze the variance in the effects of carbon trading based on enterprise ownership, we classify enterprises into state-owned enterprises (SOEs), non-state-owned enterprises (non-SOEs), capital-intensive enterprises (CIEs), and labor-intensive enterprises (non-CIEs).
The empirical findings in Table 8 (Columns 1–2) indicate that the did coefficient for SOEs is significant at the 10% level, whereas the coefficient for non-SOEs is insignificant. The rationale for this is that SOEs typically possess ample capital and a robust talent pool, endowing them with formidable capabilities in technological innovation. These enterprises can effectively master and implement various competitive core technologies, particularly in low-carbon, zero-carbon, and negative-carbon domains, thereby playing a pivotal role. This capacity for technological innovation enhances CU while simultaneously decreasing CEs, thus improving CRE [56].
Columns 3–4 illustrate the divergent effects between CIEs and non-CIEs. Carbon trading significantly impacts CIEs but lacks statistical relevance for non-CIEs. CIEs typically possess greater capital for investment in technical innovation and enhancement. These technical advancements contribute to the enhancement of energy efficiency and the reduction in CEs. Furthermore, by engaging in global value chains, CIEs can more efficiently obtain and use energy-saving and carbon-reduction technologies, thus attaining enhanced energy efficiency in production processes [57].
Provinces are categorized into eastern, central, and western regions to examine regional heterogeneity. Due to the scarcity of manufacturing listed firms in central/western regions, these territories are categorized as non-eastern provinces.
Table 8 (Columns 5–6) demonstrates more pronounced carbon trading effects in eastern enterprises (EEs) relative to their non-eastern counterparts. We suggest three elucidatory mechanisms: Initially, eastern regions advantageously possess advanced economic growth, sophisticated infrastructure, refined industrial structures, and established environmental governance frameworks, collectively facilitating green transitions. In contrast, central/western regions have limitations due to energy-intensive industries, inadequate infrastructure, minimal adoption of green technology, low population density, and economic underdevelopment, which restrict digital economy-driven decarbonization synergies.
We divide sectors into high-concentration and low-concentration categories by computing market concentration indices to evaluate heterogeneity.
Columns 7–8 demonstrate that firms in sectors characterized by heightened market competition show more significant improvements in carbon reduction efficiency under carbon trading. This happens because firms in marketplaces with lower concentration levels demonstrate improved green innovation performance. Within the limitations of CET pilots, such enterprises exhibit reduced CE and elevated CU rates [58]. At the same time, in industries characterized by low market concentration, firms seek to attain a competitive edge through innovations in environmental technology to prevent market elimination. Consequently, they exhibit a more vigorous response to environmental regulations. Furthermore, amid the intense market competition, firms possess very little market power and negotiating capacity with the government. Consequently, environmental restrictions can be efficiently enforced [59].

7. Conclusions and Policy Implications

7.1. Conclusions

In the context of global climate governance and green development, as the world’s largest carbon emitter, China’s CET pilot policy is of great significance in promoting corporate carbon reduction and capacity efficiency. Based on the panel data of A-share manufacturing companies listed in Shanghai and Shenzhen from 2007 to 2022, this study constructs an enterprise CRE index and adopts the progressive double-difference method to systematically assess the impact of the pilot carbon trading policy on the win–win degree of enterprise carbon reduction and capacity efficiency. The conclusions show that the implementation of the carbon trading pilot significantly improves the CRE of enterprises and dynamically promotes the carbon reduction and capacity efficiency of enterprises. This conclusion still holds after the parallel trend test, placebo test, and a series of robustness tests. The carbon trading pilot program improves the CRE of enterprises by increasing their green investment, innovation investment, and management level. State-owned enterprises, capital-intensive enterprises, eastern enterprises, and enterprises in industries with a low degree of market concentration are more significantly affected by the carbon trading pilot.

7.2. Policy Implications

Given that the execution of the CET pilot program can markedly improve the carbon reduction efficiency of enterprises, and that the effects of CE reduction and production CU fluctuate over time, it is essential to meticulously address these matters upon the official implementation of the CE rights trading market. The CET policy framework must advocate for cohesive governance of carbon reduction, pollution control, sustainable growth, and economic development. Immediate priorities encompass the enhancement of environmental permit regulations to limit high-energy initiatives and the initiation of a 100-day campaign aimed at achieving a carbon peak. Long-term solutions encompass green bonds and technological upgrade incentives to cultivate low-carbon, high-value products. Enhance the carbon market’s dynamic quota structure by associating emission standards with pollution control, establishing carbon sink trading avenues for ecological restoration, and incentivizing the spread of carbon-neutral production.
Policy instruments ought to include market incentives, innovation, and customized strategies: Enhance carbon price, provide tax incentives for low-carbon equipment enhancements, and implement carbon quota-for-patent exchanges to stimulate research and development. Establish a tiered enterprise management system—ensure state-owned enterprises are accountable for sector-specific emission reductions, offer finance for equipment renewal in capital-intensive industries, and provide tax incentives for the decommissioning of obsolete machinery. Synchronize quota distribution with production efficacy to reconcile environmental and economic objectives.

Author Contributions

Conceptualization, Y.W. and W.W.; methodology, W.W.; software, Y.W.; validation, W.W.; formal analysis, Y.W. and W.W.; investigation, Y.W. and W.W.; resources, Y.W.; data curation, Y.W.; writing—original draft preparation, Y.W.; writing—review and editing, Y.W. and W.W.; visualization, Y.W.; supervision, Y.W. and W.W.; project administration, Y.W.; funding acquisition, W.W. All authors have read and agreed to the published version of the manuscript.

Funding

This research was funded by the Youth Project of the National Natural Science Foundation of China (71903130) and the Youth Foundation of Humanities and Social Science Research of the Ministry of Education (18YJC790183).

Institutional Review Board Statement

Not applicable.

Informed Consent Statement

Not applicable.

Data Availability Statement

Data can be obtained from the authors by request.

Acknowledgments

Wanzong Wu and Yin Wang are joint first authors.

Conflicts of Interest

The authors declare no conflicts of interest.

Abbreviations

The following abbreviations are used in this manuscript:
DIDDifference-in-differences
CRECarbon reduction efficiency
CUCapacity utilization
CEsCarbon emissions
CETCarbon emission trading

References

  1. Tang, E.; Peng, C.; Xu, Y. Changes of energy consumption with economic development when an economy becomes more productive. J. Clean. Prod. 2018, 196, 788–795. [Google Scholar] [CrossRef]
  2. Jiang, P.; Chen, Y.; Geng, Y.; Dong, W.; Xue, B.; Li, W. Analysis of the co-benefits of climate change mitigation and air pollution reduction in China. J. Clean. Prod. 2013, 58, 130–137. [Google Scholar] [CrossRef]
  3. Fernando, Y.; Hor, W.L. Impacts of energy management practices on energy efficiency and carbon emissions reduction: A survey of Malaysian manufacturing firms. Resour. Conserv. Recycl. 2017, 126, 62–73. [Google Scholar] [CrossRef]
  4. Shan, P.; Zhang, L.; Jiang, S.; Hou, A.; Huang, Z. Which coal-fired power units in China should be prioritized for decommissioning? Energy 2024, 308, 133059. [Google Scholar] [CrossRef]
  5. Acemoglu, D.; Aghion, P.; Bursztyn, L.; Hemous, D. The environment and directed technical change. Am. Econ. Rev. 2012, 102, 131–166. [Google Scholar] [CrossRef]
  6. Yang, L.; Li, Z. Technology advance and the carbon dioxide emission in China—Empirical research based on the rebound effect. Energy Policy 2017, 101, 150–161. [Google Scholar] [CrossRef]
  7. Dong, F.; Long, R.; Yu, B.; Wang, Y.; Li, J.; Wang, Y.; Dai, Y.; Yang, Q.; Chen, H. How can China allocate CO2 reduction targets at the provincial level considering both equity and efficiency? Evidence from its Copenhagen Accord pledge. Resour. Conserv. Recycl. 2018, 130, 31–43. [Google Scholar] [CrossRef]
  8. Chen, X.; Chen, Y.E.; Chang, C.P. The effects of environmental regulation and industrial structure on carbon dioxide emission: A non-linear investigation. Environ. Sci. Pollut. Res. 2019, 26, 30252–30267. [Google Scholar] [CrossRef]
  9. Chen, S.; Shi, A.; Wang, X. Carbon emission curbing effects and influencing mechanisms of China’s emission trading scheme: The mediating roles of technique effect, composition effect and allocation effect. J. Clean. Prod. 2020, 264, 121700. [Google Scholar] [CrossRef]
  10. Sovacool, K.; Brown, M.A. Scaling the policy response to climate change. Policy Soc. 2009, 27, 317–328. [Google Scholar] [CrossRef]
  11. Han, Y. Impact of environmental regulation policy on environmental regulation level: A quasi-natural experiment based on carbon emission trading pilot. Environ. Sci. Pollut. Res. 2020, 27, 23602–23615. [Google Scholar] [CrossRef] [PubMed]
  12. Li, X. How digital finance affect rural household carbon emissions from energy expenditures: Evidence from rural China. Energy Sources 2025, 20, 2505179. [Google Scholar] [CrossRef]
  13. Yin, Z.; Chang, N. The carbon characteristics of digital economy: A case study in China. Appl. Econ. 2025, 1–16. [Google Scholar] [CrossRef]
  14. Hu, R.; Song, K. Carbon reduction effects of government digital attention. Front. Environ. 2025, 13, 1539223. [Google Scholar] [CrossRef]
  15. Yuan, X.; Dong, Y.; Liang, L.; Wei, Y. The impact of carbon emission trading scheme policy on information asymmetry in the stock market: Evidence from China. Energy Policy 2025, 198, 114502. [Google Scholar] [CrossRef]
  16. Tu, Z.; Cao, Y.; Kong, J. The Impacts of Low-Carbon City Pilot Projects on Carbon Emissions in China. Atmosphere 2022, 13, 1269. [Google Scholar] [CrossRef]
  17. Hansol, M.; Juchul, J. Impact of Compact City on Carbon Emission Reduction Based on Urban Size: A Spatial Analysis Using Satellite Imagery, Sustainable Cities and Society. Sustain. City Soc. 2025, 126, 106326. [Google Scholar]
  18. Zhou, D.; Chen, G.; Xie, D. Can green financial pilot policy reduce firms’ carbon emissions? Evidence from Chinese manufacturing firms. Econ. Change Restruct. 2025, 58, 16. [Google Scholar] [CrossRef]
  19. Huang, J.; Zheng, B.; Du, M. How digital economy mitigates urban carbon emissions: The green facilitative power of industrial coagglomeration. Appl. Econ. 2025, 1–19. [Google Scholar] [CrossRef]
  20. Liu, C. The impact of green technological innovation on carbon emissions—A perspective based on nonlinear effects, moderating effects and spatial spillover effects. Technol. Anal. Strateg. Manag. 2025, 1–18. [Google Scholar] [CrossRef]
  21. Zhang, X.; Qiu, F.; Liu, J. Digital Economy’s Impact on Carbon Emission Performance: Evidence from the Yangtze River Delta, China. Chin. Geogr. Sci. 2025, 35, 217–233. [Google Scholar] [CrossRef]
  22. Liu, Z.; Li, L.; Hou, J.; Li, B. Does digital innovation improve carbon productivity? A new perspective based on industrial upgrading. Appl. Econ. 2025, 1–19. [Google Scholar] [CrossRef]
  23. Yang, Z.; Huang, S.; Ma, J.; Song, C.; Xu, S. The impact of digital infrastructure on urban total factor carbon emission performance: Evidence from enterprise production and household consumption in China. Front. Environ. 2025, 13, 1506012. [Google Scholar]
  24. Wu, J.; Yu, Z.; Wang, B.; Ma, C. Environmental regulations and carbon intensity: Assessing the impact of command-and-control, market-incentive, and public-participation approaches. Carbon Manag. 2025, 16, 2499091. [Google Scholar] [CrossRef]
  25. Yu, B.; Shen, C. Environmental regulation and industrial capacity utilization: An empirical study of China. J. Clean. Prod. 2020, 246, 118986. [Google Scholar] [CrossRef]
  26. Zhu, B.; Su, B.; Li, Y.; Ng, Y.S. Embodied energy and intensity in China’s (normal and processing) exports and their driving forces, 2005-2015. Energy Econ. 2020, 91, 104911. [Google Scholar] [CrossRef]
  27. Li, M.; Du, W. Opening the black box of capacity governance: Environmental regulation and capacity utilization of microcosmic firms in China. Econ. Model. 2022, 108, 105766. [Google Scholar] [CrossRef]
  28. Xie, B.; Yang, C.; Song, W.; Song, L.; Wang, A. The impact of environmental regulation on capacity utilization of China’s manufacturing industry: An empirical research based on the sector level. Ecol. Indic. 2023, 148, 110085. [Google Scholar] [CrossRef]
  29. Xu, X.; Xu, X.; Chen, Q.; Che, Y. The impacts on CO2 emission reduction and haze by coal resource tax reform based on dynamic CGE model. Resour. Policy 2018, 58, 268–276. [Google Scholar] [CrossRef]
  30. Du, W.; Wang, F.; Li, M. Effects of environmental regulation on capacity utilization: Evidence from energy enterprises in China. Ecol. Indic. 2020, 113, 106217. [Google Scholar] [CrossRef]
  31. Liu, C.; Xin, L.; Li, J. Environmental regulation and manufacturing carbon emissions in China: A new perspective on local government competition. Environ. Sci. Pollut. Res. 2022, 29, 36351–36375. [Google Scholar] [CrossRef] [PubMed]
  32. Yang, X.; Yang, X.; Zhu, J.; Jiang, P.; Lin, H.; Cai, Z.; Huang, H.; Long, J. Synergic emissions reduction effect of China’s “Air Pollution Prevention and Control Action Plan”: Benefits and efficiency. Sci. Total Environ. 2022, 847, 157564. [Google Scholar] [CrossRef] [PubMed]
  33. Huang, X.; Tian, P. How does heterogeneous environmental regulation affect net carbon emissions: Spatial and threshold analysis for China. J. Environ. Manag. 2023, 330, 117161. [Google Scholar] [CrossRef]
  34. Ouyang, W.; Zhou, Y.; Wang, Y. Can command-and-control regulation reduce carbon emissions? Evidence from China. Environ. Impact Assess. Rev. 2025, 112, 107802. [Google Scholar] [CrossRef]
  35. Sinn, H.W. Public policies against global warming: A supply side approach. Int. Tax Public Financ. 2008, 15, 360–394. [Google Scholar] [CrossRef]
  36. Albulescu, C.T.; Artene, A.E.; Luminosu, C.T.; Tămășilă, M. CO2 emissions, renewable energy, and environmental regulations in the EU countries. Environ. Sci. Pollut. Res. 2020, 27, 33615–33635. [Google Scholar] [CrossRef]
  37. Chen, J.; Huang, S.; Shen, Z.; Song, M.; Zhu, Z. Impact of sulfur dioxide emissions trading pilot scheme on pollution emissions intensity: A study based on the synthetic control method. Energy Policy 2022, 161, 112730. [Google Scholar] [CrossRef]
  38. Wang, K.; Wei, Y.M.; Huang, Z. Potential gains from carbon emissions trading in China: A DEA based estimation on abatement cost savings. Omega 2016, 63, 48–59. [Google Scholar] [CrossRef]
  39. Zhou, D.; Liang, X.; Zhou, Y.; Tang, K. Does emission trading boost carbon productivity? Evidence from China’s Pilot Emission Trading Scheme. Int. J. Environ. Res. Public Health 2020, 17, 5522. [Google Scholar] [CrossRef]
  40. Yang, X.; Zhang, J.; Bi, L.; Jiang, Y. Does China’s carbon trading pilot policy reduce carbon emissions? Empirical analysis from 285 cities. Int. J. Environ. Res. Public Health 2023, 20, 4421. [Google Scholar] [CrossRef]
  41. Zhang, K.; Xu, D.; Li, S.; Zhou, N.; Xiong, J. Has China’s pilot emissions trading scheme influenced the carbon intensity of output? Int. J. Environ. Res. Public Health 2019, 16, 1854. [Google Scholar] [CrossRef] [PubMed]
  42. Ren, F.; Liu, X. Evaluation of carbon emission reduction effect and porter effect of China’s carbon trading policy. Environ. Sci. Pollut. Res. 2023, 30, 46527–46546. [Google Scholar] [CrossRef] [PubMed]
  43. Lv, M.; Bai, M. Evaluation of China’s carbon emission trading policy from corporate innovation. Financ. Res. Lett. 2021, 39, 1544–6123. [Google Scholar] [CrossRef]
  44. Zhang, W.; Li, G.; Guo, F. Does carbon emissions trading promote green technology innovation in China? Appl. Energy 2022, 315, 119012. [Google Scholar] [CrossRef]
  45. Porter, M.E.; van der Linde, C. Toward a new conception of the environment-competitiveness relationship. J. Econ. Perspect. 1995, 9, 97–118. [Google Scholar] [CrossRef]
  46. Jorgenson, D.W.; Wilcoxen, P.J. Environmental regulation and U.S. economic growth. RAND J. Econ. 1990, 21, 314–340. [Google Scholar] [CrossRef]
  47. Barney, J. Firm resources and sustained competitive advantage. J. Manag. 1991, 17, 99–120. [Google Scholar] [CrossRef]
  48. Wu, Y.; Qi, J.; Xian, Q.; Chen, J. The carbon emission reduction effect of China’s carbon market: From the perspective of the coordination between market mechanism and administrative intervention. China Ind. Econ. 2021, 114–132. (In Chinese) [Google Scholar]
  49. Feng, X.; Zhao, Y.; Yan, R. Does carbon emission trading policy has emission reduction effect?—An empirical study based on quasi-natural experiment method. J. Environ. Manag. 2024, 351, 119791. [Google Scholar] [CrossRef]
  50. Xu, W.; Sun, L. Market-Incentive Environmental Regulation and Energy Consumption Structure Transformation. J. Quant. Technol. Econ. 2023, 40, 133–155. (In Chinese) [Google Scholar]
  51. Chung, Y.H.; Färe, R.; Grosskopf, S. Productivity and Undesirable Outputs: A Directional Distance Function Approach. J. Environ. Manag. 1997, 51, 229–240. [Google Scholar] [CrossRef]
  52. Morrison, C.J. Primal and dual capacity utilization: An application to productivity measurement in the U.S. automobile industry. J. Bus. Econ. Stat. 1985, 3, 312–324. [Google Scholar] [CrossRef]
  53. Olley, G.S.; Pakes, A. The Dynamics of Productivity in the Telecommunications Equipment Industry. Econometrica 1996, 64, 1263–1297. [Google Scholar] [CrossRef]
  54. Han, Z.; Wang, L.; Zhao, F. Can emission trading system improve capacity utilization? A quasi-natural experiment in Chinese listed firms. J. Clean. Prod. 2023, 385, 135719. [Google Scholar] [CrossRef]
  55. Svensson, L.; Fare, R. Congestion of Production Factors. Econometrica 1980, 48, 1745–1753. [Google Scholar]
  56. Wang, Z.; Yu, X.; Zhang, W. Chinese-style carbon emission reduction: Micro mechanisms of state-owned enterprises. Int. Rev. Econ. Financ. 2024, 96, 103527. [Google Scholar] [CrossRef]
  57. Zhao, L.; Li, Z.; Cheng, L. The impact of China’s carbon emissions trading policy on corporate investment expenditures: Evidence from carbon-intensive industries. J. Environ. Manag. 2024, 366, 121743. [Google Scholar] [CrossRef]
  58. Ji, H.; Yu, Z.; Tian, G.; Wang, D.; Wen, Y. Market competition, environmental, social and corporate governance investment, and enterprise green innovation performance. Financ. Res. Lett. 2025, 77, 107057. [Google Scholar] [CrossRef]
  59. Li, Q.; Tian, S. Can Environmental Regulation Promote Corporate Environmental Investment—Considering the Influence of Market Competition. J. Beijing Inst. Technol. 2016, 18, 1–8. (In Chinese) [Google Scholar]
Figure 1. Mechanism roadmap.
Sustainability 17 05076 g001
Figure 2. The density and kernel density of the total CU. Authors’ analysis using Stata 18.0.
Sustainability 17 05076 g002
Figure 3. The density and kernel density of CU of different types of enterprises: (a) the density and kernel density of CU of state-owned enterprises; (b) the density and kernel density of CU of non-state-owned enterprises. Authors’ analysis using Stata 18.0.
Sustainability 17 05076 g003
Figure 4. Parallel trends test. Authors’ analysis using Stata 18.0.
Sustainability 17 05076 g004
Figure 5. Placebo test. Authors’ analysis using Stata 18.0.
Sustainability 17 05076 g005
Table 1. Descriptive statistics.
VariablesNMeanSDMinMax
CRE12,672−4.4931.959−9.6280.303
CE12,67245.380147.1140.0931023.210
CU12,6720.7930.6770.0432.997
did12,6720.0210.14301
Cap12,6721.9121.1430.4538.243
ROA12,6720.0450.059−0.2190.208
Emp12,6727.8631.0815.28810.81
Tax12,67217.071.47613.26021.020
Size12,67222.111.15419.92025.510
TFP12,6723.0440.7810.1696.799
HHI12,6720.0680.0570.0130.278
Mshare12,67213.4320.02069.83
City12,6720.7040.45601
Regular12,6720.2560.43601
Gov12,6720.1440.0530.0441.699
Price12,6720.6931.886018.23
Source: Authors’ analysis using Stata 18.0. All subsequent tables follow the same notation.
Table 2. The estimated elasticities for different industries with varying levels of pollution.
Typeαβγδ
low-pollution0.0535610.046760.7179750.212395
medium-pollution0.0218860.0494160.7926140.15082
high-pollution0.0631670.0354070.8396820.060593
Table 3. Baseline regression.
(1)(2)(3)(4)
VARIABLESCRECRECECU
did0.158 ***0.113 **
(0.024)(0.046)
did_short −0.042 *0.011
(0.022)(0.035)
did_long −0.088 ***0.190 ***
(0.023)(0.070)
L.CRE0.933 ***0.664 ***
(0.005)(0.015)
L.CE 0.625 ***
(0.018)
L.CU 0.650 ***
(0.013)
Cap−0.024 ***−0.010−0.129 ***−0.191 ***
(0.005)(0.009)(0.008)(0.011)
ROA−0.282 ***−0.0100.109 *0.235 ***
(0.067)(0.091)(0.056)(0.086)
Emp−0.016 **−0.053 ***0.006−0.048 ***
(0.008)(0.018)(0.009)(0.017)
Scale−0.085 ***−0.412 ***0.350 ***0.015
(0.008)(0.027)(0.019)(0.020)
TFP−0.019 **0.319 ***−0.055 ***0.209 ***
(0.007)(0.038)(0.015)(0.035)
HHI0.139 ***−0.062−0.029−0.140 **
(0.033)(0.067)(0.035)(0.059)
Mshare−0.003 ***−0.002 ***0.000−0.002 ***
(0.000)(0.001)(0.000)(0.001)
City0.0160.212 **−0.0240.118 *
(0.010)(0.083)(0.054)(0.065)
Regular−0.158 ***−0.113 *0.146 ***−0.003
(0.014)(0.059)(0.041)(0.045)
Gov−0.099−0.1740.039−0.187
(0.077)(0.194)(0.117)(0.194)
Price−0.005 **−0.0030.004 ***0.001
(0.002)(0.003)(0.001)(0.003)
Tax0.016 ***0.013 **0.005 *0.021 ***
(0.005)(0.006)(0.003)(0.005)
Constant1.518 ***6.722 ***−6.658 ***−1.564 ***
(0.125)(0.471)(0.339)(0.353)
N12,67212,67212,67212,672
R20.9590.9740.9930.939
YearNOYESYESYES
IndNOYESYESYES
Notes: *, **, and *** denote statistical significance at the 10%, 5%, and 1% levels, respectively. Clustered standard errors are reported in parentheses. All subsequent tables follow the same notation.
Table 4. Alternative CE measurement.
(1)(2)
VariablesCUCE
did0.063 **0.125 **
(0.031)(0.057)
ControlsYESYES
Constants8.634 ***2.868 ***
(0.359)(0.414)
N12,67212,672
R20.9910.947
YearYESYES
IndYESYES
Notes: **, and *** denote statistical significance at the 10%, 5%, and 1% levels, respectively. Clustered standard errors are reported in parentheses.
Table 5. Propensity score matching difference-in-differences.
(1)(2)(3)
VariablesNearest Neighbor MatchingRadius MatchingKernel Matching
did0.127 **0.112 **0.105 **
(0.052)(0.046)(0.046)
ControlsYESYESYES
Constants5.632 ***6.690 ***6.448 ***
(1.287)(0.472)(0.480)
N95212,61911,030
R20.9830.9740.975
YearYESYESYES
IndYESYESYES
Notes: **, and *** denote statistical significance at the 10%, 5%, and 1% levels, respectively. Clustered standard errors are reported in parentheses.
Table 6. Incorporating additional policy variables.
(1)(2)(3)(4)
did0.1538 **0.1259 **0.1639 *0.1116 *
(0.069)(0.061)(0.099)(0.065)
Smart City−0.0164
(0.025)
Low Carbon −0.0080
(0.018)
Provincially Designated 0.0307 **
(0.013)
Nationally Designated −0.0056
(0.013)
did × Smart City−0.0891
(0.086)
did × Low Carbon −0.0088
(0.079)
did × Provincially −0.0674
(0.112)
did × Nationally 0.0427
(0.081)
ControlsYESYESYESYES
Constant6.7459 ***6.7509 ***6.7033 ***6.7185 ***
(0.473)(0.475)(0.470)(0.471)
N12,65412,60212,65412,644
R20.9740.9740.9740.974
YearYESYESYESYES
IndYESYESYESYES
Notes: *, **, and *** denote statistical significance at the 10%, 5%, and 1% levels, respectively. Clustered standard errors are reported in parentheses.
Table 7. Mechanism test.
(1)(2)(3)(4)(5)(6)
VariablesInnovationCREInvestmentCREManagementCRE
did0.2929 **0.0789 **0.0940 **0.0866 *0.0064 **0.0765 **
(0.140)(0.037)(0.039)(0.052)(0.003)(0.034)
Innovation 0.0112 ***
(0.003)
Investment 0.0365 **
(0.019)
Management 0.3798 *
(0.211)
Constant−12.2124 ***6.9157 ***5.9498 ***6.3281 ***0.5224 ***6.4171 ***
(2.128)(0.465)(0.353)(0.514)(0.026)(0.484)
ControlsYESYESYESYESYESYES
N14,47412,67213,37412,67214,47412,672
R20.9790.9740.9560.9770.8340.975
YearYESYESYESYESYESYES
IndYESYESYESYESYESYES
Notes: *, **, and *** denote statistical significance at the 10%, 5%, and 1% levels, respectively. Clustered standard errors are reported in parentheses.
Table 8. Heterogeneity analysis.
(1)(2)(3)(4)(5)(6)(7)(8)
VariablesSOEsCIEsEEsHHI
YNYNYNLowHigh
did0.104 *0.1180.144 **0.0260.118 **0.0530.203 ***0.000
(0.057)(0.083)(0.057)(0.074)(0.055)(0.066)(0.073)(0.050)
ControlsYESYESYESYESYESYESYESYES
Constants6.463 ***7.213 ***6.805 ***6.378 ***6.501 ***6.401 ***5.879 ***7.408 ***
(0.751)(0.613)(0.527)(0.951)(0.530)(0.813)(0.586)(0.718)
N4244835210,04426108909372058586796
R20.9770.9690.9700.9810.9720.9750.9670.979
YearYESYESYESYESYESYESYESYES
IndYESYESYESYESYESYESYESYES
Notes: *, **, and *** denote statistical significance at the 10%, 5%, and 1% levels, respectively. Clustered standard errors are reported in parentheses.
Disclaimer/Publisher’s Note: The statements, opinions and data contained in all publications are solely those of the individual author(s) and contributor(s) and not of MDPI and/or the editor(s). MDPI and/or the editor(s) disclaim responsibility for any injury to people or property resulting from any ideas, methods, instructions or products referred to in the content.

