Article

Self-Sufficient Carbon Emission Reduction in Resource-Based Cities: Evidence of Green Technology Innovation

College of Geography and Environment, Shandong Normal University, Jinan 250358, China
*
Author to whom correspondence should be addressed.
Sustainability 2025, 17(11), 5075; https://doi.org/10.3390/su17115075
Submission received: 20 February 2025 / Revised: 24 May 2025 / Accepted: 27 May 2025 / Published: 1 June 2025

Abstract

Green technology innovation (GTI) is crucial for achieving synergistic development in reducing pollution and carbon emissions (CEs). The spatio-temporal evolutionary aspects of carbon emission intensity (CEI) in resource-based cities (RBCs) and the heterogeneity of the carbon emission reduction effects of GTI from zoning, grading, and classification perspectives are investigated using kernel density estimation, Markov chains, and panel regression models. Our results are as follows: the CEI of RBCs displays a fluctuating downwards trend from 2006 to 2022. Spatially, the main feature is that the north is higher than the south. Second, GTI has significantly reduced the CEI of RBCs through structural optimization, energy savings, and efficiency improvement, as verified in different development stages and dominant resource types. In addition, national high-tech zones (NHTZs) have significantly contributed to reducing CEI in RBCs. The proposed countermeasures include increasing investment in GTI, establishing an exchange platform for GTI, and implementing differentiated policies according to local conditions, which are important for constructing an ecological civilization in RBCs.

1. Introduction

China has been a major global CO2 emitter since the 21st century [1,2]. According to relevant data, resource-based cities (RBCs) account for one-third of the national carbon emissions and are the crucial source of carbon emissions in China. RBCs, as important bases for ensuring energy and resources, play a significant role in safeguarding the security of national energy and industrial and supply chains. Carbon dioxide emissions from these cities have a profound impact on the country’s ecological civilization construction and the realization of the dual carbon goals [3,4,5]. Resource- and energy-intensive industries, which make up a large percentage of RBCs, are major producers of CO2 and a constitute significant component of polluting industries. Owing to its long-term path dependence, path locking and resource crowding-out effect [6], the industry has a single structure, excessive energy reliance and insufficient development of successive alternative industries, resulting in rising regional CEs [7]. Green technology innovation (GTI) is an important way to reduce CEs. Unlike traditional technological innovation, it emphasizes economic benefits in the production process while paying attention to ecological and environmental protection [8] committed to achieving sustainable development, emphasizing the reduction in undesirable outputs in economic development, which has crucial practical significance for addressing the problem of green transformation in RBCs. Therefore, to further achieve the double carbon target, national strategic plans such as the 2030 Carbon Peaking Programme have continued to clarify the leading role of science and technology innovation in supporting carbon reduction. The government has also actively stimulated the environmental spillover effects of GTI by making National high-tech zones (NHTZs) available, advancing green inclusive finance, and strengthening the carbon trading market [9,10]. A green low-carbon technological revolution has the potential to drive industrial structure upgrading and boost economic growth. GTI has emerged as a critical avenue for low-carbon growth and environmental change in RBCs.
Research has identified three relationships between GTI and carbon emissions (Figure 1). First, GTI can effectively reduce the carbon emission intensity (CEI). Gao et al. found that GTI significantly reduced CEs in 30 provincial-level administrative regions of China through industrial structure upgrading [11]. Shan et al. discovered the same effect in the Turkish region [12], and the emission reduction effect of GTI has been proven in multiple regions [13,14]. Furthermore, the carbon reduction effects of GTI can be achieved through three pathways: the market and government, enterprise, and the public. Green finance and tax relief are conducive to expanding corporate financing channels, reducing the expenses of corporate environmental management, and boosting corporate GTI vitality [15,16]. Meanwhile, as an important means of environmental governance, the carbon market can activate the rational allocation of carbon rights quotas through carbon rights trading, to stimulate enterprises to reduce CEs through GTI. Moreover, the scale and speed of development further raise the threshold of market access for polluting industries, thereby eliminating low-end duplicate construction and backwards production capacity and forcing industrial transformation and upgrading. Second, GTI can also reduce CEI on the production side through structural optimization and energy efficiency [17]. On the one hand, GTI strengthens the links between the industrial chain’s upstream and downstream segments, giving rise to new industries, production models, and fields. Labor, capital, technology, and information have been rationally allocated in the direction of high value-added, unlocking the low-end locking of factors. Enterprises have shifted to professional, intensive, and intelligent production, improving energy utilization efficiency, realizing pollution control and end-of-pipe treatment in the manufacturing process. Additionally, new energies to make use of, including wind, solar, nuclear, and tidal have been expedited by GTI [18], promoted large-scale and intensive resource development, reduced CO2 emissions and other pollutants, and achieved ecological protection and environmental management [19]. Finally, GTI can increase public awareness of sustainable lifestyles, the pursuit of green consumption patterns, the practice of low-carbon travel concepts, and the realization of ecological environmental preservation and lowering CEI from the consumption side.
GTI may increase CEI. High risk, lengthy lead times, and uncertainty are the characteristics of GTI, as enterprises are increasingly moving toward scaling up and boosting production as a means to boost profitability. The economic effects of GTI at this time are distinct to the environmental effects, which are mainly manifested in increased pollution. Khattak et al. argue that negative shocks to green and sustainable technology innovation increase CO2 during economic downturns and are countercyclical [20,21]. Second, the absorptive capacity of GTI is an essential component in carbon reduction; when the absorptive capacity is not sufficient, CEI is increased. In the long run, the low conversion rate of technological achievements and low industrialization have also impeded the impact of GTI on carbon reduction [22].
Finally, the rebound effect makes the link uncertain. As rational economic agents, companies tend to expand production when production costs decrease, and in the process, energy consumption increases and the rebound effect becomes apparent, with the relationship moving towards uncertainty. Du et al. analyzed data from 71 economies worldwide and discovered that GTI had heterogeneous CEI reduction effects at diverse economic levels [23]. Additionally, using a nonlinear spatial Durbin model, Chen et al. discovered that across China’s provinces and bordering regions, GTI and CEI had an inverted U-shaped association [24].
The success of RBCs, as a major actor in implementing the national climate change strategy, in achieving carbon reduction is the key to the successful promotion of the dual carbon goals. In terms of the study area, the existing research covers various scales, relevant studies contain regions [25], provinces [26], and typical areas [27,28], but the attention of RBCs needs to be further strengthened. The research content mainly emphasizes the optimization of industrial structure [29,30], green and low-carbon transitions [31,32], the resource curse [33,34], and planning policy [35,36,37]. In short, this study mainly explores the regional variability of influencing factors from the development stage and regional distribution [38,39], and further refinement of the heterogeneity of the impact of control variables from an urban resource type perspective needs to be further strengthened.
Overall, the study of RBCs as typical regions must be strengthened. Second, cities’ resource endowments have, to a certain extent, solidified the path of industrial development; however, existing research perspectives mainly focus on the development stages of RBCs, with less heterogeneity analysis of the dominant resource types of cities. This study further explores the regional variability of CEI and the driving effect of GTI on RBCs from the perspective of the urban resource types, thereby enriching the research perspective of RBCs, and the understanding of the importance of RBCs in the overall green development of the country. Based on these elements, the following issues are the main emphasis of this study: What effect does GTI have on RBCs’ CEs? Is the GTI’s impact on reducing CEI still appreciable in light of various phases of development and resource types? Can the implementation of the NHTZs policy actually lower the CEI?
The rest of the paper is organized as follows. Section 2 contains the research area, methods and data. Spatiotemporal evolutionary analysis is covered in Section 3. The examination in Section 4 examines the impact and results of GTI on the carbon emission reduction effect. A conclusion and policy recommendations are included in Section 5.

2. Research Area, Methods, and Data

2.1. Research Area

As defined in the National Sustainable Development Plan for Resource-based Cities (NSDP), 2013–2020, there are 262 RBCs in all (Figure 2). Referring to the NSDP and Chen et al. study [40], RBCs can be further subdivided from the perspectives of the urban development stage and urban resource type.

2.2. Methods

2.2.1. Markov Chain

Unlike analysis methods such as the Gini coefficient and the Thiel index, which focus on the static changes in regional geographical phenomena, Markov chains further deepen the dynamic evolution laws of geographical phenomena. This study further explores the CEI of RBCs based on Markov transfer probability matrices spatial and temporal evolutionary characteristics [41].
P i j = n i j n i
nij denotes the total number of cities transferred from kind i at time t to kind j at time t + 1 during the study phase. ni is the total number of cities belonging to kind i for all years in which transfers were achieved during the study period.

2.2.2. Panel Data Regression Model

For regression analysis of the effects of GTI on the CEI and the factors influencing the CEI, the following model was established:
ln C E I i , t = μ 0 + μ 1 ln G T I i , t + μ 2 ln I S i , t + μ 3 ln P D i , t + μ 4 ln T R A N i , t + μ 5 ln R E i , t + μ 6 ln E R i , t + μ i + ν t + ε i , t
IS denotes the industrial structure. PD denotes the population density. TRAN denotes the road density. RE denotes the resource endowment. ER denotes the environmental regulation.

2.2.3. Multiperiod Double Difference Model

The Torch High Technology Industry Development Center of the Ministry of Science and Technology has declared a total of 46 RBCs on the list of 173 NHTZs. RBCs that have established NHTZs are treated as a group and assigned a value of 1 for the year of establishment and beyond and a value of 0 for the year before or before the establishment. RBCs that have not established NHTZs are the control group. To reduce the problem of data endogeneity, a two-way fixed-effects model was used for validation. Because NHTZs are not established at the same time in a given year, the following multiperiod double difference model is constructed [42]:
C E I i , t = α 0 + α 1 N H T Z s i , t + γ X i , t + θ t + μ i + ε i , t
CEIi,t is the explanatory variable, indicating the CEI of RBCs. NHTZsi,t is a dummy policy variable for whether or not to establish NHTZs. If NHTZs = 1, it means that resource-based city i has established an NHTZs in year t. Otherwise, no NHTZs has been established. Xi,t denotes the other control variables. To reduce the impact of extreme anomalous data, all data are trailed.

2.3. Data

Variable Selection

CEI is defined as CEs per unit of GDP [43]. Calculations of CEs are accomplished using the Cheng et al. procedure [44]. GTI, subject to time, government, and other factors, is calculated by the sum of the more representative green invention patent applications and green utility model patent applications [45]. IS, the secondary sector, is the dominating source of CEs, as measured by the value added of the secondary sector as a share of GDP. TRAN, CEs from the transport of raw materials, products, etc., are measured in terms of road area per capita in each region. PD is measured by population density. RE is measured as a ratio of the quantity of people employed in the mining industry to total employment. The measurement of ER refers to relevant research, which is measured by the frequency of words related to environmental protection in the government work reports of various provinces, including environmental protection, green, and so on [46,47].
In RBCs, 112 cities were chosen depending on the data’s availability. The green patent data are obtained by searching the National Intellectual Property Administration based on the green patent list published by the World Intellectual Property Organization (WIPO), covering green patent achievements in seven major fields including energy, water resources, and transportation. The socioeconomic data, such as IS, PD, ER, RE, used in this study were obtained from the China Urban Statistical Yearbook and the statistical yearbooks of various provinces. The interpolation fills in the gaps in the data.

3. Temporal and Spatial Evolution of CEI in RBCs in China

3.1. Characteristics of the Temporal Evolution of the CEI

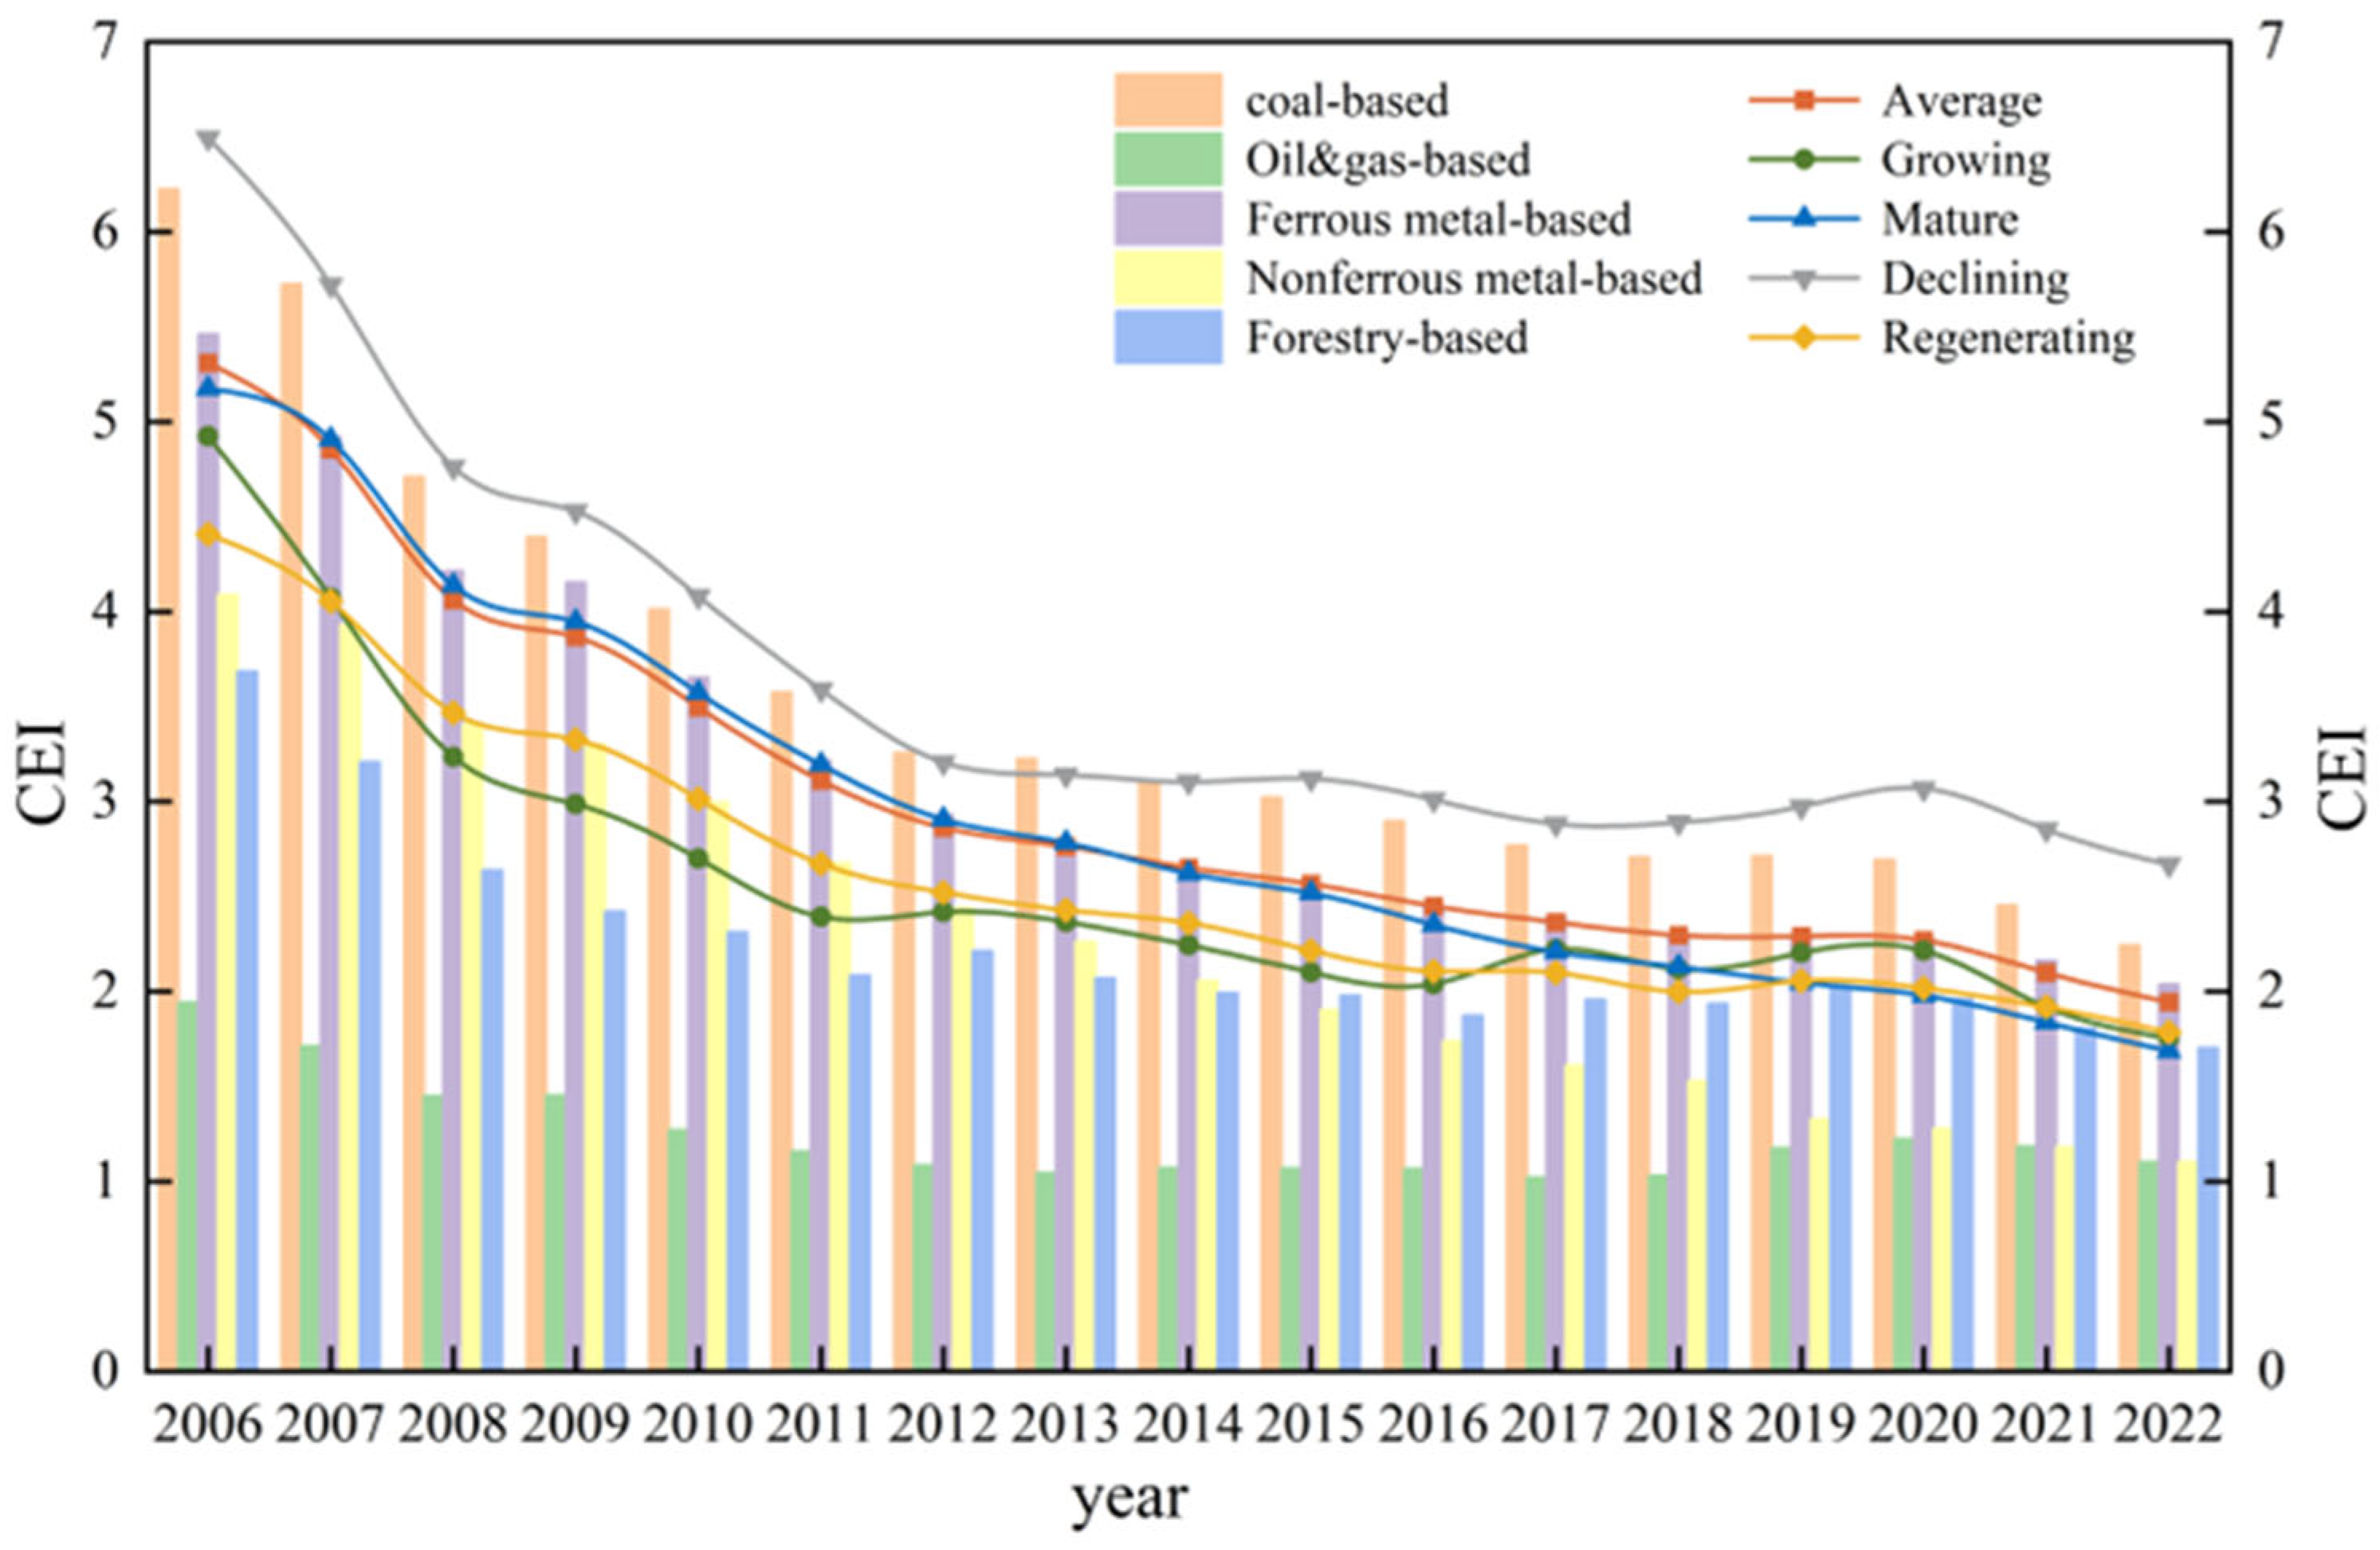
The average CEI of RBCs declined annually on average by 6.084% from 5.309 in 2006 to 1.945 in 2022 (Figure 3). From the stage of urban development, the CEI is characterized by Declining > Mature > Regenerating > Growing. Cities that are Declining exhibit a fluctuating drop followed by steady development, with CEI consistently higher than the average CEI of RBCs. From 2006 to 2012, the CEI of Declining and Mature cities fluctuated from 6.494 and 5.175 in 2006 to 3.206 and 2.905 in 2012, with average annual rates of decline of 11.096%, and 9.175% respectively. Influenced by resource endowments, RBCs have formed a single industrial structure with local comparative advantages, which has a crowding-out effect, inhibiting the diversification and advanced development of industries and making economic development less resilient and vulnerable to external environmental factors such as economic crises. The CEI of Declining cities slightly declined annually on average by 1.785% from 3.140 in 2013 to 2.670 in 2022, which may be related to the Action Plan for the Prevention and Control of Air Pollution and the NSDP, which further clarify the requirements for green development and encourage the establishment of an ecological civilization. The CEI of both Regenerating and Growing cities is lower than the average CEI, with a fluctuating downwards trend. The CEI of Regenerating cities declined from 2.784 in 2013 to 1.686 in 2022, an average annual growth rate of 5.420%. Although the economic development of Regenerating cities is on a sound development track, the production and lifestyle of these cities are relatively undeveloped, the environmental transformation is relatively delayed, the struggle between ecological preservation and sustainable economic growth is more explicit, and the overall CEI is higher. Technology innovation has significantly contributed to the intensive and massive development of resources, promoting green development and reducing CEs.
In terms of the urban resource types, the CEI is characterized by coal-based > ferrous metal-based > nonferrous metal-based > forestry-based > oil- and gas-based. The average annual decline rates for coal-based, oil- and gas-based, ferrous metal-based, nonferrous metal-based, and forestry-based cities were 6.178%, 3.477%, 5.976%, 7.864%, and 4.708%, respectively. As the modern coal chemical industry develops, such as the integration of coal and electricity, energy use effectiveness is improving, and the CEI of coal-based cities is gradually decreasing. Due to its energy resource endowment, coal still dominates China’s energy consumption and use, which is the dominant source of CEs, with a higher CEI than other RBCs. To enhance the energy consumption structure and reduce environmental pressure, clean energy, the energy exploitation intensity and the proportion of consumption and utilization, has been further developed. Oil- and gas-based cities gradually improve the industrial chain, upstream and downstream industries for in the process of agglomeration, from agglomeration of uneconomical to agglomeration of economic.
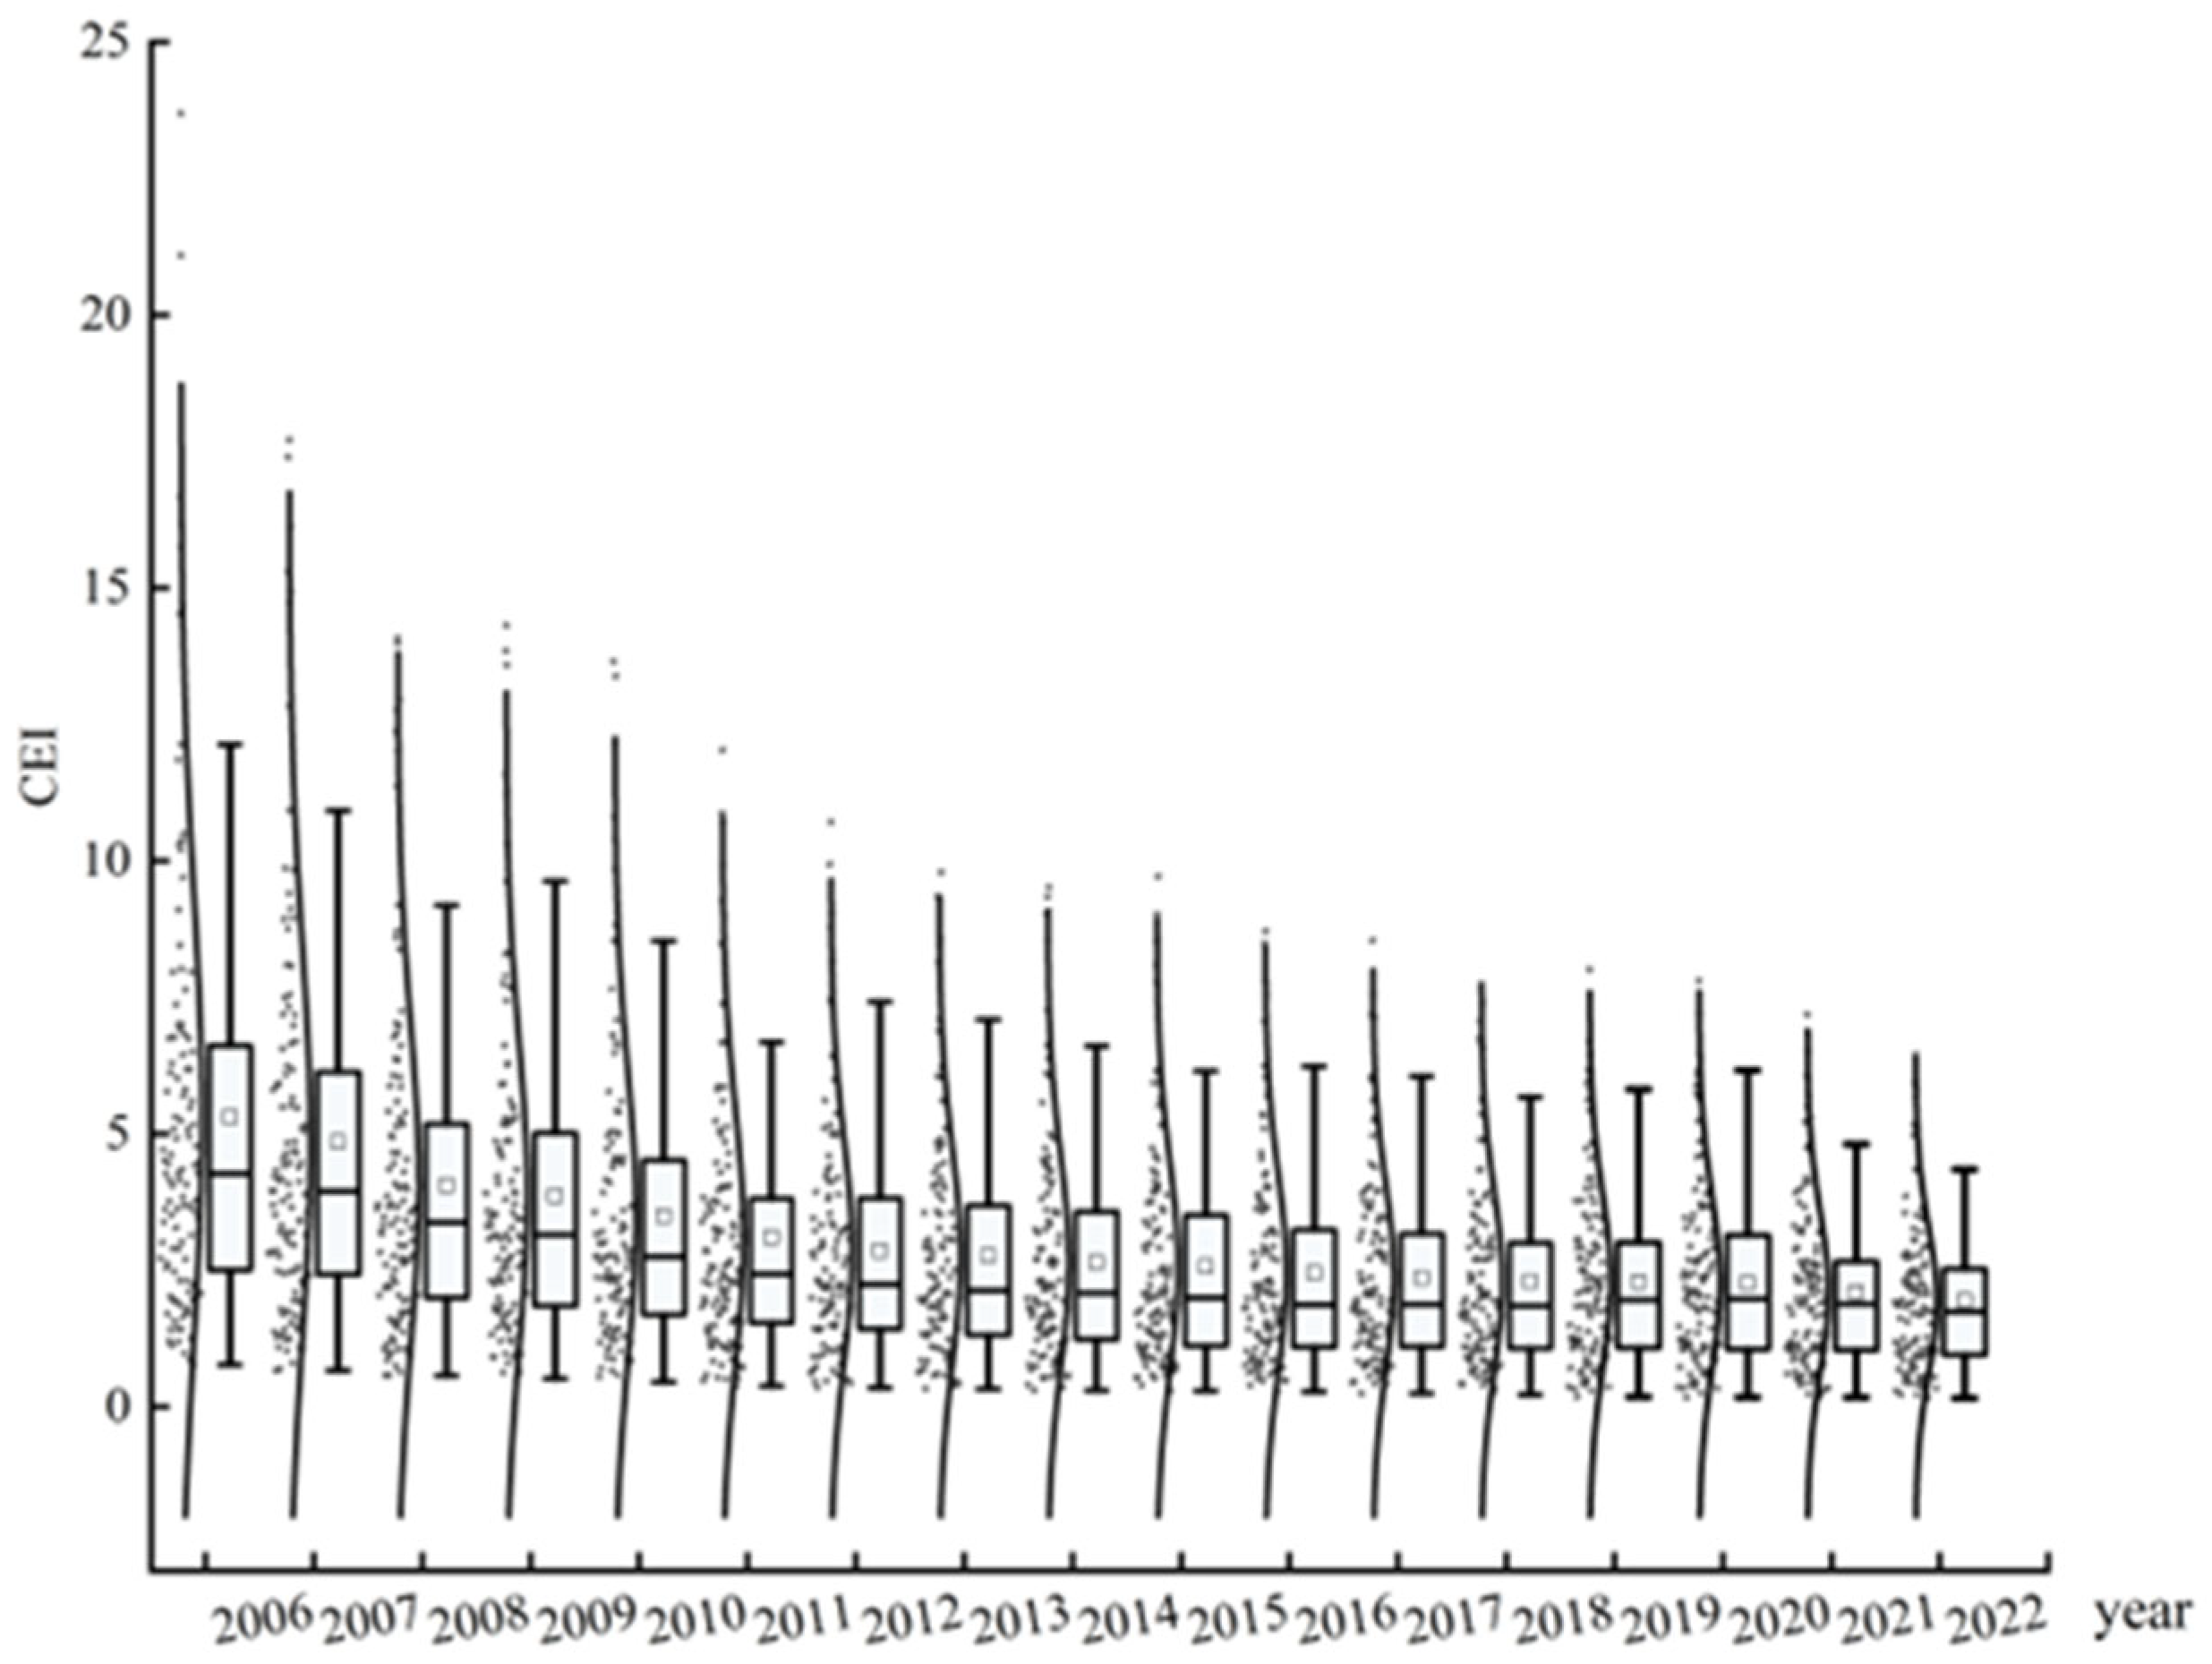
From 2006 to 2022, the CEI changed from a scattered development at both ends to a concentrated distribution pattern of low values, with a significant decrease in CEI, however, the median CEI of RBCs was above 1.744, and the overall CEI was still high, making the task of carbon emission reduction arduous (Figure 4).
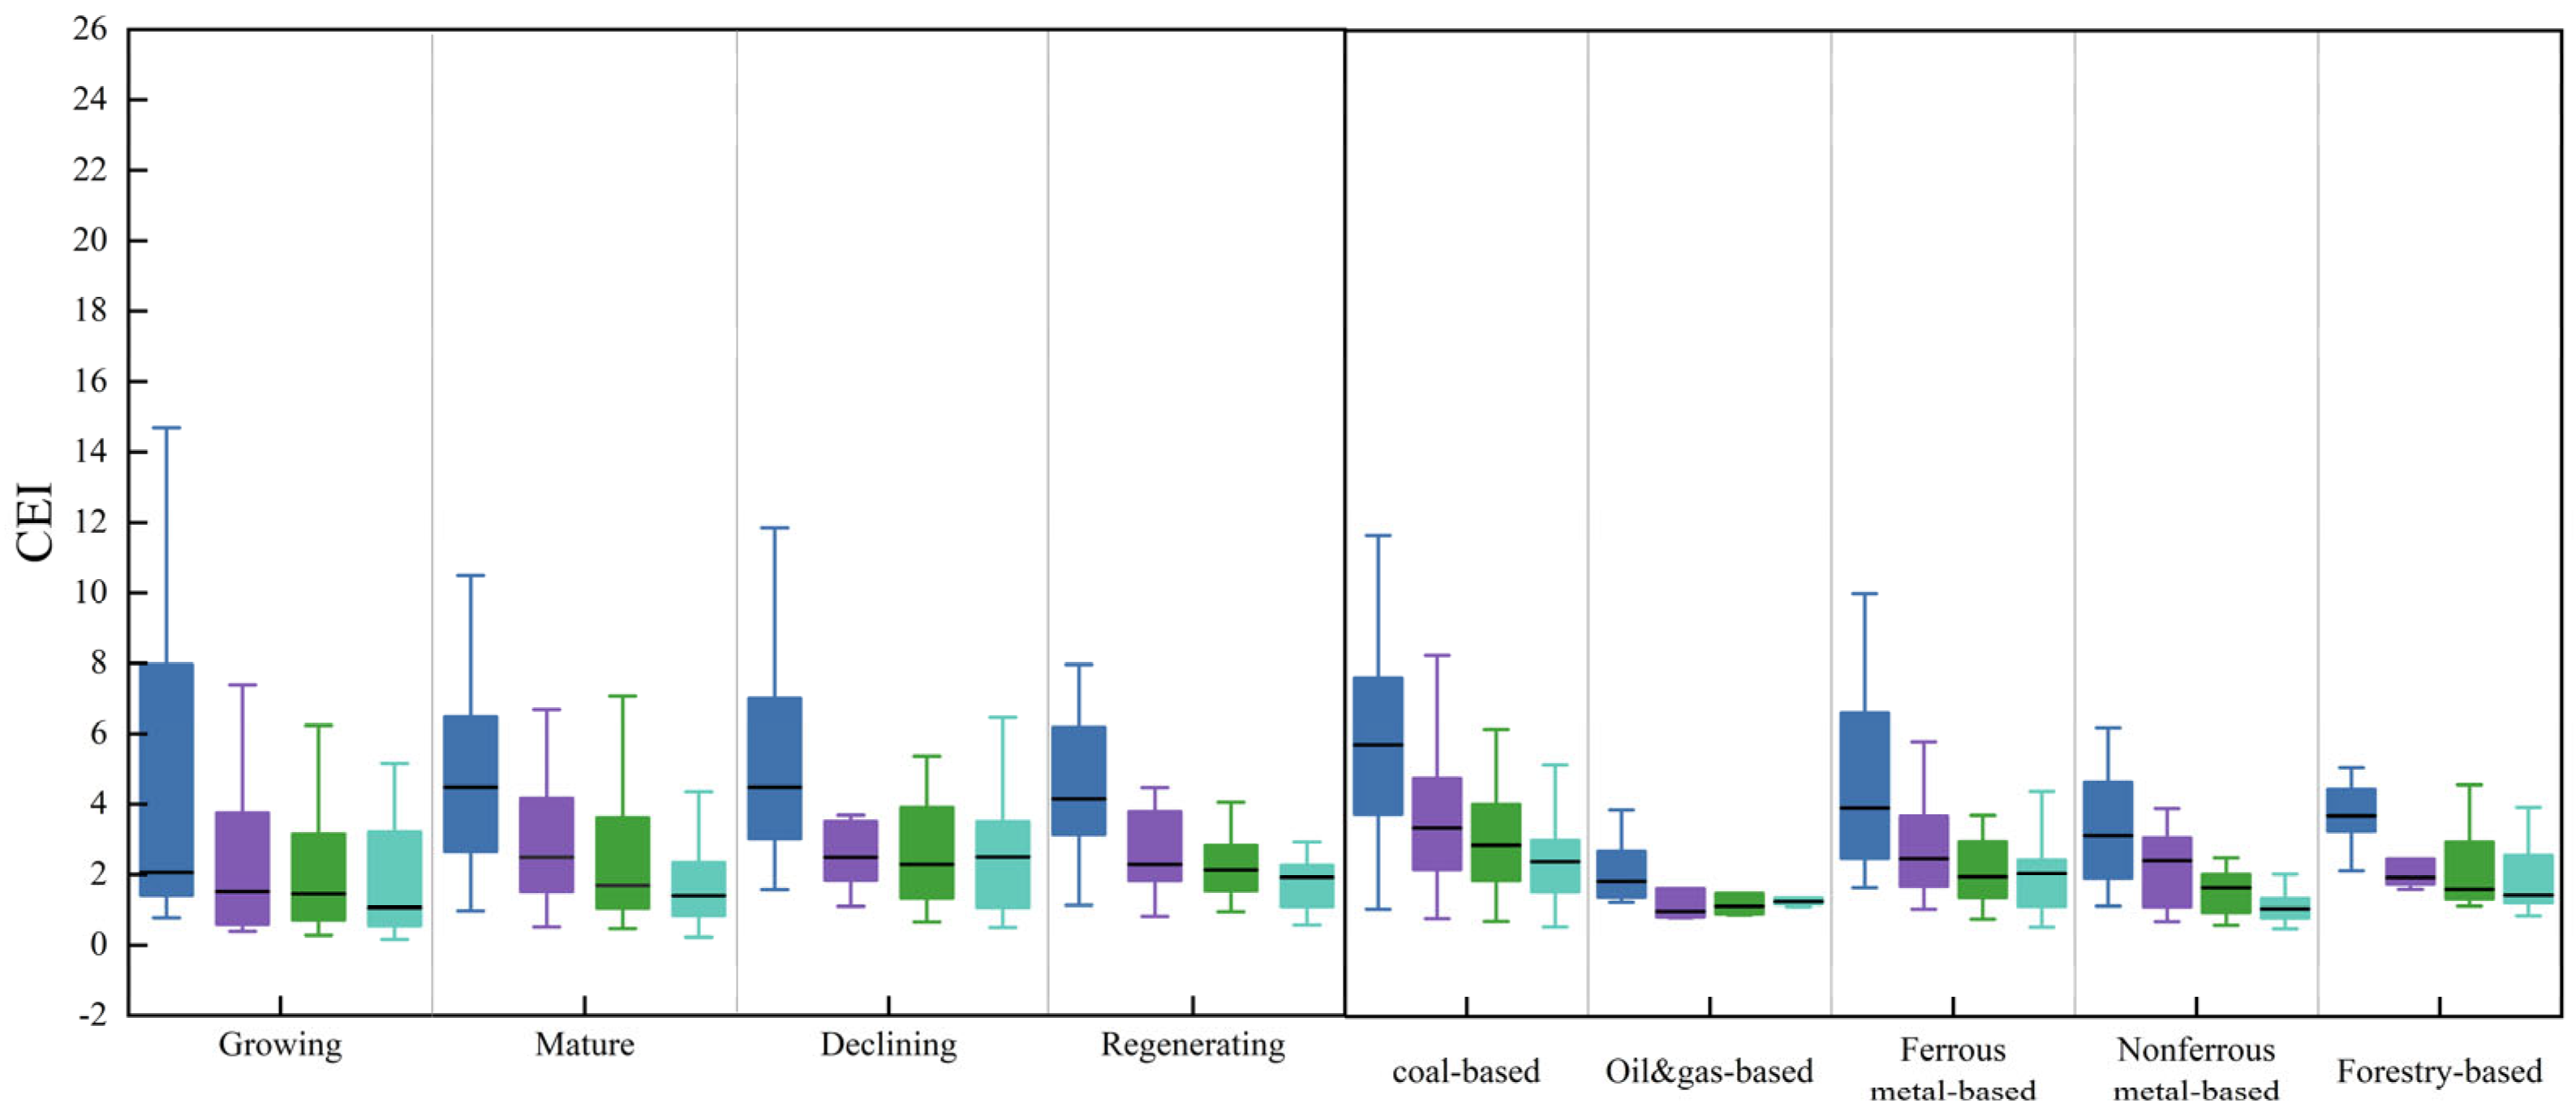
From a horizontal perspective, the CEI shows a fluctuating downwards trend. The overall decreasing trend of CEI is obvious as regional differences are narrowing, development coordination is increasing, and RBCs are reducing pollution and CEs. The effect of collaborative development is clear. Longitudinally, declining and mature cities had significantly higher, and coal-based cities have gradually higher CEI than other cities, making them key areas for reducing pollution and CEs (Figure 5).
In terms of peaks, the peak of CEI demonstrates a rise, a fall, and a shift to the left, indicating that the CEI of RBCs is decreasing in Figure 6. From the distribution pattern and trailing, the kernel density curve gradually changes from short and thick to tall and slim, and the width of the wave decreases. After 2016, there is a tendency to evolve from a single peak to a double peak. The right trailing tail is distinctly longer than the left trailing tail and gradually becomes shorter, indicating that the number of areas with high CEI gradually decreases, the overall gap in CEI narrows, and the regional carbon emission reduction effect is remarkable. However, it should be noted that some cities with high CEI still exist; the CEI is polarized, and the spatial imbalance has increased.

3.2. Characteristics of the Spatial Evolution of the CEI

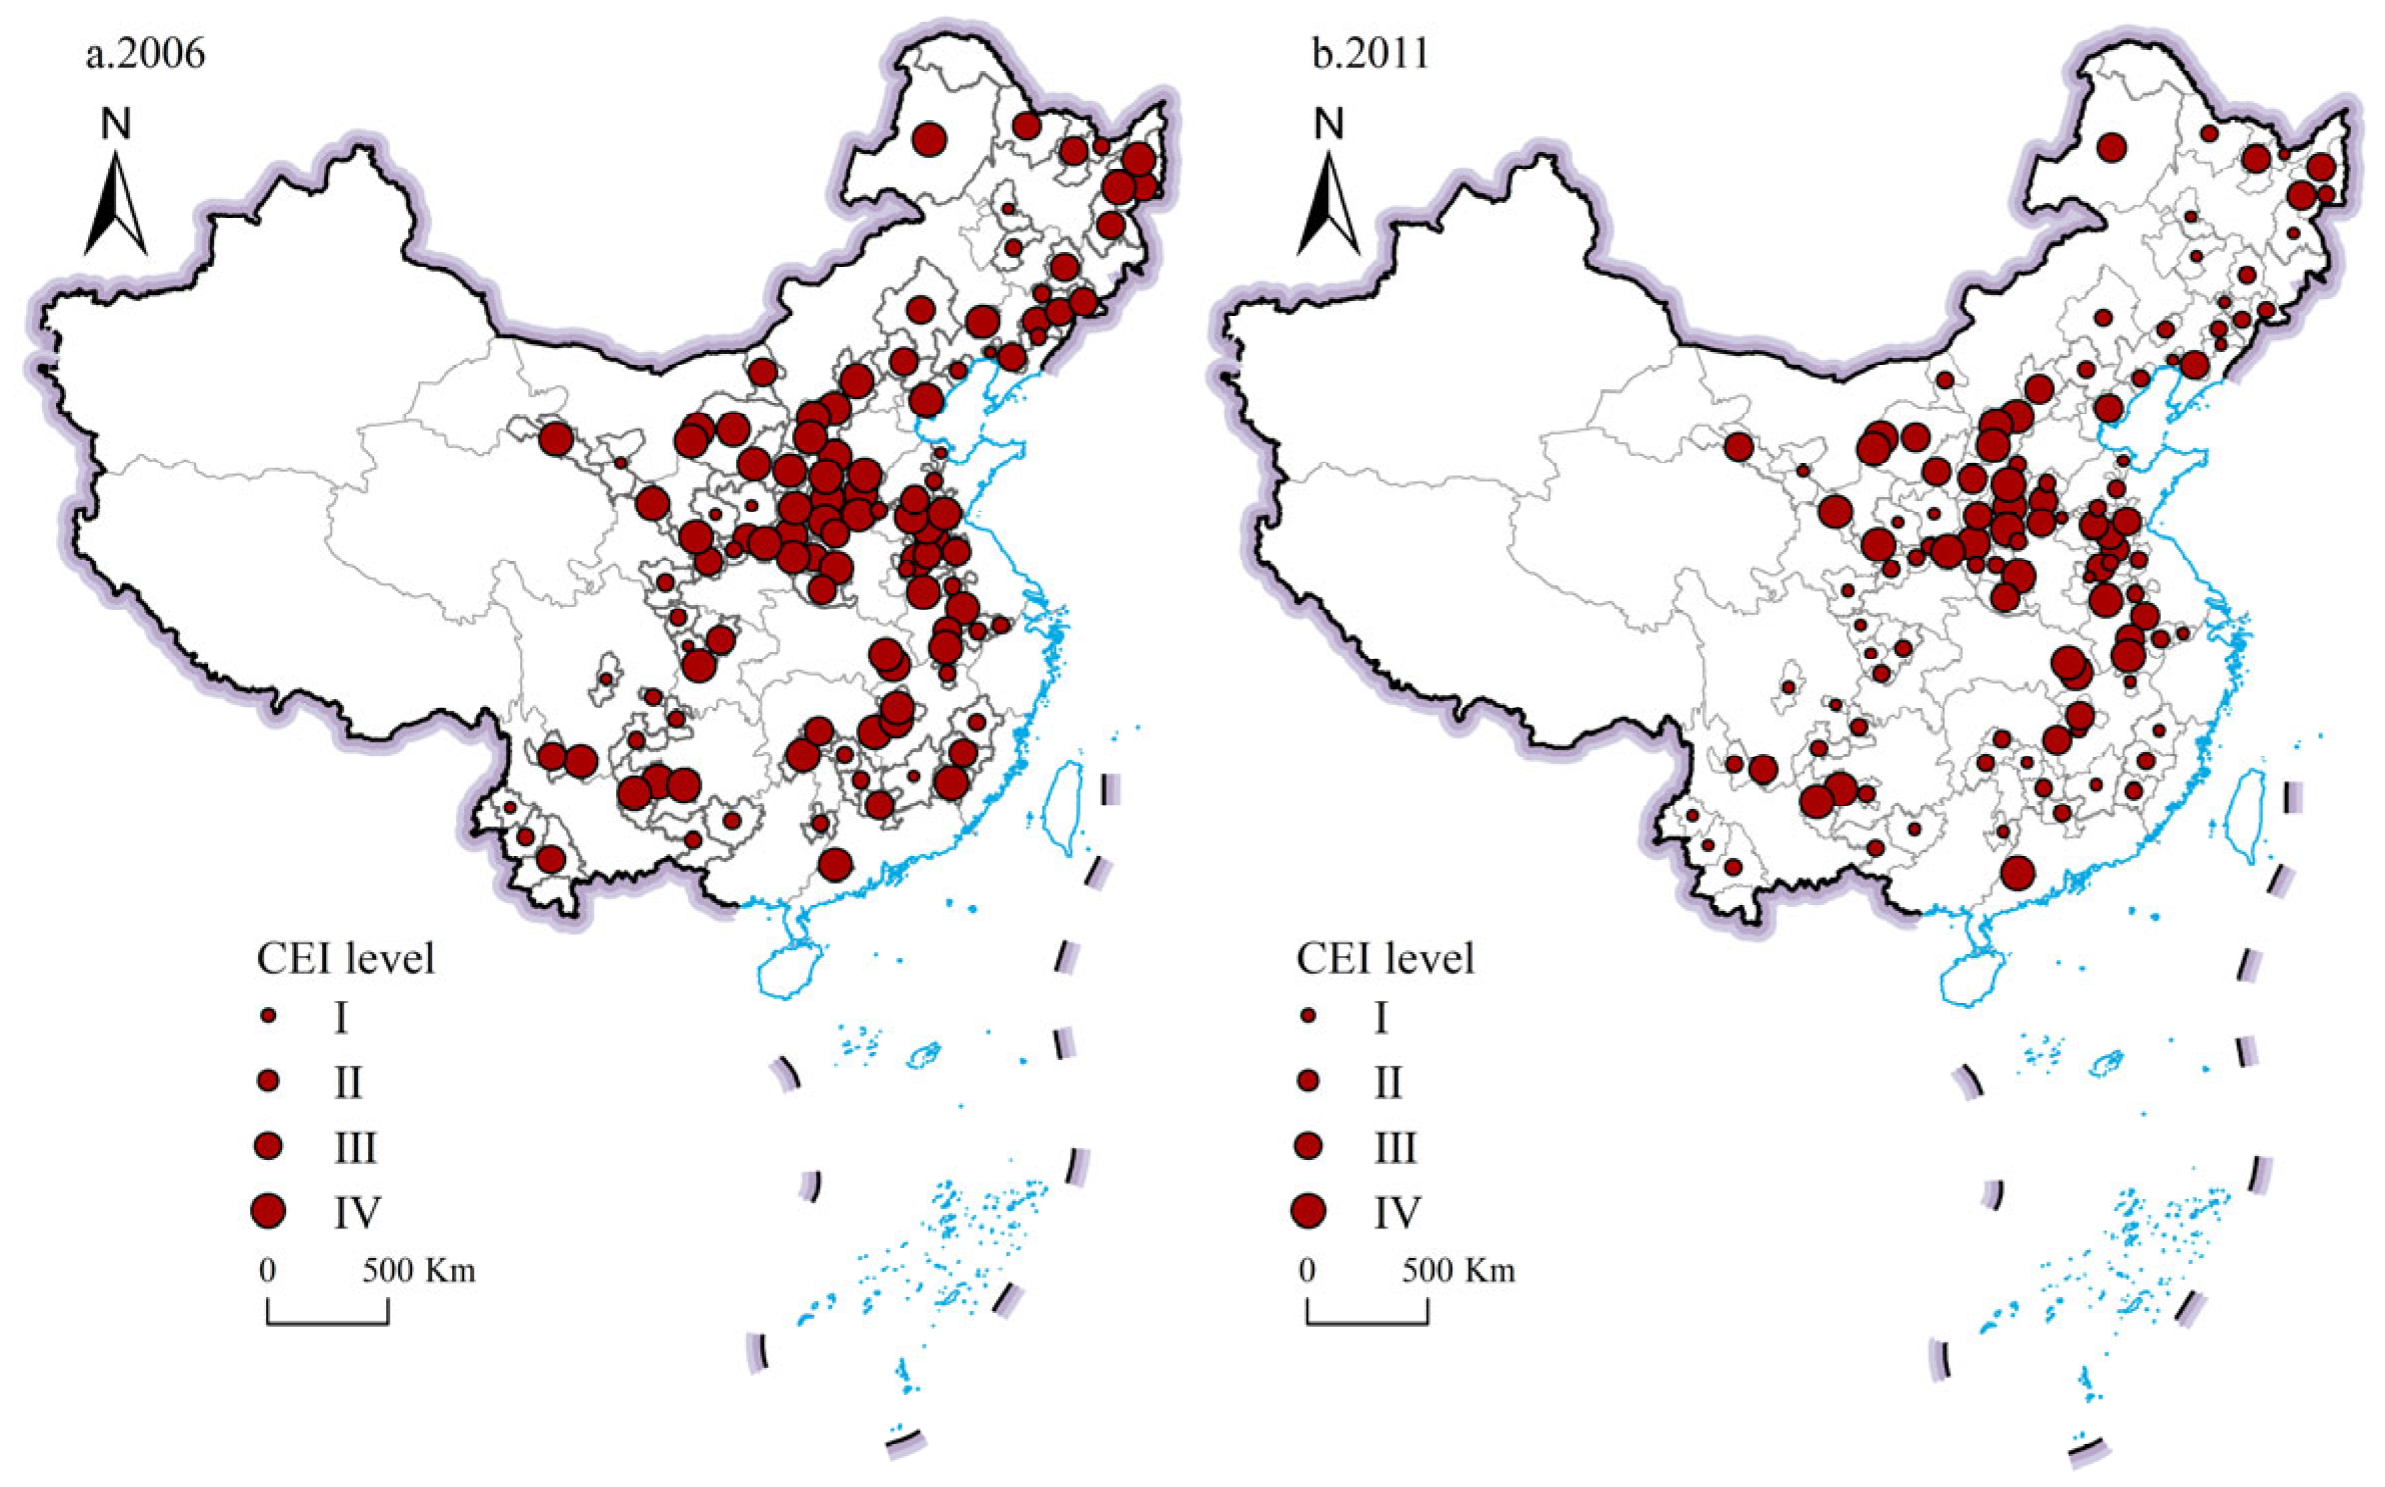
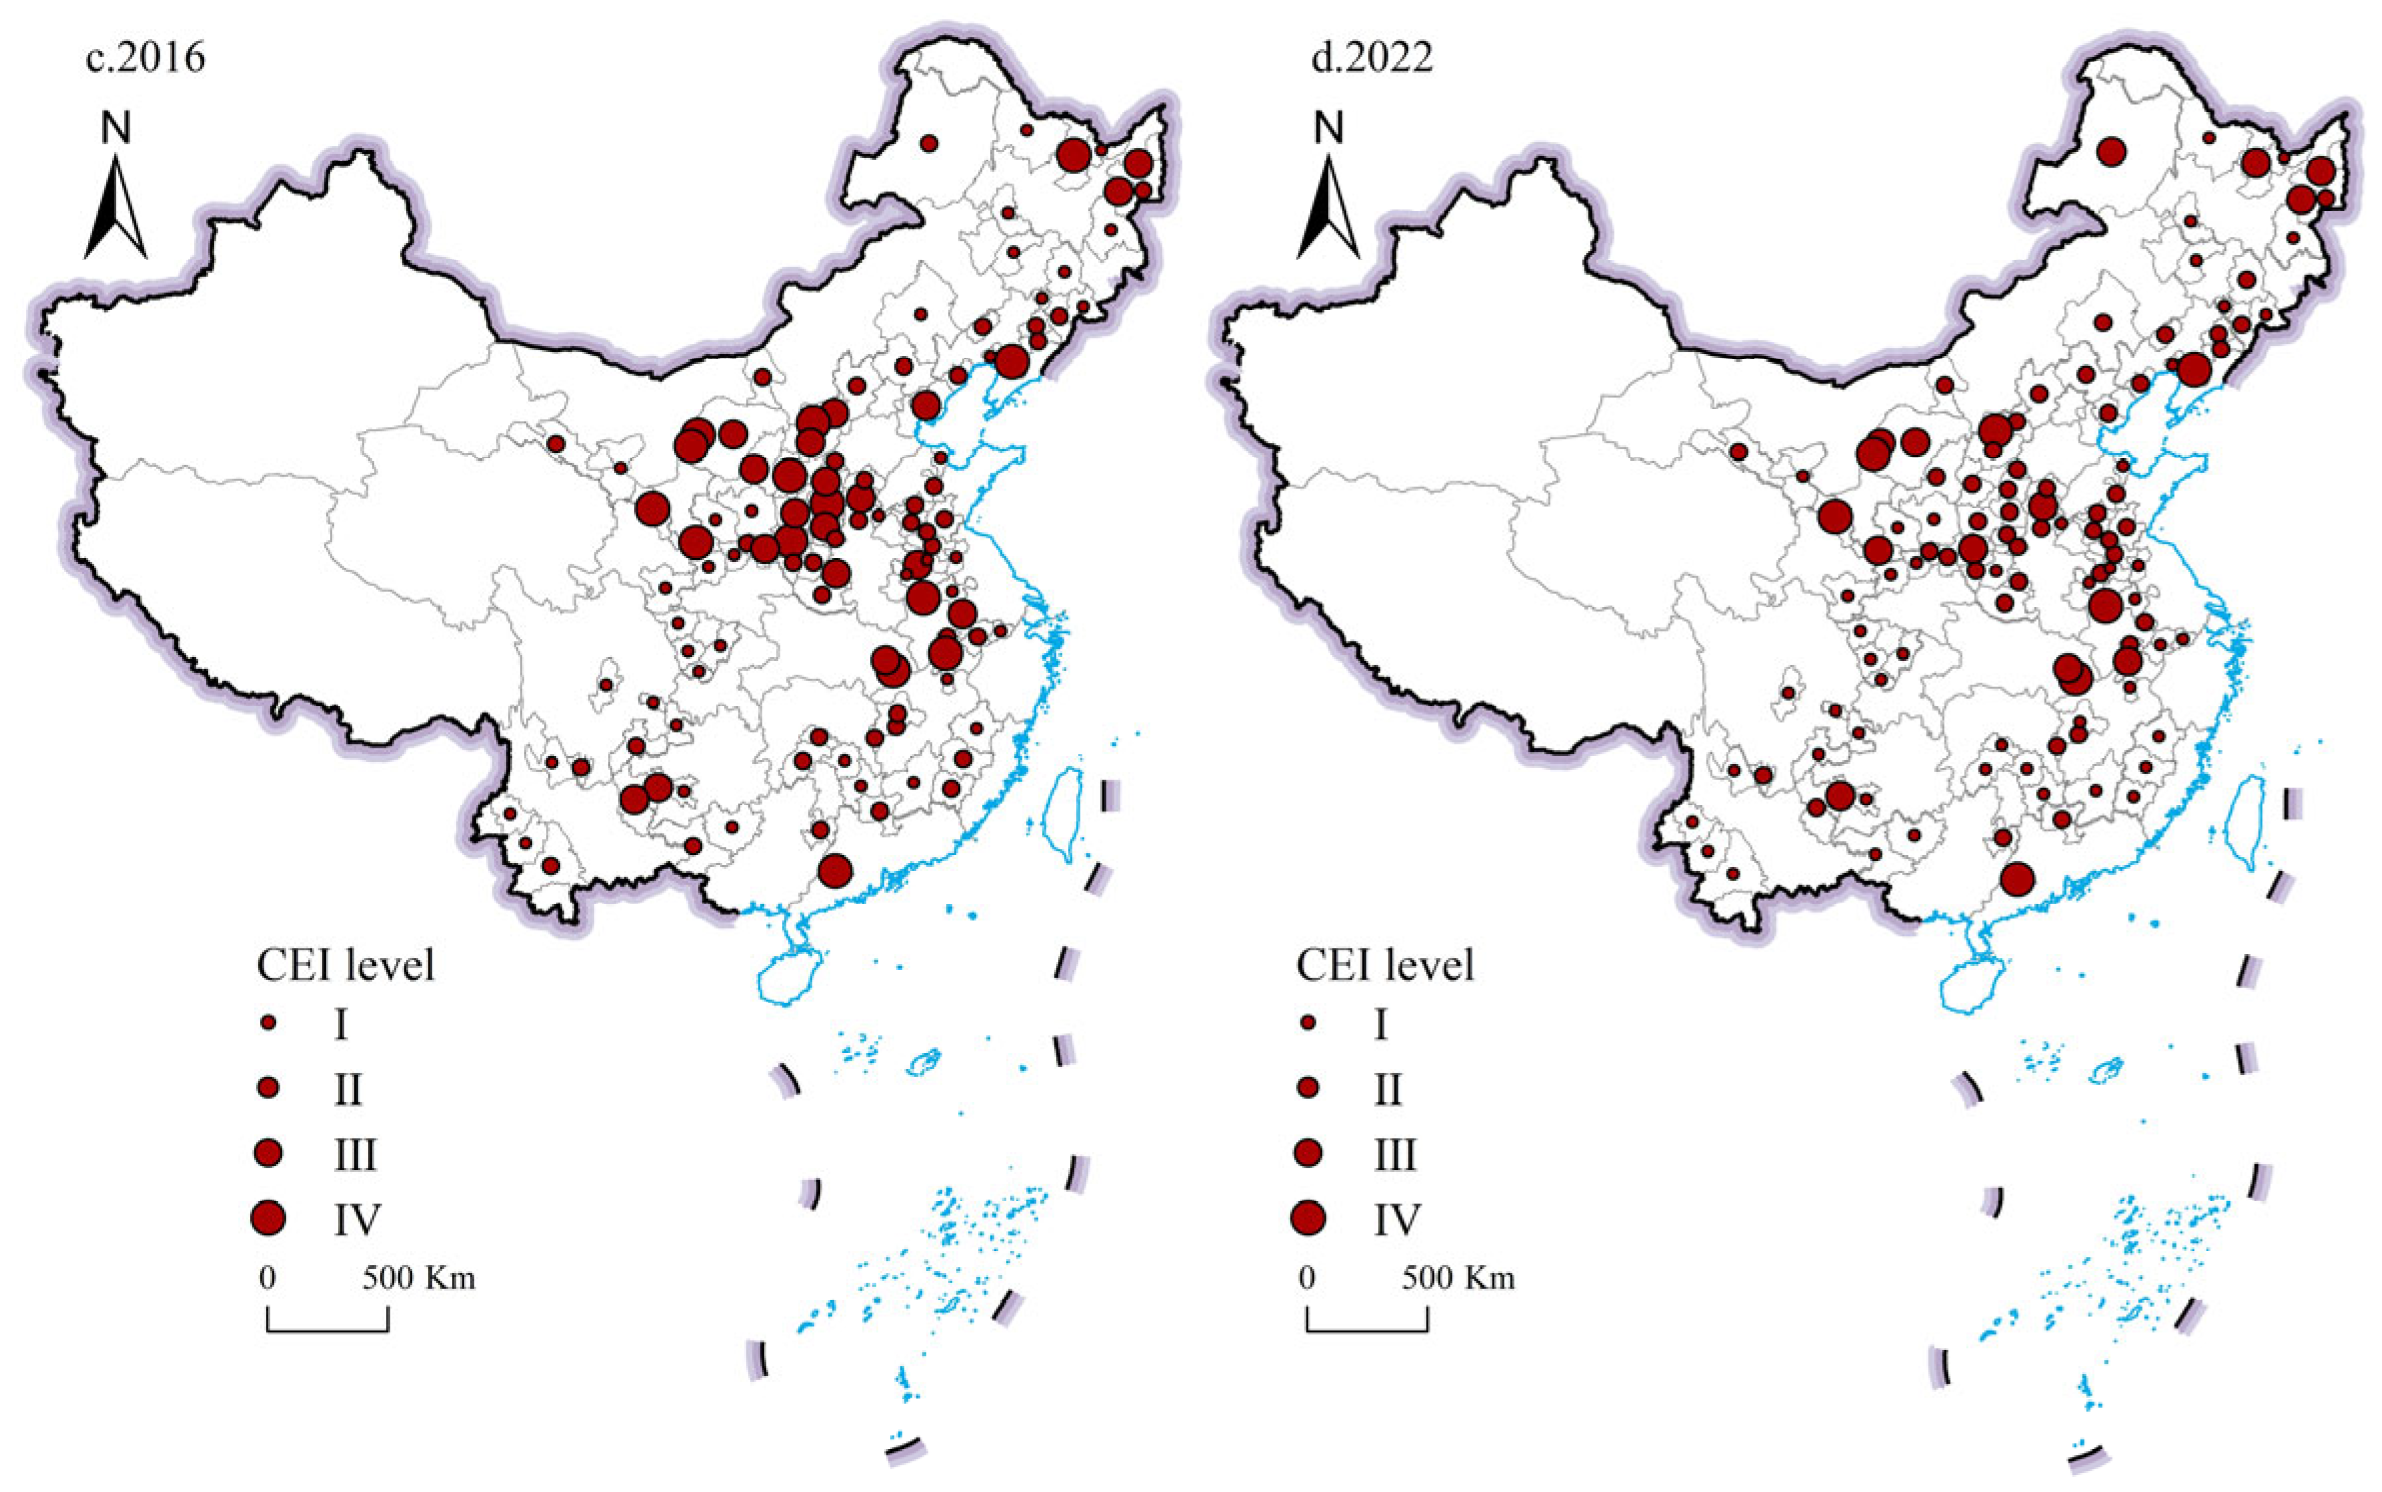
This study takes the average value of the CEI of 112 RBCs as the standard and divides them into four types: low-value areas, medium-low-value areas, medium-high-value areas, and high-value areas (I, II, III, and IV, respectively) to explore the spatial evolution characteristics of the CEI(Figure 7). Areas with a CEI below 50% of the mean are considered low-value areas, areas with a CEI between 50% and 100% of the mean are considered medium-low-value areas, areas with a CEI between 100% and 150% of the mean are considered medium-high-value areas, and areas with a CEI above 150% are considered high-value areas.
According to Figure 7, the CEI of RBCs is spatially south and low while the north is high. In 2006, the CEI of RBCs was relatively high, dominated by medium-high-value areas and high-value areas, accounting for 68.75% of the total. High CEI areas were distributed in clusters in northern parts of China, such as Shanxi Province, Heilongjiang Province, Anhui Province, and other regions. The low-value areas are mainly in the south, showing a multipoint fragmented distribution. In 2011, the CEI of RBCs decreased, with a significant reduction in the medium-high value and high-value areas, and the CEI was dominated by the low-value and medium-low-value areas. By 2016, low- and medium-low-value areas appeared to cluster and develop, accounting for 71.43% of the total number of RBCs and becoming the main type of zone for CEI. In 2022, the high-value areas and medium-high-value areas continued to shrink, while the low-value areas and medium-low-value areas continued to increase in the south, forming a band with the boundaries of Fujian–Jiangxi–Guangdong–Hunan–Guangxi–Yunnan. High-value areas were mainly concentrated in the region north of the central area.
The Markov transfer probability matrix was calculated in Table 1. The upward shift refers to a shift in CEI from high-value areas to low-value areas, and the downward shift refers to a shift in CEI from low-value areas to high-value areas. The results are as follows: (1) The probability values on the diagonal are significantly stronger than those off the diagonal, with a minimum value of 79.33% and a maximum value of 97.66%. CEI-type areas are stable and more likely to remain as they are, with some club convergence. (2) A change to the upside is more likely to occur than a shift to the downside. The probabilities of upwards stepwise shifts in the high, medium-high, and medium-low-value areas are 14.78%, 17.33%, 11.41%, respectively. The probability of a downwards stepwise shift in the low, medium-low, and medium-high-value areas is 2.34%, 5.82%, 3.33%, respectively. There is a clear upwards trend in CEI in RBCs, with significant regional carbon emission reduction effects. The probability of leap migration is relatively small.

4. Analysis of the Effect of GTI on CEI of RBCs

4.1. Regression Analysis of GTI on CEI of RBCs

A random effects model (1), a fixed-effects model (2), and a double fixed-effects model (3) were used to regress each variable, and the double fixed-effects model was chosen for the analysis after the Hausman test. The OLS model results (4) are presented in Table 2.
The correlation coefficient between GTI and CEI was −0.033, which passed the significance test at the 1% confidence level, indicating that GTI significantly reduces CEI in RBCs. On the one hand, GTI is conducive to increasing the development and use of new and clean energy sources, reducing the emission of pollutants such as CO2 from the source. On the other hand, national strategic plans such as the 2030 Carbon Summit Programme have continued to clarify the leading role of science and technology innovation in supporting carbon emissions reduction, and the government supports and guarantees GTI through tax incentives, financial subsidies, and green finance to support the integrated development of vertical and horizontal integration of industries. The strengthening of links between industrial links promotes the specialization and diversification of industrial clusters, fully enabling the economies of scale of industry, improving the efficiency of resource utilization and reducing pollutant discharge in the production process. For example, Datong has been actively creating new energy, materials, technologies, and applications such as hydrogen and fuel cell industries and graphene industries, gradually transforming itself from a coal capital to a hydrogen and new energy capital; it has strongly promoted the green, circular, and low-carbon development of RBCs industries.
According to the control variables, IS, PD, TRAN, and ER have negative inhibitory effects on CEI. This effect may be because the economically affluent areas have a more intelligent mode of industrial operation, close upstream and downstream links, significant economies of scale, and significant environmental benefits from GTI through industrial structure optimization, energy conservation, and emission reduction, resulting in a significant reduction in CEI. Most resource-intensive industries are polluting industries by upgrading machinery and equipment and using clean energy. Enterprises can circumvent the large fines associated with strict environmental controls and reduce pollution emissions from production processes, thereby significantly reducing CEI. RE significantly increase the CEI of RBCs, further validating the resource curse effect.

4.2. Heterogeneity Analysis

4.2.1. Analysis of Heterogeneity at Different Stages of Development

It is essential to investigate the heterogeneity of the impact of GTI on the CEI at various phases of development, and the fixed-effects model was chosen for the analysis after the Hausman test. GTI has a negative inhibitory effect on the CEI, and all of them pass the significance test of 1% (Table 3). It is probably because the social transformation of Regenerating cities lags behind the economic transformation. Their production and daily life are gradually shifting towards a low-carbon model, and the GTI has particularly significant effects in carbon emission reduction. The industrial system and production technology of Mature cities and Declining cities have tended to be perfect. To promote green transformation, the government has formulated strict environmental regulations and provided necessary financial and policy support for GTI, these efforts have achieved remarkable effects on cleaner production. Growing cities are crucial supply and reserve bases for energy and resources. GTI leads to a greater scale of economic development and speed in the process of resource extraction, processing and utilization, with less impact on the carbon emission reduction than other cities.

4.2.2. Analysis of the Heterogeneity of Different Resource Types

Based on the current study, the heterogeneity of the impact of GTI on urban CEI was further explored from the perspective of urban resource types, and a fixed-effects model was selected for analysis by Hausman’s test (Table 4). GTI has a distinct negative inhibitory effect on the CEI of coal-based, ferrous metal-based, nonferrous metal-based, forestry-based cities, and a nonsignificant effect on oil- and gas-based. On the one hand, GTI reduces the use of coal by developing and using new and clean energy sources, which reduces the emission of carbon. Furthermore, GTI can extend the industrial chain of coal, steel, and other industries, promote deep processing for coal-coke-chemical, coal-electricity-chemical, and new materials industries, innovate production equipment, institute the production process of pollution control and end treatment, and effectively raise resource utilization efficiency and cleaner production.

4.3. The Impact of NHTZs on the Carbon Emission Reduction Effect of GTI

NHTZs are a significant geographical expression of technology innovation, which are increasingly becoming key drivers of the reduction in CEs. As a city innovation highland, the NHTZs have played a vital role in promoting the advanced and rationalization of industrial structure and transforming the economic development mode, but whether the establishment of the NHTZs can truly contribute to attaining the dual carbon aim must be tested further. Therefore, a multiperiod twofold difference model is employed in this work to analyze how the development of NHTZs has affected CEs.
Table 5 displays the base regression findings, with Model 1 representing the results of the regression without including control factors and Model 2 representing the results of the regression using control variables. Regardless of whether the control variables are included, the establishment of NHTZs significantly reduces the CEI of RBCs. In addition, the CEI of cities with NHTZs decreases by 0.094 compared to cities without NHTZs. This result is mainly because, firstly, NHTZs combine tax incentives with green and inclusive finance to attract a concentration of talent, create environmental conditions for GTI, provide financial security, and positively promote the transformation of enterprises into high-carbon production models. Additionally, strict environmental regulations, market access thresholds, and the public’s willingness to consume green products have forced enterprises to innovate production technologies, produce green and low-carbon products, and minimize the industrial process’s emission of pollutants. This result agrees with the outcomes of the current research [48].
This work adds to the body of knowledge on the typical case study research on the carbon emission reduction effect of GTI, which is crucial for the development of an ecological society and the advancement of dual carbon goals both theoretically and practically. Further attention can be given to the spatial and temporal differences, evolutionary trends, and agglomeration patterns of CEs from a dynamic perspective in the future. Second, the heterogeneity of RBCs at different spatial scales can be analyzed on the basis of existing research perspectives, such as regional differences, differences in growth stages, and differences in city scale, to improve the research on the heterogeneity of the driving mechanism of GTI in RBCs. In conclusion, this paper examines how national planning policies at the scale of RBCs can reduce CEs. In the future, research can further strengthen the heterogeneity of the implementation effect of national planning policies at the zonal and hierarchical scales from a national perspective to enhance the reference for RBCs and thereby support the dual carbon target.

5. Conclusions and Policy Implications

The geographic and temporal evolution characteristics of CEI in RBCs are first assessed in this study. Second, a panel regression model is used to explore the impact of GTI on the CEI, and regional differences are discussed from the perspectives of different development stages and different resource types. Finally, the effect of the NHTZs’ formation on the CEI is examined using a multiperiod double difference model. The conclusions that are made are as follows.
First, while there was a fluctuating downward trend in the CEI of RBCs from 2006 to 2022 with an average yearly fall rate of 6.084%, the overall CEI remained high, making the effort to reduce CEs challenging. Cities at various phases of development stages and with various resource types exhibit significant variation in CEI, with low values in the south and high values in the north.
Second, the regional differences in the CEI have narrowed, and the results of regional synergy in carbon reduction are remarkable, but there is a trend of polarization. The Markov probability shift matrix also further indicates that the Matthew effect of CEI is obvious, with club convergence, the probability of an upwards shift in CEI is significantly greater than that of a downwards shift, and the probability of leap migration is relatively small.
Third, GTI significantly reduces the CEI of RBCs through the use of clean energy and industrial structure optimization; this relationship has been verified in different development stages and resource types. The establishment of the NHTZs significantly reduces the CEI of RBCs.
This study proposes countermeasures in several aspects, such as increasing investment in GTI, establishing a GTI exchange platform, and applying policies to local conditions. Investing more in GTI will help to advance the growth of green industries. In an effort to lower the cost of trial and error and integrate the digital economy, 5G technology, and blockchain into the manufacturing process of high-carbon industries, and upgrade resource-intensive industries, we can increase financial subsidies and tax breaks for enterprises. The market mechanism, on the other hand, gives us the opportunity to increase the entrance threshold for enterprises, boost the carbon emission trading market, compel important sectors and industries to reach the carbon peak, and continually enhance energy usage efficiency as a means for lower CEs.
We can establish a GTI exchange platform to attract innovative talent. We can actively promote the construction of the NHTZs, national laboratories, and other technology innovation bases, build an open and collaborative scientific and technology innovation network, close the ties between enterprises and research institutes, promote in-depth cooperation between industry, academia, and research institutes, and form a virtuous cycle of GTI that drives industrial optimization and upgrading.
Based on the current development situation of RBCs, we can formulate differentiated development strategies and tailor them to local conditions. Growing and Mature cities, which should be mindful of the harmony between GTI’s economic, ecological, and environmental benefits, keep an eye out for resource overuse, and support the development of clean production and green mining enterprises so as to achieve sustainable economic and ecological development. Declining and Regenerating cities should focus on the development and expansion of successor and alternative industries as well as ecological and environmental protection. It is necessary to optimize the industrial structure, improve energy conservation and efficiency, reduce resource dependence, break the path lock-in predicament, transform high-carbon production and lifestyle, alleviate the contradiction between economic development and environmental protection, and achieve pollution reduction and carbon emission reduction.

Author Contributions

Resources, Y.W.; Data curation, D.W.; Writing—original draft, Y.W. and H.Z.; Writing—review & editing, Y.W.; Supervision, Y.C. All authors have read and agreed to the published version of the manuscript.

Funding

This work was supported by the Humanities and Social Sciences Research Project of Shandong Province: Research on the Path to Achieving the “dual carbon” Strategic Goals in Shandong Province (ZKSL-2022-004); Taishan Scholars project special fund (tsqn202408148).

Institutional Review Board Statement

Not applicable.

Informed Consent Statement

Not applicable.

Data Availability Statement

The data presented in this study are available on request from the corresponding author.

Conflicts of Interest

The authors declare no conflict of interest.

References

  1. Ren, Y.F.; Yuan, W.R.; Zhang, B.T.; Wang, S.J. Does improvement of environmental efficiency matter in reducing carbon emission intensity? Fresh evidence from 283 prefecture-level cities in China. J. Clean. Prod. 2022, 373, 133878. [Google Scholar] [CrossRef]
  2. Liu, X.; Li, Y.C.; Chen, X.H.; Liu, J. Evaluation of low carbon city pilot policy effect on carbon abatement in China: An empirical evidence based on time-varying DID model. Cities 2022, 123, 103582. [Google Scholar] [CrossRef]
  3. Song, W.X.; Yin, S.G.; Zhang, Y.H.; Qi, L.S.Y.; Yi, X. Spatial-temporal evolution characteristics and drivers of carbon emission intensity of resource-based cities in China. Front. Environ. Sci. 2022, 10, 972563. [Google Scholar] [CrossRef]
  4. Zhang, W.; Li, G.X.; Guo, F.Y. Does carbon emissions trading promote green technology innovation in China? Appl. Energy 2022, 315, 119012. [Google Scholar] [CrossRef]
  5. Zhou, J.; Zhang, Z.Y.; Xu, X.B.; Chang, D.H. Does the transformation of resource-dependent cities promote the realization of the carbon-peaking goal? An analysis based on typical resource-dependent city clusters in China. J. Clean. Prod. 2022, 365, 132731. [Google Scholar] [CrossRef]
  6. Fan, M.T.; Li, M.X.; Liu, J.H.; Shao, S. Is high natural resource dependence doomed to low carbon emission efficiency? Evidence from 283 cities in China. Energy Econ. 2022, 115, 106328. [Google Scholar] [CrossRef]
  7. Zheng, H.Y.; Ge, L.M. Carbon emissions reduction effects of sustainable development policy in resource-based cities from the perspective of resource dependence: Theory and Chinese experience. Resour. Policy 2022, 78, 102799. [Google Scholar] [CrossRef]
  8. Zhang, R.J.; Tai, H.W.; Cao, Z.X.; Wei, C.C.; Cheng, K.T. Green innovation ecosystem evolution: Diffusion of positive green innovation game strategies on complex networks. J. Innov. Knowl. 2024, 9, 100500. [Google Scholar] [CrossRef]
  9. Zhao, Z.Y.; Zhou, S.N.; Wang, S.Y.; Ye, C.; Wu, T. The Impact of Carbon Emissions Trading Pilot Policy on Industrial Structure Upgrading. Sustainability 2022, 14, 10818. [Google Scholar] [CrossRef]
  10. Wang, F.S.; Cai, W.X.; Elahi, E. Do Green Finance and Environmental Regulation Play a Crucial Role in the Reduction of CO2 Emissions? An Empirical Analysis of 126 Chinese Cities. Sustainability 2021, 13, 13014. [Google Scholar] [CrossRef]
  11. Gao, P.F.; Wang, Y.D.; Zou, Y.; Su, X.F.; Che, X.H.; Yang, X.D. Green technology innovation and carbon emissions nexus in China: Does industrial structure upgrading matter? Front. Psychol. 2022, 13, 951172. [Google Scholar] [CrossRef]
  12. Shan, S.; Genç, S.Y.; Kamran, H.W.; Dinca, G. Role of green technology innovation and renewable energy in carbon neutrality: A sustainable investigation from Turkey. J. Environ. Manag. 2021, 294, 113004. [Google Scholar] [CrossRef] [PubMed]
  13. Cai, A.X.; Zheng, S.Y.; Cai, L.H.; Yang, H.M.; Comite, U. How Does Green Technology Innovation Affect Carbon Emissions? A Spatial Econometric Analysis of China’s Provincial Panel Data. Front. Environ. Sci. 2021, 9, 813811. [Google Scholar] [CrossRef]
  14. Xin, D.L.; Ahmad, M.; Khattak, S.I. Impact of innovation in climate change mitigation technologies related to chemical industry on carbon dioxide emissions in the United States. J. Clean. Prod. 2022, 379, 134746. [Google Scholar] [CrossRef]
  15. Paramati, S.R.; Di, M.; Huang, R.X. The role of financial deepening and green technology on carbon emissions: Evidence from major OECD economies. Financ. Res. Lett. 2021, 41, 101794. [Google Scholar] [CrossRef]
  16. Chen, Y.Y.; Yao, Z.Y.; Zhong, K. Do environmental regulations of carbon emissions and air pollution foster green technology innovation: Evidence from China’s prefecture-level cities. J. Clean. Prod. 2022, 350, 131537. [Google Scholar] [CrossRef]
  17. Zhang, M.L.; Liu, Y. Influence of digital finance and green technology innovation on China’s carbon emission efficiency: Empirical analysis based on spatial metrology. Sci. Total Environ. 2022, 838, 156463. [Google Scholar] [CrossRef]
  18. Wang, L.; Chen, Y.Y.; Ramsey, T.S.; Hewings, G.J.D. Will researching digital technology really empower green development? Technol. Soc. 2021, 66, 101638. [Google Scholar] [CrossRef]
  19. Wang, Z.C.; Zhou, X.L. Can Innovation-Driven Policy Reduce China’s Carbon Emission Intensity?—A Quasi-Natural Experiment Based on the National Innovative City Pilot Policy. Sustainability 2023, 15, 4383. [Google Scholar] [CrossRef]
  20. Khattak, S.I.; Ahmad, M.; ul Haq, Z.; Gao, S.F.; Hang, J. On the goals of sustainable production and the conditions of environmental sustainability: Does cyclical innovation in green and sustainable technologies determine carbon dioxide emissions in G-7 economies. Sustain. Prod. Consum. 2022, 29, 406–420. [Google Scholar] [CrossRef]
  21. Ahmed, N.; Areche, F.O.; Nieto, D.D.C.; Borda, R.F.C.; Gonzales, B.C.; Senkus, P.; Siemiński, P.; Skrzypek, A. Nexus between Cyclical Innovation in Green Technologies and CO2 Emissions in Nordic Countries: Consent toward Environmental Sustainability. Sustainability 2022, 14, 11768. [Google Scholar] [CrossRef]
  22. Wang, N.; Yu, H.F.; Shu, Y.L.; Chen, Z.; Li, T.C. Can green patents reduce carbon emission intensity?—An empirical analysis based on China’s experience. Front. Environ. Sci. 2022, 10, 1084977. [Google Scholar] [CrossRef]
  23. Du, K.R.; Li, P.Z.; Yan, Z.M. Do green technology innovations contribute to carbon dioxide emission reduction? Empirical evidence from patent data. Technol. Forecast. Soc. Change 2019, 146, 297–303. [Google Scholar] [CrossRef]
  24. Chen, H.Y.; Yi, J.Z.; Chen, A.B.; Peng, D.X.; Yang, J.Q. Green technology innovation and CO2 emission in China: Evidence from a spatial-temporal analysis and a nonlinear spatial durbin model. Energy Policy 2023, 172, 113338. [Google Scholar] [CrossRef]
  25. Li, Y.H.; Chai, X.Y.; Su, R.Q.; Chen, K.D. Impact of accelerated depreciation policies for fixed assets on firms’ green innovation performance. Financ. Res. Lett. 2025, 74, 106816. [Google Scholar] [CrossRef]
  26. Fan, X.J.; Wu, S.M.; Lei, Y.L.; Li, S.T.; Li, L. Have China’s resource-based regions improved in the division of GVCs?—Taking Shanxi Province as an example. Resour. Policy 2020, 68, 101725. [Google Scholar] [CrossRef]
  27. Liu, P.; Zhou, H.J.; Chun, X.; Wan, Z.Q.; Liu, T.; Sun, B.; Wang, J.W.; Zhang, W.H. Characteristics of fine carbonaceous aerosols in Wuhai, a resource-based city in Northern China: Insights from energy efficiency and population density. Environ. Pollut. 2022, 292, 118368. [Google Scholar] [CrossRef]
  28. Küpper, M.; Quass, U.; John, A.C.; Kaminski, H.; Leinert, S.; Breuer, L.; Gladtke, D.; Weber, S.; Kuhlbusch, T.A.J. Contributions of carbonaceous particles from fossil emissions and biomass burning to PM10 in the Ruhr area, Germany. Atmos. Environ. 2018, 189, 174–186. [Google Scholar] [CrossRef]
  29. Qiu, F.D.; Yuan, H.; Bai, L.Y.; Li, F. Spatial-temporal heterogeneity of industrial structure transformation and carbon emission effect in Xuzhou Metropolitan Area. Chin. Geogr. Sci. 2017, 27, 904–917. [Google Scholar] [CrossRef]
  30. Kuai, P.; Li, W.; Cheng, R.H.; Cheng, G. An application of system dynamics for evaluating planning alternatives to guide a green industrial transformation in a resource-based city. J. Clean. Prod. 2015, 104, 403–412. [Google Scholar] [CrossRef]
  31. Jing, Z.R.; Wang, J.M. Sustainable development evaluation of the society–economy–environment in a resource-based city of China: A complex network approach. J. Clean. Prod. 2020, 263, 121510. [Google Scholar] [CrossRef]
  32. Li, Z.; Cai, Y.P.; Lin, G. Pathways for sustainable municipal energy systems transition: A case study of Tangshan, a resource-based city in China. J. Clean. Prod. 2022, 330, 129835. [Google Scholar] [CrossRef]
  33. Zhao, M.; Zhang, X.Q.; Wang, C.X.; Zhao, Y.; Wu, G. Research on Residents’ Willingness to Pay for Promoting the Green Development of Resource-Based Cities: A Case Study in Chifeng. Sustainability 2021, 13, 2833. [Google Scholar] [CrossRef]
  34. Cheng, Z.H.; Li, X.; Wang, M.X. Resource curse and green economic growth. Resour. Policy 2021, 74, 102325. [Google Scholar] [CrossRef]
  35. Qian, Q.L.; Luo, S.C. The dilemma of land green use efficiency in resource-based cities: A perspective based on digital transformation. Front. Environ. Sci. 2024, 12, 1339928. [Google Scholar] [CrossRef]
  36. Qian, L.; Xu, X.L.; Sun, Y.; Zhou, Y.J. Carbon emission reduction effects of eco-industrial park policy in China. Energy 2022, 261, 125315. [Google Scholar] [CrossRef]
  37. Song, M.L.; Zhao, X.; Shang, Y.P. The impact of low-carbon city construction on ecological efficiency: Empirical evidence from quasi-natural experiments. Resour. Conserv. Recycl. 2020, 157, 104777. [Google Scholar] [CrossRef]
  38. Li, B.; Tu, Y.X.; Liu, J. Impact of Industrial Transformation and Upgrading Demonstration Zones on carbon emissions intensity in resource-based cities. J. Environ. Plan. Manag. 2025, 68, 1037–1056. [Google Scholar] [CrossRef]
  39. Zhang, H.T.; Sun, X.M.; Bi, C.F.; Ahmad, M.; Wang, J. Can sustainable development policy reduce carbon emissions? Empirical evidence from resource-based cities in China. Sci. Total Environ. 2022, 838, 156341. [Google Scholar] [CrossRef]
  40. Chen, W.; Chen, W.J.; Ning, S.Y.; Liu, E.N.; Zhou, X.; Wang, Y.N.; Zhao, M.J. Exploring the industrial land use efficiency of China’s resource-based cities. Cities 2019, 93, 215–223. [Google Scholar] [CrossRef]
  41. Cai, X.Y.; Xiang, H.; Zheng, H.T. Impact of energy consumption patterns on peak emissions in China’s carbon neutralisation process. Energy Strategy Rev. 2024, 55, 101501. [Google Scholar] [CrossRef]
  42. Pan, M.J.; Zhao, X.; Lv, K.J.; Rosak-Szyrocka, J.; Mentel, G.; Truskolaski, T. Internet development and carbon emission-reduction in the era of digitalization: Where will resource-based cities go? Resour. Policy 2023, 81, 103345. [Google Scholar] [CrossRef]
  43. Zhao, Y.B.; Chen, R.Y.; Zang, P.; Huang, L.Q.; Ma, S.F.; Wang, S.J. Spatiotemporal patterns of global carbon intensities and their driving forces. Sci. Total Environ. 2022, 818, 151690. [Google Scholar] [CrossRef] [PubMed]
  44. Cheng, Y.; Zhang, Y.; Wang, J.J.; Jiang, J.X. The impact of the urban digital economy on China’s carbon intensity: Spatial spillover and mediating effect. Resources. Conserv. Recycl. 2023, 189, 106762. [Google Scholar] [CrossRef]
  45. Weng, Z.X.; Zhong, M.; Yang, X.; Cheng, C.Y. Effect of China’s carbon market on the promotion of green technological innovation. J. Clean. Prod. 2022, 373, 133820. [Google Scholar] [CrossRef]
  46. Huang, S.F.; Ge, J.P. Do environmental regulations truly reduce risks? Evidence from the heterogeneity of resource-based cities. Risk Anal. 2025; Early View. [Google Scholar] [CrossRef]
  47. Li, Y.C.; Zhao, L.; Suo, J.J. Comprehensive Assessment on Sustainable Development of Highway Transportation Capacity Based on Entropy Weight and TOPSIS. Sustainability 2014, 6, 4685–4693. [Google Scholar] [CrossRef]
  48. Yang, H.S.; Tang, M.; Chao, X.R.; Li, P. How environmental regulation influences the green economy efficiency of resource-based cities: An empirical study from China. Environ. Dev. Sustain. 2024, 26, 27249–27276. [Google Scholar] [CrossRef]
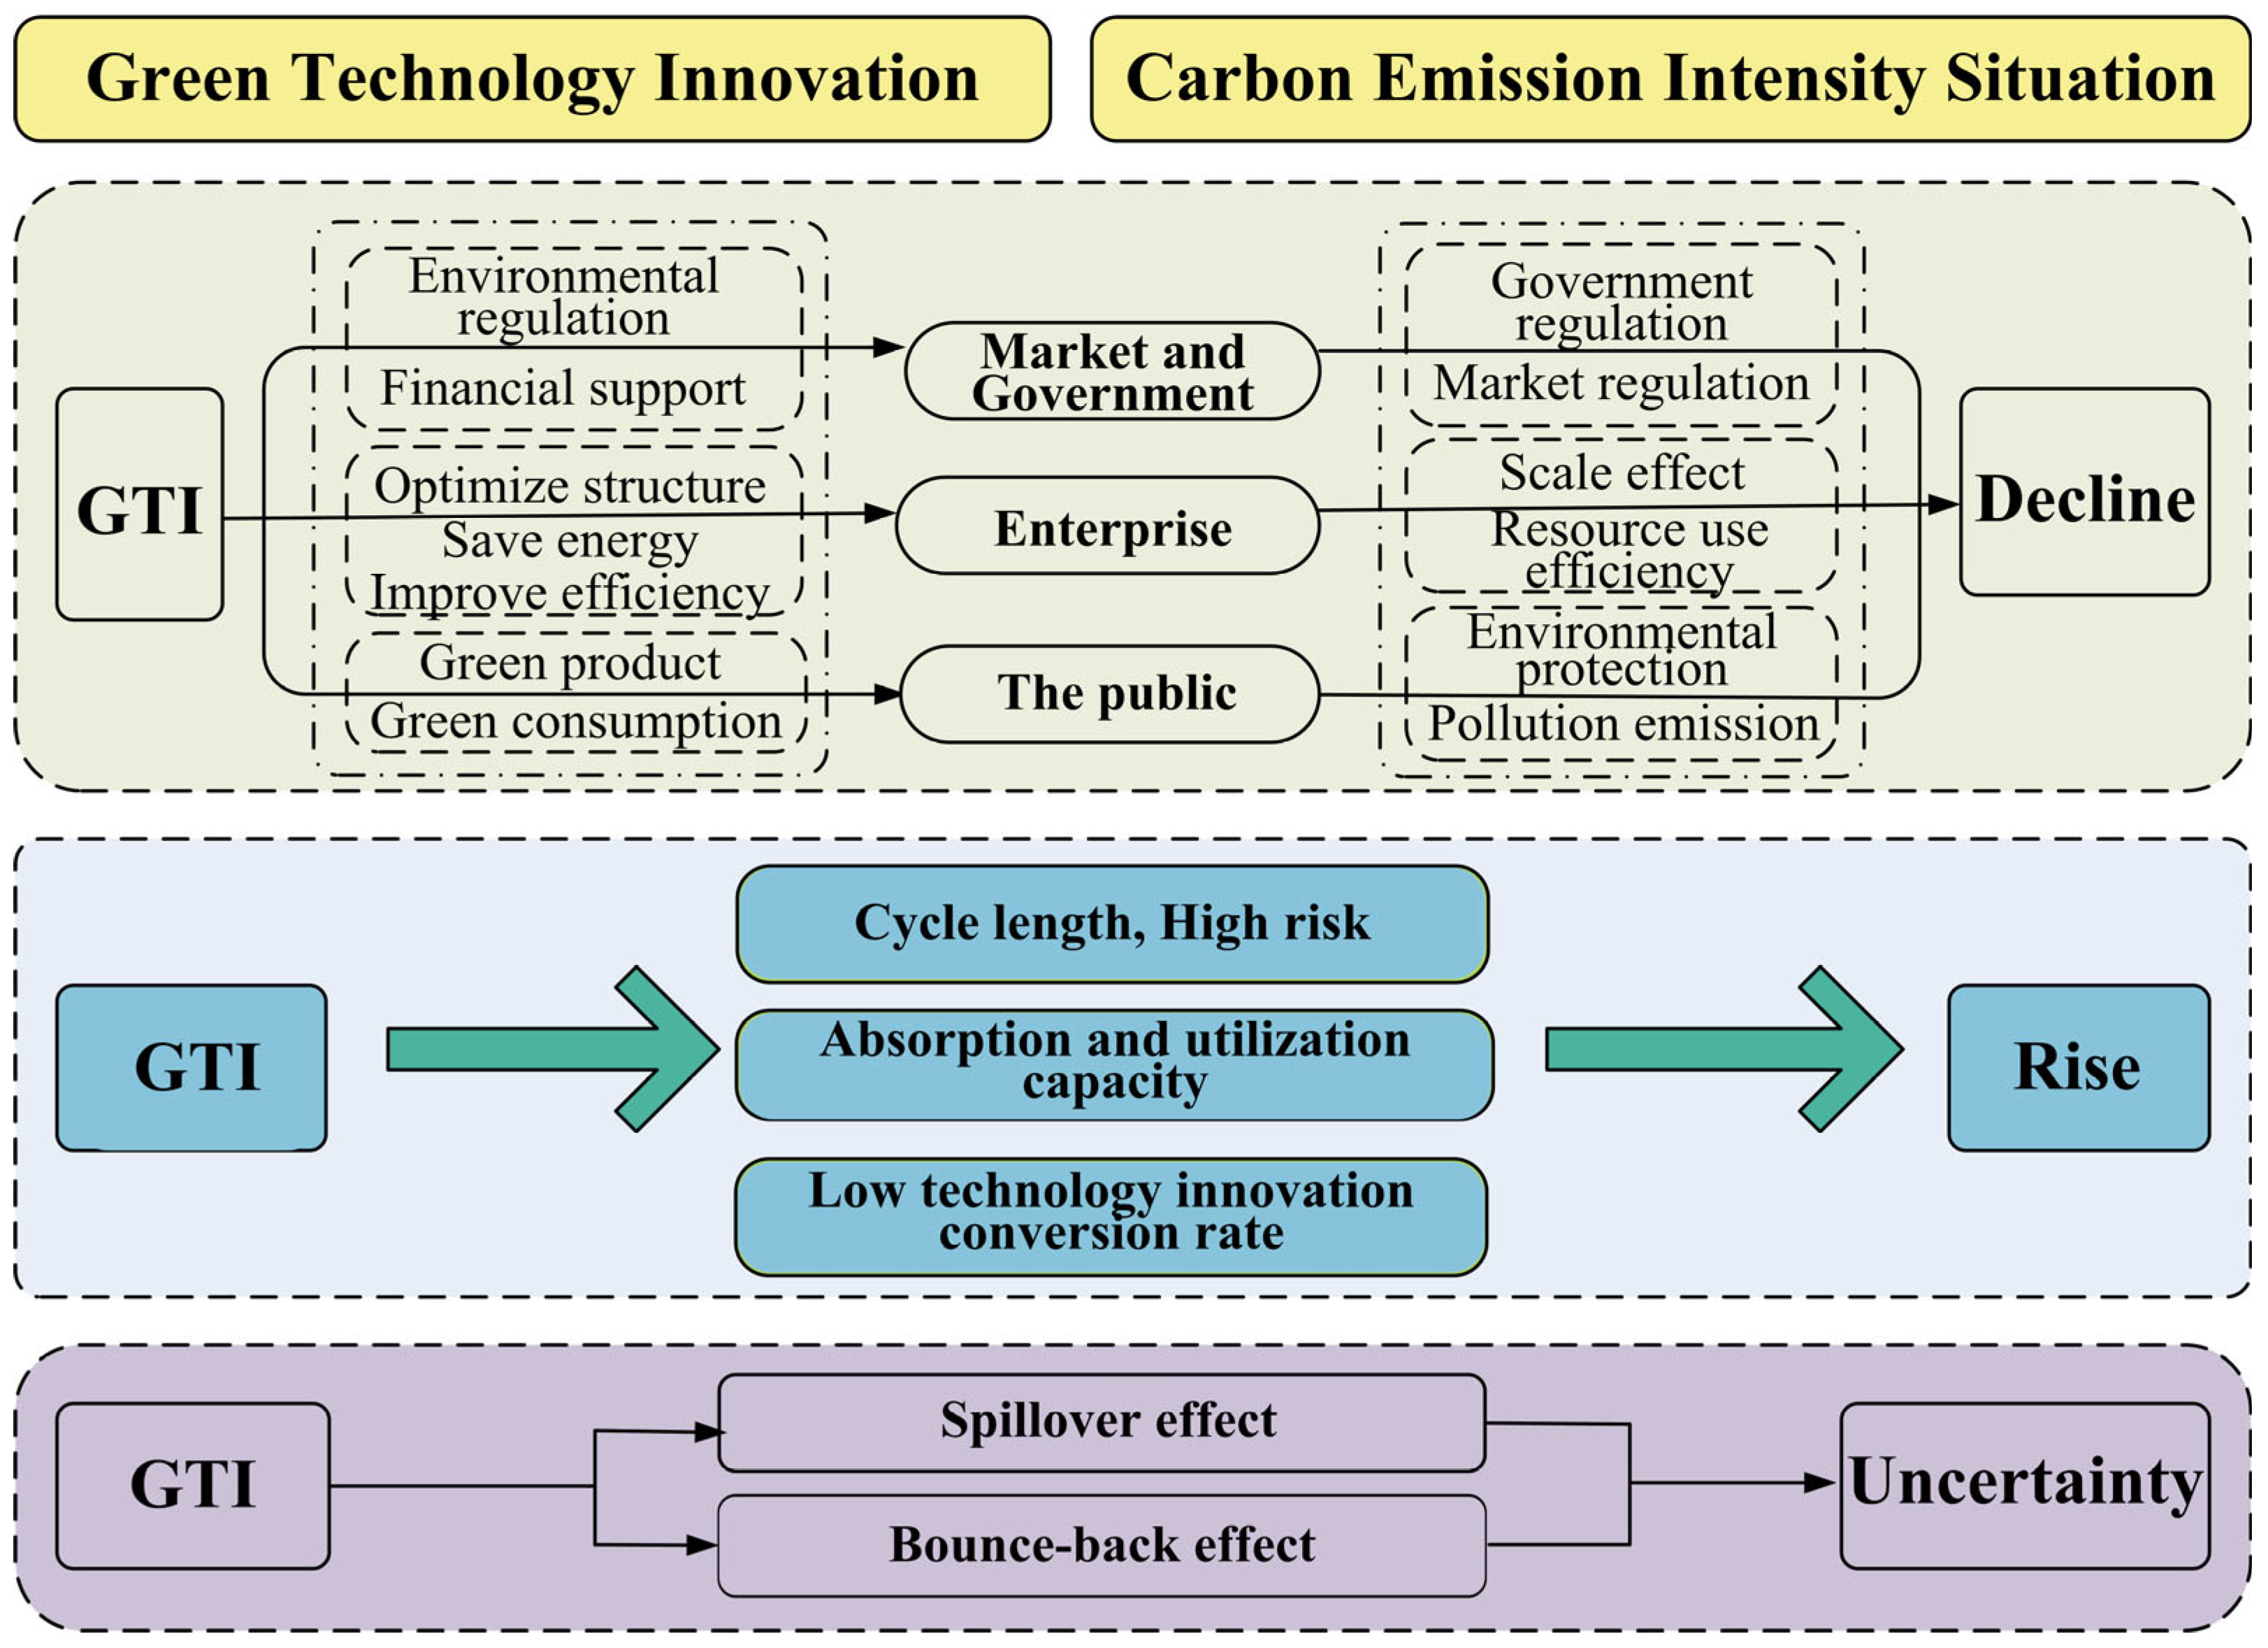
Figure 1. Mechanisms of GTI on CEI.
Sustainability 17 05075 g001
Figure 2. Stages of development and resource types in RBCs.
Sustainability 17 05075 g002
Figure 3. Characteristics of the temporal evolution of CEI in RBCs.
Sustainability 17 05075 g003
Figure 4. CEI a box-plot for RBCs.
Sustainability 17 05075 g004
Figure 5. CEI box plots for RBCs 2006 (blue), 2011 (purple), 2016 (green), 2022 (cyan).
Sustainability 17 05075 g005
Figure 6. CEI kernel density map for RBCs.
Sustainability 17 05075 g006
Figure 7. Spatial evolutionary characteristics of CEI in RBCs.
Sustainability 17 05075 g007aSustainability 17 05075 g007b
Table 1. Markov probability transfer matrix.
StatesIIIIIIIVn
I0.97660.02340.00000.0000428
II0.11410.82550.05820.0022447
III0.00000.17330.79330.0333450
IV0.00000.00000.14780.8522467
Table 2. Basic regression results.
(1)(2)(3)OLS
lnGTI−0.197 ***−0.185 ***−0.033 ***−0.084 ***
(−30.61)(−28.38)(−3.38)(−6.44)
lnIS−0.431 ***−0.404 ***−0.599 ***0.172 **
(−10.92)(−10.33)(−13.93)(2.52)
lnPD0.179 ***−0.786 ***−0.772 ***0.292 ***
(2.70)(−5.93)(−6.44)(6.49)
lnRE0.042 ***0.037 ***0.029 ***0.139 ***
(4.63)(4.06)(3.44)(10.99)
lnTRAN−0.346 ***−0.394 ***−0.168 ***−0.318 ***
(−9.16)(−10.51)(−4.74)(−4.99)
lnER−0.085 ***−0.087 ***−0.025 **0.079 **
(−6.67)(−7.02)(−2.13)(2.34)
Cons2.384 ***7.469 ***7.912 ***−1.709 ***
(6.40)(10.71)(12.32)(−4.64)
R20.6380.6380.7110.140
*** p < 0.01, ** p < 0.05.
Table 3. Heterogeneity analysis of factors influencing RBCs at different stages of development.
GrowingMatureDecliningRegenerating
ferefere fere fere
lnGTI0.067 ***−0.078 ***−0.208 ***−0.224 ***−0.180 ***−0.181 ***−0.230 ***−0.239 ***
(−2.65)(−3.43)(−25.18)(−27.59)(−14.25)(−13.96)(−11.82)(−12.20)
Cons3.2391.1078.035 ***1.473 **6.680 ***3.341 ***10.743 ***4.831 ***
(1.26)(0.89)(7.51)(2.49)(5.80)(4.90)(6.99)(5.65)
Control variableYESYESYESYESYESYESYESYES
R20.4340.4320.7460.7390.5600.5500.6830.660
*** p < 0.01, ** p < 0.05.
Table 4. Heterogeneity analysis of factors influencing different resource types in RBCs.
Coal-BasedOil- and Gas-BasedFerrous Metal-BasedNonferrous Metal-BasedForestry-Based
fere fere fefere fere fe
lnGTI−0.186 ***−0.193 ***−0.063−0.041−0.177 ***−0.185 ***−0.192 ***−0.202 ***−0.129 ***−0.122 ***
(−19.63)(−20.70)(−1.43)(−1.41)(−12.42)(−12.77)(−14.63)(−16.10)(−5.42)(−5.47)
Cons5.222 ***1.566 ***20.466 ***3.019 ***8.814 ***2.568 ***5.413 **1.3924.738 **2.850 ***
(5.63)(3.04)(4.40)(3.77)(6.49)(2.92)(2.35)(0.82)(2.28)(5.27)
Control variableYESYESYESYESYESYESYESYESYESYES
R20.6250.6180.5930.0070.6740.6630.8950.8960.5420.537
*** p < 0.01, ** p < 0.05.
Table 5. Impact of the establishment of NHTZs on RBCs.
Model 1Model 2
NHTZs−0.114 ***−0.094 ***
(−5.45)(−4.87)
Cons1.426 ***7.832 ***
(68.73)(12.28)
Control variableNOYES
R20.4820.851
*** p < 0.01.
Disclaimer/Publisher’s Note: The statements, opinions and data contained in all publications are solely those of the individual author(s) and contributor(s) and not of MDPI and/or the editor(s). MDPI and/or the editor(s) disclaim responsibility for any injury to people or property resulting from any ideas, methods, instructions or products referred to in the content.