1. Introduction
Recent global trends have shown a sharp increase in climate disasters, which are directly linked to the persistent emission of pollutants and greenhouse gases from human activities. These emissions contribute to severe changes in climatic systems, including altered precipitation patterns, intensified storms, and disruptions to ocean currents. Despite the landmark Paris Agreement in 2015, aimed at reducing CO
2 emissions, global emissions increased by 8.34% from 215 to 2023 [
1]. This persistent rise in CO
2 emissions necessitates renewed research and a deeper understanding of the underlying drivers as these emissions threaten environmental sustainability. Despite fostering economic growth and creating employment, the rapid expansion of tourism has caused significant environmental problems, mainly linked to carbon dioxide emissions [
2].
While numerous studies have examined factors influencing environmental quality, particularly CO
2 emissions, key drivers include globalization [
3], financial sector development [
4,
5], industrial value added [
6], economic growth [
7,
8], renewable energy use [
9], and fossil fuel consumption [
10]. The tourism sector, among the most prominent global industries, has emerged as a significant contributor to economic growth and environmental degradation. Tourism impacts energy consumption and CO
2 emissions through transportation, accommodation, and other services [
11,
12], with transportation, particularly air travel, being a major contributor to greenhouse gas emissions. The big global tourism industry significantly impacts the environment, society, and employment generation. Additionally, it encourages exports [
11,
13,
14]. However, this balance is disrupted by the movement of tourist flows, as people increasingly rely on air, sea, and road transportation and consume a wide range of goods and services [
15].
Concerning accommodation and air transportation, the tourism sector has high energy consumption, allowing greenhouse gases (GHGs) and CO
2 emissions to rise significantly from one country to the other. Carbon emissions from international tourism will grow by 45% from 458 Mt CO
2 to 665 Mt CO
2 by 2030, thus demonstrating tourism’s escalating impact on the environment [
16]. The international tourism industry contributed approximately 5% of global CO
2 emissions in 2016 [
17]. Fossil fuel consumption, especially in the tourism sector, is critical to the rise of CO
2 emissions, a primary driver of climate change. Projections indicate that global CO
2 emissions could reach 43.2 billion metric tons by 2040, a 55.8% increase from 2000 to 2012 [
18]. In terms of CO
2 emissions due to the use of fossil fuels, the highest levels are recorded in the United Kingdom, Spain, France, and Italy. Between 1990 and 2008, the rate of growth in CO
2 emission attributable to fossil fuel consumption within the European Union (EU) and its neighbors was 6% per year on average. Carbon dioxide emissions consequent to fossil fuel use are the greatest in the United Kingdom, Spain, France, and Italy.
Lee and Brahmasrene [
19] further stated that the EU depended on fossil fuels in 2008, producing 712 million metric tons of CO
2 emissions. The EU’s total energy demand underwent considerable changes, and in the year 2013, the energy demand was calculated to be 666 million tons. Fotis et al. [
20] found that tourism in the European Union in 2013 contributed 8.4% of the overall workforce, apart from contributing EUR 1248 billion to the gross domestic product in 2011. By analyzing the subsequent research questions, this investigation aims to elucidate the sustainable agenda of the United Nations regarding resource conservation.
Governments usually hope to provide infrastructure (energy, water, and transport) with the addition of higher quality goods and services to attract foreign tourists. Stronger development of the inland regions strengthens the ability of national producers to compete in global markets [
21,
22,
23]. Revenue generated by commercial activities, such as lodging, transit, and dining, can contribute to wider economic development goals. Moreover, tourism also influences the environment due to increased energy consumption (EC) [
24]. Therefore, it causes severe environmental degradation.
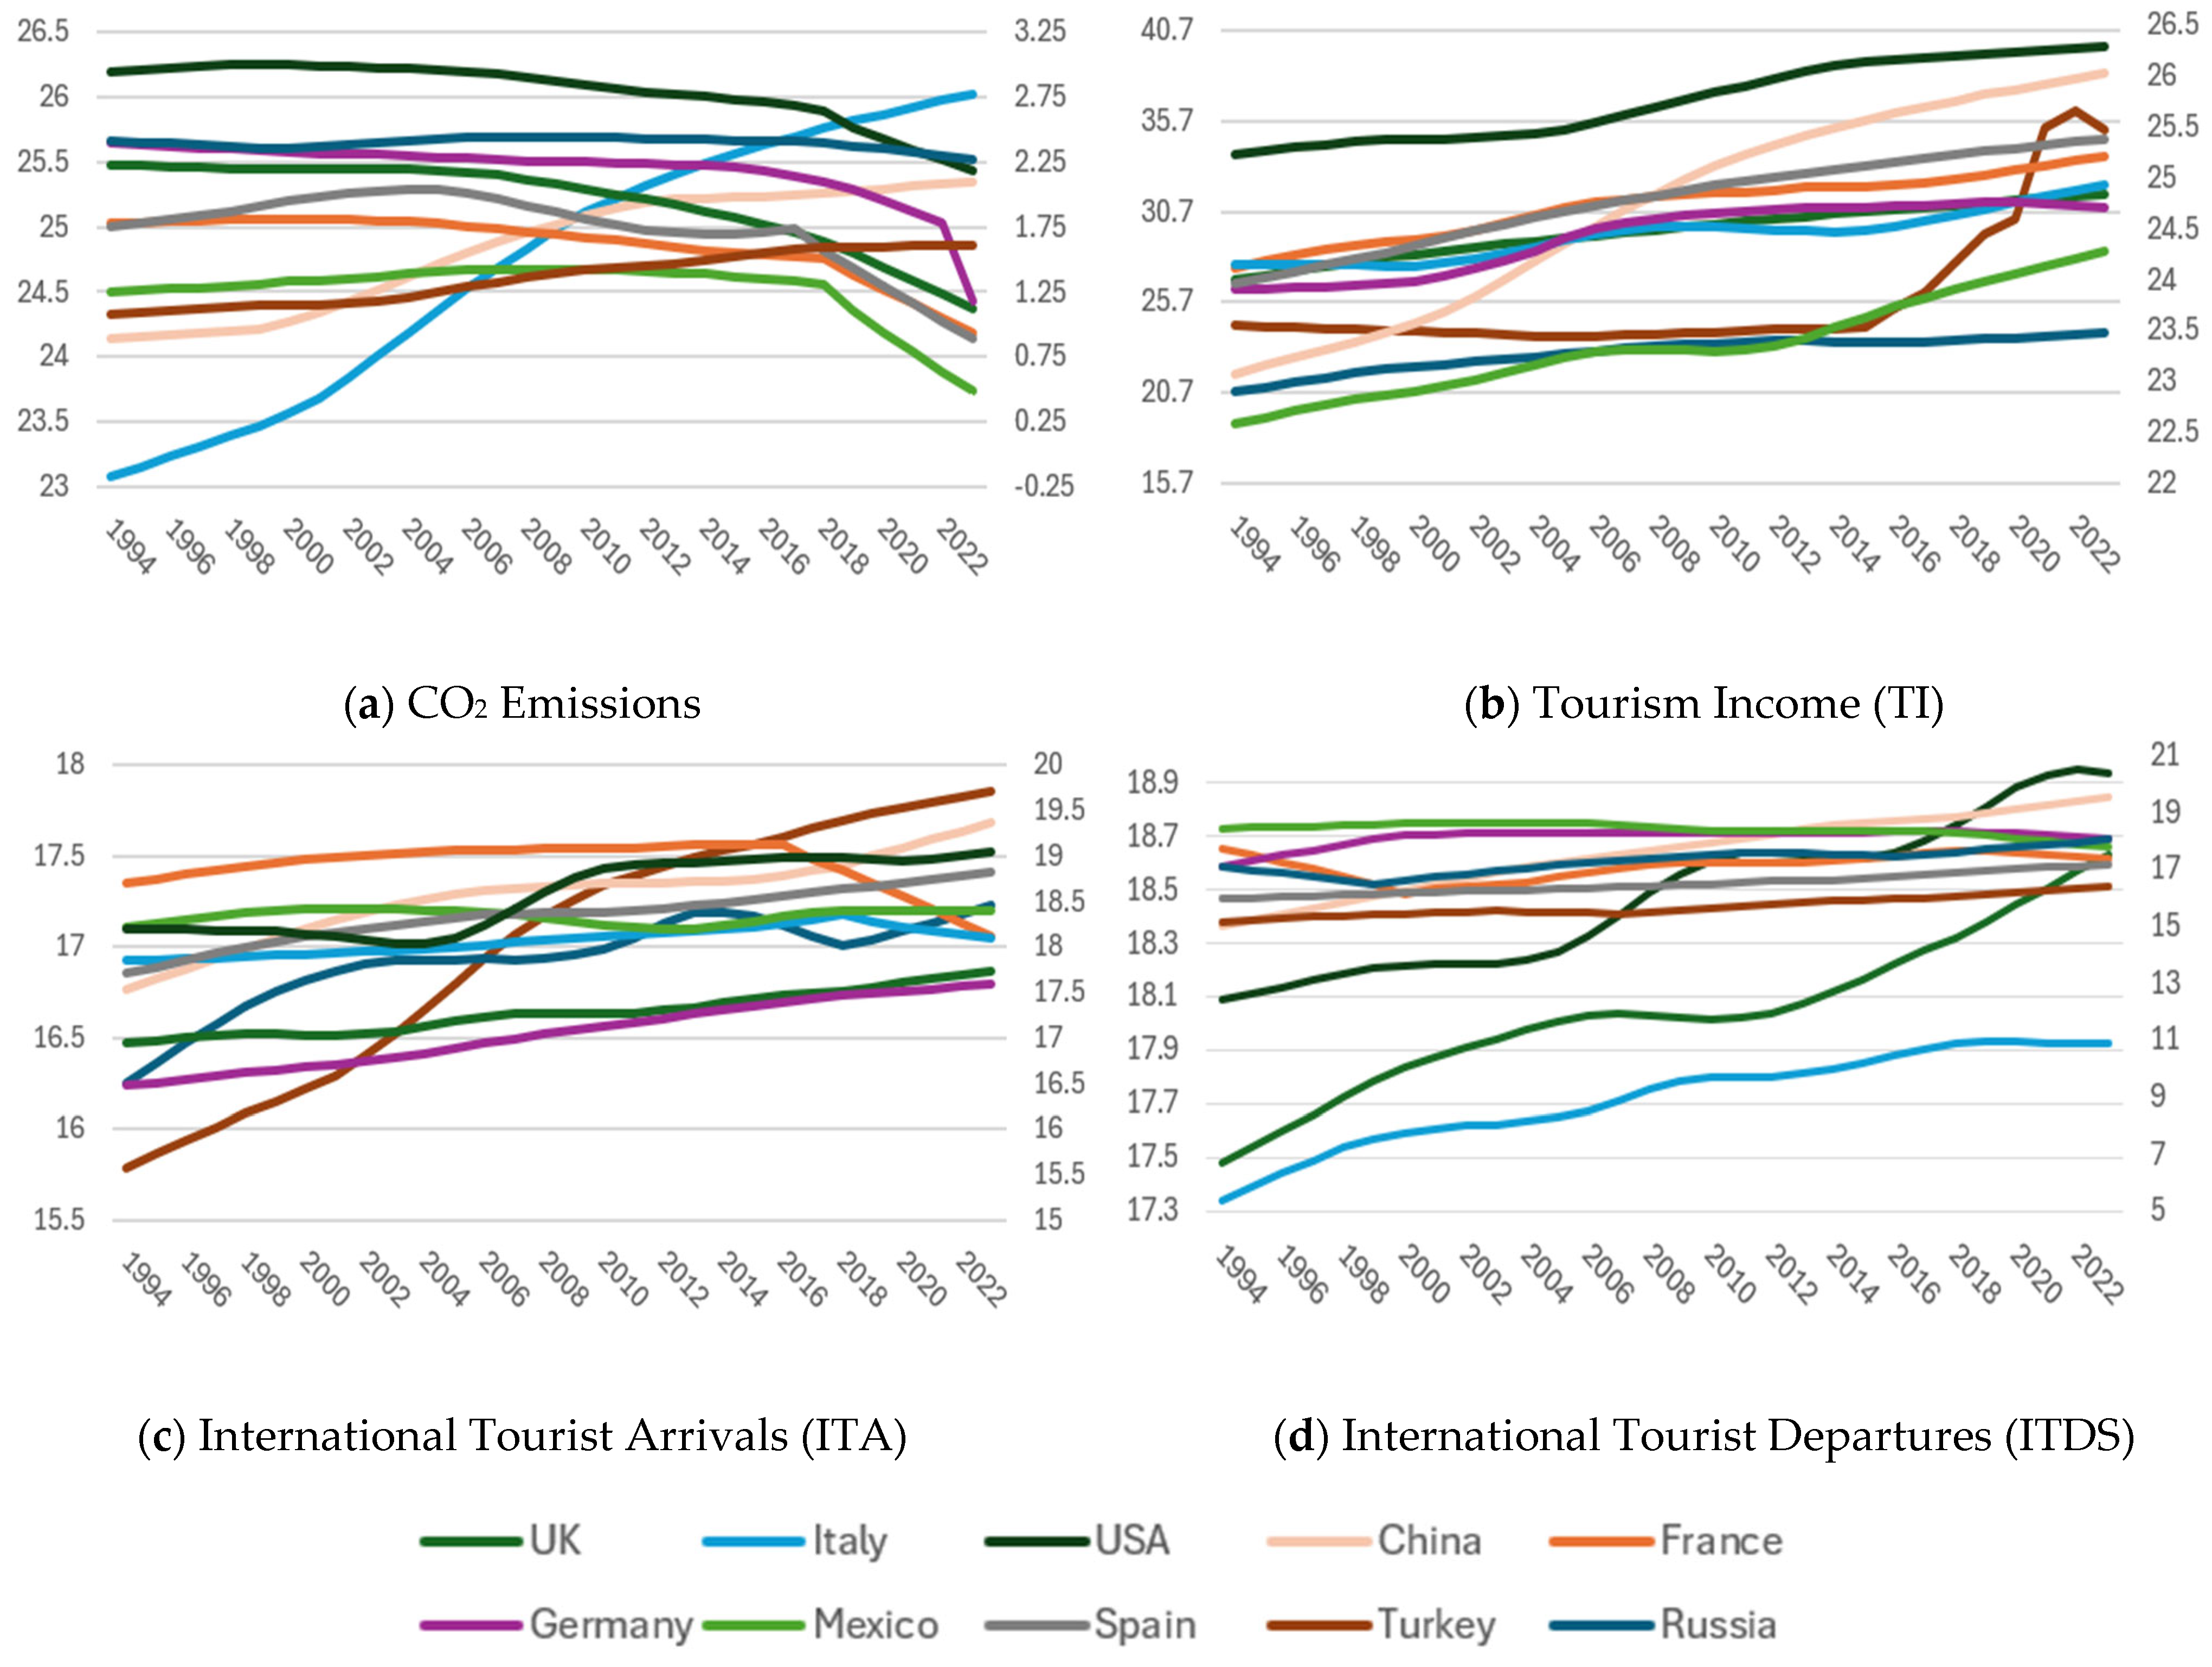
Figure 1 depicts the recent trends in CO
2 emissions and tourism-related variables.
Trends in tourism income (TI), carbon emissions (CO
2), international tourist departures (ITDS), and international tourism arrivals (ITA) can be found in
Figure 1. TI demonstrates rising trends in most of the countries, while ITA remains relatively steady and consistent. CO
2 emissions continuously decline, while ITDS is continually rising. This contrast highlights emerging questions about the evolving nature of tourism’s environmental impact. The correlation between tourism income and ITA implies that a rise in the tourism industry derives extra income, and lower CO
2 emission indicates specific assistance streams in the tourism industry have improved sustainability. Activities related to tourism, such as transportation, accommodation, air travel, and boating, share expected results. Tourists also use private vehicles, the primary source of global air pollution and greenhouse gas (GHG) emissions [
25]. Globally, air transportation describes a significant level of these accompanying increases in CO
2 emissions and atmospheric pollution. In addition, environmental degradation is impaired by unsustainable economic growth that relies heavily on non-renewable energy sources [
26].
International tourism (ITOUR) is likewise affected by energy prices (EPS) because the higher costs of the essential carrier, oil, cause drops in potential profits from this sector. Increases in energy prices cause a tourism change directly via increasing production costs and transport tickets [
27]. This study also examines how international tourism (ITOUR) and EG influence CO
2 emissions. Furthermore, we hope to see how TOPE and FDI inflows impact economic growth against the cost of these from increased CO
2 emissions, in the top 10 largest countries (China, France, Italy, the United Kingdom, Mexico, Germany, Turkey, Spain, the United States, and Russia) by international visitor spending with a robust presence of a tourism-driven economy. The selection of countries is based on their dual significance as top global tourist destinations and major contributors to CO
2 emissions. As argued by Hussain et al. [
28], the environmental burden is disproportionately higher in popular tourist destinations; hence, focusing on these countries allows a more accurate assessment of tourism-induced environmental impacts. The temporal scope (1994–2023) captures critical structural changes in global tourism, including post-Cold War liberalization and the rise of sustainability agendas, further justifying the selection.
Given tourism’s significant role in economic development and environmental degradation, this study fills a crucial gap by exploring the complex relationships between tourism and CO
2 emissions. The novelty of this research lies in its comprehensive analysis of how international tourism, energy consumption, and economic growth intersect to affect environmental sustainability. The study goes beyond traditional analyses by incorporating Tourism-Led Growth (TLG), which asserts that tourism stimulates economic growth [
29,
30], and Growth-Led Tourism (GLT), which states that tourism promotes economic growth [
31], hypotheses, considering how tourism income, GDP, energy prices, and foreign direct investment influence environmental outcomes.
This research is significant because it offers a unique perspective on how economies driven by tourism can balance economic growth with environmental sustainability. Focusing on the top 10 tourism destinations, this study aims to provide valuable insights for policymakers seeking to align economic development with sustainable practices. Understanding these dynamics is critical for shaping policies that promote sustainable tourism, reduce CO2 emissions, and contribute to achieving sustainable development goals (SDGs). This study contributes to the literature by abstracting and developing the tourism development index (TDI), which includes tourism income and international tourist arrivals and departures, to assess tourism’s economic and environmental effects. The research offers insights to policymakers to encourage sustainable tourism practices by investigating the connections between tourism expansion, energy requirements, and CO2 emissions. The study delivers vital evidence regarding relationships between tourism, GDP, and CO2, enabling policymakers to create sustainable tourism policies for developing economies while supporting global sustainability aims. Although numerous studies have worked out the influence of tourism on economic growth and CO2 emissions, there is a shortage of studies looking into the interconnected roles of energy prices, foreign debt investments, and energy consumption.
This study tends to focus on economic and environmental outcomes hand in hand, neglecting a holistic view. This study contributes by providing an integrated approach to tourism, economic growth, energy dynamics, and CO2 emissions in leading global tourism economies. By using the tourism development index (TDI), it provides a new tool for evaluating how the economy and the environment are affected. The findings provide key knowledge to inform policymakers in fostering sustainable tourism practices that align with the world-wide sustainability objectives.
Hence, this study intends to explore the bidirectional relationships between tourism development (TDI), economic growth (GDP), and CO2 emissions, in the top 10 tourist destinations. Secondly, it aims to evaluate the impacts of trade openness (TOPE), foreign direct investment (FDI), energy prices (EPS), and population density (POPD) on these dynamics, analyzing how these factors influence sustainable tourism development and environmental outcomes in the top global tourist destinations. Lastly, the research aims to add value to policy discussions about achieving SDG 9 (Industry, Innovation, and Infrastructure) and SDG 13 (Climate Action) by providing knowledge about green tourism strategies for global sustainability goals.
The rest of the study is organized as follows:
Section 2 thoroughly reviews the existing literature.
Section 3 delineates the theoretical framework.
Section 4 consists of a data description and research methodology.
Section 5 evaluates the empirical results and their ramifications for policy formulation. Ultimately,
Section 6 articulates concluding insights and policy propositions specifically adapted to address the distinctive contexts of the selected countries.
2. Review of Literature
Recent empirical studies have extensively explored the intricate relationships among carbon dioxide (CO
2) emissions, economic growth, and tourism, emphasizing the critical role of complementary factors such as energy consumption, trade liberalization, foreign direct investment (FDI), population density, and energy pricing [
28,
32]. These investigations consistently demonstrate that while tourism stimulates economic activity, it also poses significant environmental challenges through elevated energy demand and emissions.
Awan, Hussain, Zafar, and Bajwa [
32] provided novel insights by distinguishing between leisure tourism (LT) and business tourism (BT) in their study of 21 OECD and non-OECD countries. Their findings show that LT significantly increases CO
2 intensity, more so than BT, due to its greater environmental footprint. Through mediation analysis, they established that tourism-based economic expansion serves as a significant channel through which LT impacts CO
2 intensity. Following that, Hussain, Li, Sattar and Ilyas [
28] took this discussion further and investigated the dynamic relationship between tourism, corruption, and CO
2 emissions in 59 Belt and Road Initiative (BRI) countries from 2002 to 2020 by using DOLS and FMOLS. They found that higher levels of corruption and greater tourist arrivals each lead to more long-term environmental degradation.
Another thematic cluster emphasizes tourism’s energy intensity and its economic–environmental duality. Mou [
33] conducted a deep analysis of the interactions among tourism, energy consumption, and CO
2 emissions within the top ten nations heavily reliant on tourism. Their findings indicate that increasing tourism activities stimulate economic growth, as measured by gross domestic product (GDP), while concurrently intensifying energy consumption and emissions. The research illustrated that both inbound and outbound tourist movements significantly contribute to CO
2 emissions due to heightened energy usage. This suggests that initiatives to enhance energy efficiency and reduce energy expenditure could alleviate the burden on our ecological systems. Nonthapot et al. [
34] investigated ASEAN nations to reveal that energy usage acts as a mediator between tourism income and CO
2 emissions, and GDP and FDI levels increase these emissions. The authors recommend implementing environmentally friendly governance systems to reduce environmental impacts from tourism.
Energy demand also emerges as a key determinant of tourism’s ecological impact. Guo et al. [
35] focused their research on the dynamic interrelationships among tourism revenue, energy demand, CO
2 emissions, and economic growth within OECD member countries. By employing a Vector Error Correction Model (VECM), their analysis revealed that international tourist arrivals are a significant driver of energy demand, especially in densely populated countries. They also determined that energy pricing is a critical determinant influencing energy consumption and CO
2 emissions. The study proposed that recalibrating energy prices and enhancing the adoption of renewable energy could more effectively mitigate the ecological impacts associated with the expansion of tourism. Pal et al. [
36] examined the moderating influence of renewable energy on the environmental consequences of tourism in G20 nations. Their findings suggested that while increased tourism revenue and growing tourist traffic elevate energy demand and CO
2 emissions, renewable energy has the potential to mitigate these adverse effects. The research underscored the vital role of trade openness and FDI inflows in fostering technological advancements and infrastructure improvements necessary for transitioning to renewable energy within the tourism sector. Other scholars have tested theoretical frameworks such as the Environmental Kuznets Curve (EKC) in tourism-driven economies. For example, Deb et al. [
37] assessed the Environmental Kuznets Curve (EKC) hypothesis in the context of economies driven by tourism, establishing correlations among economic progress, tourism expansion, and CO
2 emissions. Their results indicated that as tourism revenue and international tourist departures rise, CO
2 emissions increase due to heightened energy demand. Nevertheless, once the GDP attains a specific threshold, energy demand stabilizes, resulting in reduced emissions, thereby corroborating the EKC hypothesis. They emphasized the importance of energy pricing and population density in modulating these dynamics, proposing that regulations centered on energy efficiency and green investments could enhance the sustainable development of tourism.
Irfan et al. [
38] employed a dynamic panel data model to investigate the complex interactions among tourism, energy consumption, and the pursuit of green growth. Their results elucidated that, although the revenue generated from tourism facilitates GDP growth, it concurrently amplifies CO
2 emissions through increased energy consumption, particularly in densely populated urban areas. They advocated for improving trade accessibility and international investment in environmentally sustainable innovations and renewable energy as strategies to alleviate the detrimental ecological impacts of tourism, thus fostering long-term sustainable development. A methodological advance in the literature involves stratifying countries by economic status to capture heterogeneous effects. For example, Bhuiyan et al. [
39] utilized a panel quantile regression methodology to investigate the multifaceted effects of tourism on sustainable development across different levels of economic affluence. They revealed that the impact of tourism revenue, energy consumption, and CO
2 emissions on sustainable development depends on a country’s financial standing. Nations characterized by a strong GDP and advanced technological capabilities exhibit greater proficiency in addressing the environmental implications of tourism through improved energy efficiency and the incorporation of cleaner energy alternatives. Furthermore, they observed that factors such as population density and energy pricing significantly influence energy demand and emissions in economies driven by tourism.
Zhao et al. [
40] embarked on a comparative analysis to evaluate energy efficiency and environmental sustainability within the tourism sectors of developing economies. They underscored that while tourism positively enhances GDP, it concurrently exacerbates energy consumption and CO
2 emissions, particularly in locales with relatively low energy costs. Their investigation advocated for adopting energy-efficient technologies and formulating policies that encourage the use of renewable energy to mitigate emissions and facilitate sustainable economic growth. Deb, Das, Voumik, Nafi, Rashid, and Esquivias [
37] examined the consequences of tourism, carbon emissions, and the implementation of renewable energy in economically advanced nations. They revealed that despite the advantageous impact of the global influx of tourists on GDP growth, there is a concomitant increase in CO
2 emissions. Nonetheless, incorporating renewable energy sources and accepting trade liberalization may alleviate these adverse effects by reducing the reliance on fossil fuels. They advocated for policies that incentivize foreign direct investment in green energy projects and foster international collaboration to improve energy efficiency in the tourism sector.
Pablo-Romero et al. [
41] investigated the intricate relationships among tourism, energy, and the environment in premier tourist destinations. They highlighted the influence of tourism revenue and the influx of international tourists on GDP, energy demand, and CO
2 emissions. They argued that integrated policies governing energy pricing, promoting foreign direct investment in renewable energy, and enhancing trade openness are crucial for the sustainable development of tourism while minimizing ecological damage.
The impact of tourism on GDP is generally beneficial, but the link remains complex and not linear, and, moreover, is highly diversified across countries and development levels. For illustration, Razzaq et al. [
42] propose that international tourism unevenly stimulates economic growth, with the developed countries obtaining larger positive influences—backing the tourism-facilitated-growth hypothesis. Complementing this, Meșter et al. [
43] studied EU countries and found a short-run relationship of GDP per capita with tourism for just a few countries of the Union. By modelling a composite tourism development index with Principal Component Analysis and applying it to the segment, a long-run feedback relationship between tourism and growth via the Dumitrescu–Hurlin causality approach is indicated. However, this tourism-related growth is exposed to external factors, particularly oil prices. High energy costs can affect the tourist performance of a location by raising transport and operational expenses. The European Commission has shown with the JRC-GEM-E3 general equilibrium model that energy price shocks reduce demand for tourism and induce GDP reductions in hit regions of the EU [
44]. Nevertheless, Pablo-Romero, Sánchez-Braza, and García-Soto [
41] studied the relationship using the time series data from the 15 most frequented countries (2000–2019) and found that tourist arrivals are positively related to energy consumption—meaning that when tourism boosts energy consumption and potentially increases GDP, it must contend with ecological durability concerns.
Trade liberalization and FDI have also been identified as catalysts for sustainable tourism. For instance, Habibi and Ahmadzadeh [
45] observed the existence of a long-run relationship between trade openness, tourism, and per capita national income in Malaysia, which indicates that a trade liberalization policy does help in attracting tourists and stimulating economic activity. This point is further backed by Okafor et al. [
46], who point to the world-wide trend that openness to trade fosters international tourism, and this tourism helps promote economic growth. Foreign direct investment (FDI) is also an essential factor to improve tourism infrastructure and medium- to long-term economic growth. Sokhanvar and Jenkins [
47], focusing on Spain, argued that though tourism increases GDP, the value of return in FDI to GDP is characterized by the quality of it—poor investment impedes the growth potential. Also, Hanvoravongchai and Paweenawat [
48] demonstrated that inward FDI and trade openness significantly affect tourism development; FDI is directly boosting the tourism infrastructure in emerging Asian economies. Tiwari et al. [
49] explores how Internet of Things (IoT) technology can manage sustainable energy systems in Indian tourist attractions. The research underlines the necessity of using technology-based energy management systems for implementing responsible and sustainable tourism development.
Finally, population density is a two-edged dimension in the tourism economies. While population areas with high levels of density, particularly urban tourism sites, might help to foster GDP increases via an active workforce and market consumption, unmanaged sheer density might generate increased congestion, air pollution, and exploitation of natural resources. Gulistan et al. [
50] explained that urban planning is a key—that if tourism-dependent regions are overpopulated, then economic and environmental stability is eroded.
While previous studies have examined the tourism–emissions–growth nexus, they often overlook the dynamic interplay among these variables and the structural macroeconomic drivers that shape this relationship. A little attention has been given to investigating how energy prices, trade openness, foreign direct investment, and population density influence this triad. Most of the available research depends on single-equation analysis and unidirectional causality tests, which restrict the analysis of reciprocal relationships. The research investigates this gap by applying three integrated equations to data from the ten most popular international tourist locations from 1994 to 2023, and presents an integrated perspective of how external factors affect tourism development and economic growth, together with carbon emission levels. A detailed summary of the literature review is shown in
Table 1.
3. Theoretical Framework
The present study is inspired by the empirical research conducted by Dogan and Aslan [
51], which explored the complex interrelations among economic growth (EG) and environmental degradation through the framework of the Environmental Kuznets Curve (EKC) hypothesis. The Environmental Kuznets Curve (EKC) posits that while income levels increase, environmental damage goes up first, but then decreases once the economy reaches a particular level of income [
52]. Hence, although tourism initially causes environmental damage, it could later help the country to switch to cleaner methods and curb pollution. Similarly, comparable associations were examined in studies by Saboori and Sulaiman [
53] focusing on Malaysia, Arouri et al. [
54] in the context of the MENA region, Bölük and Mert [
55] across various European countries, and Apergis and Payne [
56] regarding nations in Central America. These investigations affirmed the validity of the EKC hypothesis, presenting results akin to those reported by Lee and Brahmasrene [
19] across 27 EU countries, Gökmenoğlu and Taspinar [
57] about Turkey, and Pao and Tsai [
58] concerning BRIC countries. These scholarly endeavors suggest that the influx of foreign direct investment (FDI) is a crucial determinant in the augmentation of CO
2 emissions, thus substantiating the “pollution haven hypothesis”.
The progress in tourism development (TDI) may influence GDP and CO
2 emissions. According to the tourism-led growth hypothesis, first, greater numbers of tourists generate higher incomes and create jobs [
42]. But more vehicles, more hotels, and adjustments to infrastructure also cause CO
2 emissions. As a result, TDI enhances GDP but degrades the quality of the environment. Trade openness (TOPE) is hypothesized to decrease emissions by making access to energy-efficient technologies and cleaner goods possible [
59]. On the other hand, it might increase emissions if countries provide a pollution haven for pollution-intensive activities, contrary to both hypotheses [
60]. The net effect depends on the institutional and regulatory quality.
FDI may have a positive impact on GDP through capital inflow and technology transfer. If FDI shifts new producers of pollution into developing countries, it can be environmentally dirty, but if it transfers green technology in, it can be environmentally clean. Energy prices (EPS) affect economic and environmental dynamics [
60]. Also, higher energy prices can suppress tourism activity, but this also reduces emissions in terms of lower energy consumption. Conversely, low-priced energy could attract tourism but might worsen environmental degradation through prompting the use of fossil fuels [
61]. Population density (POPD) may cause pollution emissions to increase due to higher consumption of resources and increased transportation. At the same time, having a higher population density may make public transport more effective and limit emissions per person if it is managed responsibly [
62].
The current research integrates the dimensions of population growth (PG) within its analytical framework, as advocated by Yeh and Liao [
63], who identified it as a pivotal driver of environmental degradation. Drawing from the initial concepts of the Kuznets curve theory, this study intricately connects ecological degradation, international tourism (ITOUR), foreign direct investment (FDI) inflows, and trade openness (TOPE) concerning individual income and CO
2 emissions. It investigates three sides of tourism: international tourist arrivals (ITAS), international tourist departures (ITDS), and tourism income (TI), which are analyzed with the tourism development index (TDI) to evaluate their collective impact on the environment. Hence, following Apergis and Payne [
56], Balli et al. [
64], and Yeh and Liao [
63], the model is delineated as follows:
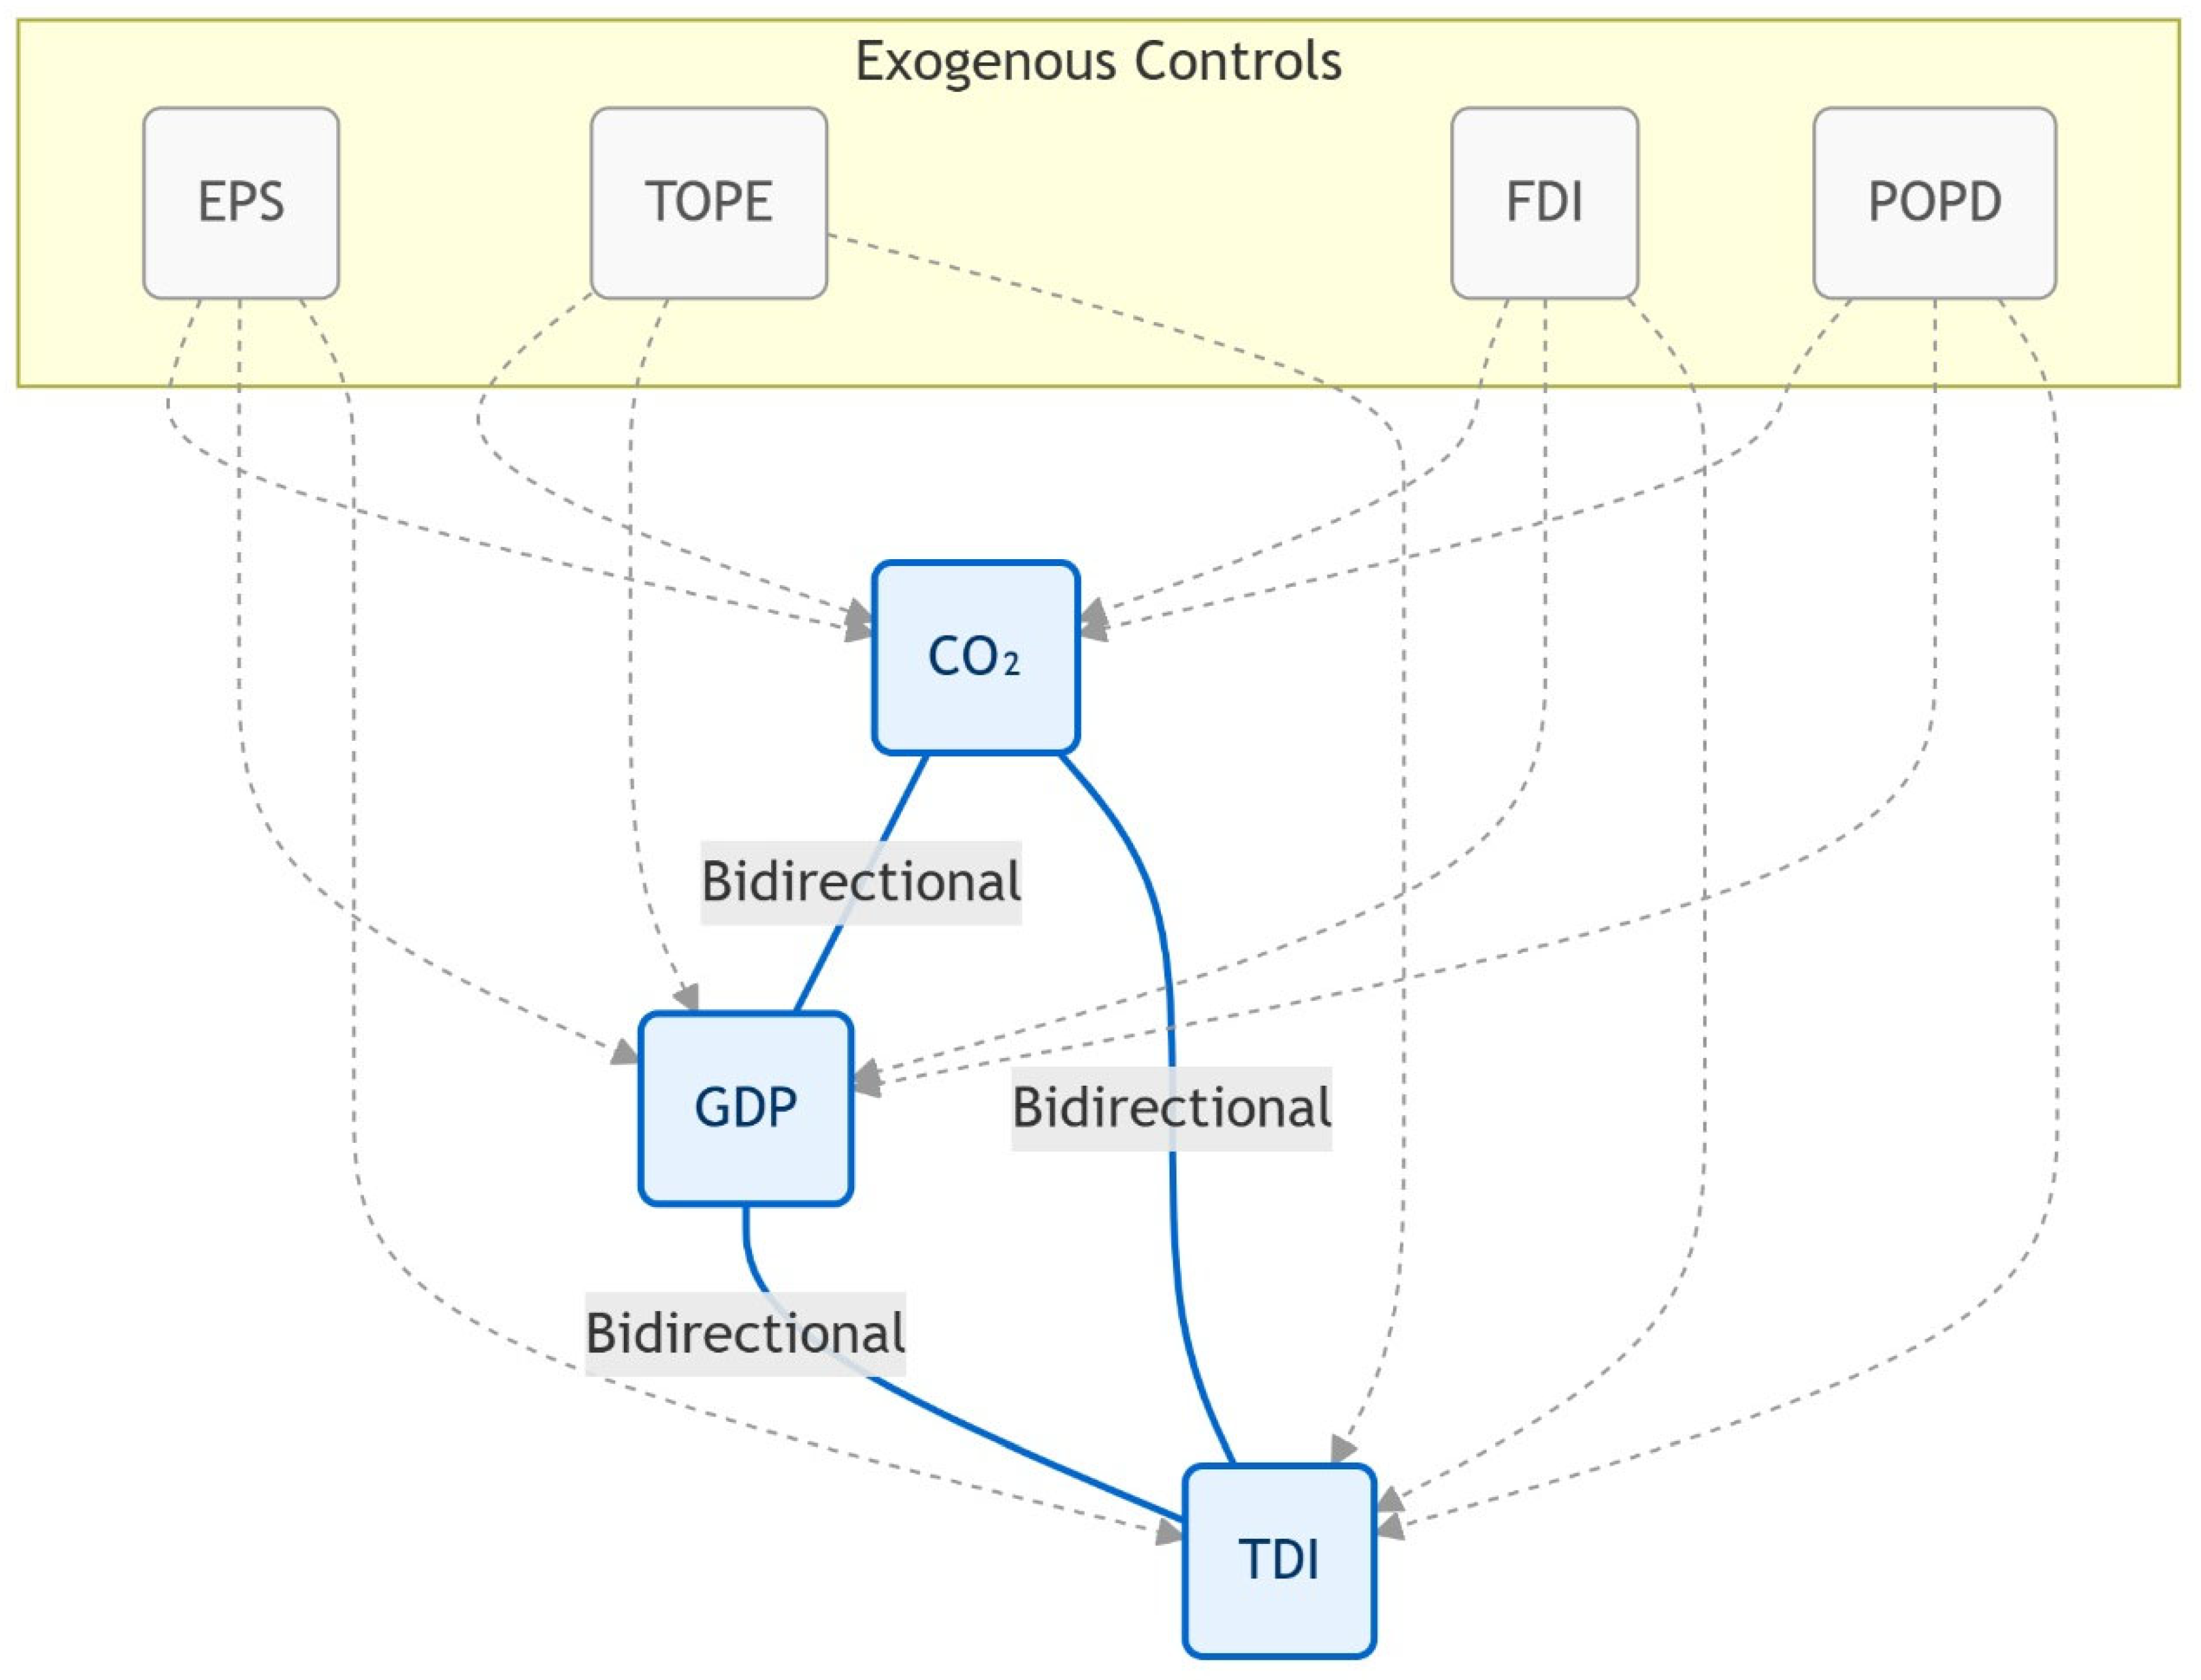
CO
2 represents carbon emissions, GDP denotes gross domestic product, EPS signifies energy prices, TOPE reflects trade openness, FDI indicates foreign direct investment inflows, and POPD pertains to population density, as mentioned in
Figure 2.
The relationship between tourism and economic development (the TLG hypothesis) has been examined in numerous scholarly works. Samimi et al. [
65] concentrated on developing countries while Tang and Abosedra [
66] analyzing Lebanon. Akinboade and Braimoh [
67] and Surugiu and Surugiu [
68] focused on South Africa and Romania, respectively. Khoshnevis Yazdi et al. [
69] investigated Iran. These studies revealed significant associations among these variables. The present study integrates CO
2, TOPE, FDI inflows, EPS, and POPD within the TLG framework, as substantiated by Al-Mulali et al. [
70] and Lean et al. [
71] concerning the trade and growth relationship, and Akinboade and Braimoh [
67] along with Ozturk [
72] regarding the energy and growth relationship in conjunction with Lee and Brahmasrene [
19], related to the FDI and growth relationship. The TLG model in this analysis is articulated in Equation (2) and
Figure 2:
where TDI denotes the tourism development index.
Furthermore, an extensive array of studies, including those conducted by Ozturk [
72], Lee and Brahmasrene [
19], and Payne and Mervar [
73], have elucidated the notion that economic growth (EG) significantly stimulates international tourism (ITOUR). This scholarly work augments the already existing body of knowledge by integrating energy prices (EPS), foreign direct investment (FDI) inflows, and trade openness (TOPE) into the GLT paradigm, expressed as in Equation (3) and
Figure 2:
The investigation explores the complex interrelations among international tourism (TDI), energy prices (EPS), CO2 emissions, trade (TOPE), foreign direct investment (FDI), population density (POPD), and economic growth (GDP) within a panel comprising the foremost 10 nations centered around tourism.
Drawing on the theoretical framework outlined above, this study develops three models, 1–3, to delve more deeply into the analysis:
where i represents different countries (with
i = 1, 2, 3, …, 10), t denotes the period from 1994 to 2023, and
€ represents the error term.
The natural logarithms of variables have been incorporated to enable elasticity interpretation while addressing non-linear relationships. The specified log-linearized models appear as follows:
Figure 2 indicates that GDP, CO
2 emissions, and TDI (tourism development index) are interrelated bidirectionally; they influence one another. Exogeneous factors such as EPS, TOPE, FDI, and POPD influence relationships through dotted pathways.
4. Data Description and Research Methodology
The present study leverages empirical insights derived from the leading ten countries that significantly influence the tourism sector, namely China, France, Italy, the United Kingdom, Mexico, Germany, Turkey, Spain, the United States, and Russia, utilizing data from the World Bank for the period spanning 1994 to 2023. This period (1994–2023) has been selected due to its critical structural changes in global tourism, like post-Cold War liberalization, the rise of mass tourism in other countries, and the global sustainability agenda from the 1990s [
74]. Furthermore, data for consistent cross-country comparisons are more reliable in this timeframe. Hussain, Li, Sattar, and Ilyas [
28] argued that the environmental burden is higher in the popular tourist destinations; hence, this specific temporal framework was selected due to the profound shifts in global tourism that have engendered sustainable advancement within these nations. Interpolation methodologies were utilized to address any deficiencies within the dataset. Variable descriptions, sources, and expected signs are given in
Table 2.
The connection of carbon dioxide emissions (CO
2) with its independent variables is complex, and energy demand (ED) is predicted to be positive because its energy consumption increases directly contribute to CO
2 emissions [
35]. Trade openness (TOPE) and foreign direct investment (FDI) can have both positive and negative consequences; trade and investment might help in the promotion of clean technologies or increase industrial activities, thereby scaling up emissions [
75]. For tourism development, the tourism development index (TDI) is anticipated to have a mixed impact, as tourism stimulates economic activity, but it could also enhance energy demand and emissions. Population density can increase CO
2 emissions, given urbanization and energy-intensive activities, or reduce CO
2 emissions because of the energy-efficient infrastructure [
76]. Moreover, GDP gives expected directions of independent variables that are also complex. CO
2 emissions should generally be positively linked to GDP because an increase in economic activity usually causes higher industrialization and energy consumption [
64]. TDI is expected to have a dual effect, as tourism boosts the economy, but at the same time, environmental degradation can constrain long-term sustainable growth. It is assumed that FDI and TOPE positively affect GDP since foreign investments and trade stimulate economic activity [
77]. For TDI, CO
2 emissions may have a negative effect, decreasing tourists’ motivation to visit and residents’ motivation to evacuate, since the knowledge of growing emissions would deter potential tourists from traveling due to environmental factors [
76]. It is known that GDP is expected to contribute positively to economic growth, as more prosperous economies are related to a well-functioning tourism infrastructure [
78]. Energy prices (EPS) would have a negative effect as substantial increments in energy costs could decrease jobs and activities associated with tourism [
61]. FDI and TOPE are expected to have positive effects since foreign investment and trade contribute to tourism facilities and draw international tourists [
79].
Table 3 exhibits a comprehensive array of descriptive statistics about various economic and environmental indicators derived from 300 data points. The descriptive statistics highlight considerable variations among the variables. The data suggest that CO
2 emissions vary significantly because their distribution features a mean value of 1.8797, a maximum observation of 3.0190, and a minimum observation of 0.2826. GDP values show limited changes by averaging 28.4119, yet the tourism development index experiences broad fluctuations from −1.7361 to 9.7892. The data indicate that FDI inflows and trade openness have average levels of variation because they reflect economic integration dimensions at different points. Changes may influence resource demand in population density, which ranges from 2.1652 to 5.6250. The observed energy price data show the widest distribution since their values extend from −2.2225 to 6.1967 because of changing government policies and economic conditions.
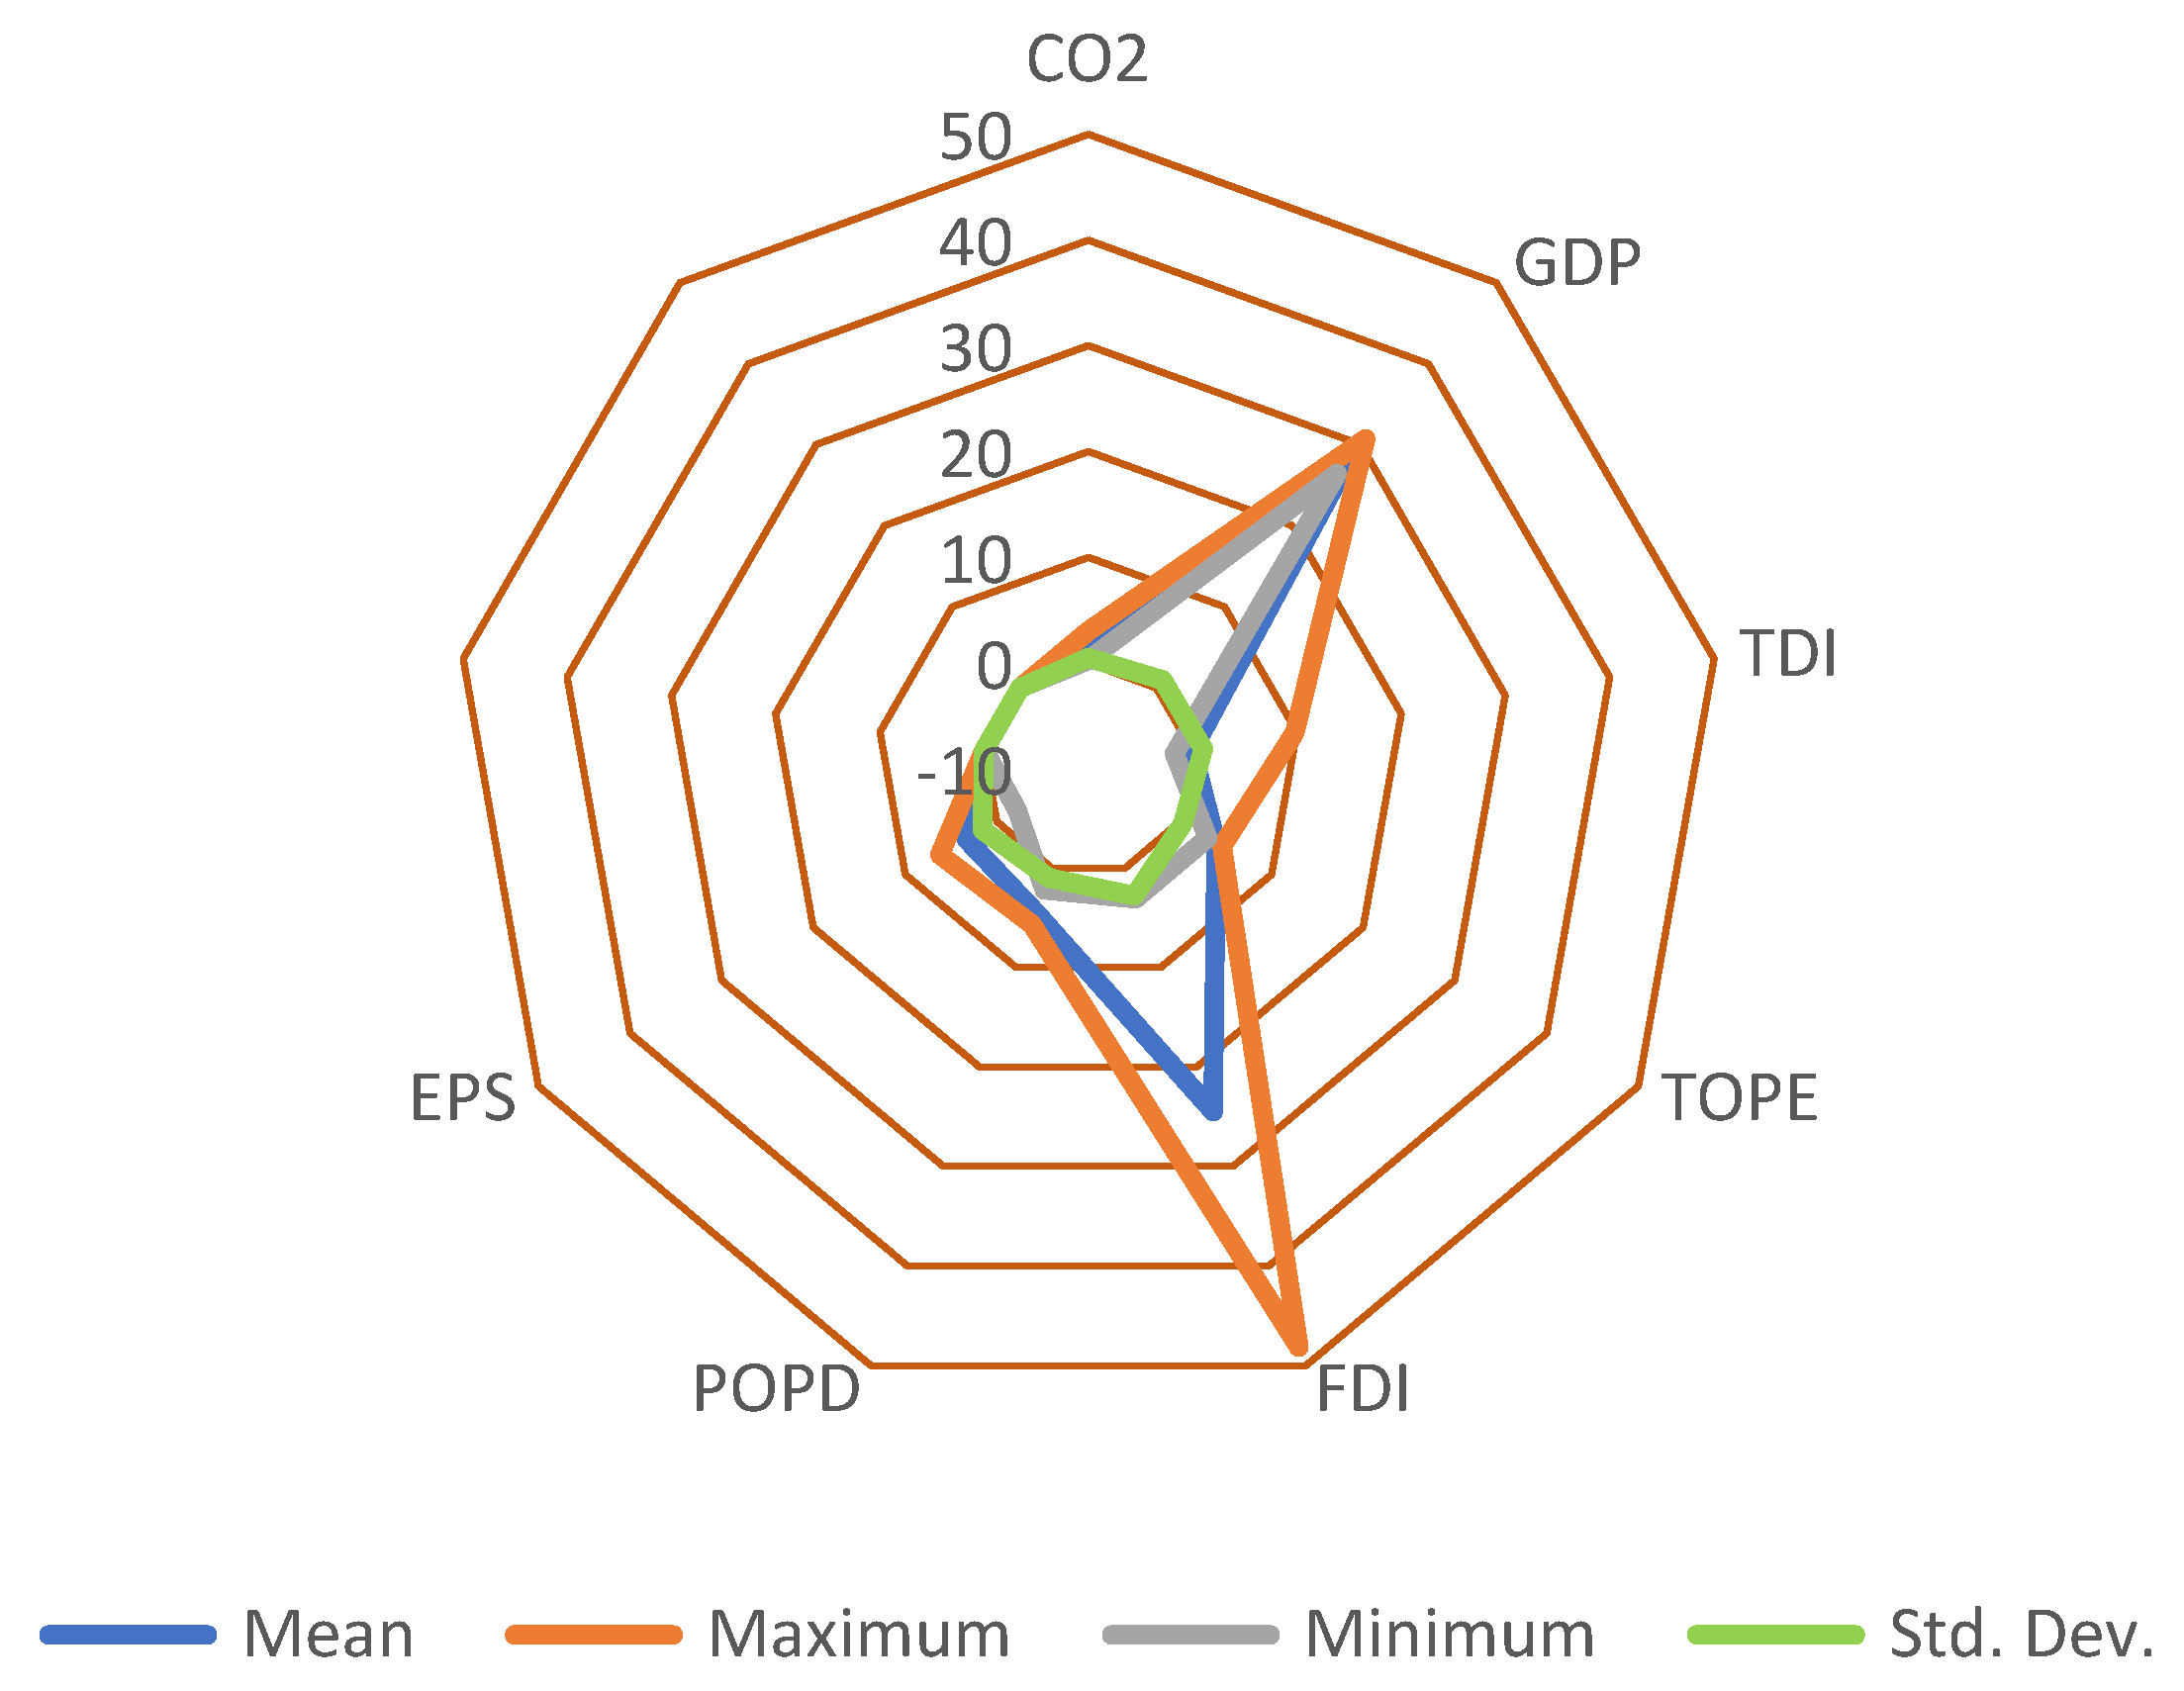
Figure 3 illustrates the intriguing variation in diverse economic and environmental indicators. The orange line shows how GDP and FDI experience dramatic variations because their maximum values stand significantly higher than other variables. The blue mean values display moderate levels across all variables, although gray minimum values stay low, especially for CO
2 emissions, tourism development, and energy prices because of significant variations between observations. The standard deviation (green line) stays small in most cases except for FDI and energy prices, where volatility occurs. The chart shows how economic performance and environmental variables vary according to observations.
Research Methodology
This study adopts a robust five-stage panel econometric framework, encompassing the following: (i) preliminary data diagnostics including scatter plot matrices, histograms, and correlation analysis; (ii) testing for cross-sectional dependence (CD) and slope heterogeneity; (iii) unit root testing for stationarity; (iv) panel cointegration analysis; and (v) long-run estimation and causal inference.
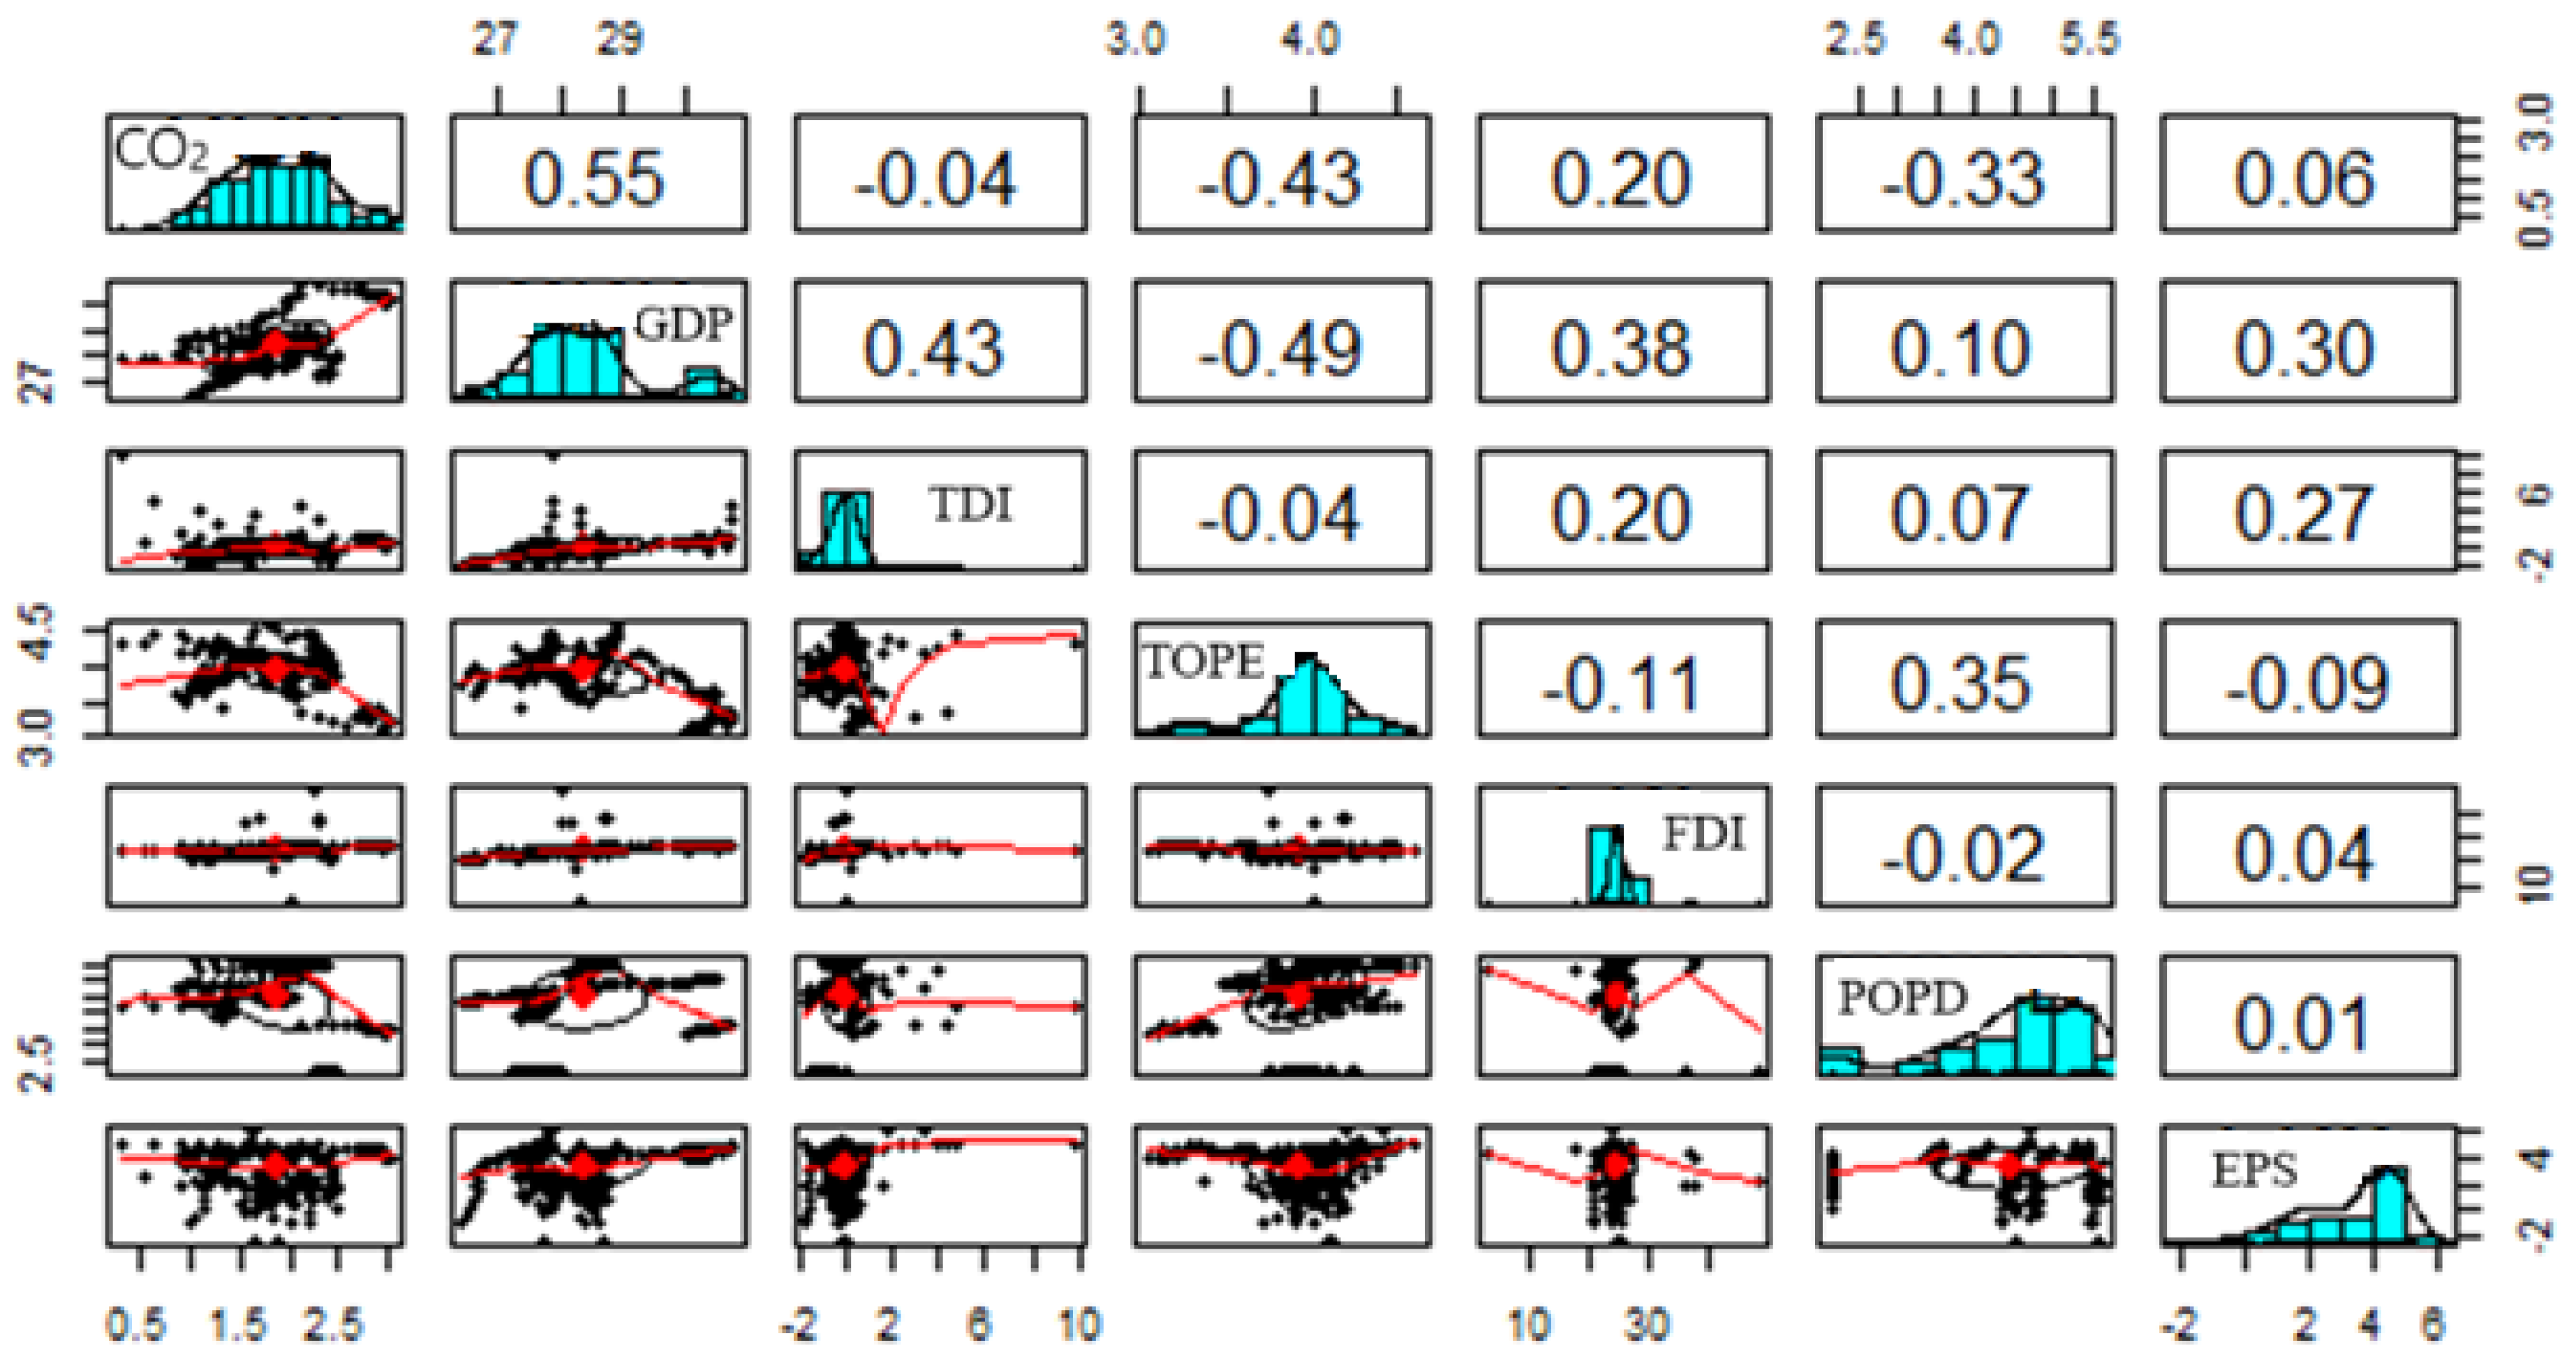
Figure 4 illustrates the scatter plot matrix, histograms, and correlation matrix of the variables. Data reveal that CO
2 emissions and GDP share a 0.55 positive correlation, and GDP demonstrates a 0.43 weak association with the tourism development index. These data reveal that tourism development has an inverse relationship with trade openness (−0.49), and negative correlations. The diagonal positions of the histograms display information regarding distribution shapes to evaluate the skewness levels of variables. The entire process of the study’s econometrics analysis is explained in
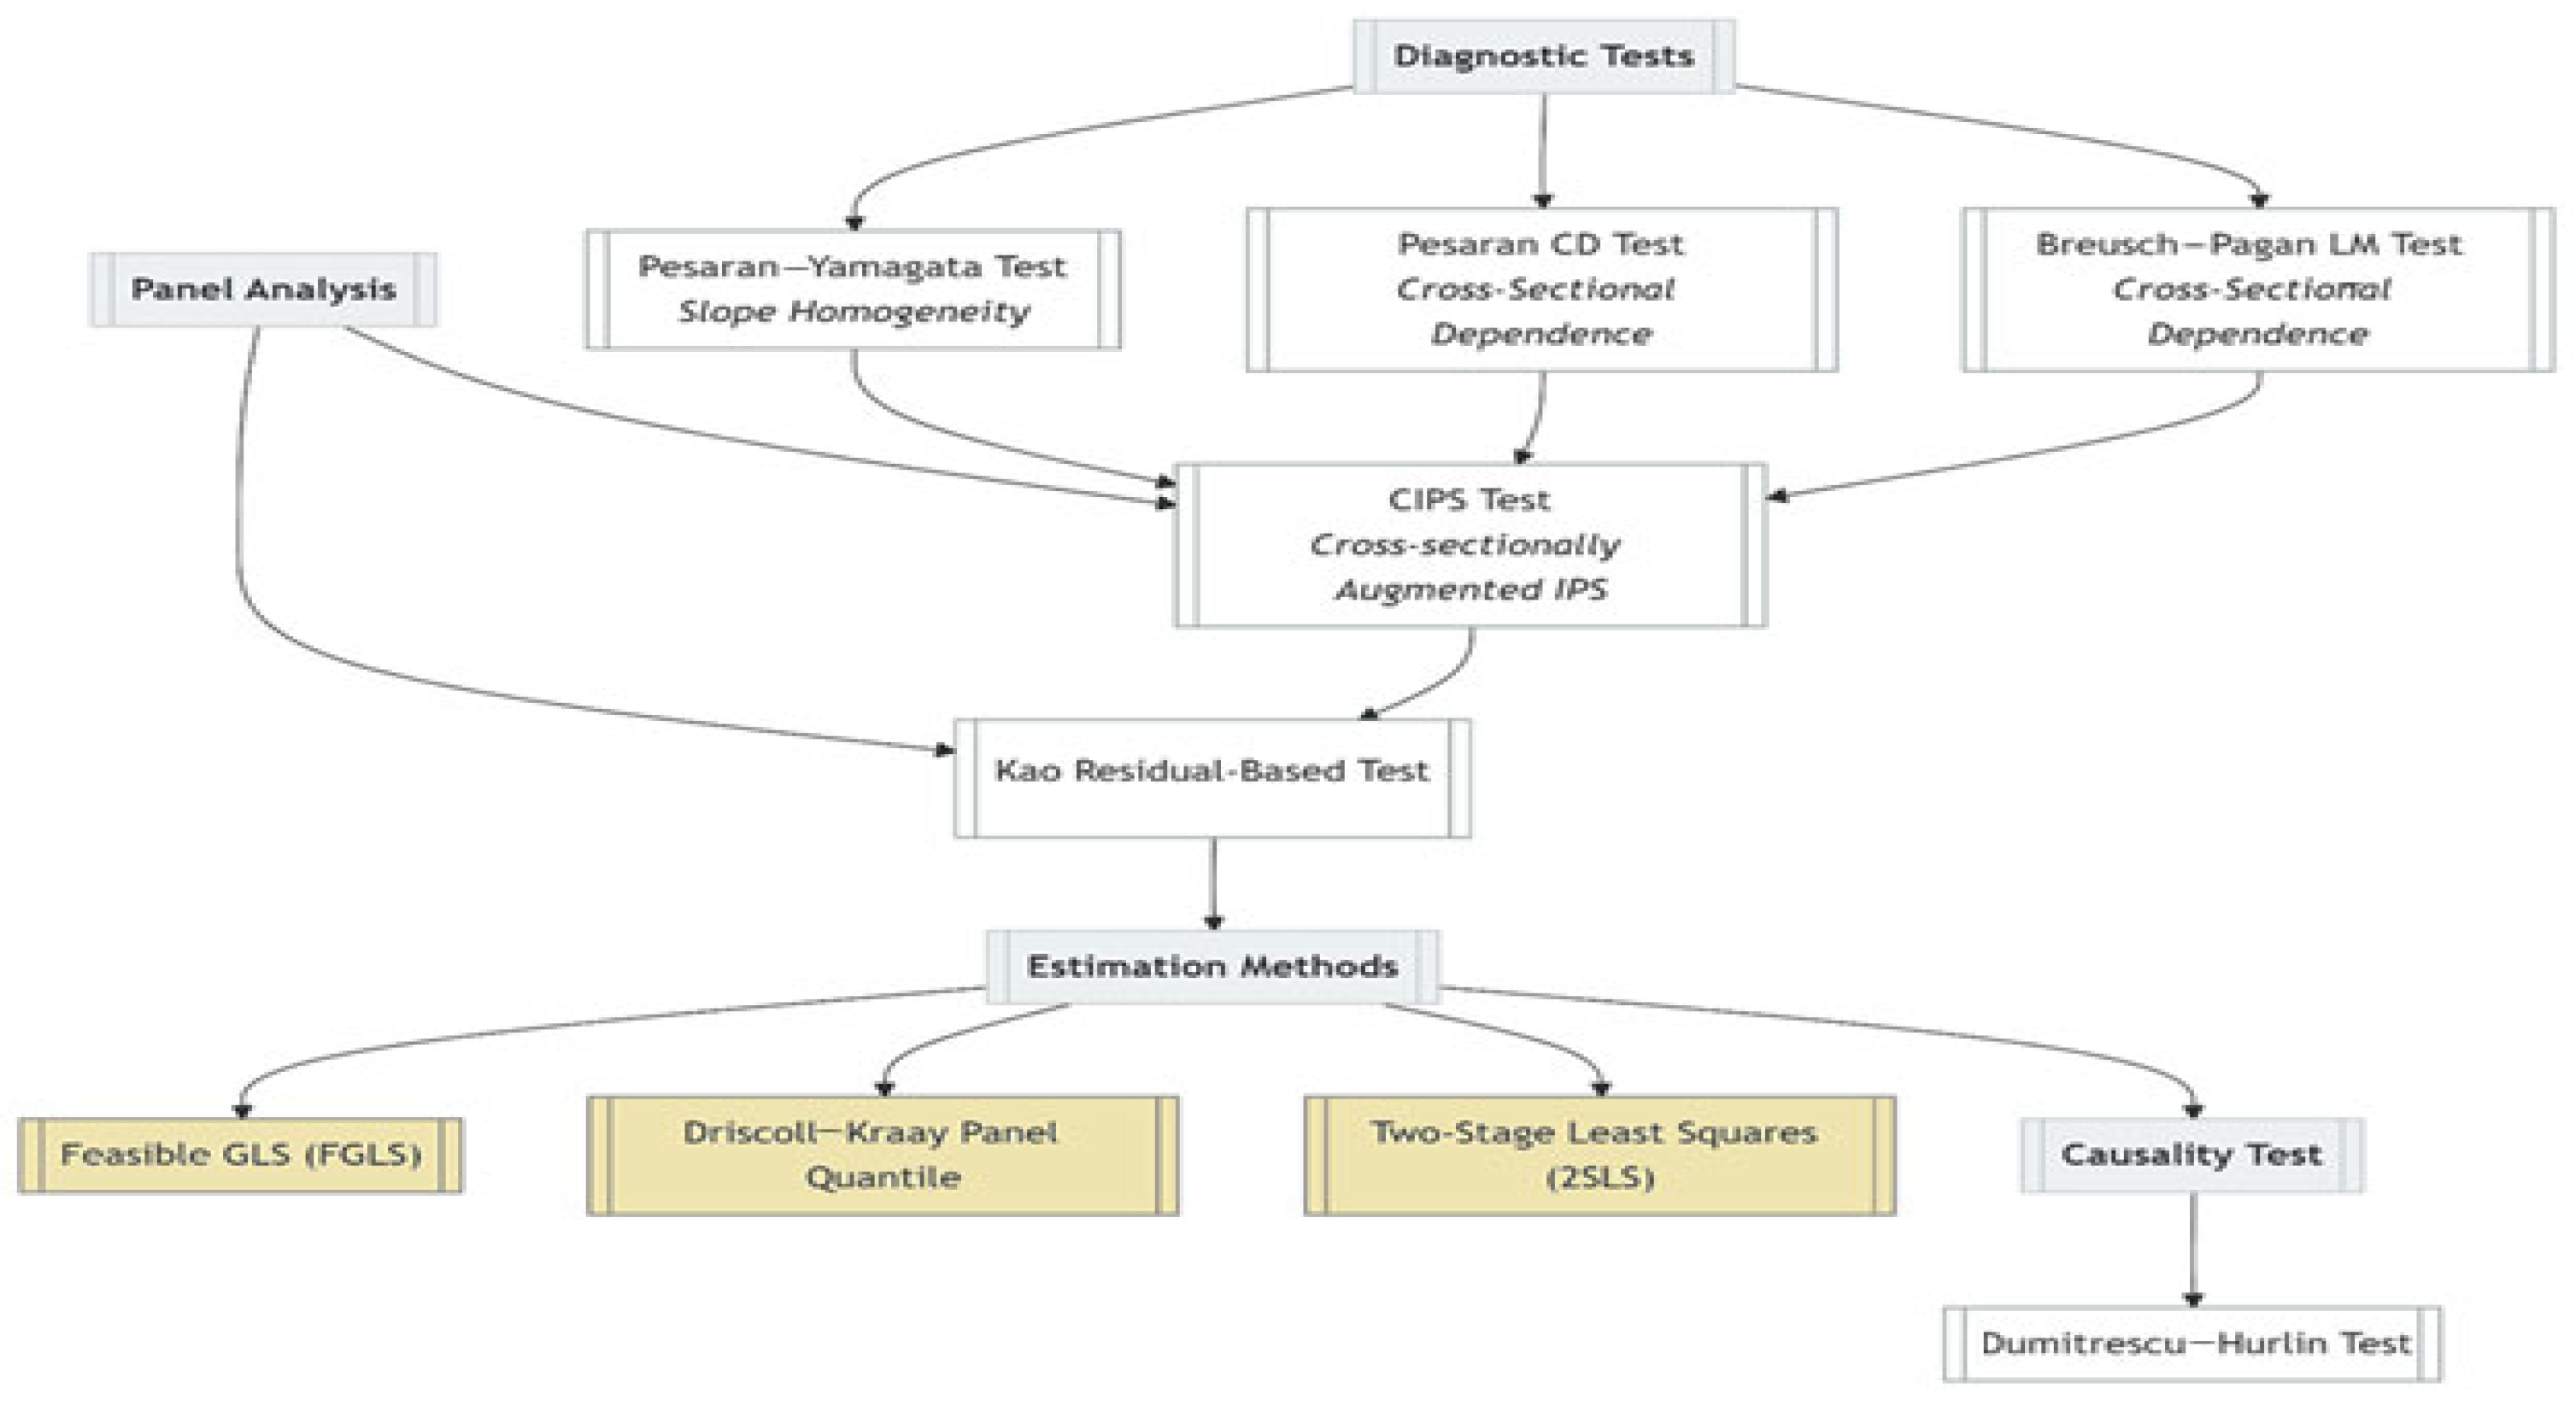
Figure 5.
The figure explains the five-step panel data methodology for econometrics, including steps for cross-sectional dependence treatment unit root testing, cointegration analysis model estimation, and causality testing. The following text explains these steps: the first step includes conducting a cross-sectional dependence (CD) test along with the slope homogeneity examination. Tests for cross-sectional dependence and slope homogeneity must occur first to understand how individual data sections (countries or firms) relate. The correlation of residual values between separate cross-sections represents cross-sectional dependence; therefore, it leads to invalid estimates when neglected. The checks for CD involve applying the Breusch–Pagan LM test and the Pesaran CD test (Equation (10)). Small panels having more time units (T) than cross-section units (
N) should use the Breusch–Pagan LM test to detect residual correlation between panel members through its statistical measure.
The term
stands for the cross-section residual correlation coefficient between positions
i and
j. For large panels with N > T, the appropriate test becomes the Pesaran CD test, which analyzes weak cross-sectional dependence through the following expression, Equation (11):
The Driscoll–Kraay approach is applicable when data exhibit cross-sectional dependence, as ordinary estimation techniques produce biased results [
80]. Slope homogeneity must be checked because panel data models require all cross-sections to use identical coefficients. The Pesaran and Yamagata (2008) [
81] test provides an indicator to determine if panel members share identical slope coefficients through Equation (12):
The next step explains the Panel Unit Root Test, which is the analysis that must test the stationarity properties of panel data once cross-sectional dependence and heterogeneity issues have been resolved. Non-stationary data affect the accuracy of regression results because they produce artificial correlations. The Cross-Sectionally Augmented IPS test obtained its framework from the Cross-Sectionally Augmented Dickey–Fuller method to investigate unit roots while incorporating cross-sectional dependence.
In the third step, the study focuses on the panel cointegration test, which should be conducted after confirming non-stationary and identical integrated variables of the parameters. The Kao residual-based test analyzes the estimated long-run equation residuals to determine whether non-stationary variable sets are cointegrated. Step four explains panel estimation; the establishment of cointegration will determine which panel estimation technique should be applied according to data characteristics. The reliable approach to panel data analysis is feasible generalized least squares (FGLS) because it handles heteroskedasticity and autocorrelation to boost efficiency. The equation for the FGLS model appears below in Equation (13):
where
accounts for heteroskedasticity.
The Driscoll–Kraay method serves when data are cross-sectionally dependent, which introduces biases into regression analysis. We resolved the issue using fixed-effects models while applying Driscoll–Kraay standard error calculations. Driscoll and Kraay [
80] established this method, which solves issues including group disparities, panel data dependencies, and serial correlation challenges. The method works appropriately with both balanced and unbalanced datasets and addresses properly handling missing variables [
82]. In situations of cross-sectional dependence, this method creates reliable standard errors. The analysis demonstrates its practical value because existing research found the method effective in comparable investigations, particularly within contexts with stationarity concerns. The novelty of the panel quantile regression (PQR) methodology is related to investigating the extent to which independent variables influence the quantiles of the dependent variable. Unlike general moments-based regression approaches such as mean regression, PQR can capture variations at different quantiles, thereby enabling a deeper exploration of relationships between variables. This method is appropriate in datasets with cross-sectional and time series variables as it can tackle challenges such as unobserved heterogeneity and non-linear effects for outliers. The general form of a PQR model can be expressed in the following Equation (14):
where
, The conditional quantile of a dependent variable is yit, at the quantile level τ, given Xit. We denote by
individual-specific fixed effects, and by β(τ) the quantile-specific coefficient vector that differs across quantiles τ ∈ (0, 1). This model is useful for investigating how the relationship between yi and Xi varies across different distributions, offering insights into patterns such as disparities, vulnerabilities, and robustness of the data. This study also follows the Two-Stage Least Squares (2SLS) functions as an endogeneity solution by implementing instrumental variables to correct the model. The 2SLS approach delivers suitable results in this as it addresses reverse causality and omitted variable bias, which frequently appear in macro-panel analyses of economic and environmental variables [
83]. 2SLS instrumenting potentially endogenous regressors helps to provide consistent and unbiased parameter estimates and thus makes causal inference more reliable in the case of simultaneity [
84]; see Equation (15).
The final step of the empirical analysis employs the Dumitrescu and Hurlin [
85] panel causality test to identify directional causal relationships between variables in each diverse panel member. The Dumitrescu and Hurlin [
85] panel causality test expands traditional Granger causality methods through heterogeneity treatment and cross-sectional dependence handling, which allows analysis of mixed property panel data.
5. Estimation Result and Discussion
The empirical results presented in this study offer significant insights into the complex relationships between economic, environmental, and socio-demographic factors. The results in
Table 4 reveal a significant relationship across all models examined. The framework for CO
2 emissions demonstrates a strong correlation, as evidenced by a Pesaran CD statistic measuring 9.14*** and a Breusch–Pagan statistic escalating to 481.62***. In a similar vein, the GDP framework indicates a considerable degree of interdependence (Pesaran CD: 18.93***, Breusch–Pagan: 520.56***), while the trade intensity framework exhibits analogous findings (Pesaran CD: 11.72***, Breusch–Pagan: 311.43***). These findings suggest that all variables are intricately interconnected, respectively, across separate cross-sectional analyses.
The empirical strength of the slope test outcomes defined in
Table 5 provides considerable evidence opposing the notion of slope homogeneity for both the CO
2 emissions model (Δ = 11.84, Δ adj = 14.151) and the GDP model (Δ = 20.048, Δ adj = 22.433), thereby clarifying a multifaceted pattern of variability in the interrelations across diverse cross-sectional analyses. Within the framework of tourism income, the findings (Δ = 1.815,
p = 0.07; Δ adj = 1.99) yield marginal evidence opposing slope standardization at the 10% and 5% significance thresholds, demonstrating the presence of minor variations in slopes across different cross-sections.
The unit root test results, shown in
Table 6, show that at the level, only ITDS, FDI, POPD, and EPS are stationary at the one percent significance level, while the other variables are not. At the first difference, CO
2, GDP, TI, ITAS, ED, and TOPE become stationary, indicating that these variables are integrated into order one.
The results from the Kao Residual Cointegration test in
Table 7 show ADF t-statistics of 2.91, 1.51, and −3.86 with
p-values of 0.0011, 0.0663, and 0.0001 for Model 1, Model 2, and Model 3, respectively, indicating strong evidence of cointegration among the variables in all models. This suggests that a long-run equilibrium relationship exists between the variables in the panel data.
The estimations for the study incorporate feasible generalized least squares (FGLS) to address the complexities associated with heteroskedasticity and autocorrelation within the panels, thereby enhancing forecasting efficacy. Driscoll–Kraay standard errors have been utilized to mitigate cross-sectional dependence in conjunction with heteroscedasticity and autocorrelation. This study employs the Two-Stage Least Squares (2SLS) estimation technique to address potential endogeneity concerns. In addition, advanced panel quantile regression methodology is employed to elucidate the distributional effects of variables across diverse quantiles, facilitating a more profound investigation of asymmetric influences and non-linear responses that transcend the mean, similar to the study of [
86].
The results for Model 1 are presented in
Table 8. The results of TDI are significant in the case of FGLS and 2SLS, which indicate that a unit increase in tourism development (TDI) increases carbon emissions by 0.056% (FGLS), 0.011%, and 0.039% (2SLS). In panel quantile regression (PaQR), the results indicate that a unit increase in TDI causes carbon emissions to rise by 0.077% at the 25th quantile, by 0.020% at the 50th quantile, and by 0.030% at the 75th quantile. These outcomes are in line with Eyuboglu and Uzar [
2], León et al. [
87], and Sharif et al. [
88], confirming that tourism development tends to increase environmental degradation, primarily through increased energy consumption, transportation demand, and pressure on infrastructure. The TDI indicator demonstrates through all models that tourism growth negatively impacts environmental quality. Tourism expansion results in negative environmental impact because it requires increased energy usage, transportation, infrastructure development, and greater resource usage, producing elevated carbon emissions [
89]. This underscores the broader issue, which stresses that although tourism is economically beneficial, it has environmental costs, of carbon emissions, which are most often ignored. The study confirms a critical challenge in SDG execution because tourism damages environmental sustainability, according to SDG 13. Tourism infrastructure and mobility generate intense pressure, for which sustainable innovation is essential to create environmentally friendly infrastructure (SDG 9) and emission-reducing facilities.
The environmental impact of GDP is determined to be detrimental across all models. The results exhibit that a 1% rise in GDP raises carbon emissions by 0.073% (FGLS), 0.053% (DK), and 0.137% (2SLS). Meanwhile, in the case of PaQR, a 1% increase in GDP increases carbon emissions by 0.156% at the 25th quantile, by 0.147% at the 50th quantile, and by 0.093% at the 75th quantile. These results show the established relationship between economic development and environmental destruction, which most strongly affects the early to middle phases of development when industries rely heavily on energy consumption. In some economies with higher incomes, cleaner technologies or environmental regulations may be adopted, which slightly counteract the effect at higher quantiles [
90]. The complexity of economic–environmental relationships is reflected in this result, as growth may imply higher industrial activities, energy use, and transportation, all of which are carbon emissions factors [
91]. The results exhibit the difficulty of achieving climate resilience (SDG 13) while expanding the economy, especially during periods of early industrialization. Green industrial strategies together with climate-conscious infrastructure (SDG 9) require immediate development, particularly in developing economies with their carbon-intensive economic growth.
Energy prices (EPS) have a beneficial environmental impact. A 1% increase in energy prices reduces carbon emissions by 0.660% (FGLS), 1.113% (DK), and 0.841% (2SLS), according to the data. Meanwhile, carbon emissions rose by 0.735% at the 75th quantile, by 0.777% at the 50th quantile, and by 0.637% at the 25th quantile in the case of PaQR, for a 1% rise in energy prices. This analysis confirms that elevated energy prices tend to decrease atmospheric carbon emissions. When energy prices rise, consumers and industries become more motivated to decrease their energy usage while making their operations more efficient and selecting cleaner energy alternatives [
92]. The available evidence demonstrates the necessity for additional supportive policies that will guarantee that environmental improvements extend to every income group or emitter level. Trade openness (TOPE) has a beneficial environmental impact. The results exhibit that a 1% rise in TOPE reduces carbon emissions by 0.292% (FGLS), by 0.423% (DK), and by 0.510% (2SLS). Meanwhile, in the case of PaQR, a 1% increase in TOPE reduces carbon emissions by 0.103% at the 50th quantile, whereas the results are statistically insignificant in the 25th and 75th quantiles. Trade openness may have a beneficial environmental impact because it allows for the transmission of cleaner, energy-efficient technologies and environmental best practices between countries [
93,
94].
FDI has a beneficial environmental impact, as results indicate that a 1% rise in FDI reduces carbon emissions by 0.005% (FGLS), by 0.003% (DK), and by 0.127% (2SLS). Meanwhile, in the case of PaQR, results indicate that carbon emissions decline by 0.004% at the 50th and by 0.012% at the 75th quantile, whereas results are statistically insignificant at the 25th quantile. Foreign investments often bring advanced technologies and more efficient production methods that reduce environmental harm, which may be the reason why FDI has a beneficial environmental impact [
95]. Population density (POPD) has a harmful environmental impact, as results show that a 1% rise in POPD increases carbon emissions by 0.047% (FGLS), by 0.015% (DK), and by 0.301% (2SLS). However, in the case of PaQR, POPD has a beneficial environmental impact at the 25th and 50th quantiles and a detrimental environmental impact at the 75th quantile. The concentration of economic activity and consumption in densely populated areas may be the reason for the detrimental environmental impact of POPD, as it is known to result in more overall CO
2 emissions. When more people live in a smaller space, the demand for resources, energy, and transportation also increases. The results of the PaQR (panel quantile regression) are more complicated. At the 25th and 50th quantiles, POPD has a positive environmental effect because denser places may use more energy-efficient infrastructure or public transport. However, POPD has a negative environmental effect at the 75th quantile, implying that places with high populations suffer serious environmental issues [
96].
The outcomes of Model 2 are shown in
Table 9. The results indicate that a 1% rise in carbon emissions causes GDP to rise by 0.018% (FGLS), by 0.037% (DK), and by 0.165% (2SLS). In the case of PaQR, the results indicate that a 1% rise in CO
2 emissions increases GDP by 0.005% at the 25th quantile and 0.312% at the 50th quantile but reduces GDP by 0.179% at the 75th quantile. Higher carbon emissions correlate with higher production outputs and GDP, particularly in energy-intensive sectors like manufacturing and transportation [
97]. The research indicates that tourism development (TDI) drives positive economic growth (GDP), but the measurement strength changes based on estimation approaches. Policymakers need to direct their efforts toward implementing renewable energy systems, which will separate economic progress from emissions expansion to fulfill the environmental objectives of SDG 13.
The results show that a unit rise in tourism (TDI) increases GDP by 0.029% (FGLS), 0.008% (DK), and 0.190% (2SLS). While GDP rises by 0.032% at the 75th quantile, 0.024% at the 50th quantile, and 0.017% at the 25th quantile in the case of PaQR, for a 1% rise in TDI. There are several key channels through which tourism may contribute to GDP growth. First, an increased number of tourist arrivals increases demand for goods and services, thereby pushing up business revenues and job creation in hospitality, transportation, and retail. Second, tourism indirectly impacts the country’s infrastructure and improves general economic productivity [
98,
99]. Tourism development can contribute to sustainable industrialization and innovation in line with SDG 9 (Industry, Innovation, and Infrastructure) by developing the economic infrastructure. The investment in sustainable infrastructure, together with eco-friendly tourism operations, helps countries to fulfill both SDG 9 and SDG 13 objectives while strengthening economic stability because of environmental sustainability.
Energy prices (EPS) are found to have adverse economic impacts. The rise of energy prices creates obstacles to economic development because they elevate manufacturing expenses, decrease spending power, and discourage investment decisions. The expenses of industries dependent on fuel and electricity rise when energy costs increase, which results in decreased production output and reduced competitiveness alongside possible employment reductions [
100]. Trade openness (TOPE) has a beneficial economic impact, as indicated by positive and significant coefficients in all methods, which support the findings of Kong et al. [
101]. The results of this finding point out that trade integration increases economic performance through augmenting market access, technology transfer, and efficiency gains.
Both foreign direct investment (FDI) and population density (POPD) positively affect economic growth through unique but related channels. FDI increases GDP through capital injection, transfer of technology, and increasing productivity through knowledge spillovers and employment generation. It also builds infrastructure, promotes industrialization, and places the local economies in the global trade networks [
102]. Furthermore, economic activity receives two distinct advantages from population density because it both enlarges the workforce and elevates product and service requirements, producing urbanization that triggers agglomeration economies alongside innovation [
103].
The outcomes of Model 3 are shown in
Table 10. The results indicate that a 1% rise in carbon emissions curbs tourism development (TDI) by 0.015 units (FGLS), 0.023 units (DK), and 0.104 units (2SLS). Meanwhile, in the case of PaQR, TDI diminishes by 0.005 units (25th quantile), by 0.145 units (50th quantile), and by 0.190 units (75th quantile) if carbon emissions upsurge by 1%. CO
2 emissions function as a leading cause that drives climate change. Climate change produces various environmental alterations that directly cause harm or devalue the tourism destinations [
104]. These findings align with previous studies that demonstrate that atmospheric emissions create more severe climate changes through flooding, heat waves, lost biodiversity, and environmental damage, which directly diminishes the value of tourist attractions [
43,
64]. The research findings specifically endorse SDG 13 (Climate Action) because they establish the immediate requirement to control emissions for the safeguarding of the sustainability of tourism. The reduction of environmental shocks demands both tourism infrastructure that stands against climate change and low-carbon transport solutions.
Economic growth (GDP) has a beneficial impact on tourism development (TDI). The results show that a 1% rise in GDP improves TDI by 0.950 units (FGLS), by 1.075 units (DK), and by 0.123 units (2SLS). Meanwhile, in the case of PaQR, TDI increases by 0.115 units (25th quantile), by 0.366 units (50th quantile), and by 0.544 units (75th quantile) if carbon emissions upsurge by 1%. A higher GDP generates conditions promoting tourism through better travel capabilities, enhanced tourism infrastructure, and increased economic stability [
105]. The study outcome confirms the relationship between economic growth and strong tourism infrastructure development, which corresponds to SDG 9 (Industry, Innovation, and Infrastructure). Rising energy prices (EPS) reduce tourism. The tourism industry faces significant obstacles from rising energy prices because these expenses boost travel expenses, negatively affecting related tourism businesses [
106]. Transforming tourism, transport, and hospitality sectors into renewable and energy-efficient operations according to SDG 13 would create dual benefits of fossil fuel shock resistance and emission reduction.
Trade openness (TOPE) has been found to have a beneficial impact on tourism development. Efficient transportation networks, such as airports, seaports, roads, and railways, must develop when countries open their trade to international flows. Tourism receives advantages from transportation network improvements since destinations become more accessible for international tourists [
107]. FDI further increases tourism income by improving infrastructure and augmenting sector competencies [
108]. Population density (POPD) has a supporting impact on tourism development. Population density promotes tourism because it helps to provide a fully developed infrastructure in the country and enhances the cultural experiences and service industries. Furthermore, tourists find diverse cultural events, historical landmarks, and festivals in high-population-density areas because of their diverse nature [
109]. Sustainable tourism and cultural preservation infrastructure that attracts FDI through policy strategies strengthens the implementation of SDG 9. Tourism development becomes more climate resilient when population density receives focused attention for environmental sustainability purposes. This approach strengthens the achievement of SDG 13.
The Dumitrescu–Hurlin panel causality test, shown in
Table 11, suggested such strong dependence between carbon dioxide emissions (CO
2), gross domestic product (GDP), the tourism development index (TDI), as well as foreign direct investment inflows (FDI), that every predictor significantly forecasted changes in the others. Population density (POPD) and energy prices (EPS) also impact multiple indicators; even EPS affects changes rather than leading changes. Trade openness (TOPE) has weak causality.
6. Conclusions and Policy Implications
The study elucidates the intricate connections between tourism development, economic development, and their consequent impacts on CO2 emissions across the ten most-visited countries: China, France, Italy, the United Kingdom, Mexico, Germany, Turkey, Spain, the United States, and Russia. As major hubs of global economic activity and international tourism, these nations exhibit diverse environmental repercussions shaped by tourism practices, pollution emissions, and economic growth. Though tourism development (TDI) emerges as a significant driver of economic expansion, all statistical models confirm that it also causes carbon emissions, while testing across FGLS and 2SLS and panel quantile regression (PaQR) models. The results show that GDP growth (GDP) increases carbon emissions, similarly to how the Environmental Kuznets Curve hypothesis works at its initial stages. The development of tourism and GDP expansion produces environmental harm through higher energy usage and the expansion of infrastructure. Energy prices, together with trade and foreign direct investment, help reduce carbon emissions through their promotion of energy-efficient technologies. Population density, however, plays a more complicated role since the effect of population density is quantile dependent, and as such, well-planned urban planning and sustainable infrastructure can play a role in offsetting the negative environmental externalities generated by densely populated areas. The growth in GDP leads to increased tourism development, while confirming economic growth enhances the desire of customers to travel and infrastructure capabilities. Excessive carbon emissions (CO2) are harmful to TDI since environmental degradation and pollution lower the appeal of tourist destinations. Tourism development depends positively on both trade openness (TOPE) and FDI because these factors enable the expansion of tourist markets through globalization and foreign investments. The analysis shows that increases in energy prices (EPS) negatively affect TDI because higher transportation and operational expenses during tourism activities reduce their demand.
The study demonstrates the essential need for policy guidelines to support SDG 13 (Climate Action), which supports rapid decarbonization by developing climate-resilient infrastructure and utilizing renewable energy in tourism-related sectors. Simultaneously, the industry transition needs SDG 9 (Industry, Innovation, and Infrastructure) to support its economic sustainability through green transport innovations, smart urban planning, and eco-friendly construction. Policymakers must establish an economic–environmental policy equilibrium, where tourism growth is paired with robust sustainability safeguards. Though tourism strongly contributes to economic growth, at the same time, it harms the environment, which calls for sustainable tourism practices. Green tourism strategies should be the policymakers’ focus, including integrating energy efficiency and low-carbon technologies into tourism infrastructure.
This study is subject to certain limitations. The research analyzes only the ten most-traveled countries while failing to demonstrate applicability to tourism markets with different levels of development. Due to limited data availability, the study had to omit key variables, such as environmental regulations and tourist behavior, that potentially affect emissions. Furthermore, research can be expanded in the future to include emerging and less-developed tourism markets to increase the generalization of studies. Including environmental regulations, tourists’ behavior, and destination management practices would further explain the link between tourism, emissions, and growth and help create better sustainability policies.


