1. Introduction
The United Nations (UN) has reported that the world population is expected to continue increasing until 2085 [
1], and the proportion of the world population living in cities is expected to rise from 55% in 2018 to 68% in 2050 [
2]. The International Transport Forum (ITF) estimates that global transportation activity will more than double by 2050 compared to 2015 [
3].
As populations converge in cities and transportation activities increase, urban transportation systems become increasingly saturated, which may reduce the quality of life for urban residents. One potential solution is Urban Air Mobility (UAM), which refers to transportation systems that leverage three-dimensional airspace to escape the two-dimensional constraints of existing urban transportation systems. Between the 1950s and 1980s, several companies began providing early UAM services using Vertical Takeoff and Landing (VTOL) aircraft such as helicopters in major U.S. cities like Los Angeles, New York City, San Francisco [
4]. Unfortunately, these services were not popular as a transportation system due to issues such as noise, costs, and safety [
5]. However, recent technological advances, including the use of electric batteries instead of fossil fuels for UAM aircraft power, Distributed Electric Propulsion (DEP) technology to drive multiple rotors independently (ensuring safe flight even if one rotor fails), and tiltrotor technology for variable rotor angles to achieve high cruising speeds and efficiency like fixed-wing aircraft without the need for a runway, have opened a new era for UAM, and the industry has been growing at an accelerating speed [
6]. In particular, electric VTOL (eVTOL) aircraft are expected to address previous issues such as noise, costs, and safety [
7,
8,
9]. Thus, UAM holds great potential as an ecofriendly solution for alleviating traffic congestion and reducing travel times. However, for UAM to be accepted by the public and become a widely accessible transportation system, it must provide reliable service.
The physical components essential for a reliable UAM service include UAM aircraft and ground facilities. A vertiport, which is a portmanteau of “vertical” and “airport”, is a ground-based UAM facility that comprises a Touchdown and Liftoff (TLOF) pad for UAM aircraft to take off and land, gates for passengers to board and disembark and allow staff to conduct turnaround activities such as UAM aircraft maintenance and repair, and taxiways for the ground movement of UAM aircraft. Each facility can accommodate only one UAM aircraft at a time. Therefore, the capacity of a vertiport (i.e., number of departures and arrivals within a specific time period) depends on the number of TLOF pads, gates, and taxiways as well as the configuration of the vertiport.
An essential part of operating a vertiport is scheduling the departures and arrivals of the UAM aircraft. Efficient operation requires meticulously considering the vertiport capacity and delays for a given interval time. For example, if more departures and arrivals are scheduled than the vertiport can accommodate, UAM aircraft may have to hover in the air until there is space to land or divert to an adjacent vertiport. The resulting delay can cause anxiety for passengers and make UAM less attractive as a transportation mode. Conversely, if fewer departures and arrivals are scheduled than the vertiport can accommodate, this can lead to excessive budget expenditure and unnecessary waste. Moreover, if no aircraft are available when passengers wish to use them, UAM can become inconvenient as a transportation mode. However, previous studies on vertiport operation have assumed vertiport capacity without considering delay times [
10,
11,
12,
13]. Even when delay times were considered, they were assumed to occur at specific times prior to the simulations [
14]. In other studies, efficient operational strategies were analyzed by reflecting the traffic environment at the vertiport, including delay times and arrival time uncertainties [
15,
16]. However, the takeoff and landing processes were operated separately and resulted in unshared taxiways. These studies call into question the realism of vertiport operations, as they did not consider the traffic environment at a vertiport, such as delays or the use of shared taxiways.
The objective of this study was to determine the most efficient operational plan for a vertiport by maximizing its capacity and minimizing UAM aircraft delay time. An operational plan for a vertiport includes various aspects, such as the scheduling and management of aircraft movements, passenger handling, and maintenance activities. In this study, we used the traffic simulation program VISSIM (PTV VISSIM 2024) to generate multiple UAM aircraft at consistent intervals, simulating the network flow at the vertiport (as detailed in
Section 4). Our operational plan not only considered the movement times of UAM aircraft but also the traffic environment at a vertiport.
The reason for using VISSIM in this study is that it provides a user-friendly platform and offers a wide variety of urban applications, integrating public and private transportation. One of the main advantages of VISSIM is its ability to provide a detailed and visual representation of network flows at the vertiport, including the application of uncertainty to turnaround time. This enables the simulation of scenarios in which UAM aircraft cannot adhere to their scheduled departure times due to operational delays. However, VISSIM alone was limited in simulating situations where UAM aircraft could not adhere to their scheduled generation times at the final approach fix. To address this issue, the numerical analysis program MATLAB (R2023a) were performed to extract generation times at the final approach fix with applied uncertainty, which were then applied in VISSIM.
Initial UAM operations in the 2025–2028 timeframe are expected to primarily use existing airports and heliports. However, these facilities must have adequate UAM aircraft parking zones for loading/unloading, infrastructure sizing, and charging stations to accommodate UAM aircraft operations [
17]. As the number of UAM aircraft flights increases, vertiports will need to be designed specifically for UAM aircraft, independent of existing airports and heliports. This study uses a simple vertiport configuration with one TLOF pad and two gates (i.e., a 1TLOF 2Gate configuration) in VISSIM to simulate vertiport operations.
The contribution of this study is to propose a method to maximize a vertiport’s capacity and minimize delay times by optimizing the intervals between consecutive arrivals and departures of UAM aircraft at a 1TLOF 2Gate vertiport built through VISSIM simulation. This provides practical guidelines that can significantly improve the efficiency of UAM operations and considers the traffic environment at a vertiport.
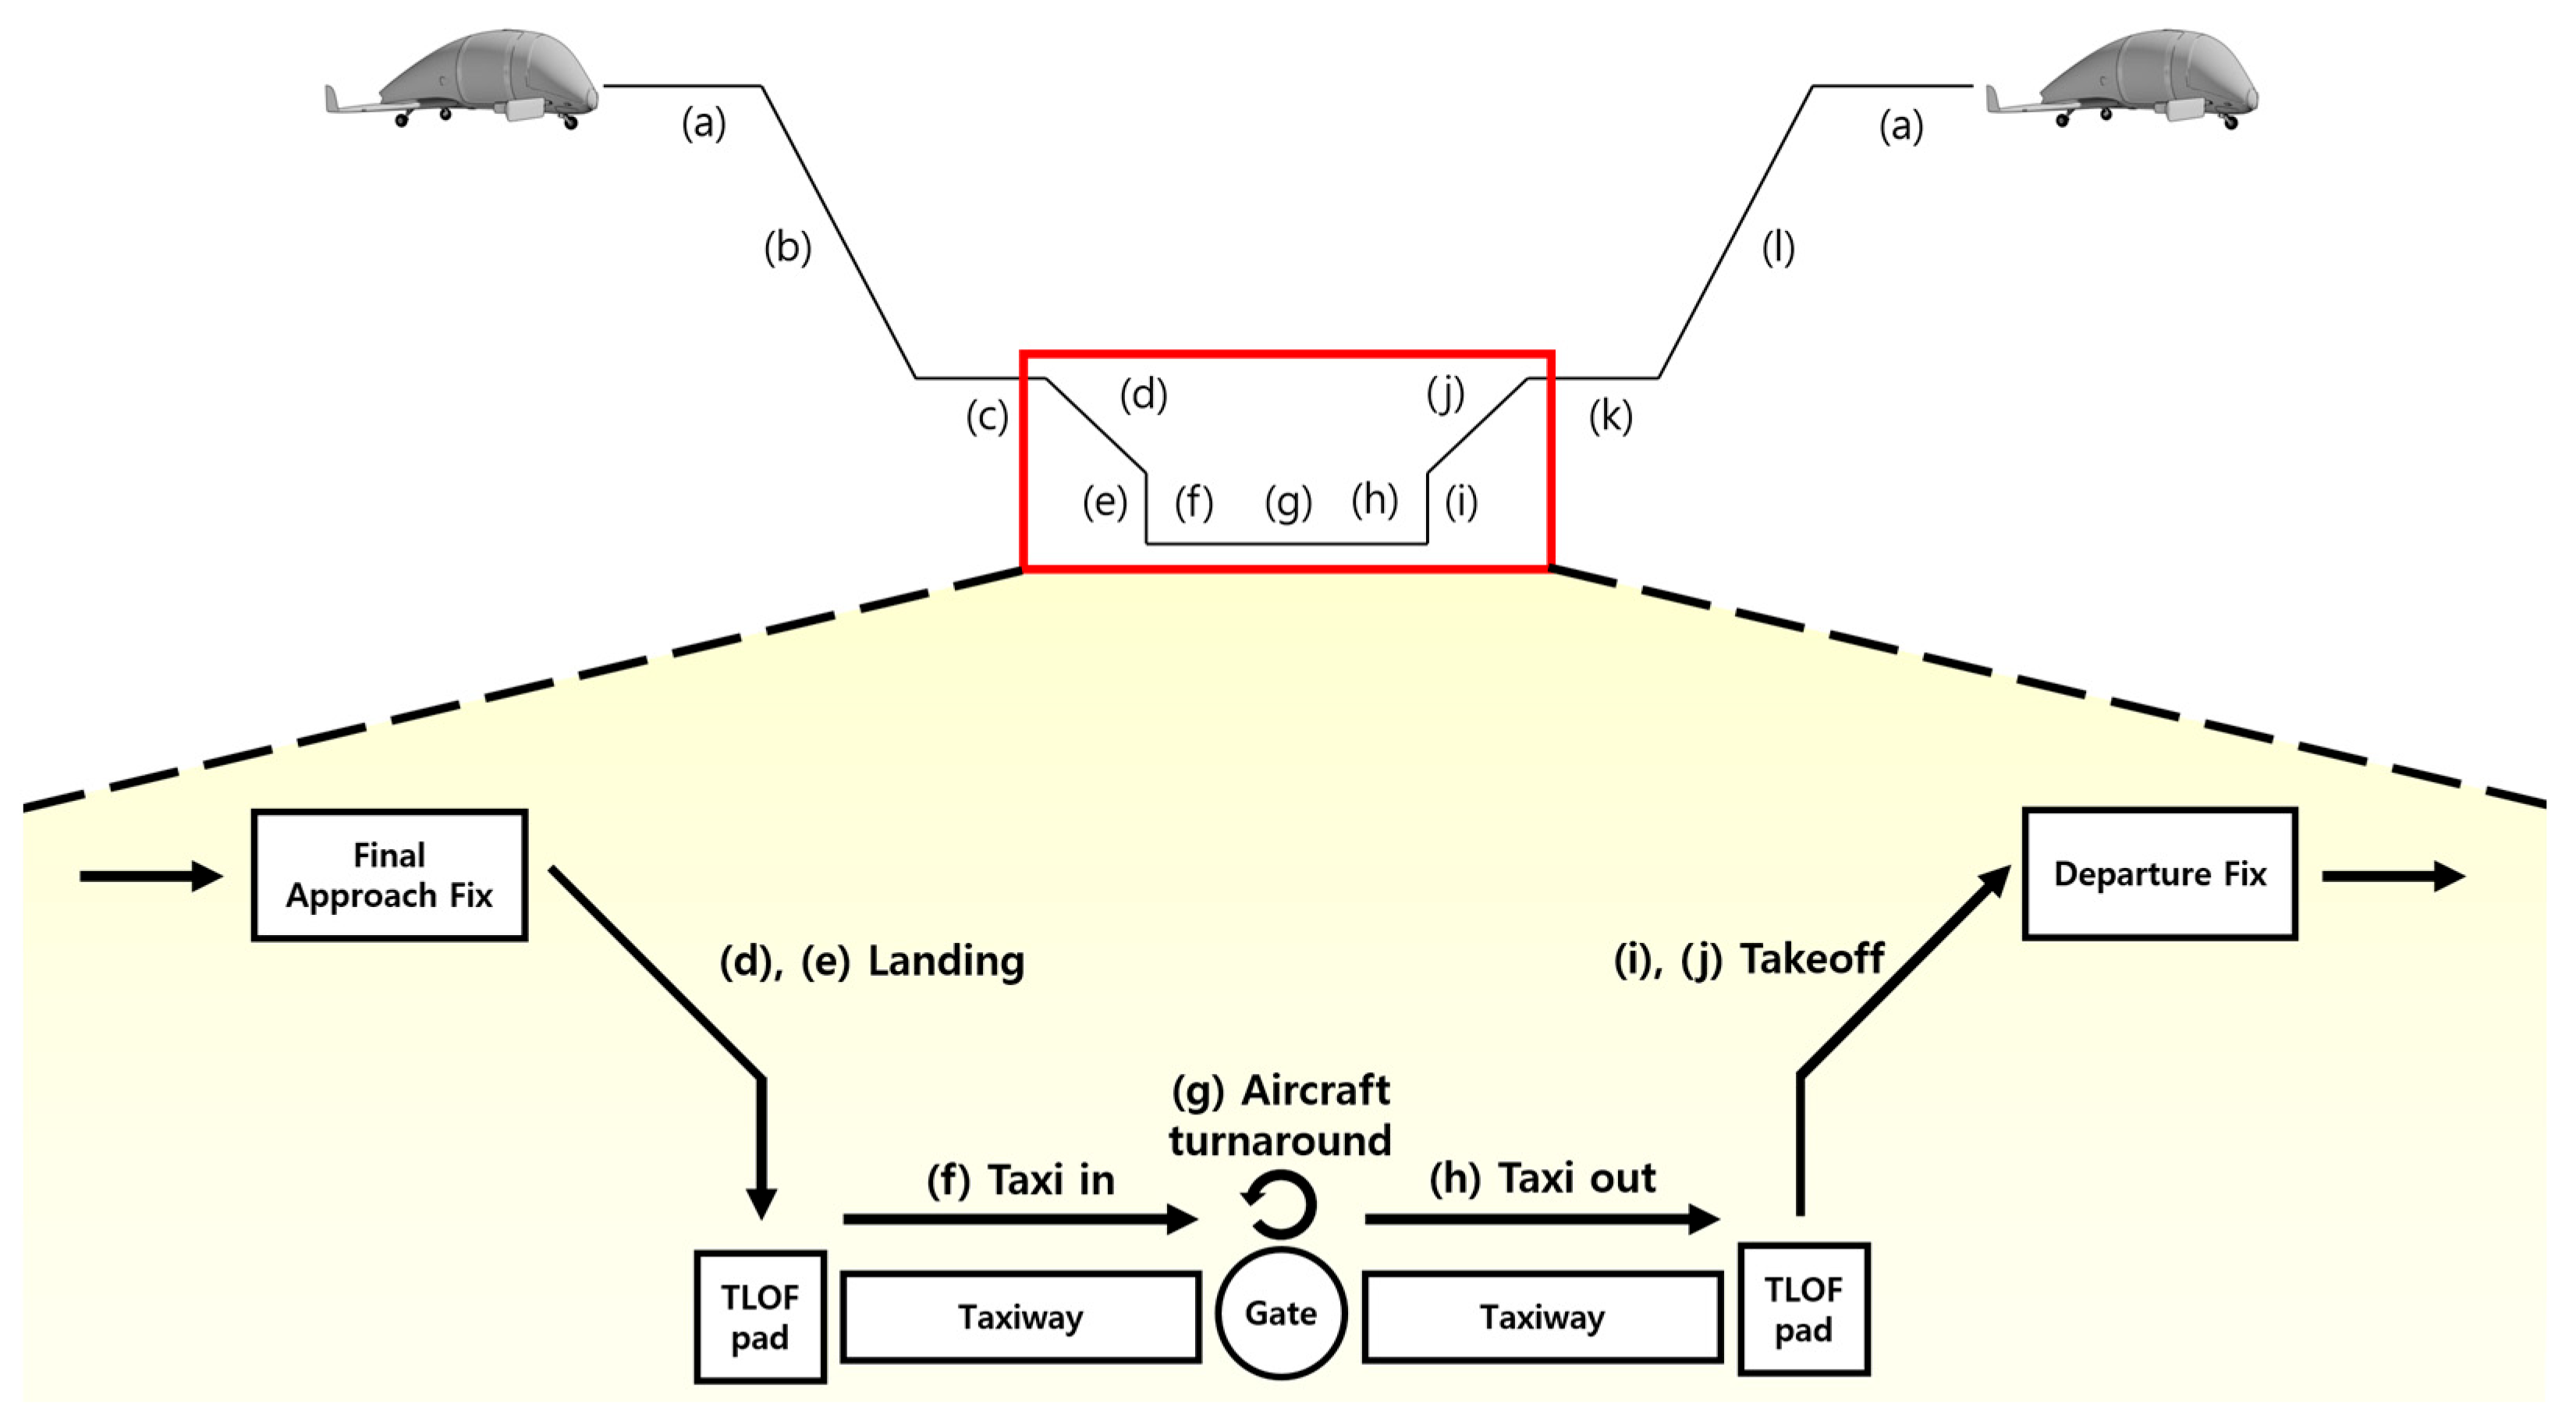
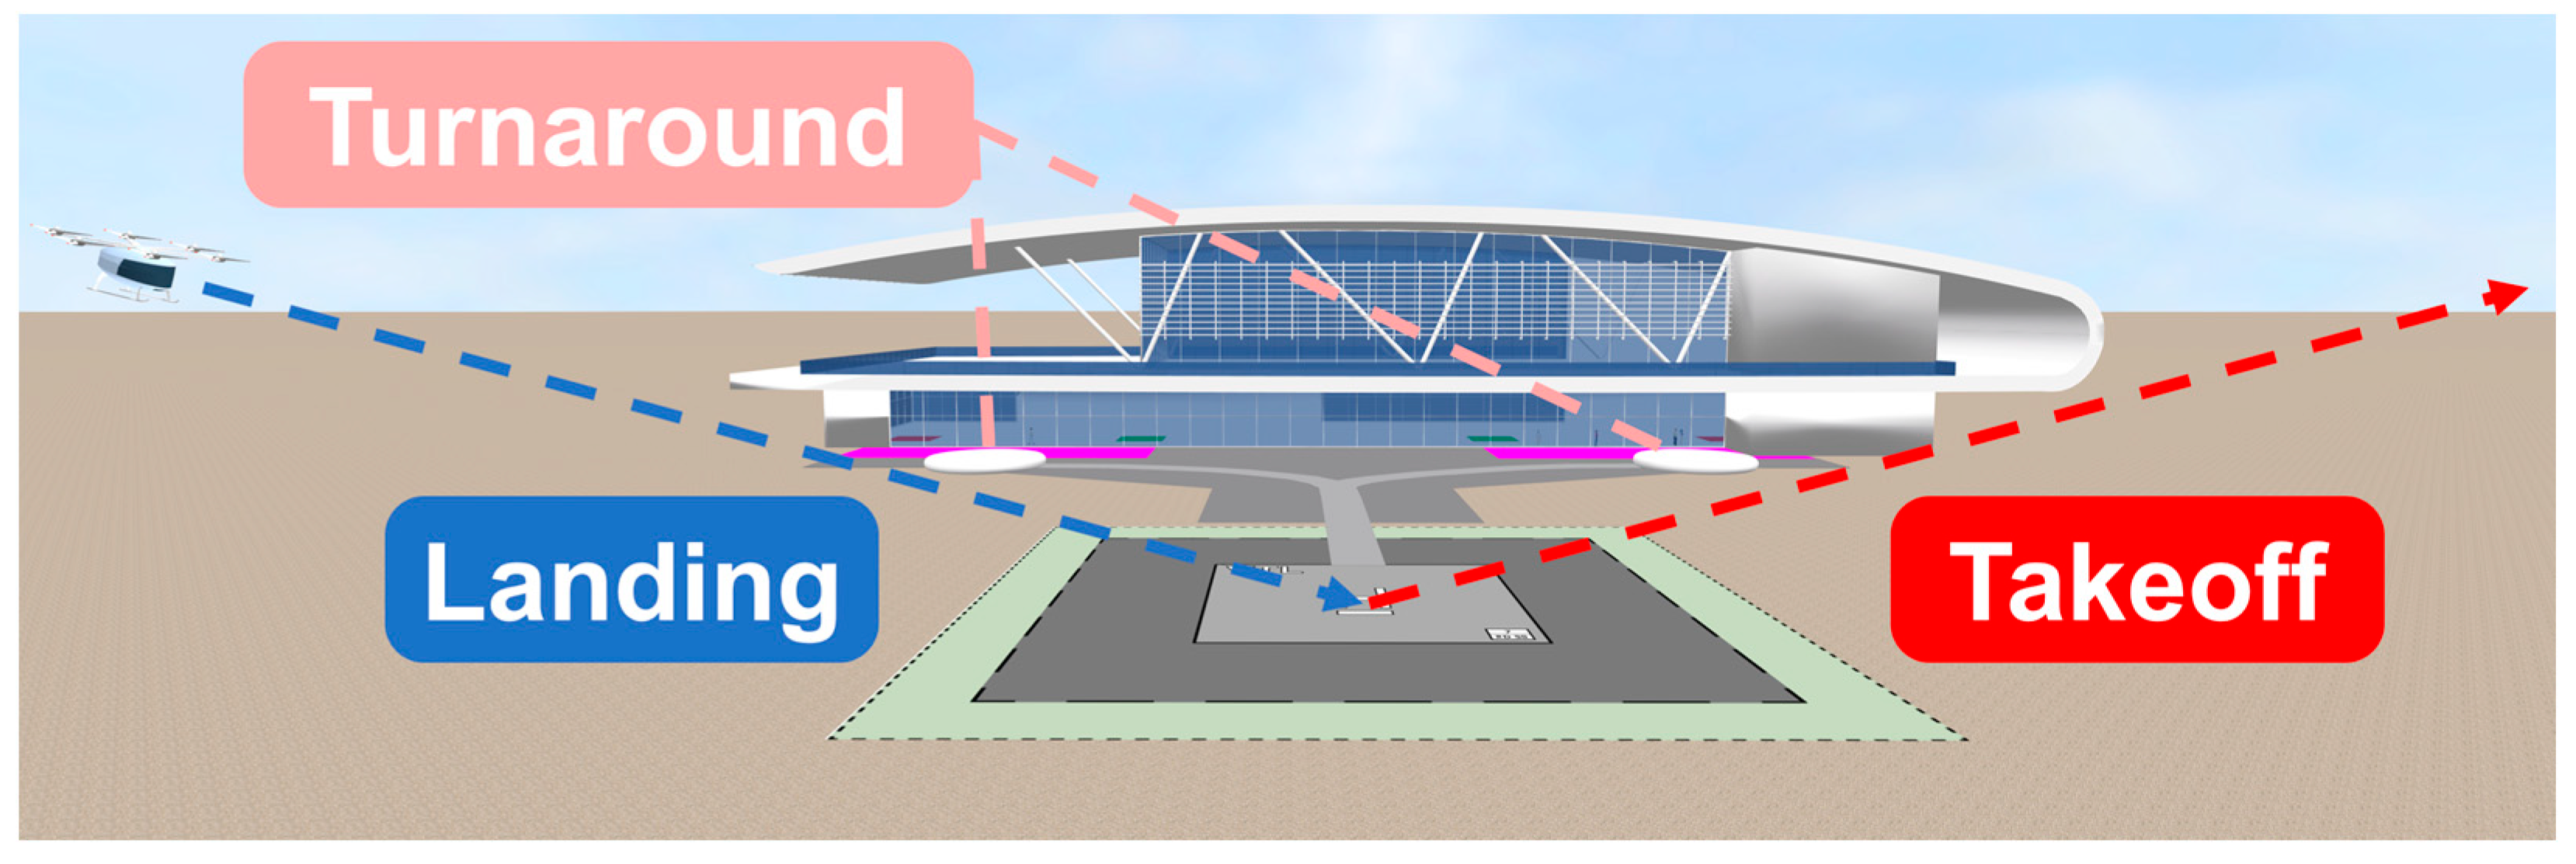
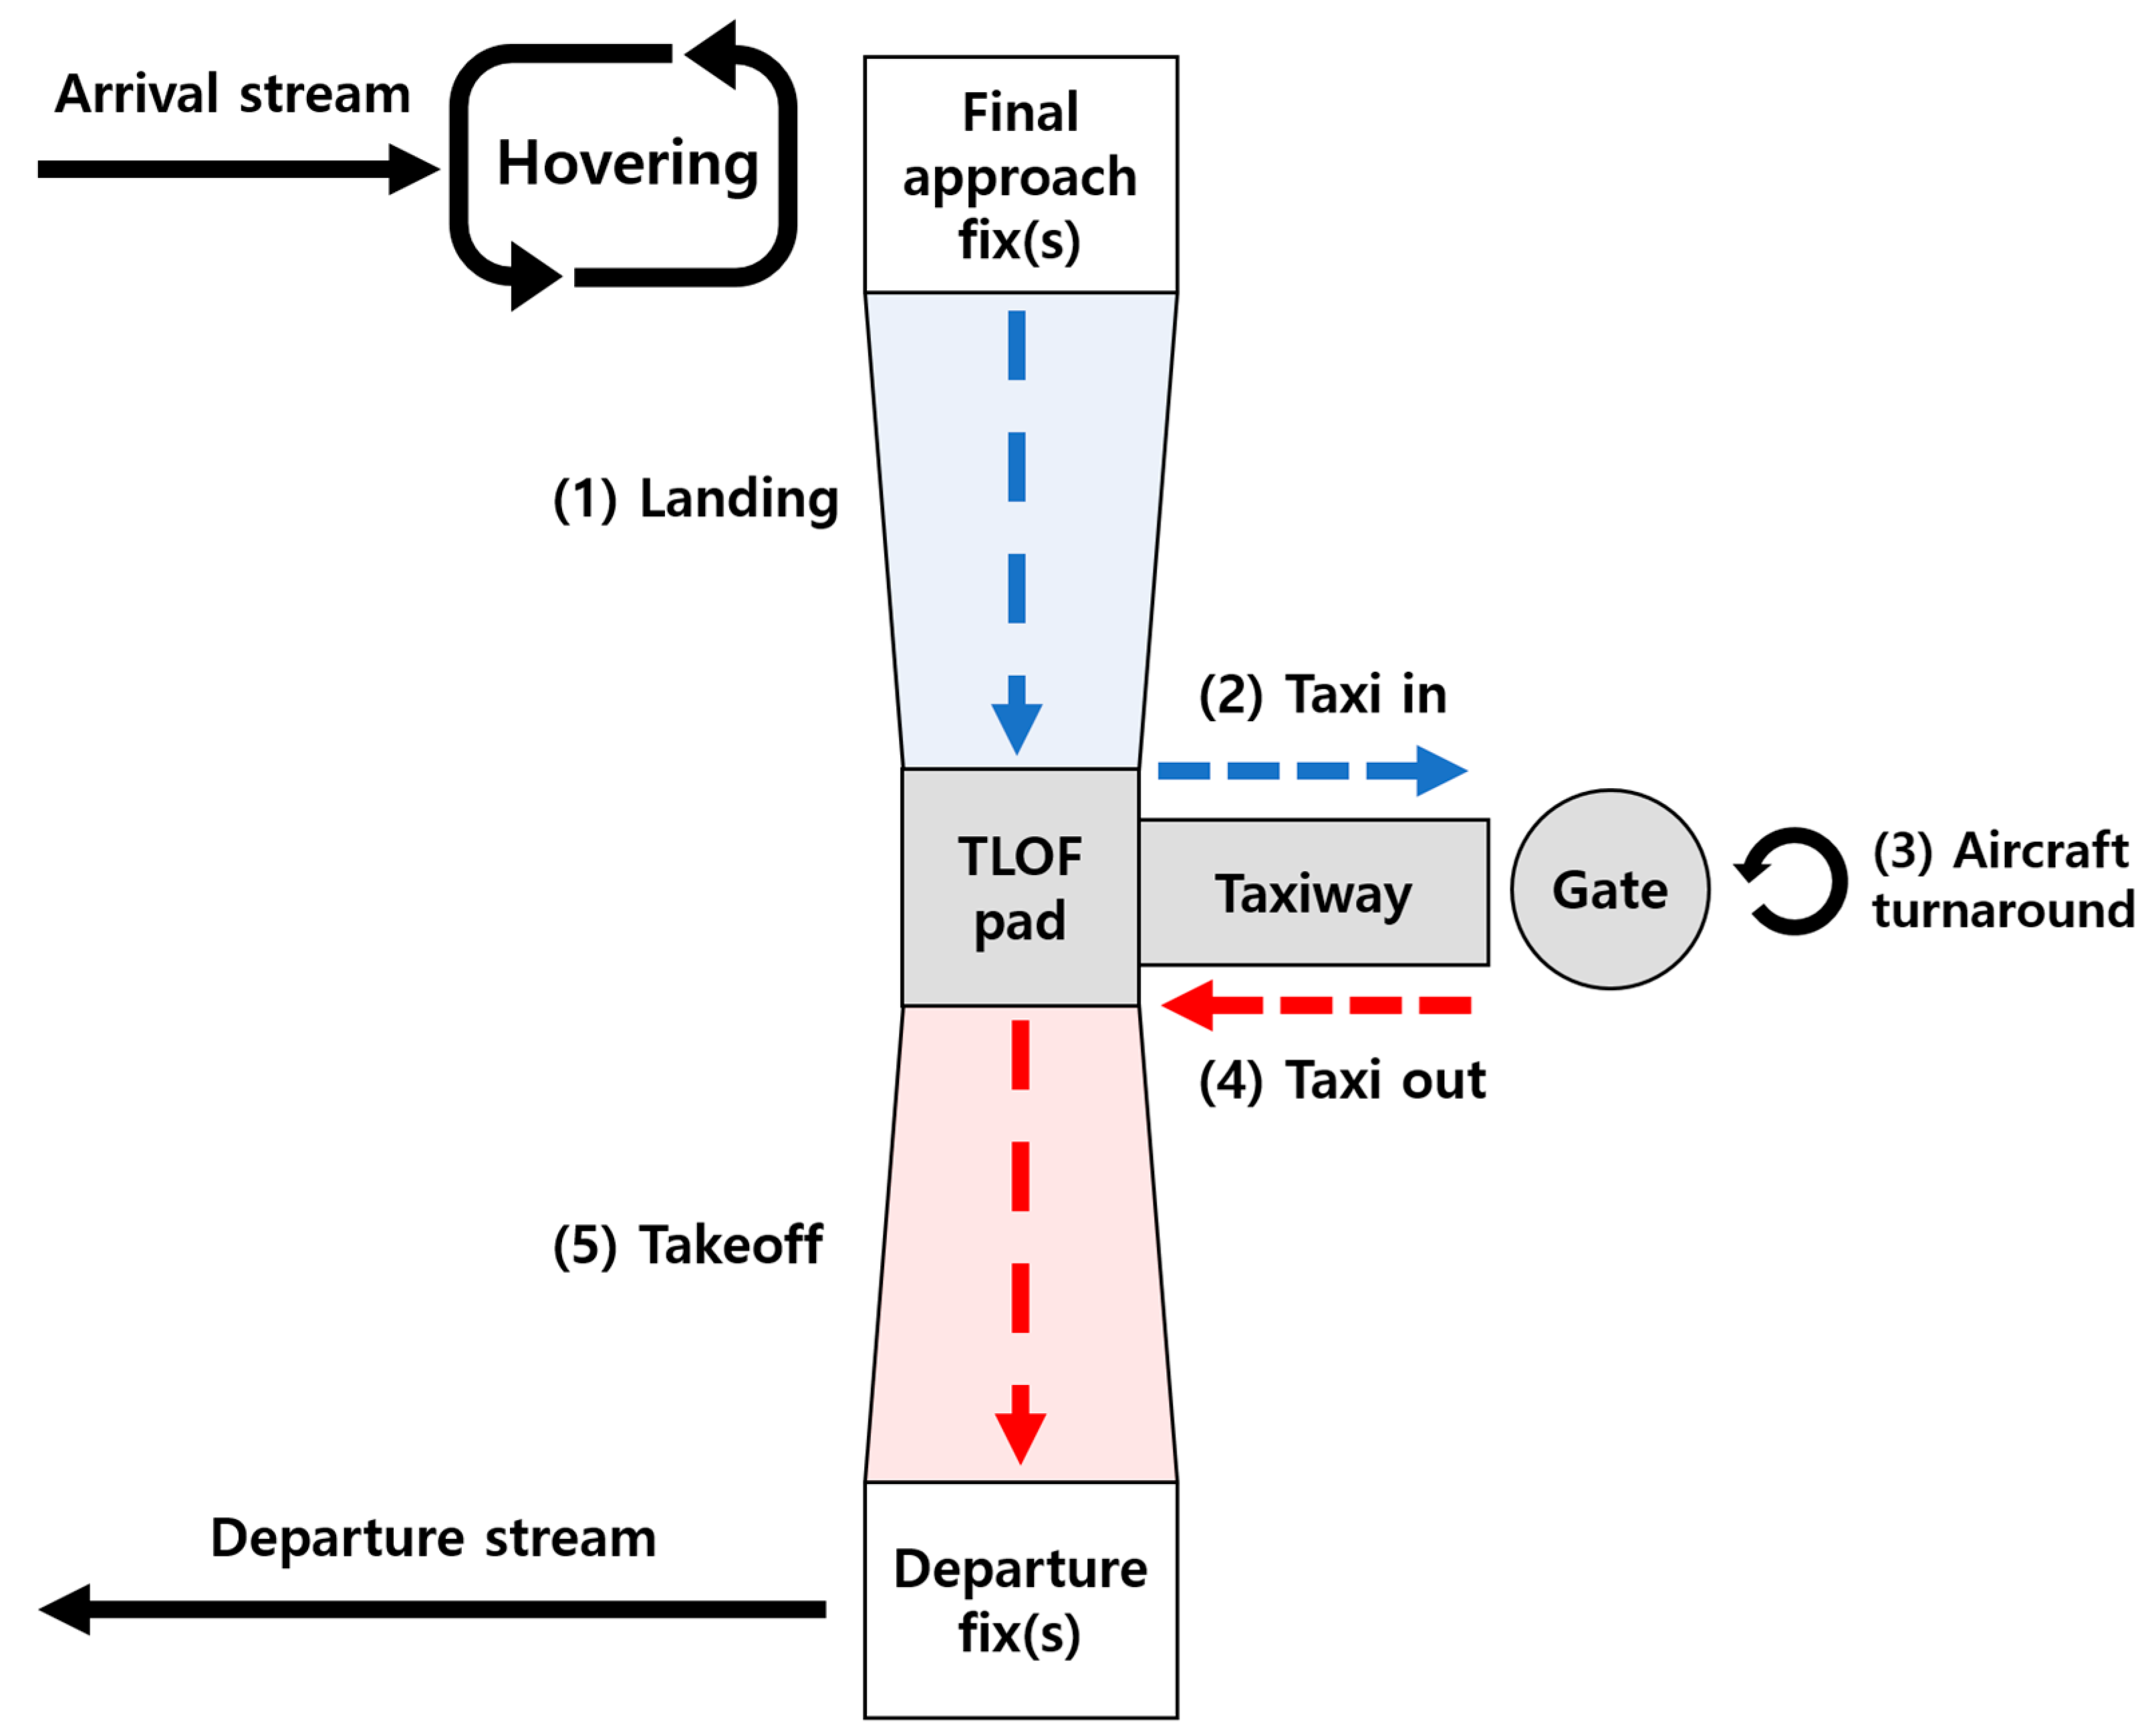
Figure 1 shows the process of a UAM aircraft arriving at and departing from a vertiport [
18], and
Table 1 explains the different segments of the process. To analyze the traffic environment at a vertiport, this study focused on segments (d)–(j) and excluded segments (a)–(c) and (k)–(a). The vertical landing and vertical takeoff phases were merged with the transition phases.
2. Literature Review
UAM research has been taking place across various fields. Chen [
6] utilized the program SimMobility to predict UAM demand for two types of highly industrialized and car-driven cities classified in [
20]: Auto Innovative (AI, a major city at the center with sporadically distributed surrounding cities) and Auto Sprawl (AS, two major cities in the area). The two city types were segmented into launch, near-term, and long-term stages, and the UAM usage purposes, operating costs, and UAM aircraft operating distances were determined. The results showed that, in the long-term stage, UAM was suitable for various purposes regardless of the city type. As UAM usage costs decreased, accessibility increased, and the number of long-distance flights was expected to rise. Consequently, the potential market value of UAM is considered highly promising.
Tang et al. [
21] utilized 3D information of the Tampa Bay area to identify suitable vertiport locations. They simulated flight operations using the Automated Flight Planning System (AFPS) to determine the optimal flight paths in terms of safety and efficiency. They suggested that AFPS could be used by Providers of Services for UAM (PSU) to offer airspace and traffic management services to multiple UAM operators.
Fadhil [
22] classified the parameters for selecting vertiport locations into demand and supply sides. For the demand side, the following parameters were identified: population density, median income, office rent price, Points of Interest (POI, places most visited by tourists), major transport nodes, annual transport cost, job density, and extreme commuting. For the supply side, the following parameters were identified: existing noise levels, existing helipads, and potential spots. To analyze the impact of these variables on vertiport location selection, an Analytic Hierarchy Process-Delphi (AHP-Delphi) survey was conducted with two ‘super-experts’ to analyze the impact of these parameters in the vertiport location. While this approach allowed the influence of each parameter to be analyzed for different geographical areas, it could not identify particular buildings or specific areas suitable for hosting a particular type of vertiport.
Wei et al. [
10] established a star-branch network model for UAM operation in which the main city is the central node, surrounding exurbs are leaf nodes, and suburbs between the central and leaf nodes are intermediate nodes. In this model, creating a UAM service schedule involved specifying the waypoints and final destination before departure. The decision to make a stop at an intermediate node was determined by the vertiport’s capacity. The authors also introduced uncertainty into the travel time across links, which represented the distances between nodes. In their simulations, they differentiated between cases with and without intermediate nodes to determine the difference in the number of UAM aircraft that successfully completed their schedules. Their results suggested that the star-branch network could be used to optimize schedules for UAM operations.
Vascik and Hansmann [
11] used Integer Programming (IP) to analyze vertiport capacity according to the numbers of TLOF pads and gates, departure and arrival times, and turnaround times considering independent/dependent operation. They identified several strategies for efficient vertiport operation: increasing the ratio of gates to TLOF pads, installing UAM aircraft staging stands where UAM aircraft may be parked and perhaps serviced (e.g., charging, fueling, maintenance) but where no passenger activities may happen, and equipping vertiports with multiple TLOF pads.
Park and Kim [
12] also used IP to analyze vertiport capacity, targeting the Gangnam district of Seoul, and identified an optimal vertiport design by determining the appropriate combination and spatial placement of facilities based on the geometry of the candidate site. This approach aimed to maximize the capacity and net profit of the vertiport operator. However, a limitation of the study was that it did not reflect the ground traffic environment occurring along taxiways in the calculation of vertiport capacity.
Ahn and Hwang [
13] analyzed vertiport capacity by comparing hourly departure and arrival flight numbers (departure/arrival integer pairs) using MATLAB, inspired by the concept of the IP method. Three vertiport layout types were applied to the parking space of Gimpo airport, Republic of Korea: linear, satellite, and pier. The analysis considered the technical vertiport design standards proposed by the FAA [
23] and EASA [
19]. Under the FAA standard, the most efficient vertiport layout for UAM operation was the pier topology, consisting of 2 TLOF pads and 12 gates for the current parking space, and 3 TLOF pads and 11 gates for the expanded parking space. Under the EASA standard, the most efficient layouts were the satellite topology, consisting of 4 TLOF pads and 18 gates for the current parking space, and the pier topology, consisting of 4 TLOF pads and 20 gates for the expanded parking space.
Guerreiro et al. [
14] used a first-come, first-served (FCFS) vertiport scheduling algorithm to analyze vertiport capacity based on three factors: the surface time, number of gates, and number of TLOF pads. The surface time refers to the time UAM aircraft spent at the vertiport from landing on the TLOF pad to takeoff, which included any delay time incurred by the UAM aircraft. However, they assumed specific delay times before running the simulation rather than delays caused by the actual traffic environment at the vertiport.
Zhang et al. [
15] proposed a capacity assessment method for the theoretical and actual capacities of Unmanned Aerial Vehicle (UAV) vertiports. They categorized the processes occurring at the vertiport into landing, turnaround, and takeoff platforms, using the capacity of each platform to measure the overall vertiport capacity. Theoretical capacity was analyzed using a calculation method, while actual capacity was assessed through queuing theory. By utilizing queuing theory, the vertiport capacity was determined by considering UAV delays and arrival time uncertainties that could not be captured by the calculation method. Moreover, through various scenarios adjusting the intervals of landing, turnaround, and takeoff, the study found that the landing platform was more prone to congestion than the takeoff platform. Additionally, changes in the intervals of each platform had the greatest impact on turnaround capacity, and the takeoff platforms were the most sensitive to changes in acceptable levels of delay. However, to effectively utilize the limited space at the vertiport, taxiways should be used for both landing and takeoff operations. The study had a limitation in that it separated ground activities into distinct platforms, resulting in unshared taxiways.
Similarly, Rimjha and Trani [
16] used a MATLAB based Discrete Event Simulation (DES) model to analyze factors affecting vertiport capacity by dividing UAM operations at the vertiport into three sections: arrival, service, and departure. A First-In-First-Out (FIFO) queue system was applied to each section to simulate operational flows. The 24-h simulation revealed that, due to the typical commuting pattern in urban areas, operations were unidirectional during the morning and evening peak periods. As a result, the proportion of repositioning flights, which are UAM aircraft flying without passengers to balance the system, increased significantly. The simulation showed that 46–47% of total operations had to be handled as repositioning flights, which reduced operational efficiency and required additional space. To accommodate the observed demand efficiently, at least 4 TLOF pads and 36 gates were necessary. Sensitivity analysis further revealed that service times at TLOF pads and gates, as well as the time between a repositioning request and its completion, had the greatest impact on vertiport capacity, while battery charging rate and the number of pre-staged UAM aircraft had relatively minor effects under the given simulation settings.
The above literature review shows that the vertiport capacity has been estimated differently depending on the researchers’ criteria and the simulation tools used. While previous studies have used methods such as the star-branch network model, IP, FCFS vertiport scheduling algorithm, and queuing theory, this study utilizes VISSIM with the aim of supporting future research on Mobility as a Service (MaaS). The focus is on modeling more complex environments, such as vertihubs where taxiways are shared, multiple sets of TLOF pads and gates exist, and UAM aircraft are integrated into transit systems with other modes of transportation. In the present study, the vertiport capacity was estimated from the moment that an UAM aircraft reached its gate.
3. Vertiport Design Plan
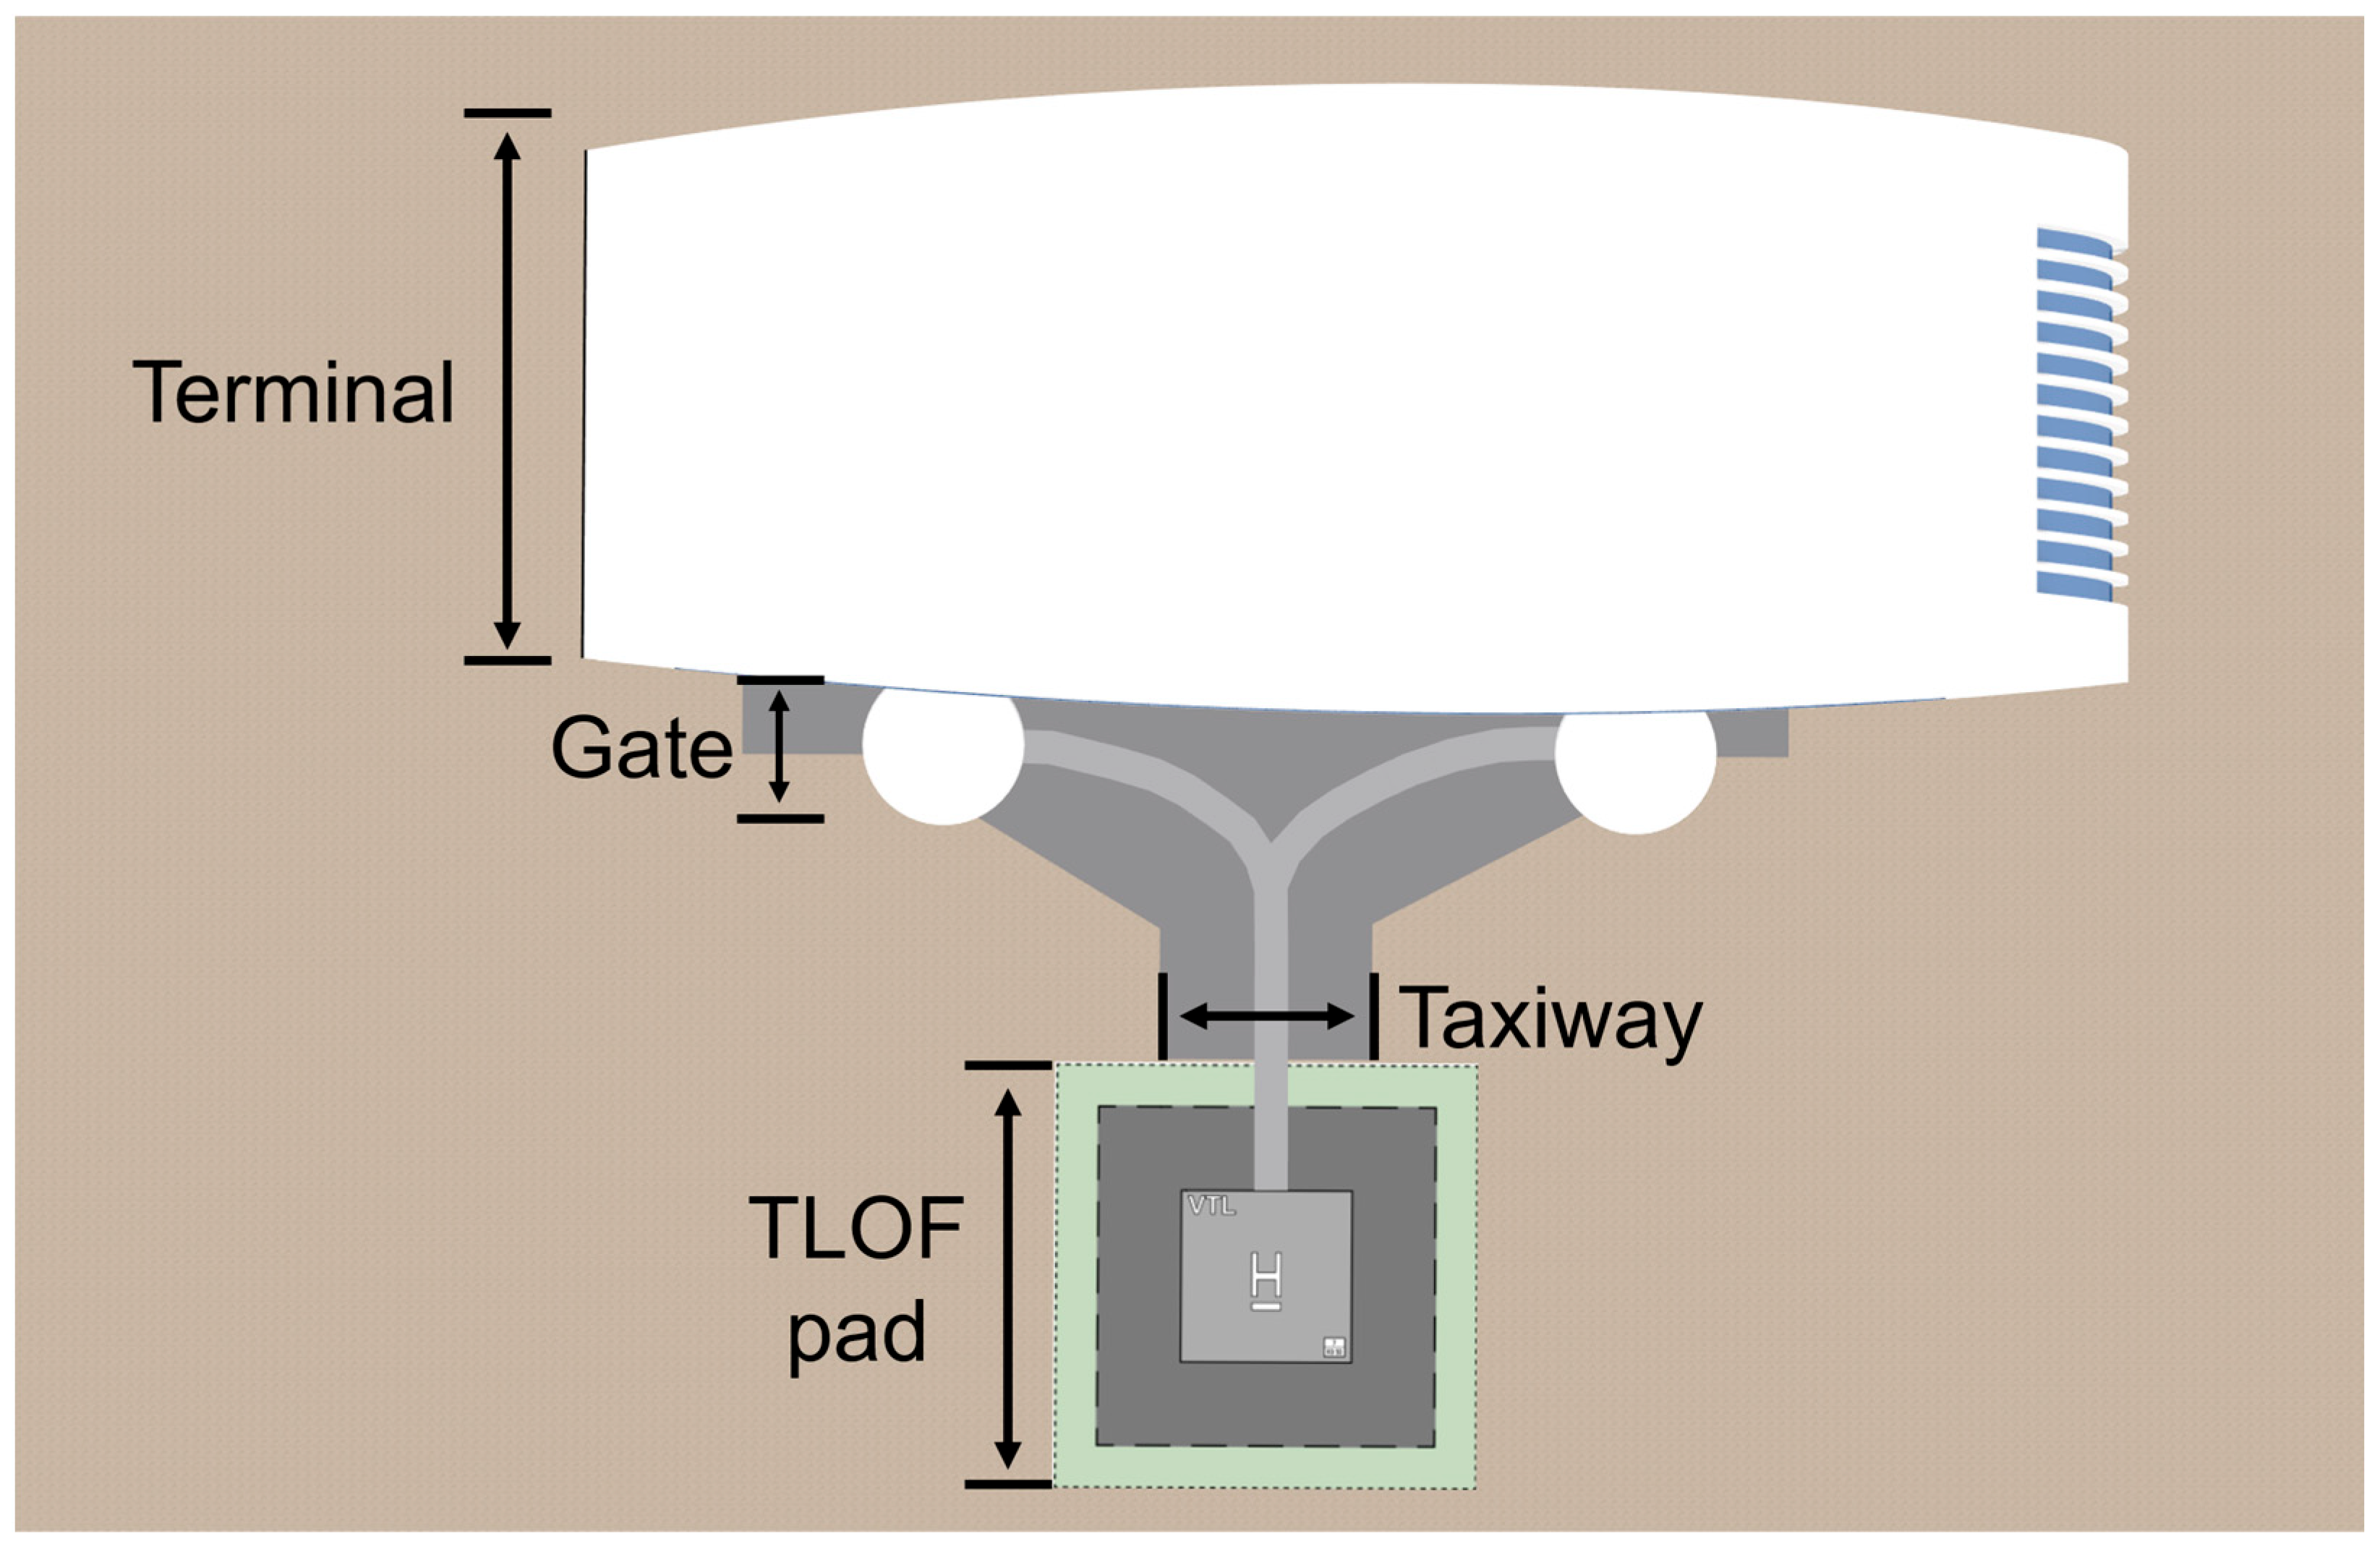
Table 2 summarizes the roles and dimensions of the TLOF pad, gate, and taxiway as defined by the Federal Aviation Administration (FAA). In this study, the TLOF pad and gate were designed by referring to the technical standards for a vertiport [
24], while the taxiway was designed by referring to the technical standards for a heliport [
25].
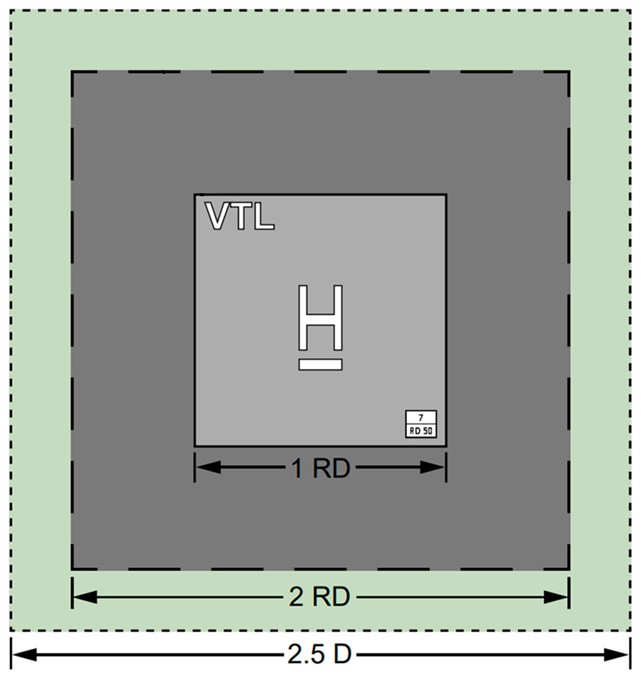
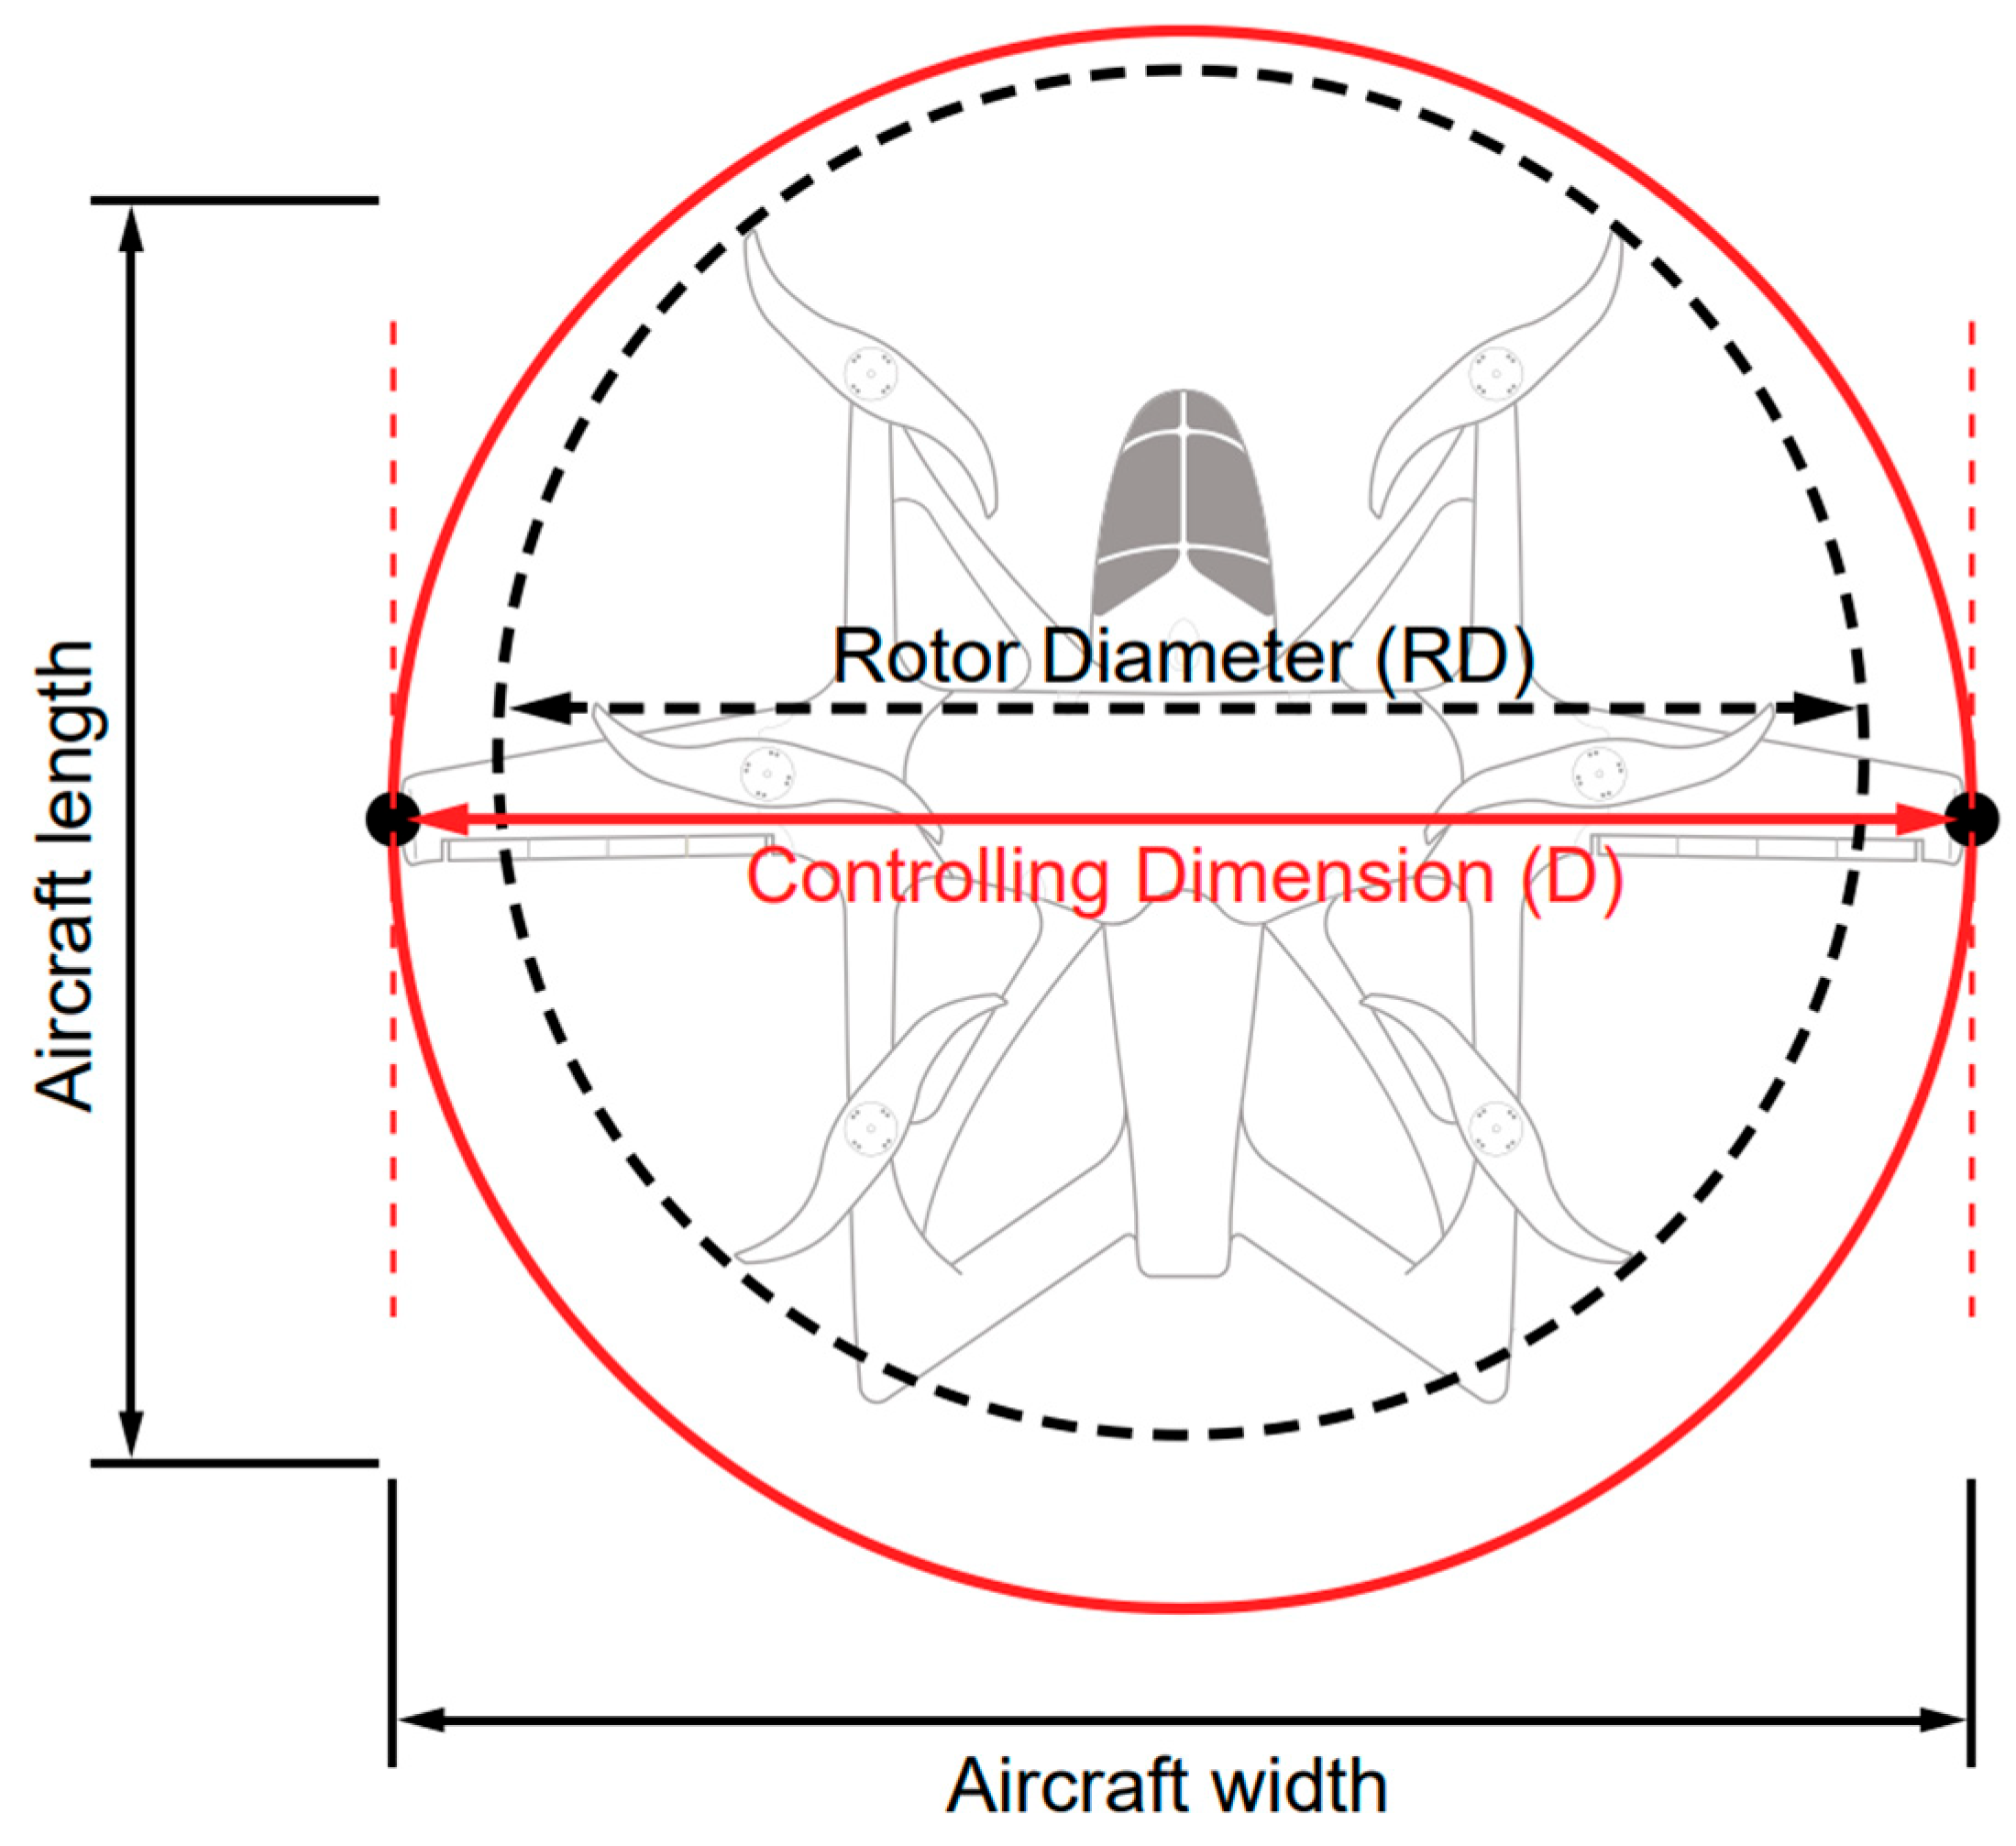
Figure 2 illustrates the controlling dimension D, the diameter of the smallest circle enclosing the entire VTOL aircraft projected onto a horizontal plane, and the rotor dimension RD, the diameter of the smallest circle enclosing all the lift producing propulsion units on a horizontal plane, as defined by the vertiport design standards of the FAA.
Table 3 summarizes a list of various UAM aircraft and their dimensions, which were used to determine D and RD for this study. The sizes of UAM aircraft can be easily found on their manufacturers’ websites and other websites that compile UAM aircraft specifications. However, such websites often do not specify their products’ dimensions, and estimating them using different UAM aircraft models proved challenging. Therefore, D was defined as the largest value among the length, width, and wingspan of the UAM aircraft, while RD was defined as the wingspan of the UAM aircraft. To accommodate all UAM aircraft listed in
Table 3, the vertiport was designed based on the largest D and the largest RD value of 15.24 m each.
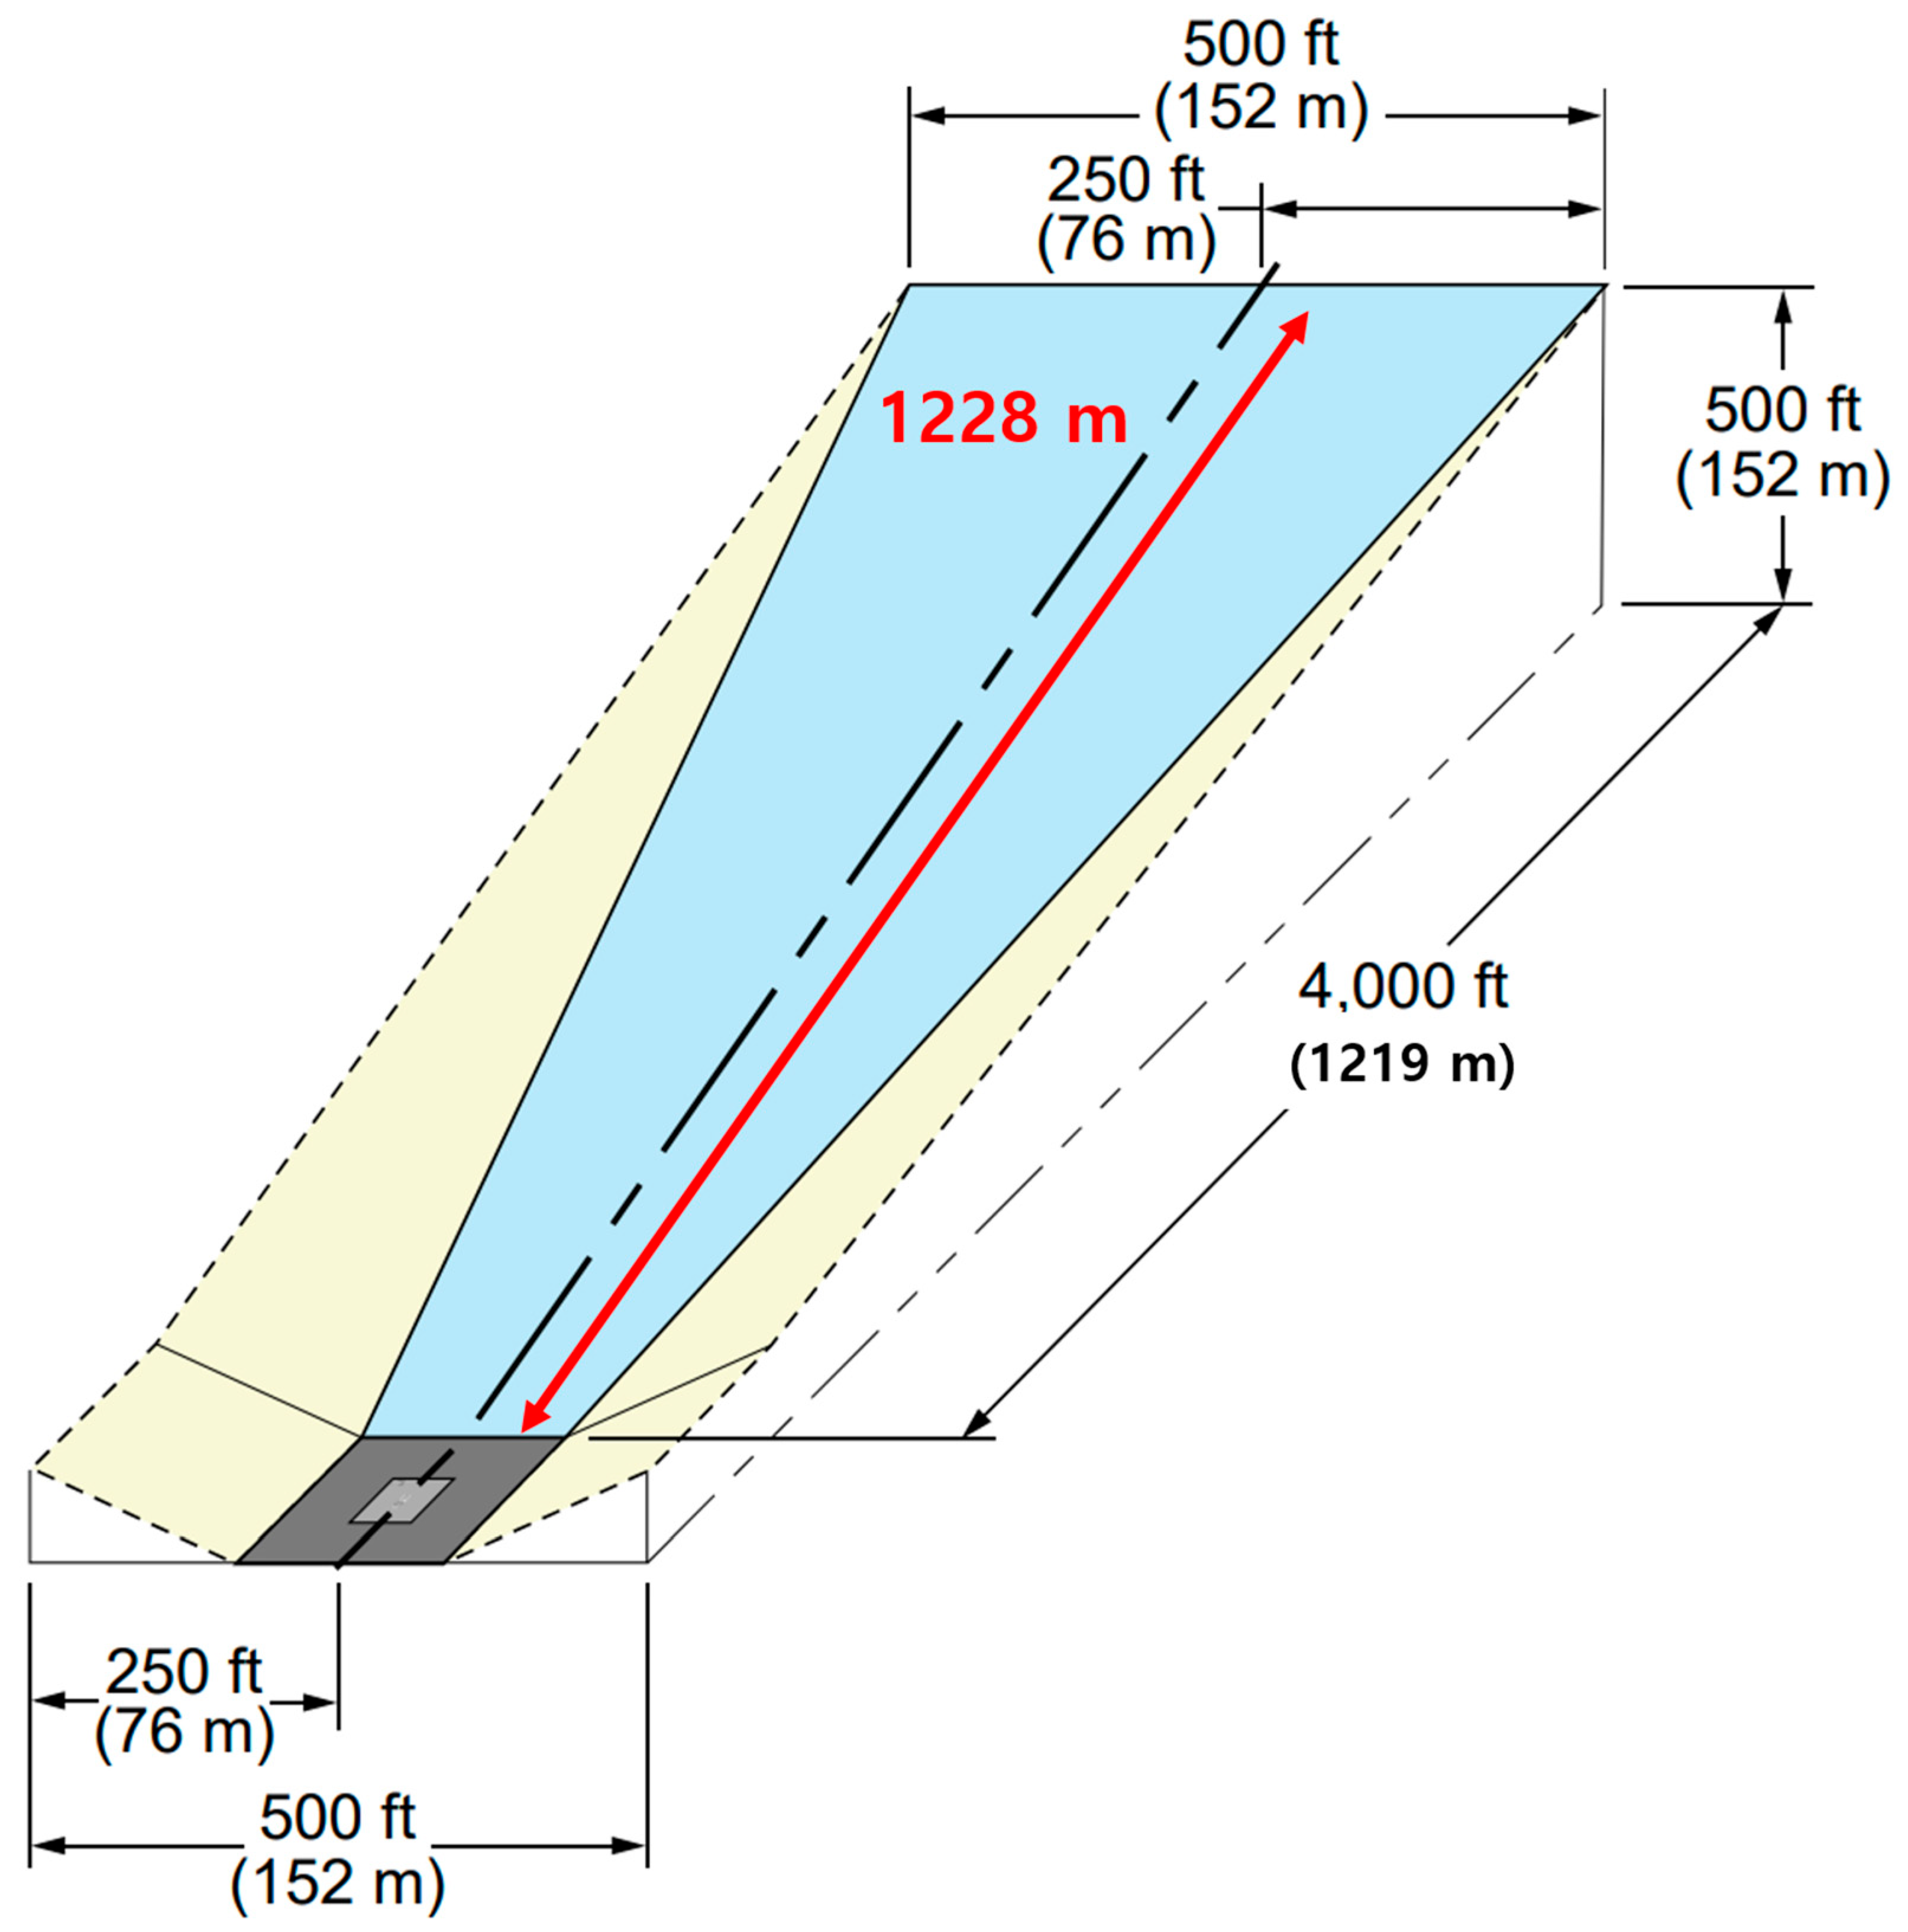
Figure 3 illustrates the approach/departure surfaces for UAM aircraft as recommended by the FAA [
24]. The approach surface represents the landing path from the final approach fix to the TLOF pad and the departure surface represents the takeoff path from the TLOF pad to the departure fix. The horizontal distance was 1219 m at a height of 152 m above the vertiport elevation. Thus, the distance for the takeoff and landing path was calculated to be 1228 m.
Table 4 lists actual helicopters of similar size to UAM aircraft and their takeoff and landing speeds. The exact takeoff and landing speeds of UAM aircraft are not clearly specified by their manufacturers; research certifying their airworthiness is ongoing. Therefore, the takeoff and landing speeds of actual helicopters similar in size were used in this study. The average takeoff and landing speed of these helicopters was 17.15 m/s, which was applied in the simulations. Given the takeoff and landing path distance of 1228 m,
TO and
TL were calculated to each be 71.60 s (1.19 min).
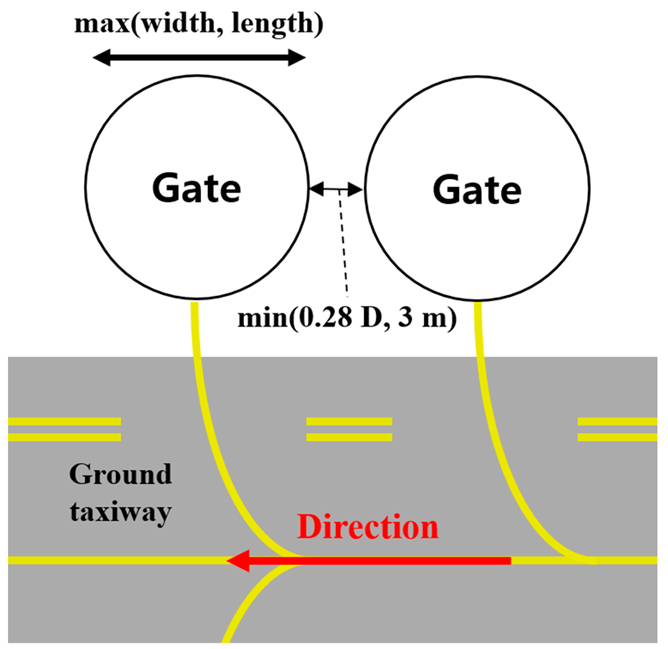
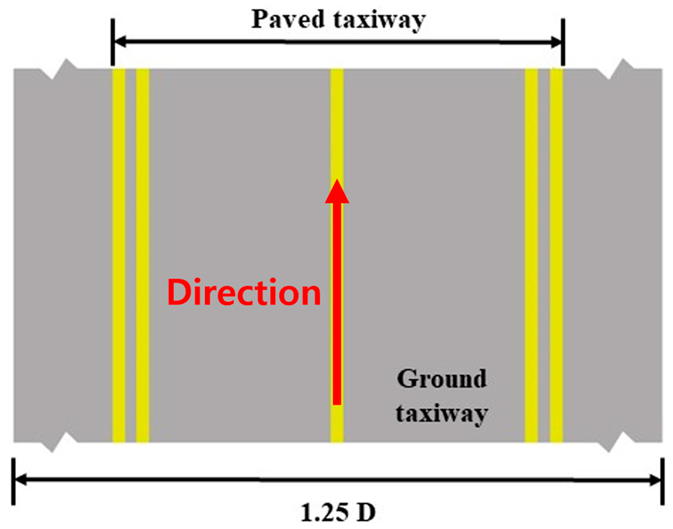
Figure 4 and
Figure 5 shows the 1TLOF 2Gate vertiport and the activities of UAM aircraft as designed in VISSIM. With D = 15.24 m and RD = 15.24 m, the TLOF, FATO, and safety area were designed as a square with side lengths of 15.24 m (RD), 30.48 m (2 RD), and 38.1 m (2.5 D), respectively. According to the guidelines, which state that the gate diameter should be no smaller than the UAM aircraft’s maximum width and length, this study designed each gate as circle with a diameter of 15.24 m (D). The taxiway was a road with a width of 19.05 m (1.25 D). However, the length of the taxiway is determined by the size and available space of the vertiport site. Because there are no clear standards, the taxiway was set to a length of 45.72 m (3 D) for convenience. The taxiing speed was set to 1.34 m/s [
18], which resulted in
TX as 34.12 s (0.57 min).
4. Vertiport Operational Plan
Figure 6 illustrates the network flow established to explain the movement of UAM aircraft at the vertiport as nodes and links. Nodes are defined as points where changes in speed occurred for the UAM aircraft (e.g., final approach fix, TLOF pad, gate, departure fix), and links were defined as paths between nodes and the segments where specific activities occurred (e.g., landing, taxi in, aircraft turnaround, taxi out, takeoff). The paths were represented by unidirectional arrows. The TLOF pad and each gate were represented by two nodes in the network flow to distinguish between arrival and departure operations.
The network flow was constructed in VISSIM as follows:
The arriving UAM aircraft is generated at the final approach fix and lands on the TLOF pad.
The UAM aircraft taxis to the gate.
The UAM aircraft parks at the gate and performs a turnaround in 600 s (10 min).
After preparing for departure, the UAM aircraft taxis to the TLOF pad.
The UAM aircraft takes off to the departure fix.
When the leading UAM aircraft completes its network flow, the trailing UAM aircraft generated at the final approach fix can then perform step 1. However, if the trailing UAM aircraft has already been generated at the final approach fix but the leading UAM aircraft has not yet completed its network flow or the vertiport is over capacity, the trailing UAM aircraft cannot land. In this case, the trailing UAM aircraft hovers until the leading UAM aircraft departs from the departure fix and creates space. Thus, the trailing UAM aircraft cannot perform step 1 until the vertiport has available capacity.
4.1. Vertiport Capacity Estimation Criteria
UAM aircraft land at the vertiport to allow passengers to board and disembark and to undergo charging and maintenance. All of these activities take place at the gate. Therefore, N was estimated from the moment when an UAM aircraft reached a gate.
Figure 7 illustrates the calculation of the vertiport capacity based on the time an UAM aircraft spends moving and performing a turnaround at each link of its network flow. If
TL,
TX,
TT, and
TO for all UAM aircraft operating at the vertiport are constant, then the time that a single UAM aircraft spends at the vertiport can be represented as ‘1 Cycle’, as shown in Equation (1).
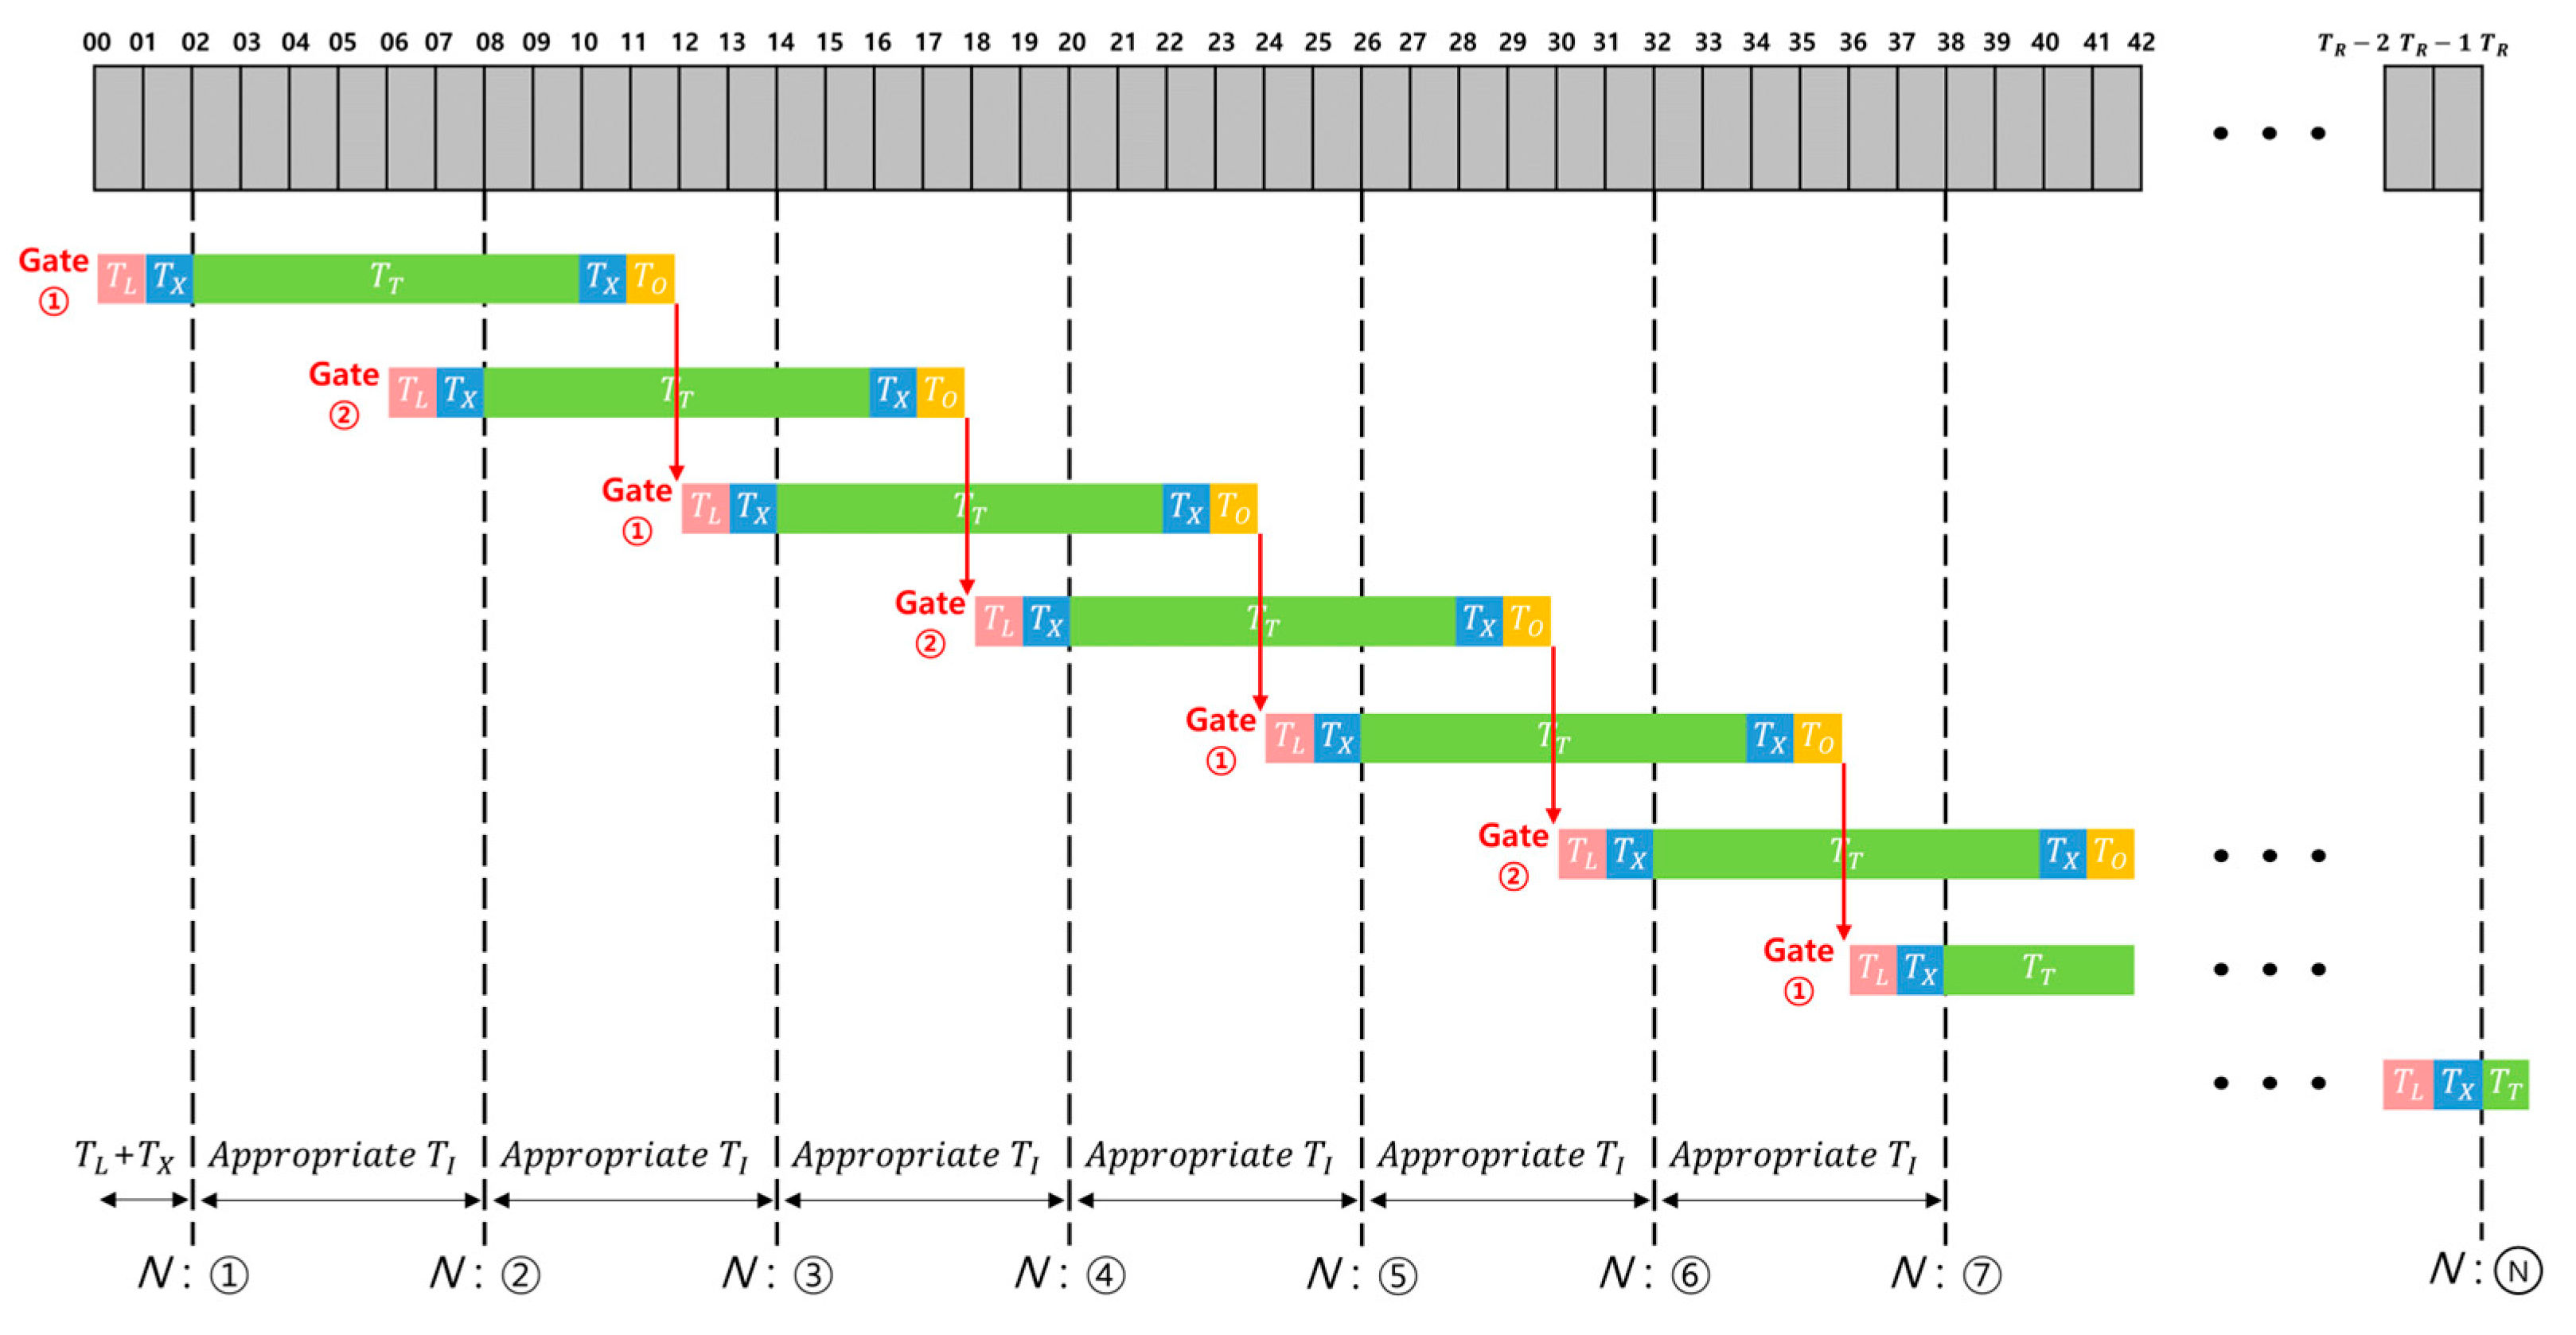
Figure 8 illustrates an example operation of the 1TLOF 2Gate vertiport during the
TR with multiple UAM aircraft cycles using a consistent
TI. The displayed
TI is the most efficient schedule that allows the trailing UAM aircraft to land on the TLOF pad immediately upon arriving at the final approach fix without hovering as soon as the leading UAM aircraft takes off. This
TI was defined as Appropriate
TI. For a 1TLOF 2Gate vertiport, where a TLOF pad is used for both takeoff and landing and two gates are used for turnaround then departure, Appropriate
TI can be expressed as half of 1 Cycle, as shown in Equation (2).
While
Figure 8 provides an example of operating the vertiport with Appropriate
TI, Equation (3) generalizes this operational logic over time by using the
TI as a variable. As shown in
Figure 8, after the initial
TL and
TX, each
N is repeated at intervals of
TI during the
TR, which forms the basis for constructing Equation (3). Equation (4) rewrites Equation (3) to obtain
N, which is determined by the number of UAM aircraft that reach the gate. Because this must be an integer value, any resulting decimal points are truncated to obtain the final capacity.
4.2. Vertiport Operations Using VISSIM
Equation (4) expresses the operation of the vertiport, but it is limited because it does not account for the traffic environment at the vertiport, which includes UAM aircraft delays. Therefore, next the operational plan needed to be designed in VISSIM to account for the traffic environment at the vertiport.
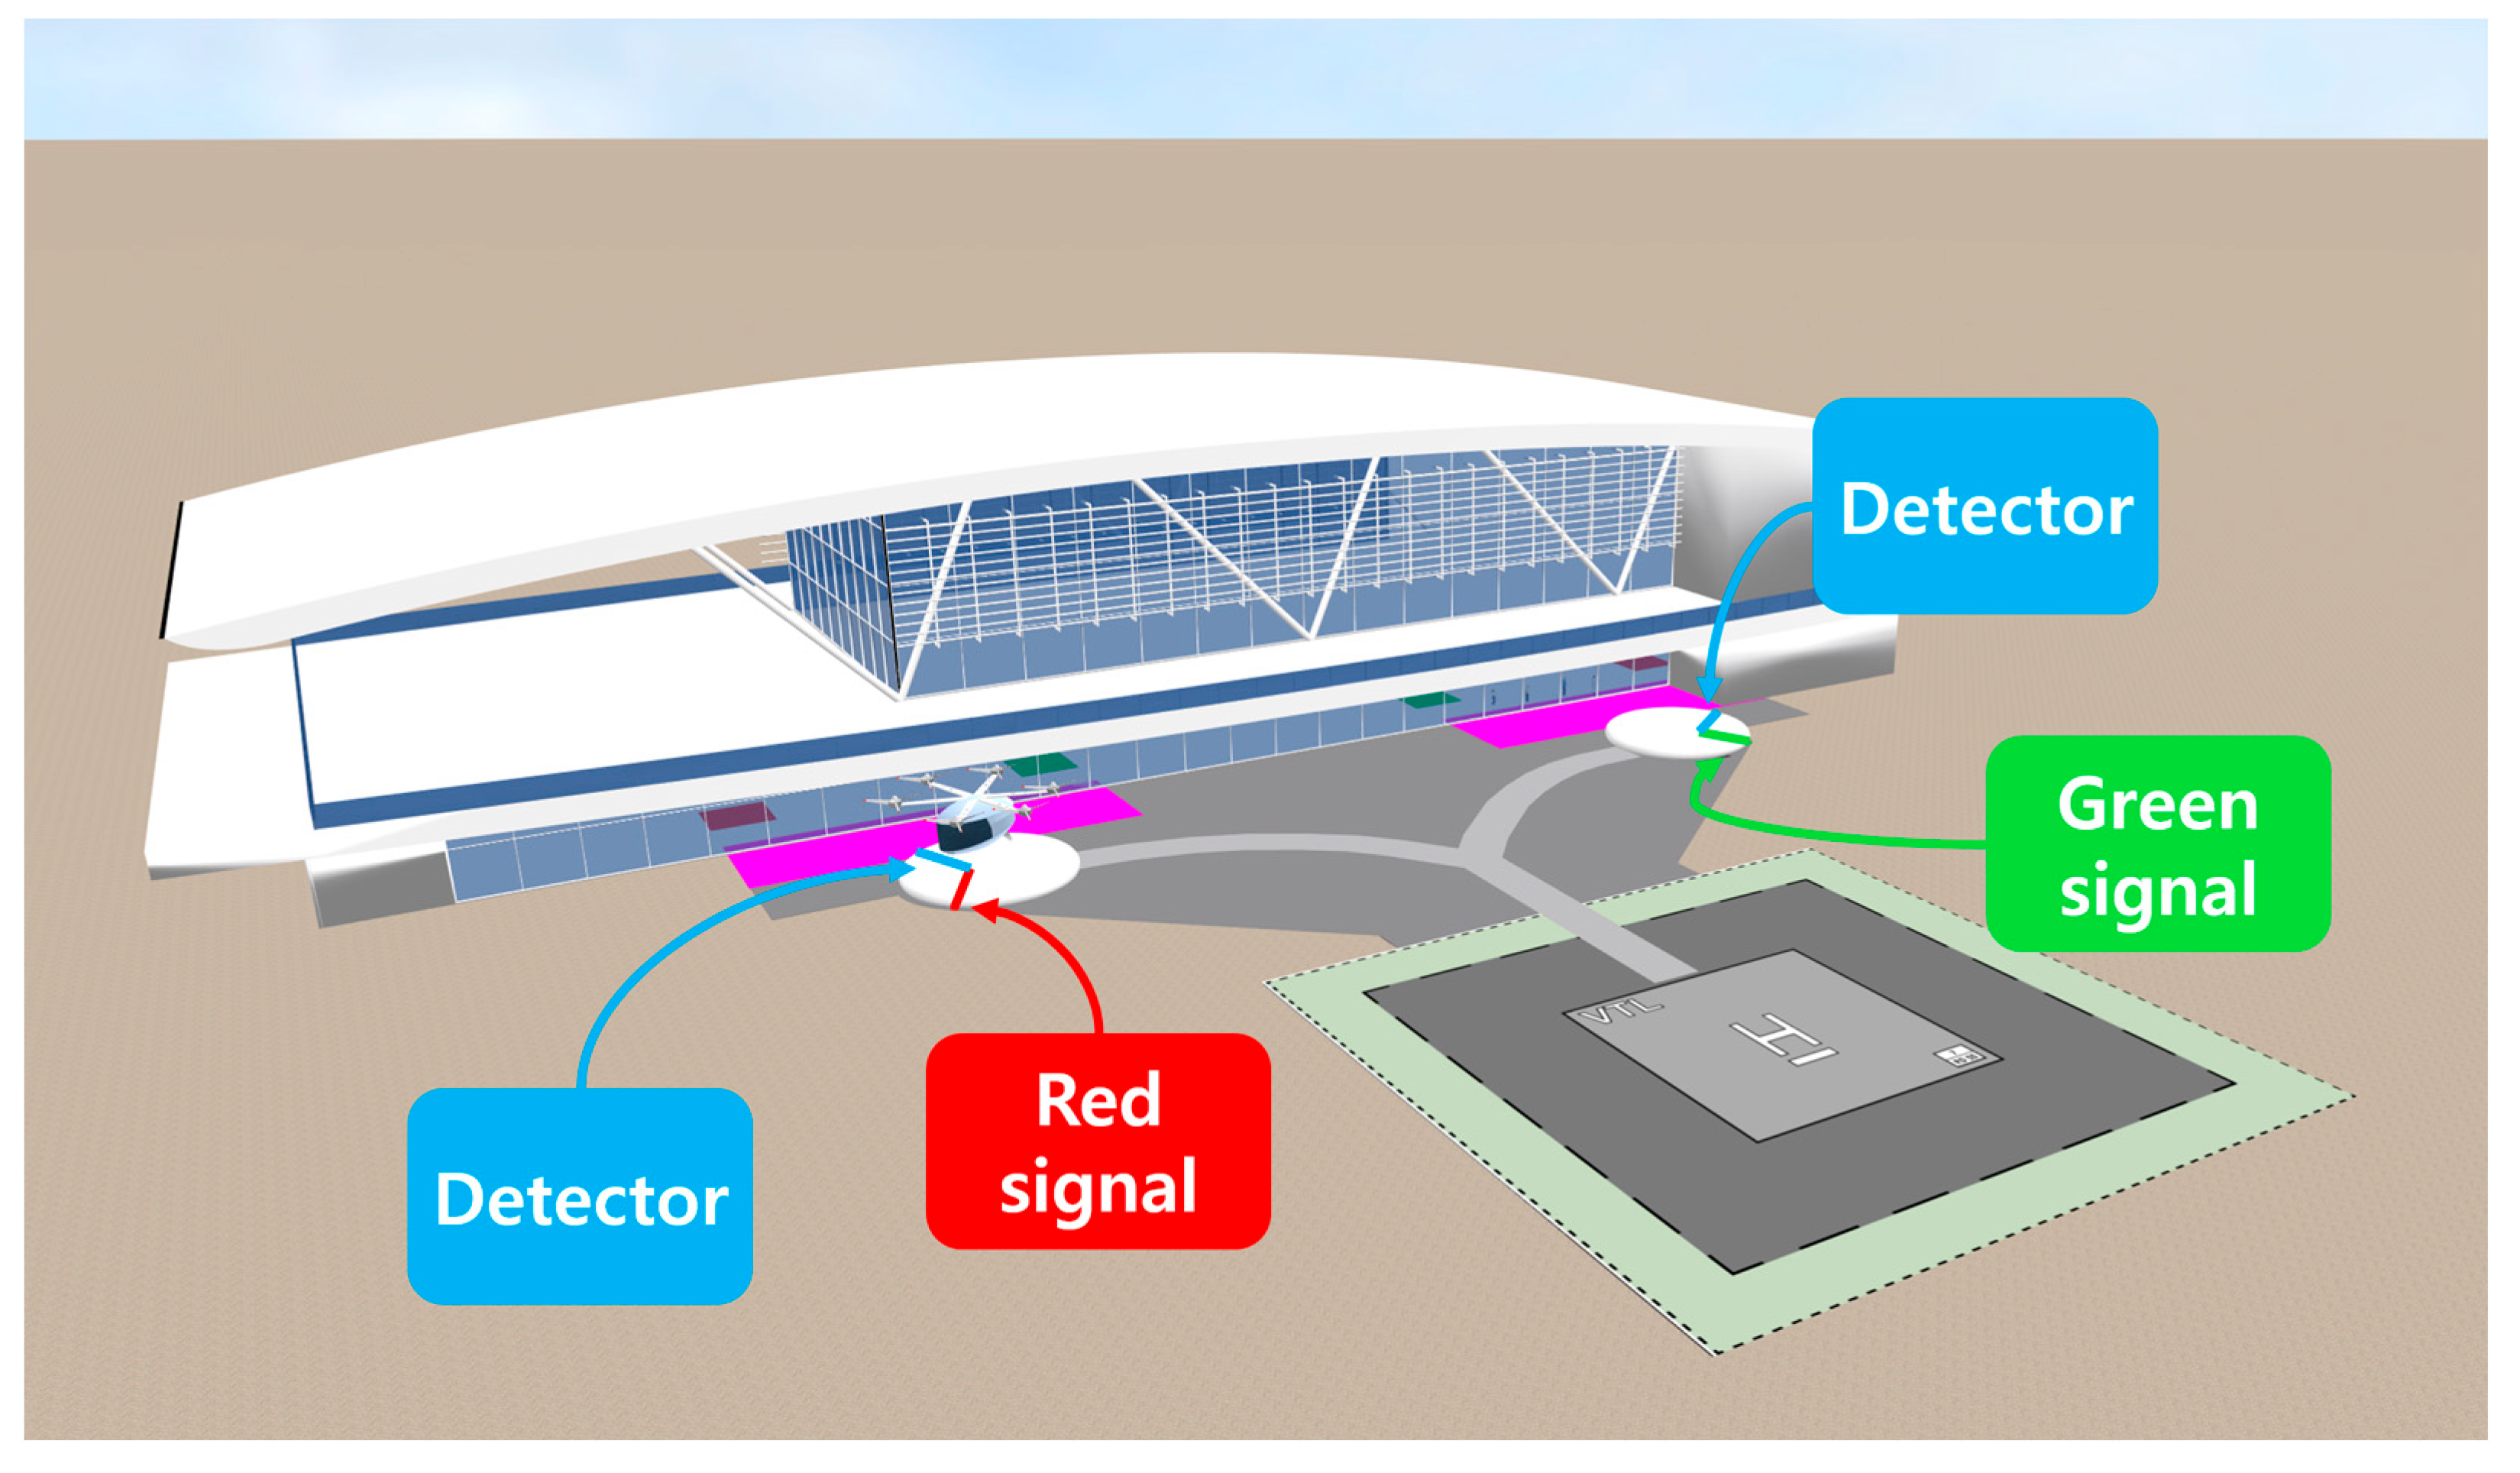
In the simulation, UAM aircraft were generated to follow their assigned network flow. However, they attempted to land on the TLOF pad without considering the existing traffic conditions at the vertiport. To regulate these uncontrolled movements and ensure orderly operations, VISSIM was configured with detectors to identify UAM aircraft presence and a signal control system to manage movement permissions.
Figure 9 shows how this system was applied to the landing and takeoff procedures. When a UAM aircraft arrives at a gate, it is detected by a detector and begins its turnaround process. After completing the turnaround, the UAM aircraft proceeds toward the signal head. Depending on the signal color, the UAM aircraft is allowed to proceed if green, or required to wait if red. Similarly, detectors and the signal control system are also installed at both the final approach fix, where the UAM aircraft begins its network flow, and the departure fix, where it completes its network flow, to regulate traffic clearance within the vertiport environment.
The system managed both the landing-to-ground taxiing and the ground taxiing-to-takeoff procedures based on the occupancy status of gates and taxiways. If these procedures overlapped due to the movements of different UAM aircraft, landing was given priority. However, when both gates were occupied, the system prioritized the departure procedure to free up a gate, after which landing clearance was granted. In this way, the detectors and signal control system were designed to prevent conflicts between UAM aircraft and ensure safe operations within the limited space of the vertiport.
Table 5 summarizes the simulation conditions applied in this study based on the previously explained vertiport design and operational plans. To ensure realistic simulation conditions, the simulations were started with empty vertiports. This approach was taken to accurately analyze the impact of UAM aircraft arrivals and departures without the influence of pre-existing traffic. Starting with empty vertiports avoids any initial bias in delay times and provides a clear assessment of the operational plan’s efficiency from the start.
By substituting the set TL, TX, TO, TR, TT into Equations (1), (2), and (4), the expression for 1 Cycle, Appropriate TI, and the mathematical relationship between N and TI can be derived, as shown in Equations (5)–(7).
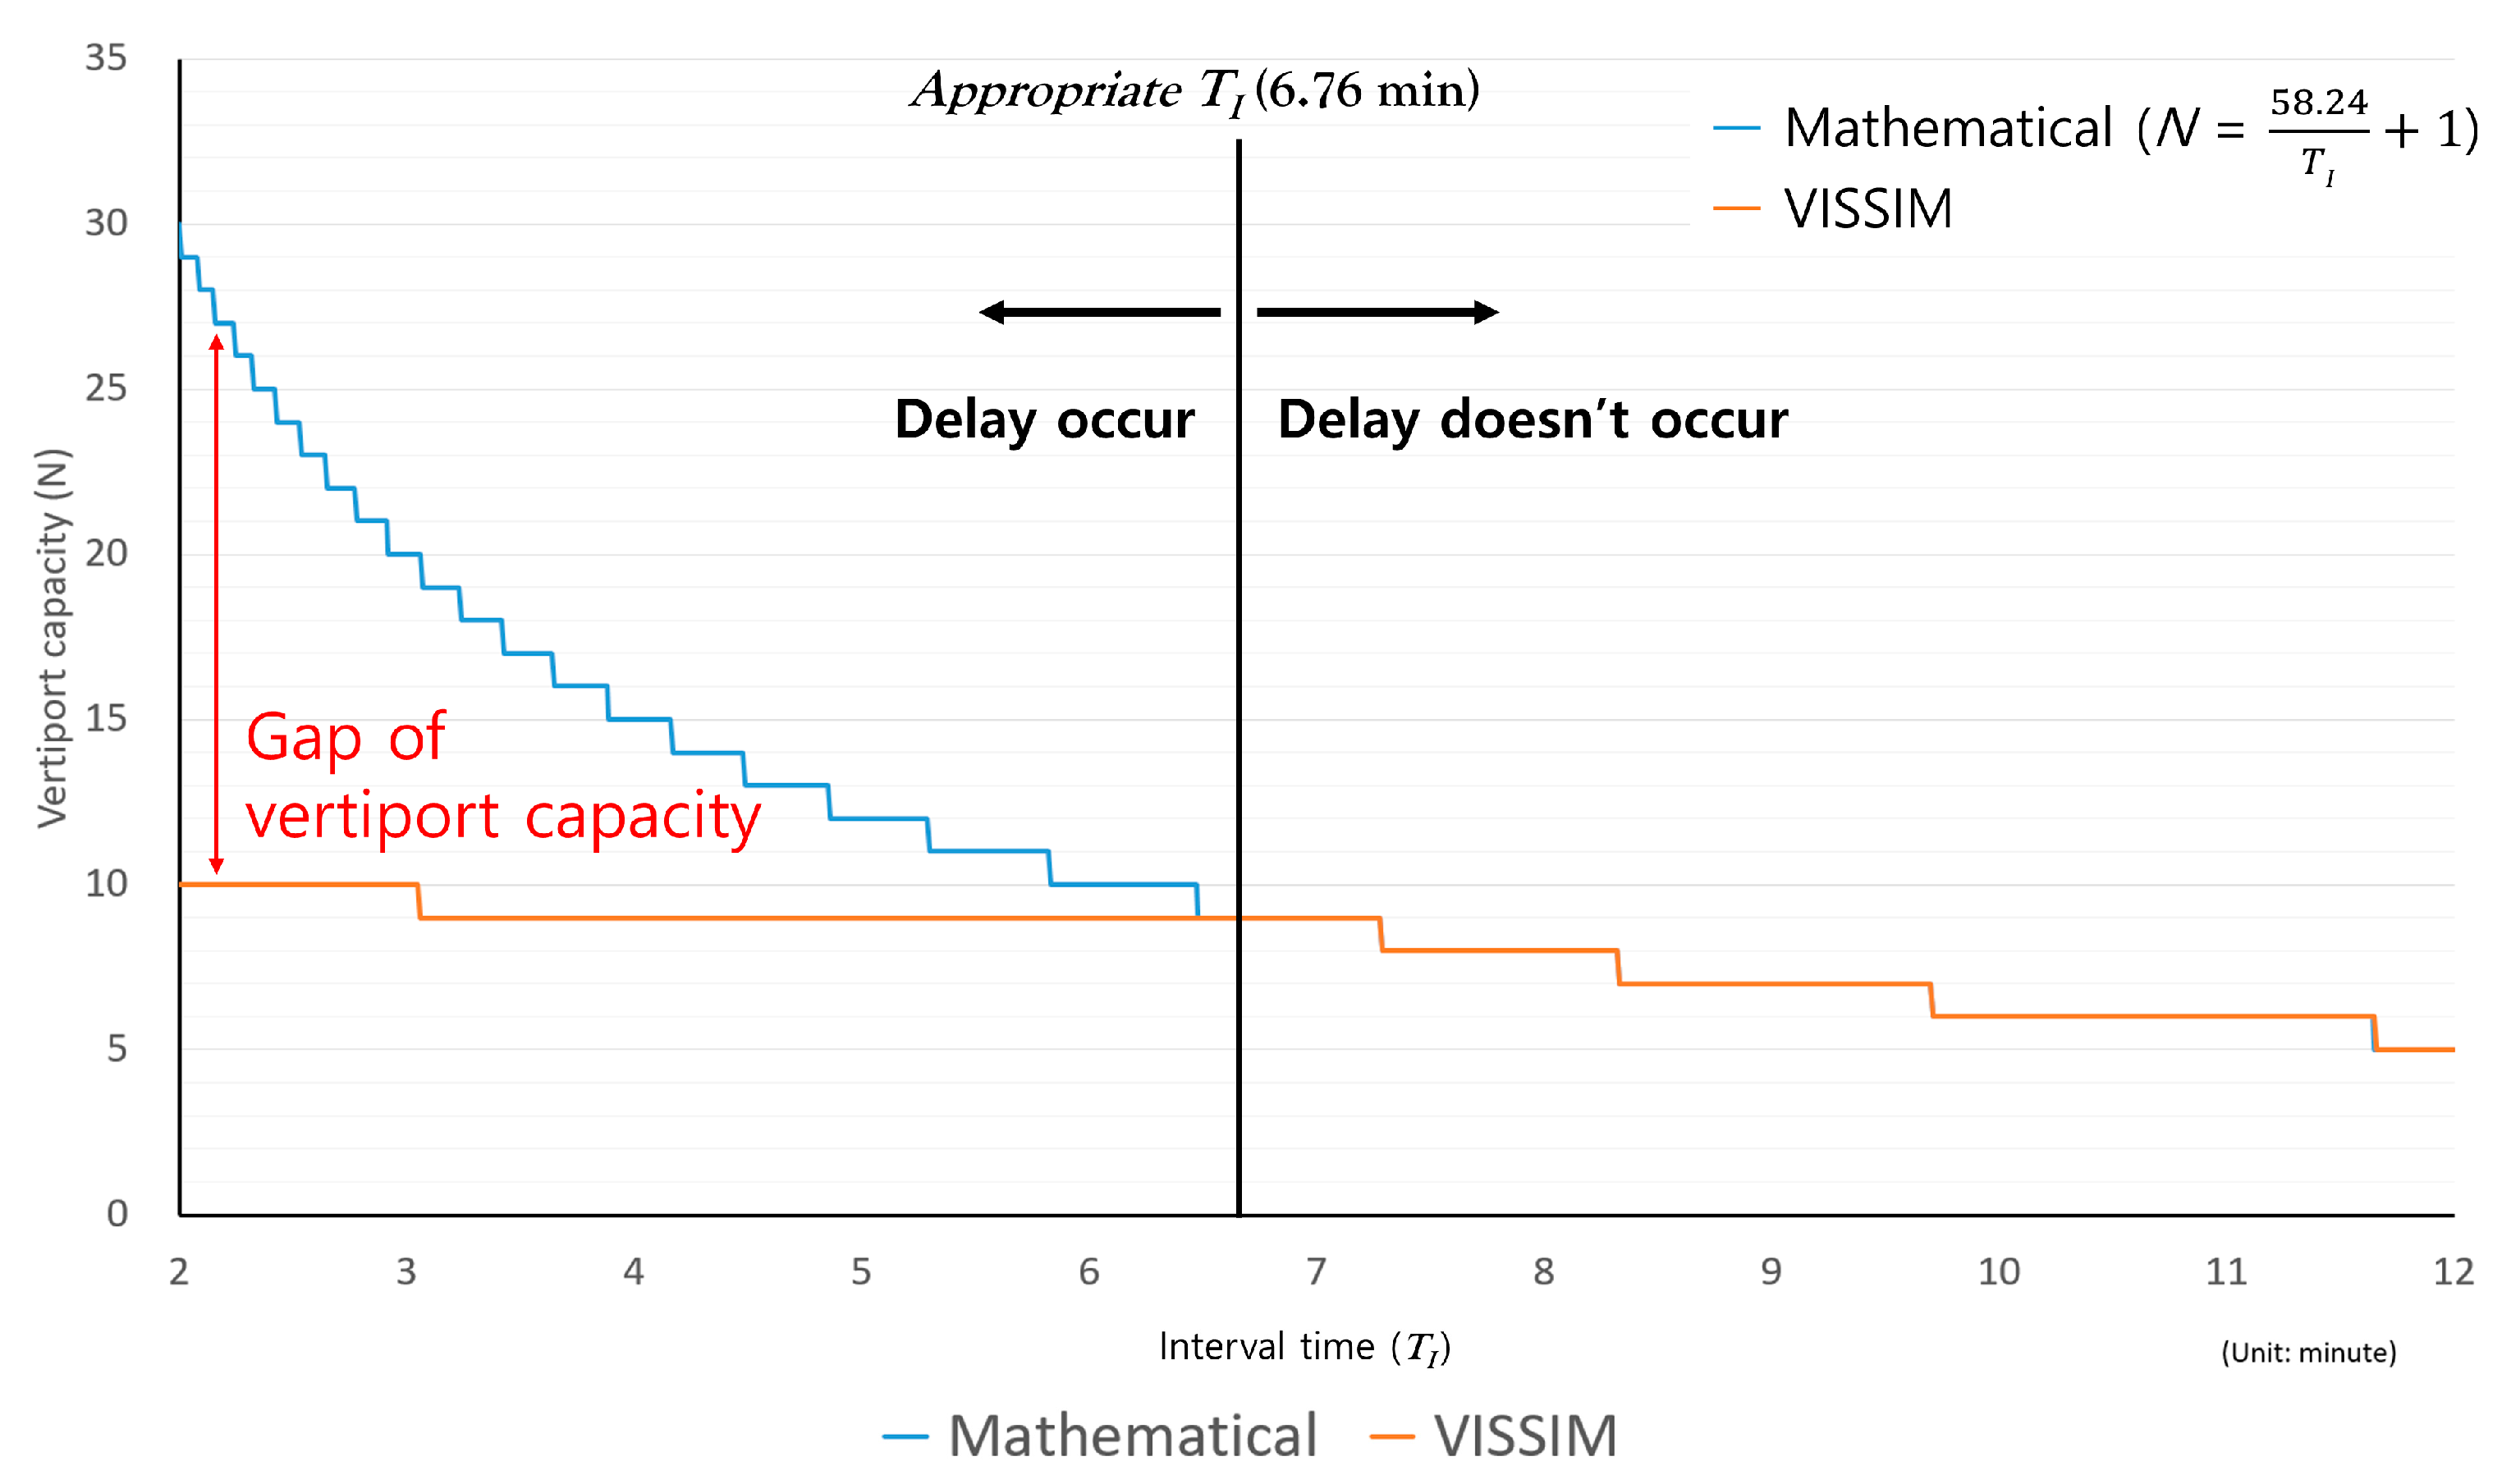
Appropriate TI was calculated as 6.76 min, because this interval ensured that the trailing UAM aircraft could land immediately on the TLOF pad without hovering upon arriving at the final approach fix right after the leading UAM aircraft took off.
Figure 10 compares the relationships between
N and
TI calculated from Equation (7) and obtained by VISSIM simulations.
N is presented as an integer value. The calculation and simulation results differed when the vertiport was operated with a
TI shorter than Appropriate
TI. This caused more UAM aircraft to be generated at the final approach fix than the vertiport could accommodate. Consequently, UAM aircraft experienced delays and could not land at their scheduled times. Further shortening
TI not only increased the delay times but also highlighted a significant divergence between the calculation and simulation results of
N. When the vertiport was operated with a
TI equal to or longer than Appropriate
TI, UAM aircraft were generated at the final approach fix within the capacity of the vertiport. Consequently, the traffic environment at the vertiport did not reach saturation, and UAM aircraft could land immediately upon generation at the final approach fix. Thus, the number of UAM aircraft accommodated by the vertiport did not differ from the mathematical calculations. However, as the
TI increased, fewer UAM aircraft were generated at the final approach fix, which decreased the overall vertiport capacity.
The mathematical calculations of the vertiport capacity did not consider the traffic environment at the vertiport. In contrast, the simulations in VISSIM allowed the traffic environment to be considered, which provided a more accurate representation of the vertiport’s capacity.
4.3. Evaluation of the On-Time Performance
Because UAM operates in urban airspaces, it is greatly affected by the weather conditions, readiness of passengers, battery charging status of the UAM aircraft, and the presence of any defects. Sudden events can disrupt the schedule of the vertiport. To analyze the impact of these events on the traffic environment, the on-time generation and on-time departure of UAM aircraft were simulated in VISSIM. Two cases were considered: (1) without considering on-time performance and (2) considering on-time performance.
On-time generation was defined as the difference between the Actual Time of Final approach fix Arrival (ATFA) and Scheduled Time of Final approach fix Arrival (STFA) at the destination vertiport, caused by factors such as late departure from the origin vertiport or adverse weather conditions. On-time departure was defined as the difference between the Actual Time of Departure (ATD) and Scheduled Time of Departure (STD) from the gate, which could be caused by variations in turnaround time due to factors such as passengers arriving late at the gate or extended charging times for the UAM aircraft.
Table 6 presents the range of on-time generations applied in the simulations, and
Table 7 presents the range of on-time departures. On-time generation was generated in MATLAB based on the mean and standard deviation proportional to the selected
TI for each scenario, which was then applied in VISSIM. Thus, the probability of the ATFA being within 0.25 times
TI from the STFA was 85%, and the probability of it being more than this was 15%. For example, if the STFA was 09:00:00 and
TI was 8 min, there was an 85% probability that the aircraft would arrive within 2 min (2 min = 8 min × 0.25) of 09:00:00 and a 15% probability that it would arrive later than 09:02:00.
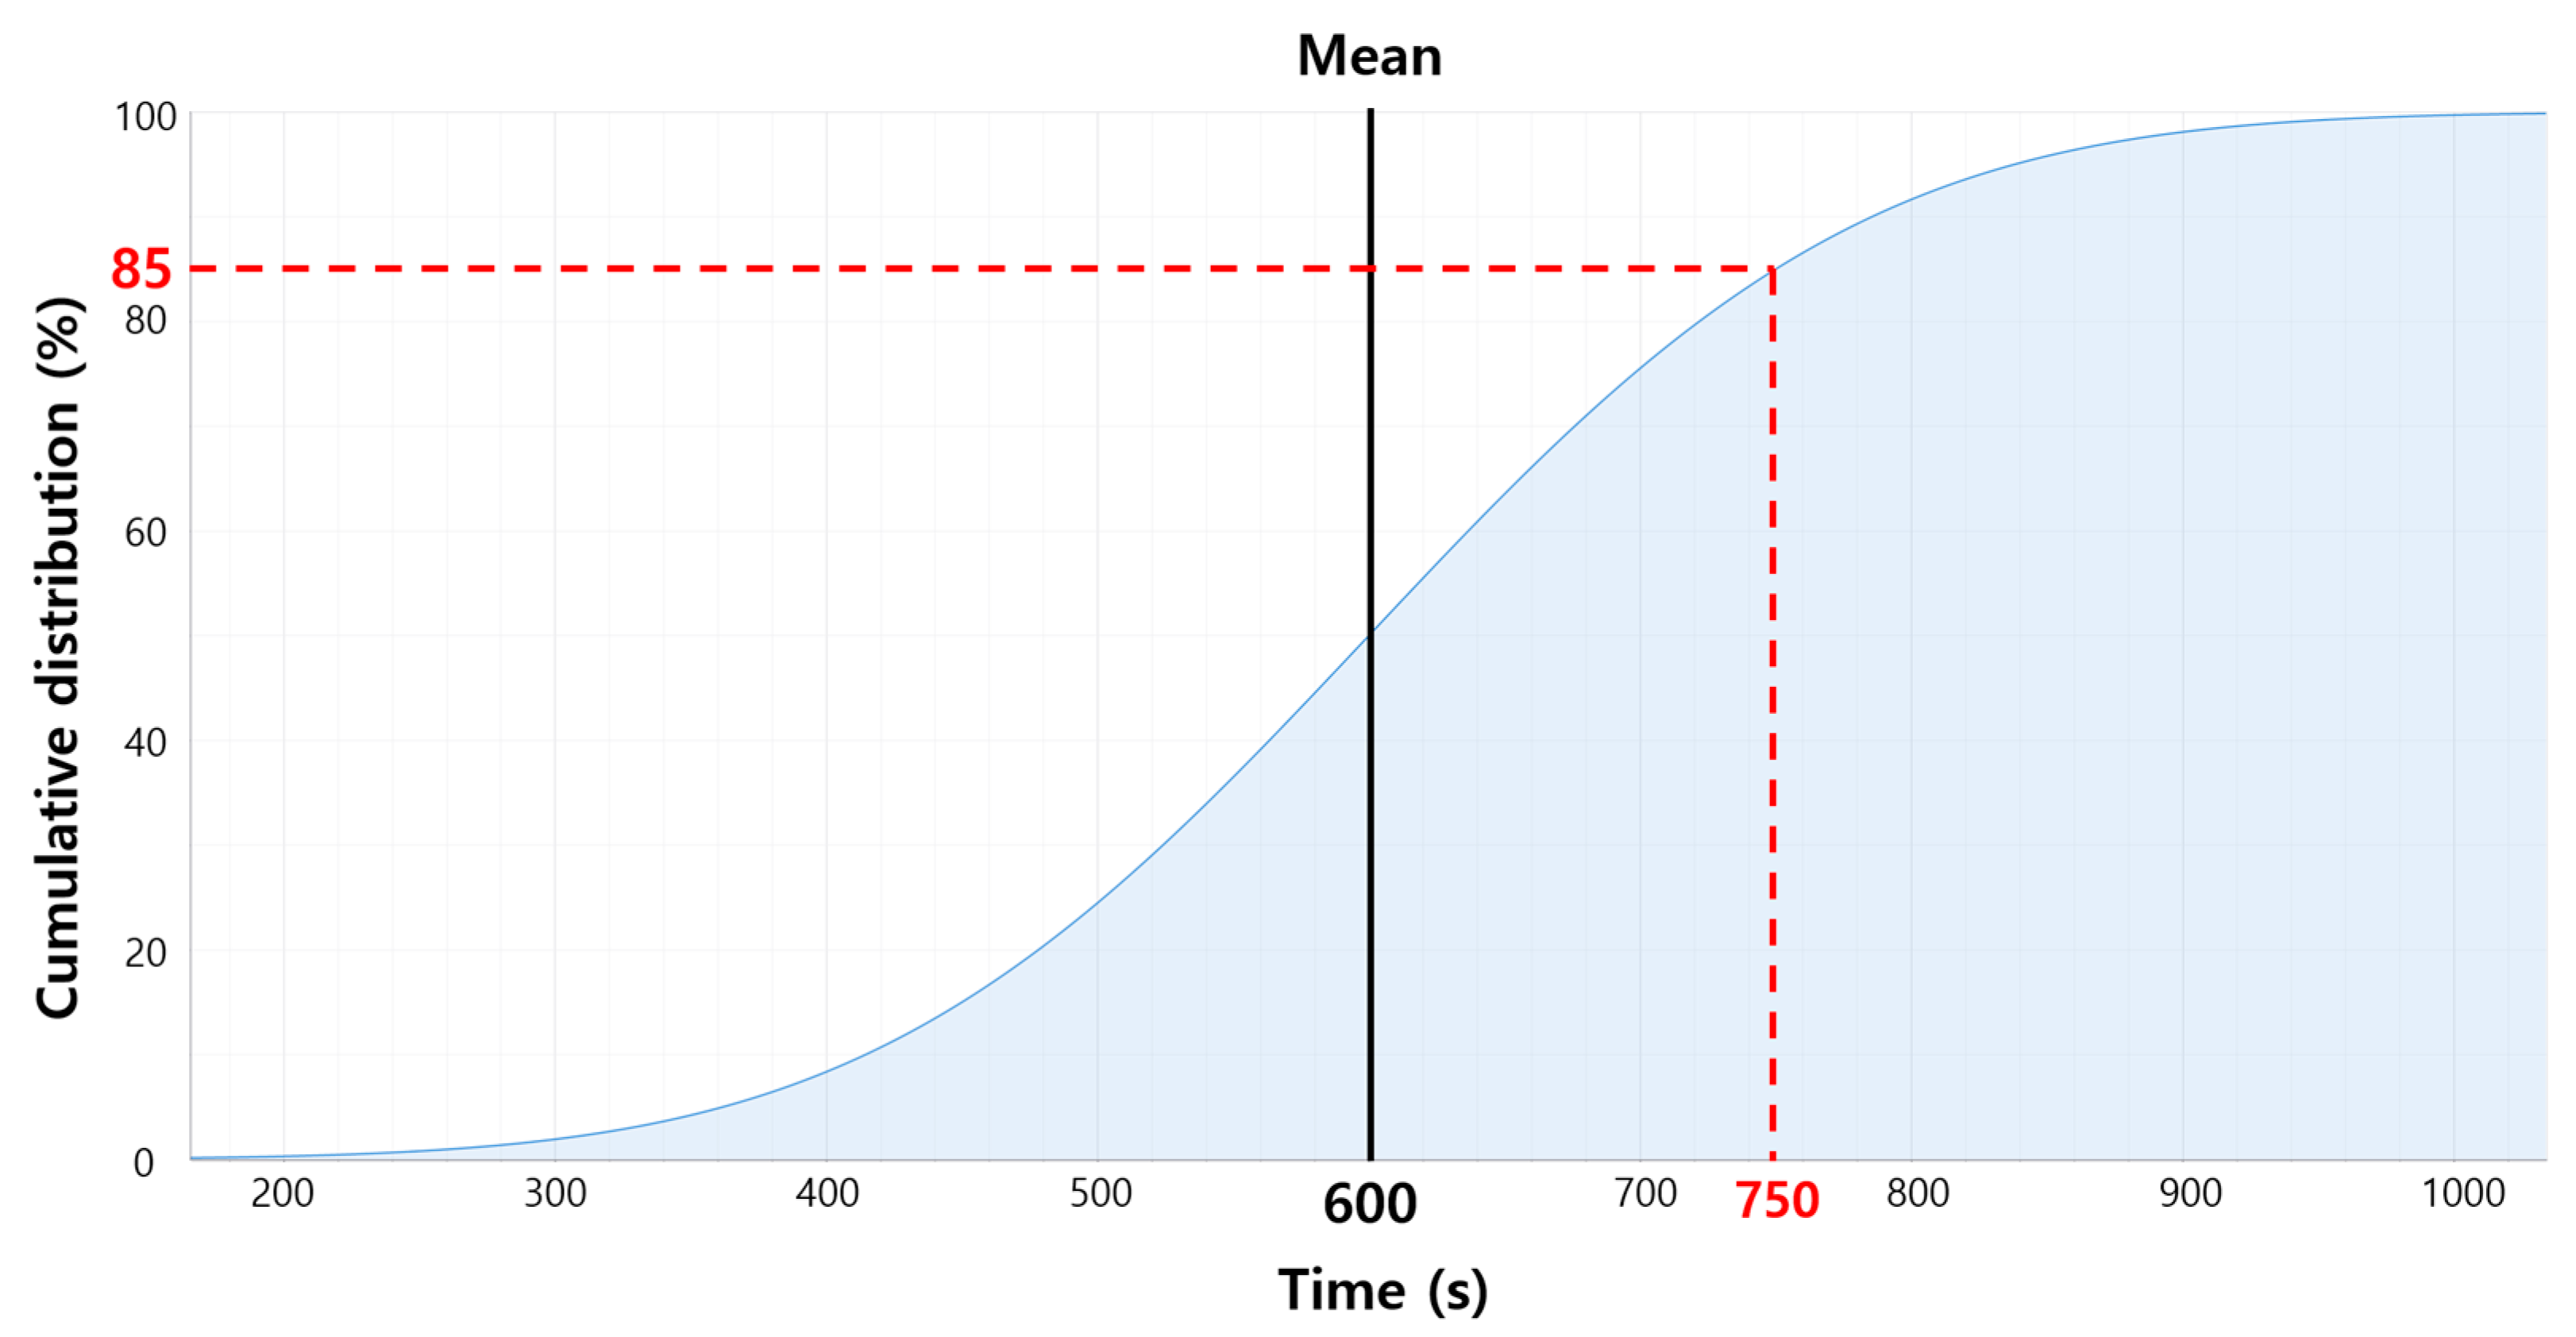
The range of on-time departures was set by using the ‘Time Distribution’ function in VISSIM given that TT was fixed at 10 min for all scenarios. Thus, the probability that the ATD was within 2 min and 30 s of the STD was 85% and the probability of it being more than 2 min and 30 s was 15%. For example, if the STD was 09:00:00, there was an 85% probability that the UAM aircraft would depart within 2 min and 30 s (2 min 30 s = 10 min × 0.25) of 09:00:00 and a 15% probability that it would depart later than 09:02:30.
Figure 11 shows the Cumulative Distribution Function (CDF) applied in VISSIM to represent the range of on-time departures, which was derived by following a normal distribution with a mean of 600 s and a standard deviation of 144.73 s. With
TT scheduled to have a mean of 600 s, the actual turnaround time for UAM aircraft follows a CDF where there is an 85% probability that it will be 750 s (2 min and 30 s later than the mean). Similarly, the on-time generation applied in this study used the mean and standard deviation according to
TI applied in the simulation. The CDF depicts the accumulation of probabilities as the value of the random variable increases, and high probability densities correspond to areas on the CDF curve with steep slopes [
42].
Due to on-time generations, UAM aircraft can be generated earlier than scheduled in the simulation. If a gate is unoccupied, the UAM aircraft will land and then complete the turnaround process at the gate. Similarly, due to on-time departures, UAM aircraft can depart earlier than scheduled. If the TLOF pad is unoccupied, the UAM aircraft will complete the ground taxiing procedure and then take off from the TLOF pad. However, since early arrivals or departures are not classified as delays, these scheduling variations are assigned a delay time of zero.
5. Simulation Results and Discussion
5.1. Relationship Between the Vertiport Capacity and UAM Aircraft Delay Time
TI was set in VISSIM based on Appropriate
TI, which was calculated as 6.76 min. Simulations were conducted for eight different scenarios with shorter (3 ≤
TI ≤ 6 min) and longer (7 ≤
TI ≤ 10 min)
TI values.
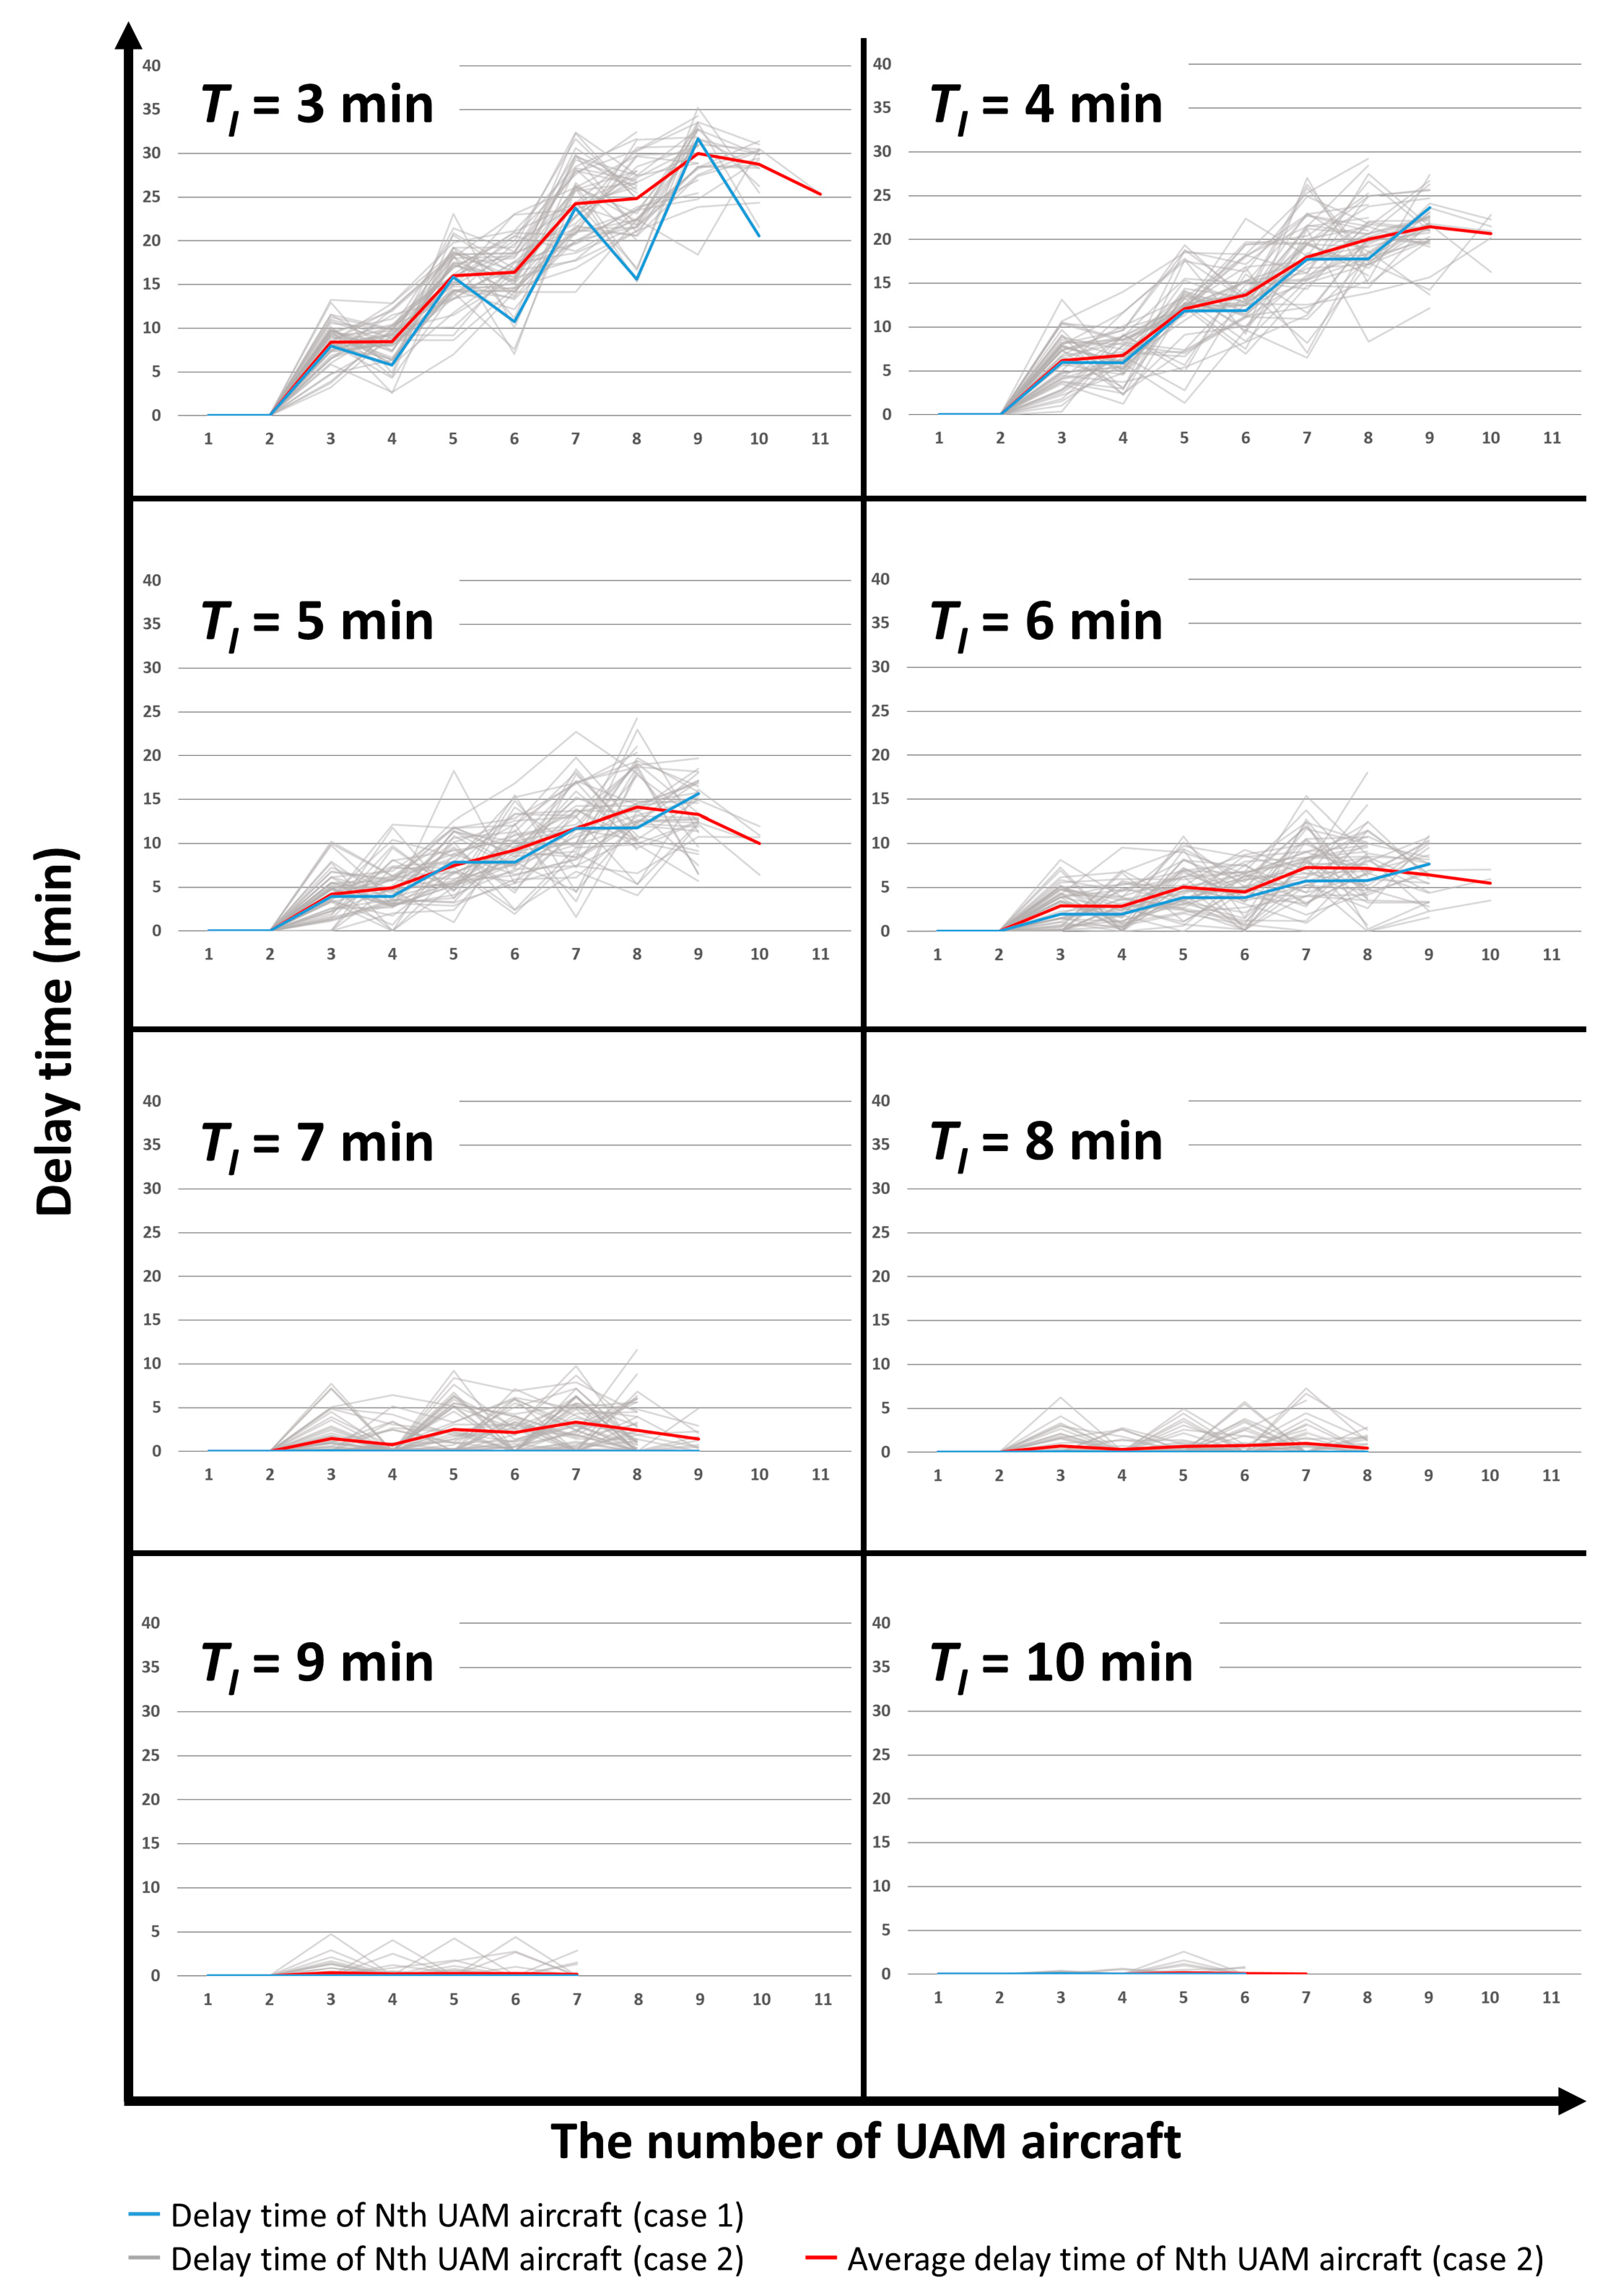
Figure 12 shows the simulation results for each
TI regarding the relationship between the vertiport’s capacity and delay time. The number of UAM aircraft accommodated by the vertiport over 60 min could be determined from the number of the last accommodated UAM aircraft. Simulations were conducted for two cases: (1) without considering on-time performance, and (2) considering on-time performance.
In Case 1, no uncertainty was applied to the departure and arrival of UAM aircraft, which resulted in a single scenario outcome for each TI (blue line). When TI was shorter than Appropriate TI, the delay time increased with the number of UAM aircraft. This was because the shorter TI led to an oversupply of UAM aircraft beyond the vertiport’s capacity, creating a negative feedback loop. When TI was longer than Appropriate TI, the UAM aircraft delay time remained zero regardless of the number of UAM aircraft. This was because the vertiport was being operated at or below its capacity.
In Case 2, uncertainty was applied to the departure and arrival, which led to different outcomes for the vertiport’s capacity and UAM aircraft delay time for each scenario, even with the same TI. For this study, 50 scenarios with on-time performance were generated for each TI (gray lines), and the average delay time of the Nth UAM aircraft for each scenario is shown in the figure (red line).
5.2. Analysis of Simulation Results
Table 8 and
Table 9 summarize the simulation results for Case 1 and Case 2, respectively, and the data visualized in
Figure 12 has been quantified in these tables. The objective of this study was to determine the most efficient operational plan by maximizing the vertiport’s capacity and minimizing the UAM aircraft delay time. Case 1 and Case 2 were compared to analyze the effect of the traffic environment at the vertiport with and without on-time performance being considered. Case 2 was based on the results from operating 50 scenarios for each
TI. The capacity values in brackets represented the number of scenarios that achieved those capacities, with a total of 50 scenarios for each
TI. The delay times of all UAM aircraft accommodated by the vertiport were categorized in exclusive 5-min ranges (e.g., 0 ≤ delay time < 5) and calculated as a percentage of the total delay times for each operational
TI.
5.2.1. Case 1
When the vertiport was operated with TI values of 3–6 min, delays occurred. For instance, with a TI of 3 min, even though the vertiport achieved a maximum capacity of 10 UAM aircraft/hour, it experienced major delays. This was because trailing UAM aircraft continued being generated at the final approach fix even as leading UAM aircraft were undergoing turnaround at the gate. This TI resulted in an average delay of 12.7 min and a maximum delay of 31.7 min, delay times which were much higher compared to other TI values.
When the vertiport was operated with TI values of 7–10 min, no delays occurred. At a TI of 7 min, the vertiport capacity was 9 UAM aircraft/hour, which was the second-highest among the TI values. Operation was efficient because trailing UAM aircraft generated at the final approach fix could land on the TLOF pad and move to the gate immediately as the leading UAM aircraft had already completed its turnaround and departed from the departure fix.
Overall, the vertiport was most efficient when operating at a TI of 7 min. Although the capacity was less than operation at a TI of 3 min, it matched the capacity when the vertiport was operated with TI values of 4–6 min while not allowing any delays.
5.2.2. Case 2
Because of the uncertainty of the on-time performance, the vertiport capacity and UAM aircraft delay times varied across different scenarios even under the same operational conditions. For example, at a TI of 4 min, the vertiport capacity was 8 UAM aircraft/hour in 11 scenarios, 9 UAM aircraft/hour in 33 scenarios, and 10 UAM aircraft/hour in 6 scenarios.
When the vertiport was operated with TI values of 3–5 min, more UAM aircraft were generated at the final approach fix than the vertiport could accommodate. Consequently, more than 30% of the UAM aircraft experienced delays of over 10 min. Although the vertiport’s capacity was high, the maximum delay times were 24–35 min. Over time, the increased hovering time of UAM aircraft at the final approach fix led to an unstable traffic environment at the vertiport.
When the vertiport was operated with TI values of 6–7 min, over 60% of delay times were within 5 min. Similar to the scenarios with shorter TI values, the hovering time of UAM aircraft at the final approach fix increased over time. However, most delay times remained below 5 min and averaged 1.6–3.9 min. Thus, the impact of leading UAM aircraft on trailing UAM aircraft was greatly reduced. Among the 50 scenarios conducted for each TI, there were 27 scenarios at a TI of 6 min and 13 scenarios at a TI of 7 min in which the vertiport capacity was ≥9 UAM aircraft/hour, which indicated a stable traffic environment. The maximum UAM aircraft delay times were 11.6–18 min. Thus, the most efficient operation of the vertiport in terms of maximizing vertiport capacity occurred when TI was set to values of 6–7 min.
When the vertiport was operated with TI values of 8–10 min, UAM aircraft were generated at the final approach fix within the vertiport’sw capacity. Even if delays occurred for leading UAM aircraft, the traffic environment at the vertiport remained manageable and trailing UAM aircraft were minimally affected. Although the average vertiport capacity was low, over 98% of the UAM aircraft delays were within 5 min. Therefore, the most efficient operation of the vertiport in terms of minimizing UAM aircraft delay times occurred when TI was set to values of 8–10 min.
5.3. Discussion
This study mathematically calculated the Appropriate TI for a 1TLOF 2Gate vertiport model and conducted simulations in VISSIM by varying the TI to quantitatively analyze vertiport capacity and UAM aircraft delay times. Additionally, by dividing the simulation into Case 1 and Case 2 depending on whether on-time performance was applied, this study evaluated the impact of operational uncertainty on vertiport efficiency under real world conditions.
The key distinction of this study is that it dynamically modeled the entire UAM aircraft network flow of landing, ground taxiing, turnaround, and takeoff using VISSIM. Additionally, the simulation reflected potential interferences and operational conflicts between each procedure, enabling a more realistic evaluation of vertiport capacity and delays. By incorporating on-time performance into the simulation, it was possible to reflect the uncertainty of arrival and departure times and analyze variations in vertiport capacity and delay time across different scenarios, even with the same TI. Based on these results, the study proposed an efficient TI range suitable for real world operations, offering higher practical applicability and greater potential for policy-oriented planning than that of previous studies.
6. Conclusions
In this study, simulations were performed to evaluate the practical capacity of vertiports considering UAM aircraft delay times. The most important contribution of this study is its consideration of the traffic environment at the vertiport and its effect on operational efficiency.
A 1TLOF 2Gate vertiport was modeled in VISSIM, and on-time departure was implemented to apply uncertainty to the times UAM aircraft were generated at the final approach fix and departed after turnaround at the gate. This approach assumes that the actual departure and arrival times of UAM aircraft may differ from the scheduled times due to irregular situations that can occur in real world operations. To analyze the impact of these assumptions on the traffic environment at the vertiport, two simulation cases were considered: (1) without considering on-time performance, (2) considering on-time performance. For each case, simulations were conducted for TI values of 3–10 min. In Case 1, the generated intervals between the UAM aircraft and turnaround time were consistent, resulting in a single scenario for each TI. In Case 2, the generated intervals between UAM aircraft and turnaround time were uncertain, which resulted in 50 scenarios for each TI.
The simulation results were used to identify the most efficient operational environment in terms of the TI, which maximized vertiport capacity while minimizing UAM aircraft delay times. If an efficient operational plan could not be determined using this criterion alone, the delay times of all UAM aircraft accommodated by the vertiport were categorized in 5-min intervals and calculated as a percentage of the total delay times for each operational TI to allow a more detailed assessment. This approach was used to distinguish between scenarios that focused on maximizing vertiport capacity and those focused on minimizing UAM aircraft delay times. In Case 1, the most efficient operation was realized with a TI of 7 min. In Case 2, capacity was maximized when the vertiport was operated with TI values of 6–7 min, while UAM aircraft delay times were minimized with TI values of 8–10 min.
The simulation results can contribute to the development of operational plans that consider the traffic environment at the vertiport and support sustainability by reducing unnecessary ground movement, idling, and delay-related energy consumption. For instance, if the vertiport is operated with a focus on minimizing UAM aircraft delay times, a traffic environment can be established to reduce the impact of delays in leading UAM aircraft on trailing UAM aircraft. This would allow information to be collected on how to apply the parameters and range of on-time performance set in this study to various situations. Based on the day-to-day learning accumulated during the launch stage of UAM operations, the vertiport’s capacity can be gradually increased while optimizing for both throughput and environmental sustainability in the near-term and long-term stages.
This study was limited because it only considered a 1TLOF 2Gate vertiport in the simulations, and it did not account for different operational environments that could arise from adjusting various parameters. These parameters include TL, TX, TT, TO, TR, the range of TI, the number of TLOF pads and gates, and different assumptions related to on-time performance.
Another important assumption of this study is that the trailing UAM aircraft can only begin its network flow after the leading UAM aircraft has completed its own network flow, including takeoff and reaching the departure fix. However, this simulation did not account for the real world possibility that the trailing UAM aircraft could begin landing as soon as the leading UAM aircraft takes off.
One of the strengths of using VISSIM is its flexibility in modeling a wide range of operational scenarios. Once a vertiport is designed within the VISSIM environment, any combination of the above parameters can be modified to reflect regulatory guidelines, such as those set by EASA.
Future research will involve using VISSIM to construct various vertiport configurations, such as vertihubs based on multiple sets of TLOF pads and gates and integrating with other modes of transportation. These efforts aim to support environmentally responsible urban mobility systems. For example, modeling transitions from ground-based transport to UAM in cities with heavy congestion could help design more energy-efficient, low-emission multimodal mobility systems aligned with sustainable urban transport goals. Ultimately, by proposing operational parameters that reduce delay and ground energy use, this study contributes to not only improving the efficiency of UAM operations but also to aligning vertiport planning with broader goals of sustainability and low-impact urban air mobility.


