1. Introduction
Aviation operations typically occur in a hostile environment for aircraft, where they are requested to face several challenges. Such challenges are related to meteorological conditions as well as unpredictable events in the operational environment. Examples of the weather-related challenges are turbulence, wind, snow, icing, fog and low visibility, thunderstorms and lightning, volcanic ash, heavy precipitation, and tornadoes. Such events may lead to consequences that can be of different severity and can lead to operational impacts of various types, ranging from the necessary modification of the working conditions at a tactical level to perturbations of the nominal traffic flow to operational disruptions or even to airspace temporary closure [
1,
2].
Turbulence can be of various types: clear-air turbulence (CAT), thermal, mountain wave, and wake turbulence. The first type (CAT) has recently been attracting attention not only from the aviation community but also from the general public, due to some events that caused severe consequences for passengers and raised understandable concerns among regular aviation users. For instance, the general media gave significant attention to a recent occurrence of CAT on 21 May 2024, over Burma, which affected the Singapore Airlines flight from London (UK) to Singapore, leading to an emergency landing in Bangkok (Thailand) airport, resulting in one person dying and several injured onboard the flight. Additional recent events that captured the attention of public include the one that occurred in March 2023 over Tennessee (USA) which affected a Lufthansa flight from Austin (TX, USA) to Frankfurt (Germany), leading to an emergency landing in Washington Dulles (USA) airport and leaving several people injured onboard, and another that occurred in March 2023 over Mexico affecting a United Airlines flight from Santiago (Chile) to Houston (TX, USA), again leading to several injured people onboard but without requiring alternate emergency airport landing. Other cases that have captured the interest of the public and media can be found in [
3].
These events have increased the feeling that CAT occurrences have been growing in frequency in recent times, due for instance to the multiple effects of climate change, and that additional mitigations at multiple levels (scientific understanding, prediction, and detection, as well as technological mitigation and procedural management) will be needed in the near future to accommodate for such increased challenges and guarantee comfortable and safe flights.
From the scientific point of view, clear-air turbulence (CAT) refers to turbulence that occurs in clear skies, away from visible clouds and storm systems. Unlike other types of turbulence, CAT is invisible and difficult to predict, making it a significant hazard for aviation operations [
4]. CAT typically occurs in regions where there is a significant wind shear, particularly at high altitudes near jet streams, in areas of thermal instability and strong wind gradients between air masses, often due to the interaction between jet streams and lower-altitude air [
5], and is often associated with jet streams, frontal systems, and mountain waves. From the operational point of view, crew and passengers experience CAT events as a bumpy experience during flight occurring when the aircraft is flying through a cloudless sky, which is the main meaning of “clear-air turbulence”. This refers to about 75% of CAT cases, which are experienced in clear weather. Indeed, studies on aviation reports indicate that the remaining 25% of cases may also be experienced in cirrus clouds and haze layers; in any case, the common element is that the occurrence of such an event cannot be predicted by pilots by referring to visual signs allowing them to detect airspace volumes in front of the aircraft where the event is occurring or is going to occur. Typically, in aviation operations, it is experienced that CAT occur above 15,000 feet, when there are drastic changes in wind speed (horizontal or vertical wind shears), often in the vicinity of the jet stream and in patches that, on average, are about 2000 feet deep, 20 nautical miles wide, and 50 nautical miles long. Given the typically wide frontal and lateral extensions of CAT and its limited vertical deep, the practical management of CAT by pilots is usually based on immediate search for smoother air volumes, by climbing or descending. Nevertheless, in the absence of detailed situational awareness, it is obvious that the decision to climb or descend may result delayed or sub-optimal. Practical suggestions are provided in terms of opting to climb, when the external temperature is detected to rise in the next few minutes, opting to descend, if the temperature is falling; if the temperature is stable, both the options are equivalent [
6].
Such considerations clearly indicate that the operational management of CAT needs to be addressed from a scientific point of view first of all, and then, based on improved understanding, more appropriate technological tools need to be designed and implemented in order to allow pilots and air traffic controllers (ATCOs) to predict, detect, characterize, and properly manage CAT occurrences.
The occurrence of CAT has been perceived as more frequent in recent years, and this has motivated further research to investigate if climate change can be deemed responsible for such an increase in the occurrence. It is noteworthy that the climate system is changing due to anthropogenic forcing [
7], leading to an increase in the frequency and strength of turbulence [
7,
8] and, more specifically, a strengthening of the vertical wind shear within jet streams, which causes the clear-air turbulence [
9]. Indeed, several studies point out that CAT will increase in the future due to the climate change. For example, Williams 2017 [
9], which extends the analysis of Williams and Joshi 2013 [
10], investigated an ensemble of 21 clear-air turbulence diagnostics, considering pre-industrial and doubled-CO
2 climate model simulations, highlighting an increase in transatlantic wintertime clear-air turbulence in five strength categories, from light to severe.
Storer et al. (2017) [
11] assessed the future changes in CAT phenomena in eight geographic regions, considering five strength categories and two flight levels, by comparing the results of a climate model simulation performed over the period 2050–2080, under the RCP8.5 scenario, with 30 years of preindustrial simulation. They found a general increase in CAT phenomena, especially in midlatitudes, in all the seasons and for all the flight levels and strength categories investigated. It is noteworthy that some uncertainties still remain that could be managed by using different forcing scenarios and different climate models.
The increase in CAT phenomena has been already observed in recent decades, as investigated by Prosser et al. (2023) [
12], who analyzed global trends over the period 1979–2020 in the ERA5 Reanalysis dataset [
13]. The authors found a large increase in CAT around the midlatitudes at 197 hPa, especially over the North Atlantic and continental United States.
These future variations have to be taken into account by aircraft manufactures and forecasters, in order to prevent an increase in damage to the aircraft and injuries to people onboard [
7]. In this view, enhancing turbulence forecasting is essential in order to improve safety and comfort of passengers and reduce the costs required for compensation [
8]. Indeed, the increase in CAT will lead to bumpier flights; furthermore, flight paths will become more convoluted to avoid more frequent and stronger turbulence, increasing the length of journeys, fuel consumption, and emissions [
10].
The importance of studying CAT was first recognized several decades ago. For instance, in the mid-1960s, the Air Force Flight Dynamics Laboratory conducted the HICAT (High-Altitude Clear-Air Turbulence) project [
14], with the aim to better understand the statistical characteristics of air turbulence and improve aircraft structural design criteria. Upper air wind turbulence was recorded and combined with meteorological forecasts and observations. The data were collected during flights performed with an Air Force U-2 aircraft.
Nowadays, based on the considerations above expressed, it is clear that CAT investigations and operational mitigation by aviation is an even more important and urgent topic. This motivated the present work, which aimed to assess the state of the art and trends in the current scientific knowledge of the phenomenon, the technological means for its prediction, detection, and characterization, and the existing strategies for CAT effects mitigation in aviation operations. The paper is organized in two investigation areas: the first one addresses the scientific comprehension and characterization of the phenomenon, whereas the second one focuses on the technological and operational-related aspects. Based on that, the first area is organized as follows: a propaedeutic analysis of the CAT causes is first reported (
Section 2), followed by a detailed analysis of detection and forecast methods (
Section 3), encompassing both the Numerical Weather Prediction ones and the satellite-based ones. Then, the paper addresses the second investigation area (
Section 4), considering the aviation-related technological and operational aspects, encompassing in a detailed and specific way both the flight and the ground segments.
2. Clear-Air Turbulence Causes
Aircraft turbulence is irregular motion of an aircraft in flight, especially when characterized by rapid up-and-down motion caused by a rapid variation in atmospheric wind velocities. Turbulence intensity is related to the size of the aircraft and varies from light to extreme, passing from annoying bumpiness to severe jolts [
15].
Turbulence can be classified into two types, depending on its underlying causes [
16]:
- -
Convective: due to convective currents that cause vertical motions of rising and sinking air, associated with cumuliform cloud and thunderstorm;
- -
Mechanical: due to obstructions in the wind flow such as buildings or mountains, but also pressure gradient differences, associated with horizontal and vertical wind shear, i.e., a strong and sudden change in wind speed and/or direction over a small area.
Clear-air turbulence is a form of mechanical turbulence that includes all turbulence without any associated visible phenomena. It is an insidious aviation hazard, because it is often encountered unexpectedly and without visual indicators that could warn the pilots. The term CAT is used to indicate medium- or high-level turbulence (normally above 15,000 ft) in regions with significant wind shear; generally, these areas are mostly free of clouds; however, sometimes, cirrus cloud formations could occur.
The main mechanism responsible for CAT formation is the Kelvin–Helmholtz instability (KHI) [
17,
18], which occurs in stable layers when vertical wind shear exceeds a critical value. In particular, it occurs when the following condition is verified [
18]:
where
is the wave number,
and
are the densities of the two layers of fluid,
and
are their respective velocities, and
is the gravitational acceleration. When wind shear
increases strongly, frictional forces within the stable stratified air increase and lead to small vertical disturbances forming a wave-like pattern. Due to the different velocities of the air between wave crest and wave trough, wave tops will overrun the wave base and the waves start to break, leading to CAT.
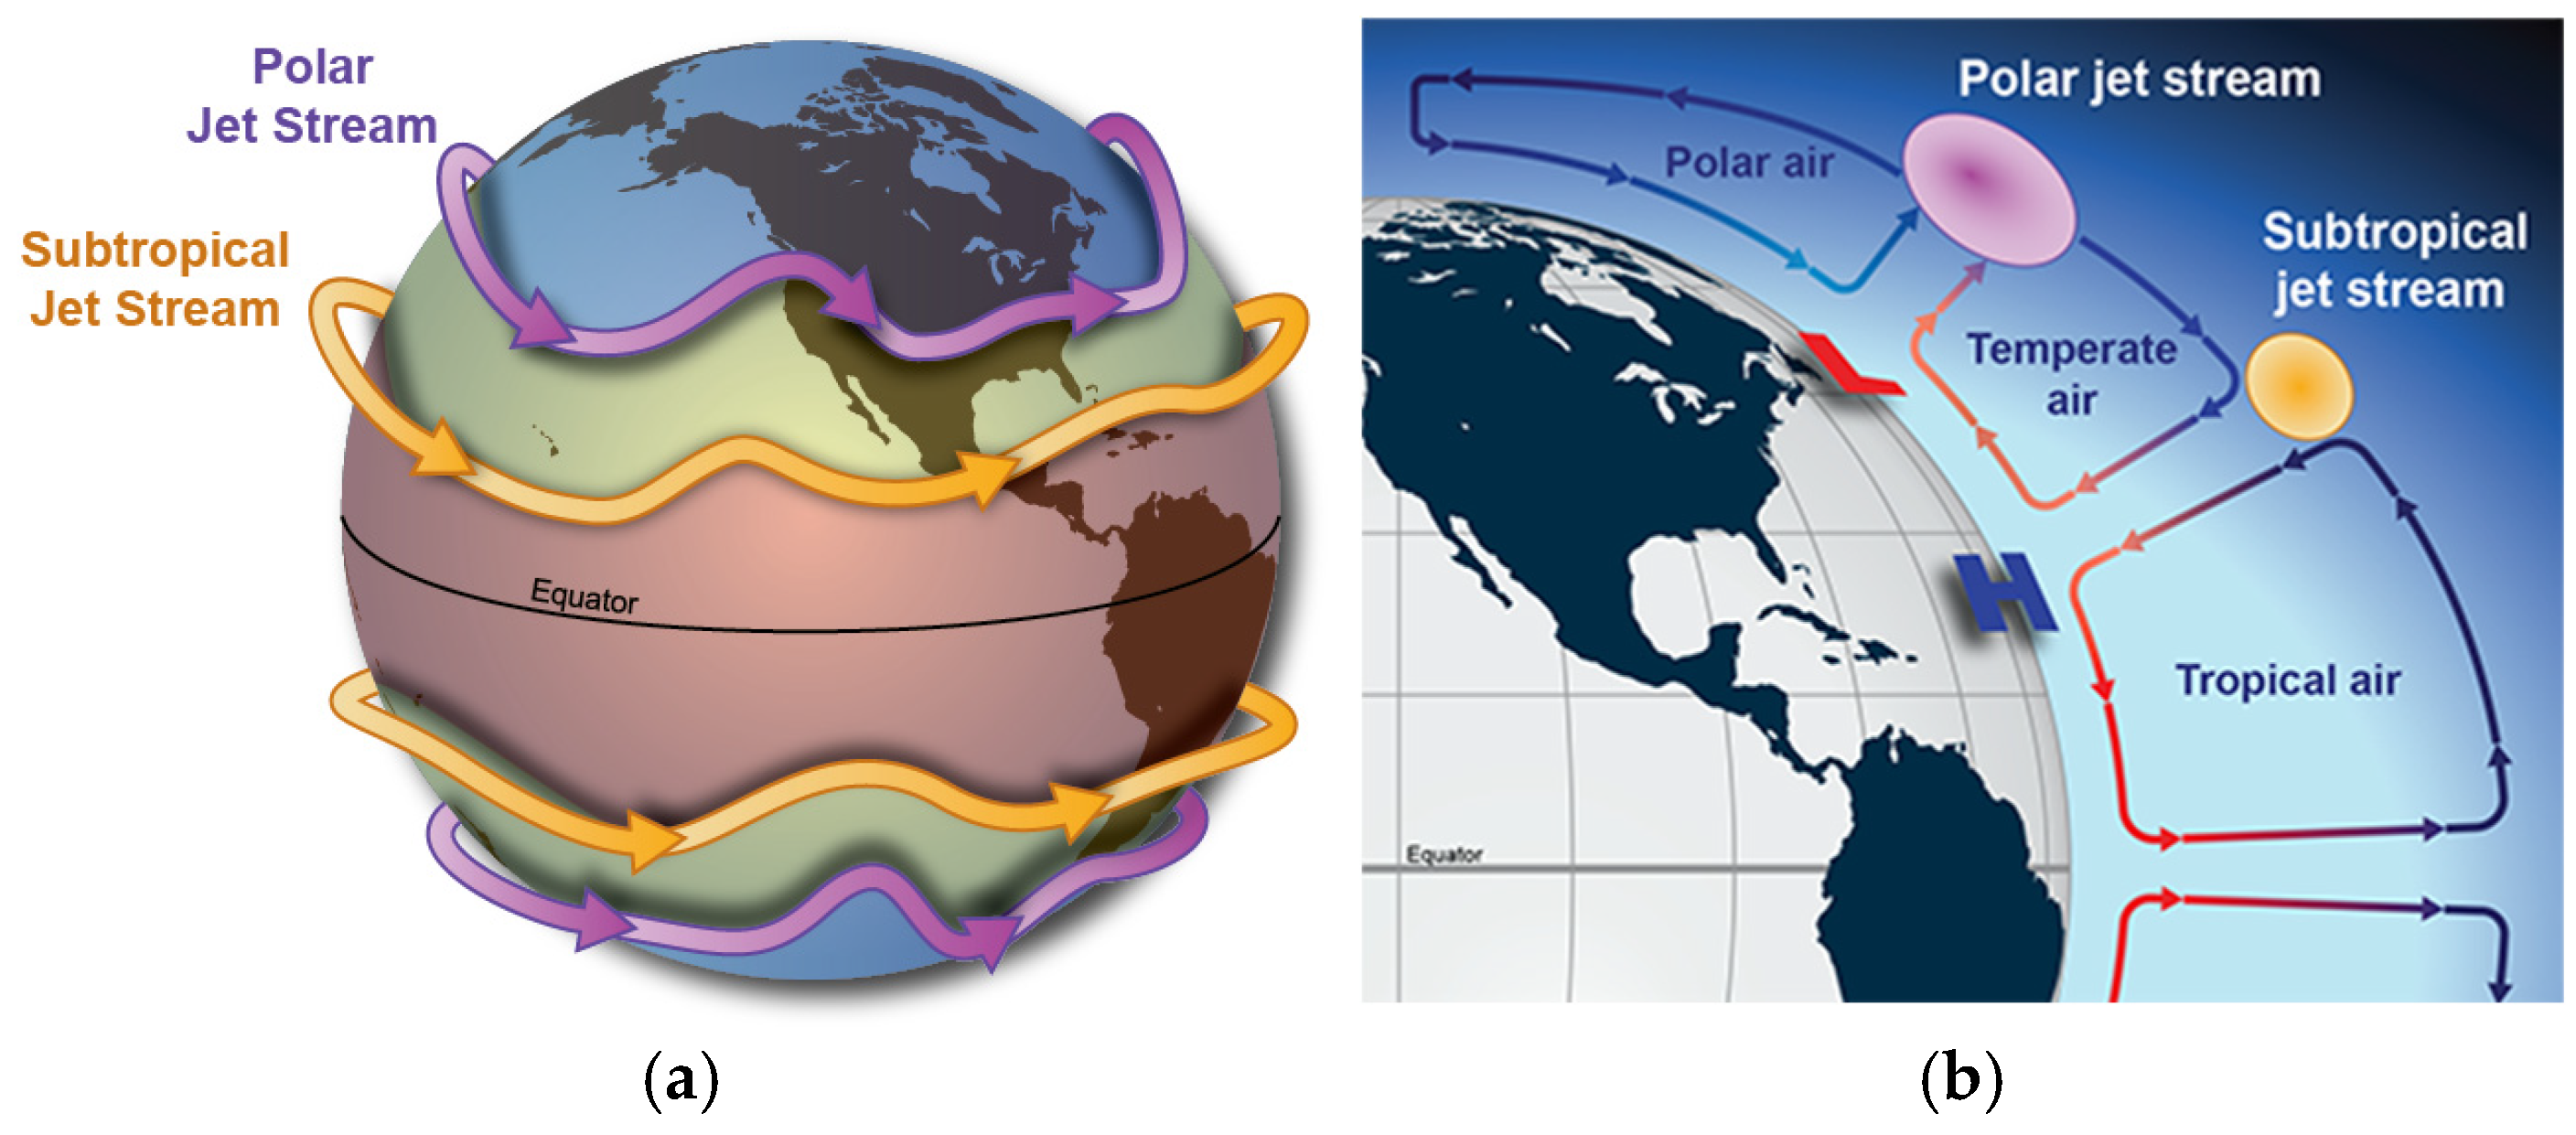
One of the main causes of vertical wind shear is the jet stream, so the risk for CAT is especially high in its vicinity. Jet streams are relatively narrow bands of strong wind in the upper levels of the atmosphere that follow the boundaries between warm and cold air. Within jet streams, the winds blow mainly from west to east, but the flow often shifts north and south in response to the complex interaction between many variables, such as the location of high- and low-pressure systems and seasonal changes. In the troposphere, there are two types of jet streams: the polar one, located in the 50°–60° N/S latitude range, and the subtropical one, situated near 30° N/S latitude. These jet streams are typically found at or near the tropopause and are characterized by wind speeds ranging from at least 60 knots to over 240 knots. A schematic illustration of polar and subtropical jet streams is shown in
Figure 1. Jet streams are regions characterized by a strong discontinuity in wind speed that varies rapidly over short distances, increasing toward a central core of greatest strength. The vertical and horizontal wind shear of jet streams is the primary cause of CAT, with the more severe turbulence occurring in regions where the wind velocity gradient is strongest. Jet streams with core wind speeds exceeding 110 knots have the potential to generate significant turbulence. The likelihood of encountering CAT increases proportionally with the rate at which wind speed decreases moving away from the jet core [
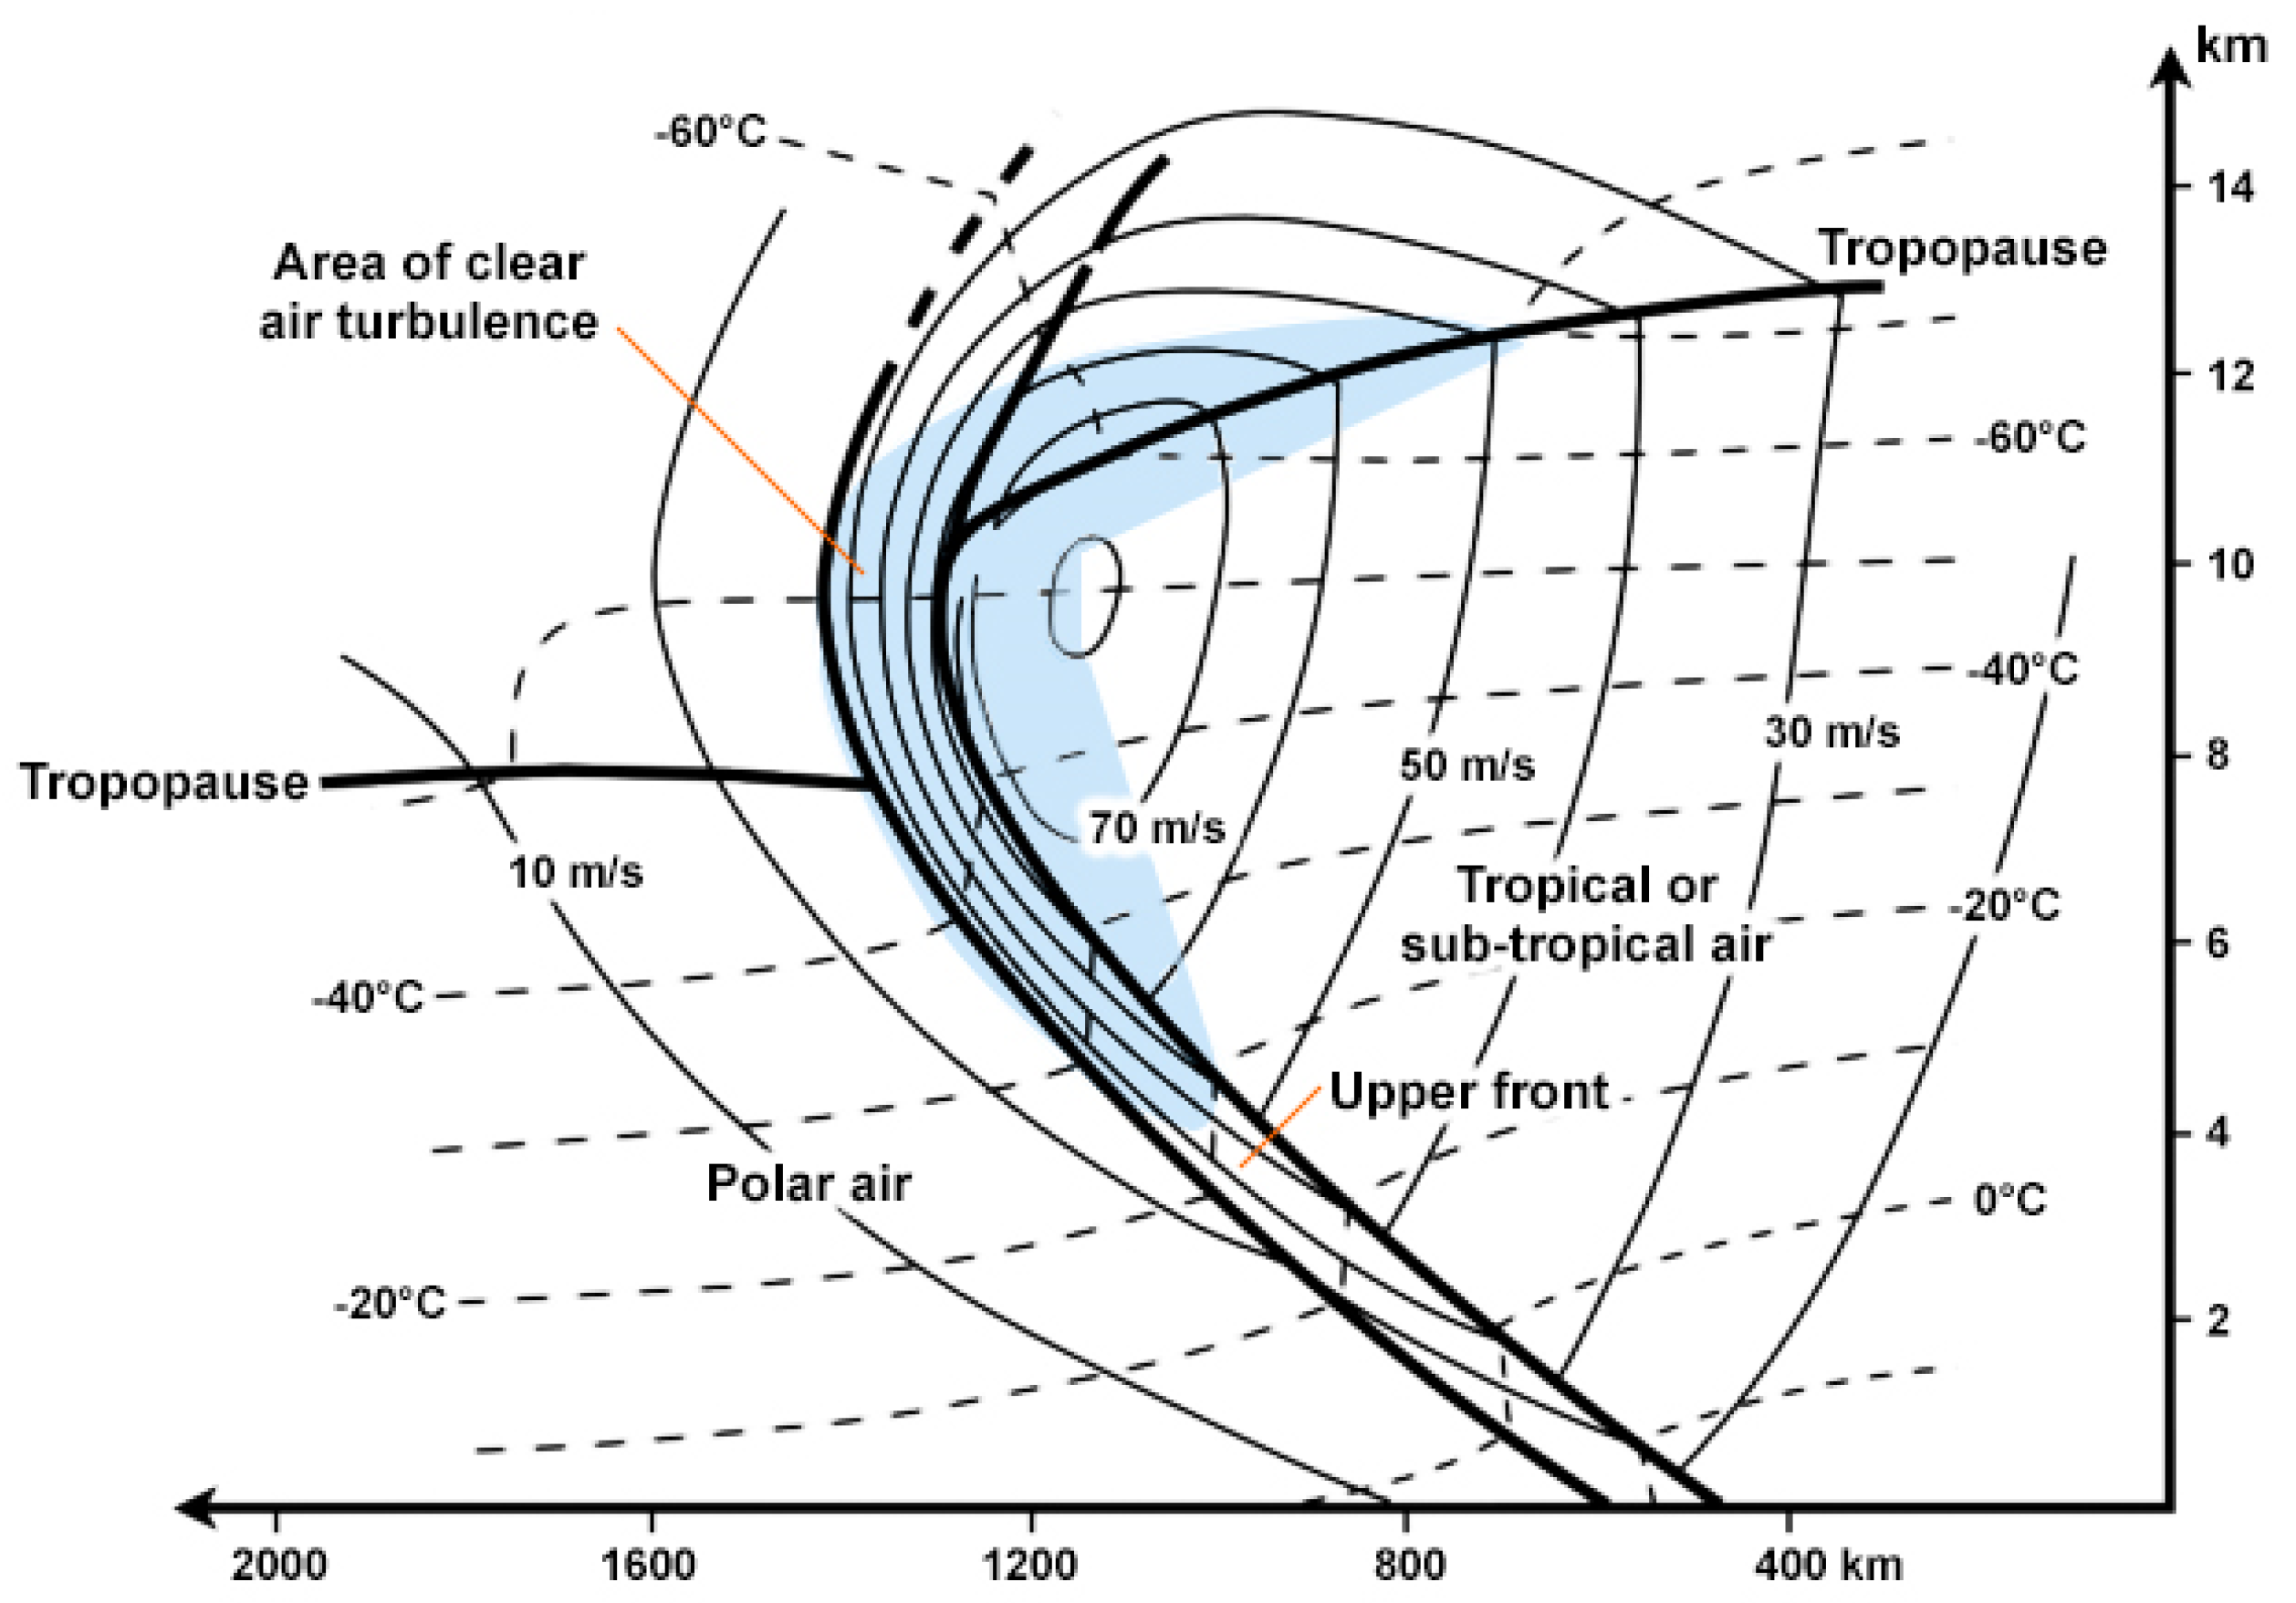
19]. Specifically, CAT is frequently found in the vicinity of the tropopause, on the cold side of the jet stream, above and underneath the jet core, as shown in
Figure 2.
Another typical meteorological condition leading to CAT is the presence of a curving jet streams with upper troughs and ridges that tend to have an enhanced wind shear coming from horizontal gradients of wind direction and velocity. Furthermore, CAT in jet streams is greatly intensified in mountain wave conditions. Significant CAT was also found in regions of horizontal deformation, convergence, upper-level frontogenesis, and strong horizontal thermal gradients [
17]. Aircrafts often experience CAT when flying in the proximity of a tropopause fold, i.e., the downward intrusion of stratospheric air into the troposphere, occurring near an upper-level frontal zone under the polar and subtropical jet streams and marking the change in the height of the tropopause [
20]. The confluence of two jet streams is also a noteworthy cause of CAT. On occasion, the polar jet stream will dip south and pass under the subtropical jet stream: the wind shear effect between the two jet streams in the region of confluence is often highly turbulent [
16].
Figure 1.
Illustration of polar and subtropical jet streams: (
a) their location around the globe and (
b) their cross section in the Northern Hemisphere [
21]. Credit NOAA.
Figure 1.
Illustration of polar and subtropical jet streams: (
a) their location around the globe and (
b) their cross section in the Northern Hemisphere [
21]. Credit NOAA.
Figure 2.
Vertical cross section of a polar jet stream, showing the mid-latitude/sub-tropical and polar air, tropopause, isotachs (solid line, in m/s), isotherms (dashed line, in degrees Celsius), and the region with highest turbulence (blue areas) [
22]. © The COMET Program. The source of this material is the COMET
® Website at
http://meted.ucar.edu/ (accessed on 29 April 2025) of the University Corporation for Atmospheric Research (UCAR), sponsored in part through cooperative agreement(s) with the National Oceanic and Atmospheric Administration (NOAA), U.S. Department of Commerce (DOC). ©1997–2025 University Corporation for Atmospheric Research. All Rights Reserved.
Common dimensions of a turbulent area associated with a jet stream are on the order of 100 to 300 miles long, elongated in the direction of the wind, 50 to 100 miles wide, and 5000 feet deep. These areas may persist from 30 min to 1 day [
19].
4. CAT Impact on Aviation Operations, Technological, and Operational Aspects
As outlined above, there are significant problems with clear-air turbulence in aviation, including discomfort, injuries, and operational interruptions. As also already indicated, pilots cannot count on the visual individuation of CAT, and they cannot count on support for CAT detection by conventional onboard weather radars. Therefore, improvements in technologies and operational strategies are crucial to manage CAT occurrences in aviation and reduce their impact on flight operations. In this second part of the paper, CAT-related operational and technological aspects are addressed, in terms of their state of the art and perspectives with specific emphasis on both the flight and the ground segments.
4.1. Flight Segment: Technological Systems and Pilot Operations
Despite technological advances, pilots continue to receive meteorological data that, in many cases, is already out of date at take-off time. This raises significant concerns for the safety and efficiency of air transport. A European Cockpit Association (ECA) paper [
49] highlights the need for minimum standards for access to meteorological information, proposing an improvement in the quality and timeliness of data provided to pilots. Among the most relevant proposals, there is the integration of advanced technologies for the collection and analysis of weather data in real time, thus enabling more informed decisions and optimal flight management. A key point highlighted is the need for greater collaboration between regulators, airlines, and meteorological service providers to ensure a more efficient information infrastructure. Implementing advanced solutions could not only increase flight safety, but also reduce delays and optimize flight operations globally. This approach represents a fundamental step to bridge the gap between available technological capabilities and the actual accessibility of meteorological information to pilots, promoting a safer and more efficient system for modern aviation.
The flight segment, which focuses on aircraft technologies and processes to assist pilots at tactical level during operations, is essential in identifying and reacting to clear-air turbulence; therefore, improvements in onboard systems are now crucial to provide pilots with real-time data and tools for the early identification, avoidance, and mitigation of such phenomena. Pilots’ capacity to react proactively to CAT is being improved by contemporary technology advancements such as LIDAR equipment, tropospheric profilers, and sophisticated alert systems. These technological solutions will be examined in the following subsections.
4.1.1. LIDAR Systems for CAT Detection
An effective remote detection of CAT onboard would be desirable, allowing pilots and personnel sufficient time to take protective measures. However, CAT occurs in clear skies at high altitudes without significant hydrometeors, making it extremely difficult to be detected using traditional methods such as weather radars. One of the most promising technologies for detecting CAT for an aircraft during flight is LIDAR (Light Detection and Ranging). LIDAR uses laser light to analyze atmospheric changes in order to identify clear-air turbulence, in contrast to classical radar, which depends on moisture or particulates to detect disturbances. Where radar-based systems would fail in clear conditions, LIDAR’s ability to detect turbulent gusts and air eddies makes the identification of CAT possible. Currently, the most promising methods for active CAT detection are coherent Doppler LIDAR technology, based on the interaction of laser pulses with aerosols within the atmosphere, and incoherent Rayleigh LIDAR technology, measuring atmospheric molecular density fluctuations.
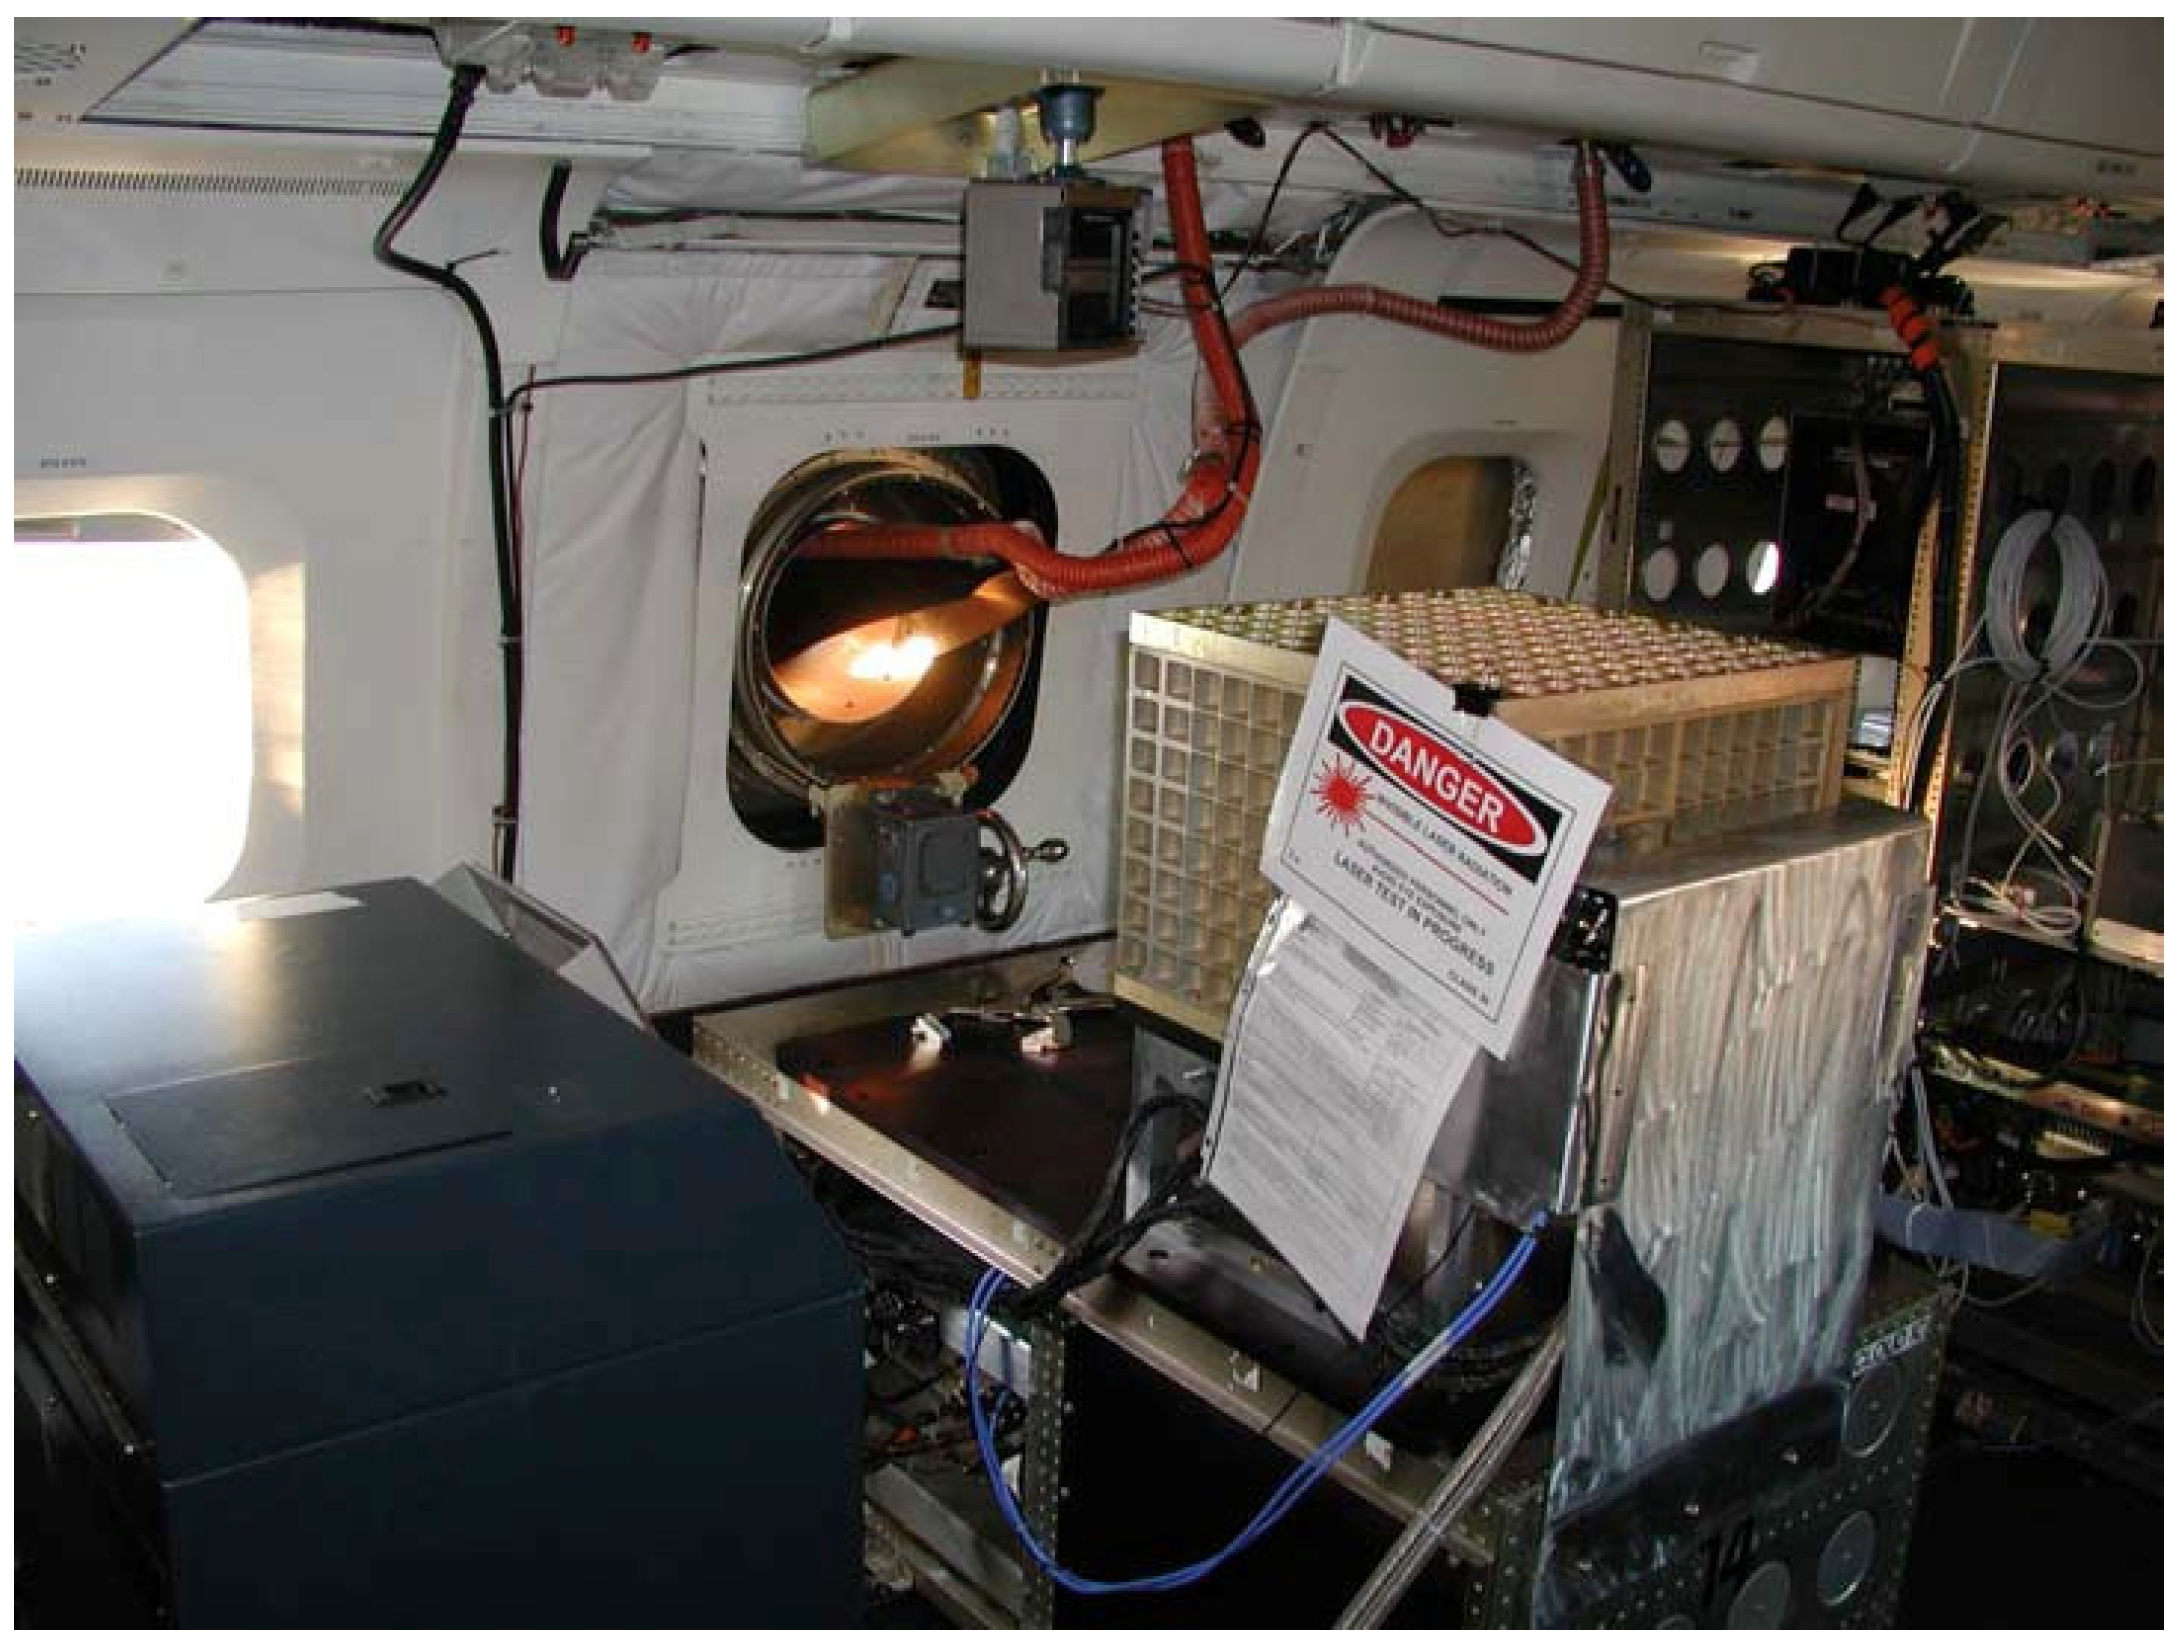
Regarding the first technological alternative (coherent LIDAR), of particular importance is the NASA Airborne Coherent LIDAR for Advanced In-Flight Measurements (ACLAIM) project (
Figure 5) [
50]. Pilots in ACLAIM receive real-time information on possible turbulence encounters thanks to LIDAR devices installed on aircraft that can detect turbulence up to several miles ahead [
51]. By using this early notice, pilots can alter their direction or speed to mitigate the impact of turbulence on the aircraft, improving passenger safety and comfort.
An example of the second technological alternative (incoherent LIDAR) is the one proposed in the framework of the DELICAT (Demonstration of LIDAR based CAT Detection) project [
52], where a high-power ultraviolet LIDAR system has been developed. DELICAT flight test results, in 2013, showed that the system could detect local subtle variations in the molecular backscatter coefficient indicating turbulence up to 10/15 km ahead of the aircraft [
53,
54].
Furthermore, because LIDAR systems enable proactive reactions to identified turbulence, they are also promising for reduction in gust loads. Indeed, the early detection of gusts facilitates the modification of aircraft control surfaces prior to the aircraft actually experiencing the disturbance. This preventative measure lessens the strain on the aircraft’s structure, improving operational effectiveness and safety.
In conclusion, therefore, combining LIDAR-based detection and advanced control response systems improves CAT management by enabling real-time adaptive tactics. Given the current limitations of CAT predictability, LIDAR technology represents a significant step forward in enhancing flight safety and operational reliability, particularly as its integration into commercial aviation progresses.
4.1.2. Tropospheric Profilers for Real-Time Monitoring
Tropospheric profilers are essential tools for atmospheric observation, especially for troposphere vertical wind, temperature, and humidity measurement. Some technologies and approaches are available to evaluate these profiles, each one providing a better understanding of atmospheric processes, weather forecasting, and climate modeling. These tropospheric profilers are useful tools for the real-time monitoring of clear-air turbulence, particularly at high altitudes, where CAT occurs often. These profilers typically use wind speed and atmospheric pressure changes to calculate the eddy dissipation rate (EDR), which is a major indicator of turbulence. The capacity of these profilers to detect tiny turbulence patterns aids in the prediction of CAT zones, allowing for real-time notifications and mitigation measures.
A previous study demonstrated how tropospheric profilers have been utilized to identify turbulence related to weather events and interactions with the jet stream, boosting safety through their accurate detection capabilities [
55]. Another solution uses a solid-state LASER within a profiler to analyze atmospheric turbulence intensity profiles. This configuration provides high-resolution and real-time data, making it ideal for CAT monitoring [
56].
One of the classic approaches is represented by Ultra-High-Frequency (UHF) radars, such as those developed by the NOAA Aeronomy Laboratory [
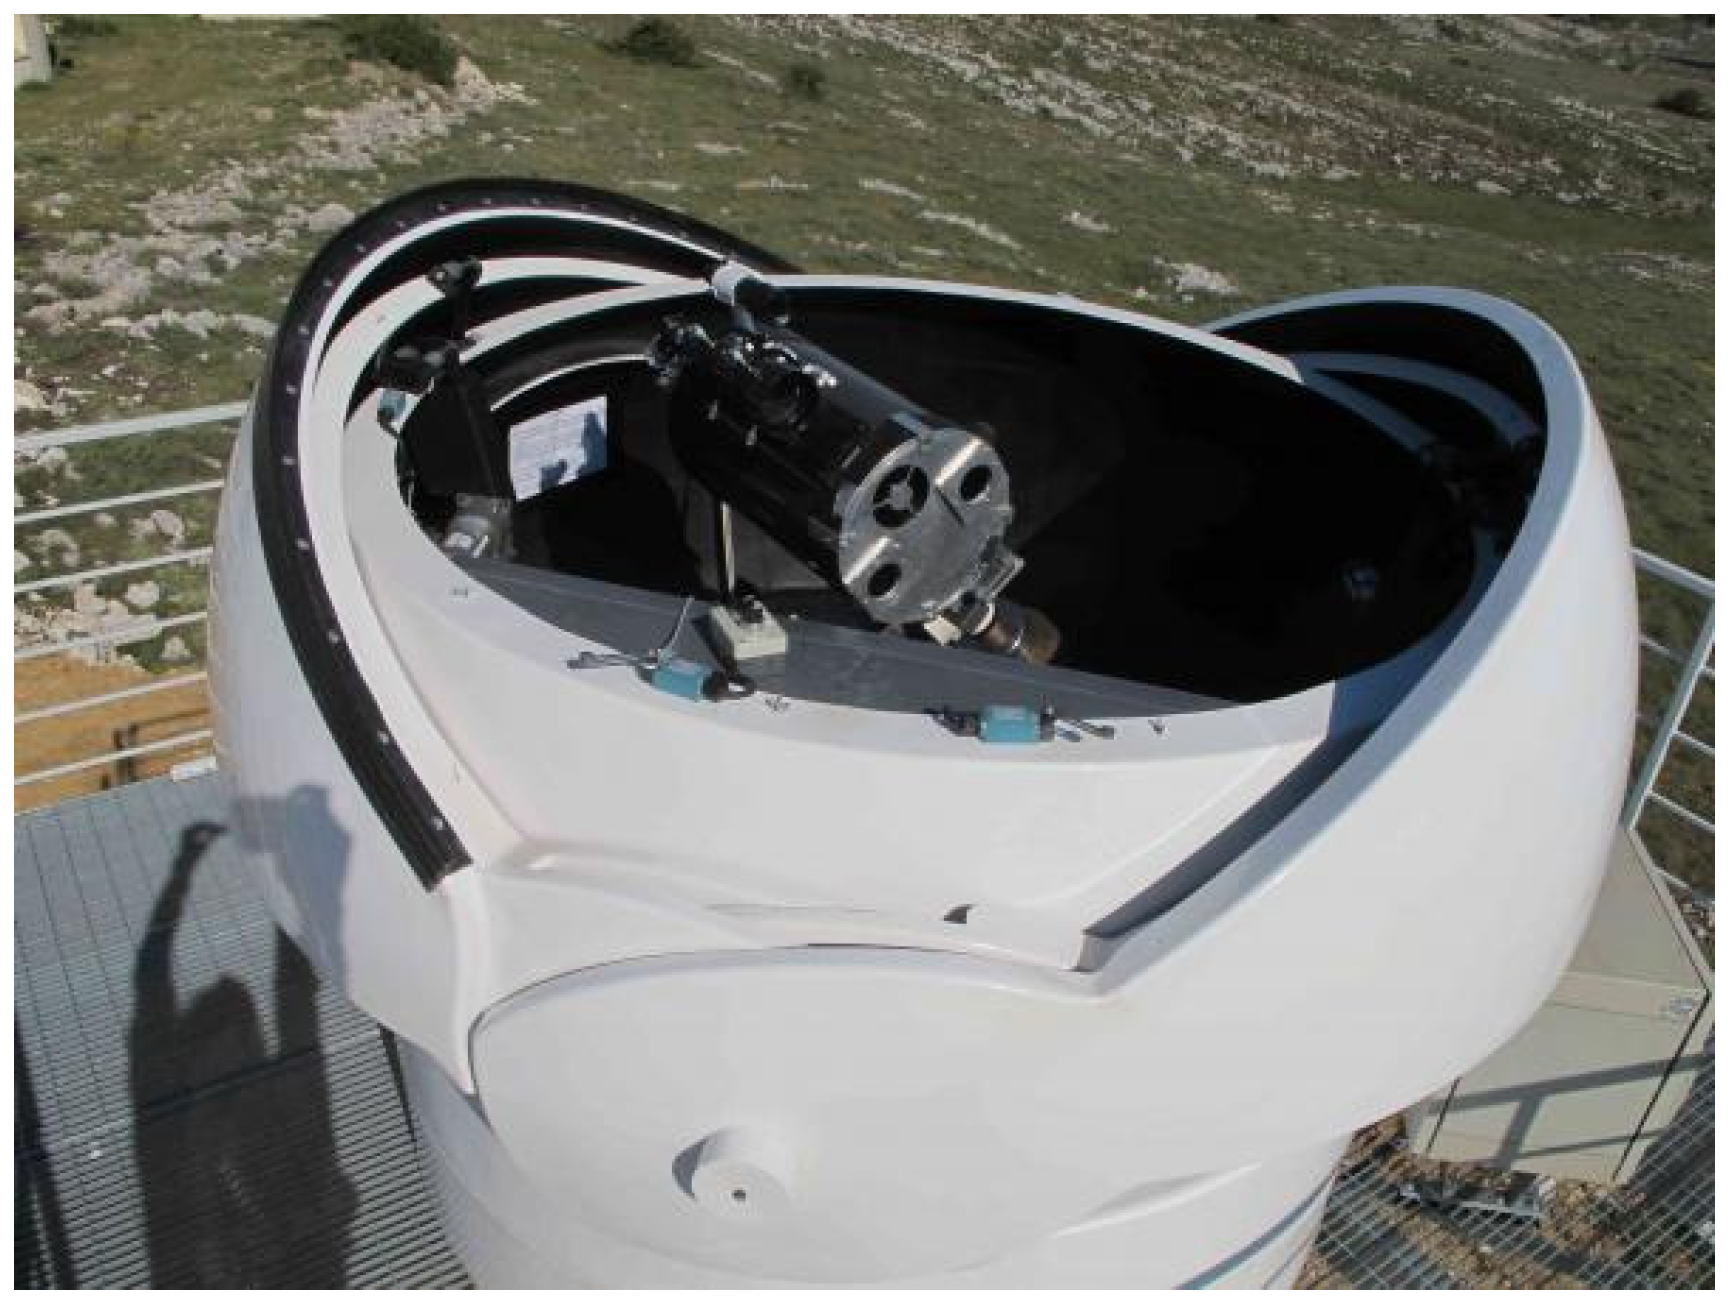
57], which use fixed array antennas to measure wind profiles from a few meters up to over 10 km in height with high temporal continuity. This approach is based on a UHF profiling system architecture, including the development of the Radio Acoustic Sounding System (RASS) functionality. This technology finds applications in wind profiling, boundary layer height determination, flow measurement, and precipitation profiling. Ground-based tropospheric profilers are also relevant, such as the one employed at the Côte d’Azur Observatory in France (
Figure 6), which provides turbulence monitoring statistics, using the Generalized Differential Image Motion Monitor (GDIMM). This instrument is fully automatic and measures integrated atmospheric turbulence parameters, namely the following: seeing, isoplanatic angle, coherence time and outer scale, with a temporal resolution of 2 min. A large dataset has been collected by this system, leading to the first turbulence statistics over the Plateau de Calern, allowing for a more detailed understanding of atmospheric conditions in the troposphere. This device has shown to be a useful part of real-time CAT monitoring operations, providing data critical for anticipating turbulence [
58].
Furthermore, studies utilizing RADAR observations have demonstrated that turbulence near the tropopause, which is frequently linked with CAT, may be successfully tracked using RADAR-based tropospheric profilers. Such observations contribute greatly to real-time CAT monitoring and can warn ground control and pilots about oncoming turbulence [
60].
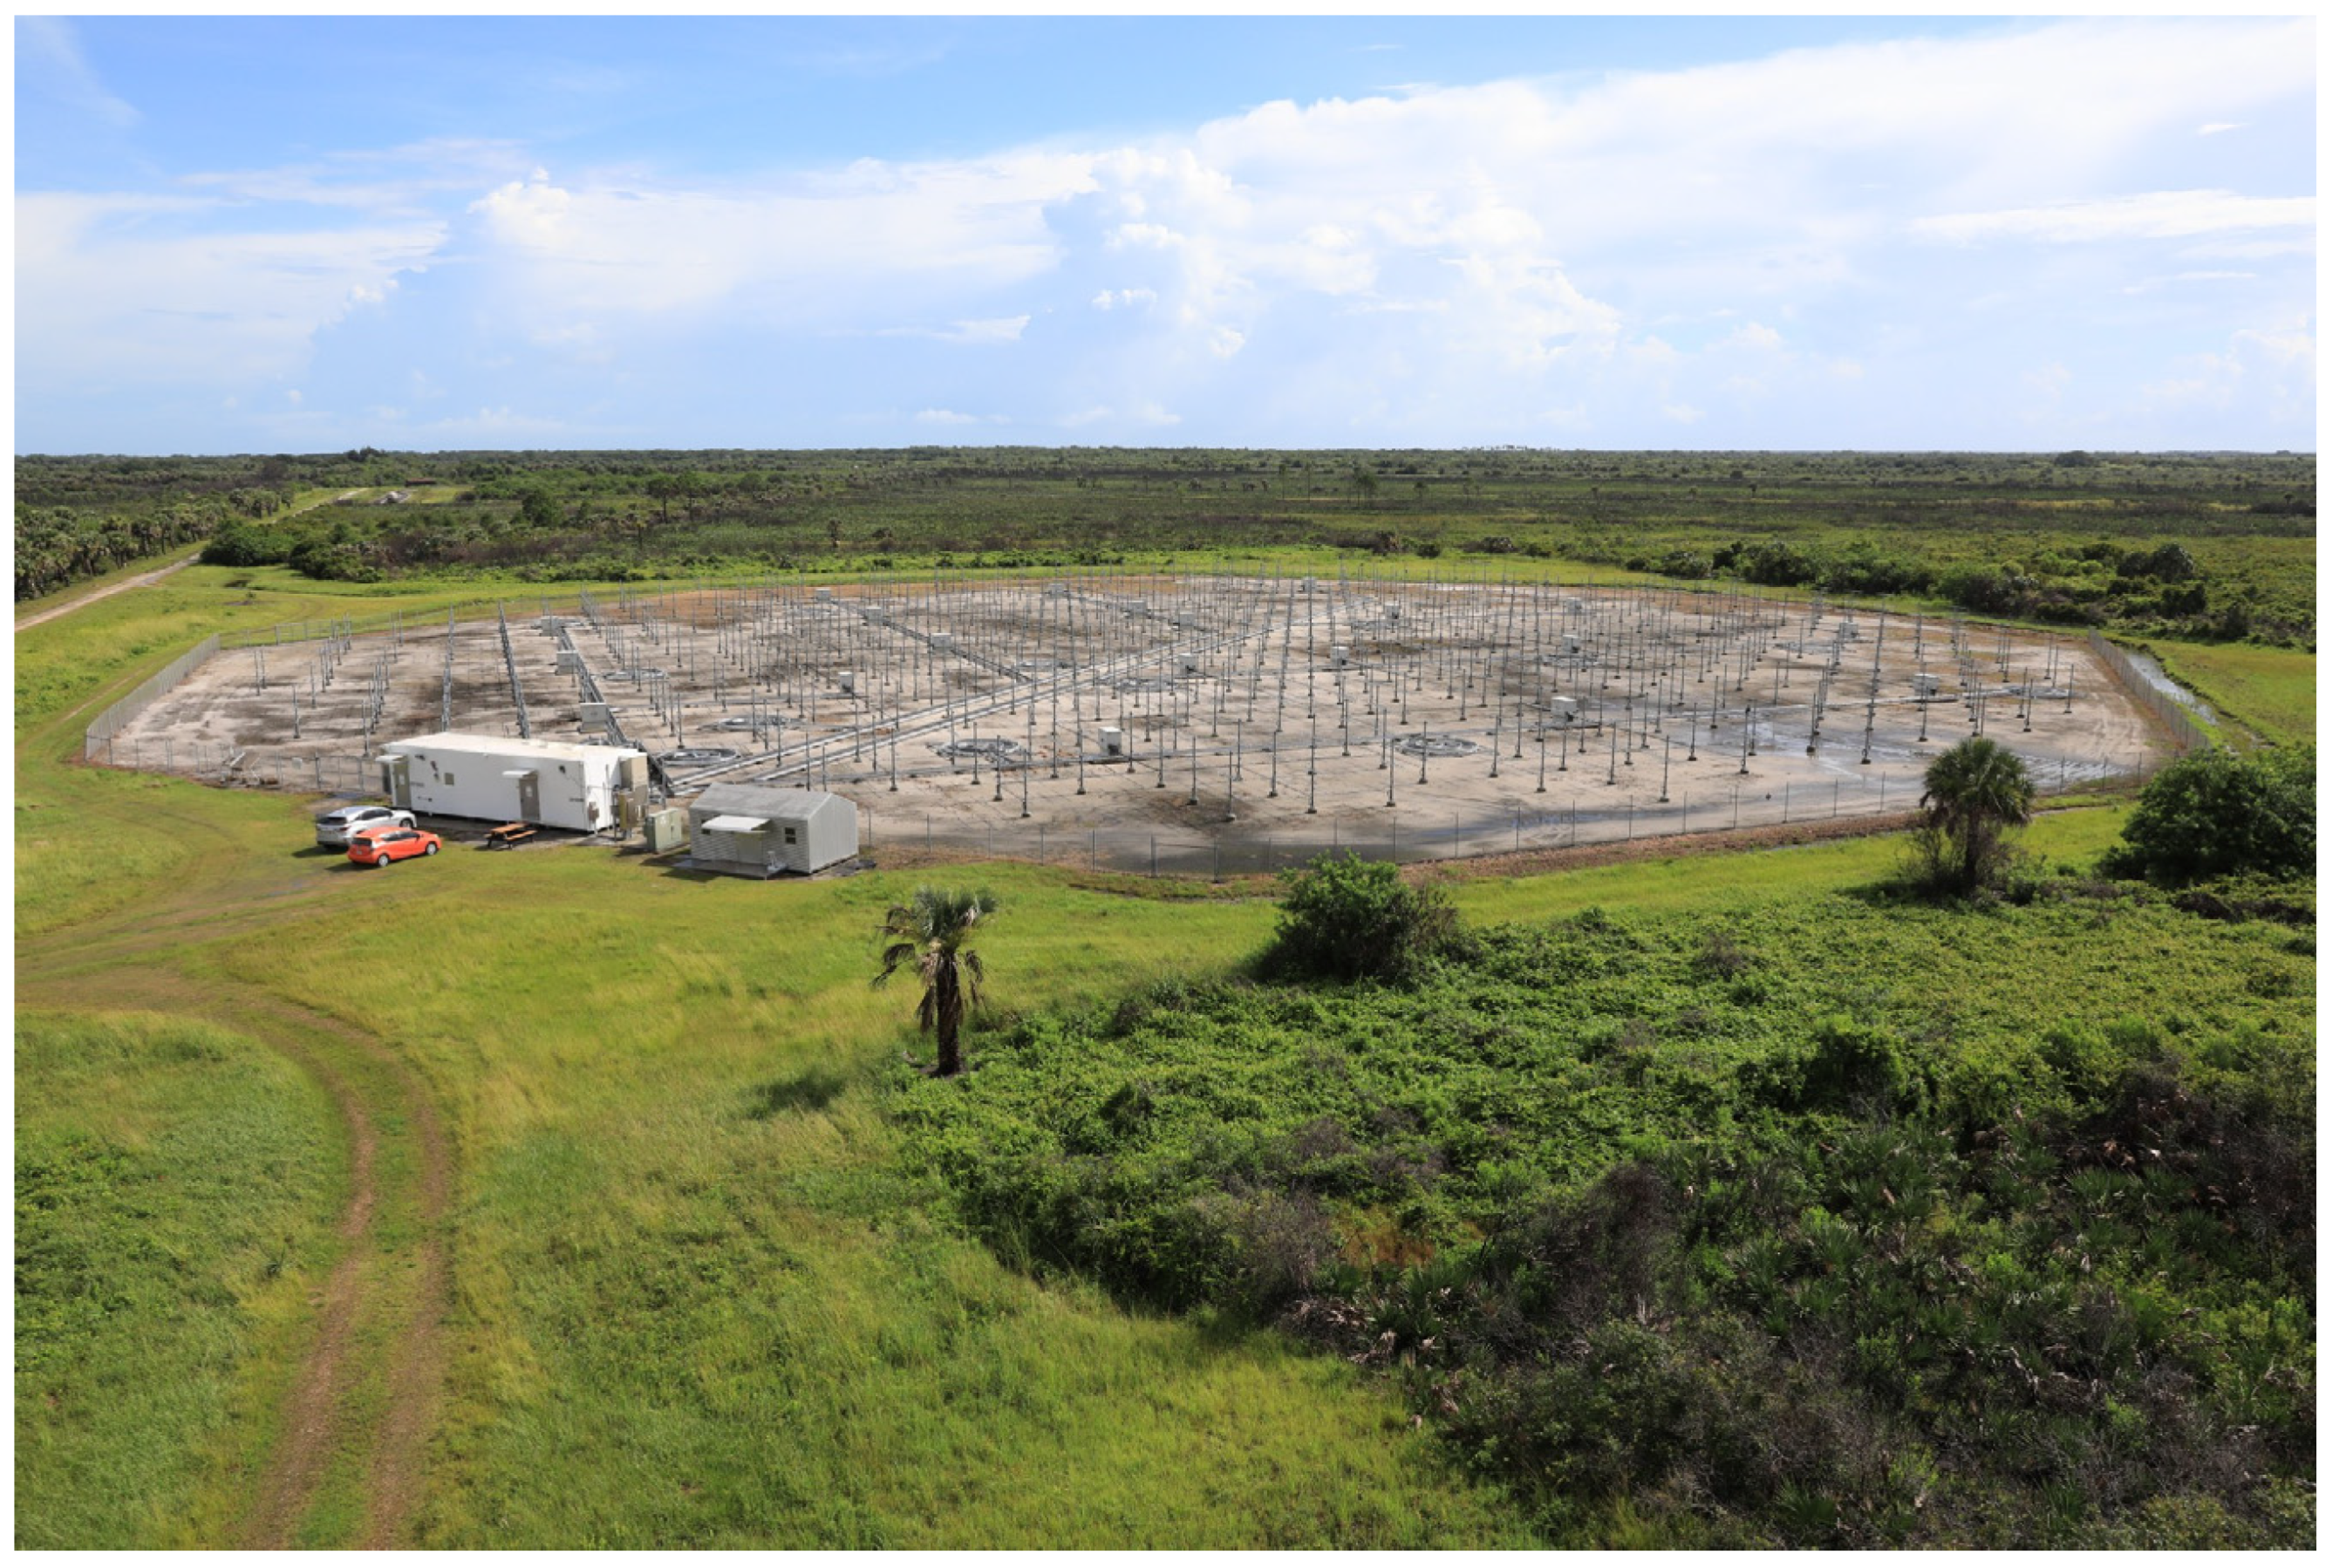
At NASA’s Kennedy Space Center [
61], there is another example of a tropospheric profiler installation: the Tropospheric Doppler Radar Wind Profiler (TDRWP), an advanced instrument for measuring high-level winds. This device represents a significant improvement over traditional methods of wind measurement. The TDRWP is installed on a five-acre site near the Kennedy Space Center launch and landing facility. The setup includes 640 antennas that provide a frequency of 48 MHz. This installation (
Figure 7) facilitates extensive coverage and precise data collection. The TDRWP measures winds at five-minute intervals, covering altitudes from 6000 to 62,000 feet. The speed and accuracy of the TDRWP allow changes in high-level winds to be quickly detected. The Tropospheric Doppler Radar Wind Profiler represents a significant technological advance for NASA.
Another infrastructure worth mentioning is located in Australia. The Australian Government’s Bureau of Meteorology [
62] has completed the installation of a network of 19 wind profilers, including the one at Davis Station in Antarctica (
Figure 8). Four of the new profilers are high-powered stratospheric tropospheric systems, designed to measure winds from ground level to the tropopause, maintaining the high-altitude network in Australia, where probe launches are no longer available. Near-field radar wind measurements are demonstrated to be possible and accurate through comparison with co-located radiosondes. Data from the Australian network is available on the global telecommunications system and is currently being fed into all major models.
In conclusion, tropospheric profilers, whether airborne or ground-based, provide precise, real-time insights into atmospheric turbulence, making them an essential component of the technical armory against CAT. Their ability to early identify turbulence helps to prevent unexpected turbulence encounters and assures safer flight operations.
4.1.3. Onboard Alert Systems
As a first protection layer for pilots encountering clear-air turbulence, onboard alarm systems have evolved into essential parts of contemporary aircraft. By gathering, processing, and transmitting crucial data on the atmospheric conditions surrounding the aircraft, these technologies are meant to help pilots make prompt, well-informed decisions that will lessen the impact of CAT. Onboard alert systems offer response actions that improve situational awareness and increase crew and passenger safety, even though they cannot foresee CAT on their own.
There are several technologies for this application, as described in the following passages.
Sensor Integration for Real-Time Feedback—A variety of sensors installed within the aircraft are used by onboard alarm systems to identify variations in air pressure, wind speed, and vertical acceleration. The technology can identify the beginning of turbulence and notify the flight crew instantly. This feedback loop enables the autopilot or flight control system to make tiny modifications to maintain stability, which is particularly helpful during unforeseen turbulence encounters. Newer systems now incorporate data from Inertial Reference Systems (IRSs) and Global Positioning Systems (GPSs), enabling more precise turbulence detection.
Enhanced Warning Systems with Eddy Dissipation Rate (EDR) Calculations—Modern onboard systems use the eddy dissipation rate (EDR) [
63], a crucial statistic that measures the rate of energy dissipation per unit mass of air, to estimate the intensity of turbulence. Certain sophisticated onboard systems, such as IATA’s Turbulence Aware system [
64], continually compute EDR values and notify pilots of the results, by differentiating between turbulence levels. This statistic enables the crew members to make informed decisions regarding changes to the flight path or altitude. By computing the EDR, these technologies facilitate a more precise assessment of turbulence intensity rather than relying exclusively on qualitative “light”, “moderate”, or “severe” turbulence reports.
Data-Driven Alerts through Pilot-Airline Communication Links—Onboard alert systems are increasingly using data uplinks and downlinks to send real-time CAT data to air traffic control (ATC) and other aircraft in the area. This communication is critical, because it allows pilots to receive real-time updates from other aircraft suffering CAT. Systems like the Aircraft Communication Addressing and Reporting System (ACARS) and Automatic Dependent Surveillance-Broadcast (ADS-B) [
65] can automatically communicate turbulence data. Through these linkages, onboard alarm systems can send turbulence data to ground stations and other aircraft, increasing collective situational awareness and flight safety.
Predictive Warning with LIDAR and Atmospheric Probes—Several kinds of atmospheric probes are equipping an aircraft used to measure atmospheric properties. A probe collect and transmit data about the atmosphere, such as its composition, pressure, density, and temperature. In general, probes are lightweight and reliable, without moving parts. Air data probes can help pilots, drivers, and engineers to improve performance and control. Furthermore, they can help flight crews to identify potentially dangerous weather conditions. A probe can help air traffic controllers to check planned clearances. While classic onboard alert systems are reactive, ongoing development seeks to incorporate predictive technologies. For example, combining LIDAR equipment with onboard alarm mechanisms enables the detection of turbulence many miles ahead of the aircraft, providing extra lead time. This forecasting skill is especially useful for CAT, as regular weather radar is inadequate. Some research efforts, including as NASA’s Airborne Coherent LIDAR for Advanced In-Flight Measurements (ACLAIM), seek to bring these capabilities closer to operational readiness.
Pilot Interface and Decision Support Tools—Modern onboard alert systems are becoming more user-friendly, with streamlined cockpit interfaces intended to reduce pilot workload. These systems employ obvious visual and aural alerts, as well as decision support algorithms that recommend appropriate responses. For example, the cockpit display might indicate the intensity and duration of identified turbulence, allowing pilots to immediately evaluate data and adjust the flight profile. Some systems also include navigation systems that propose speed or altitude changes to decrease turbulence impact.
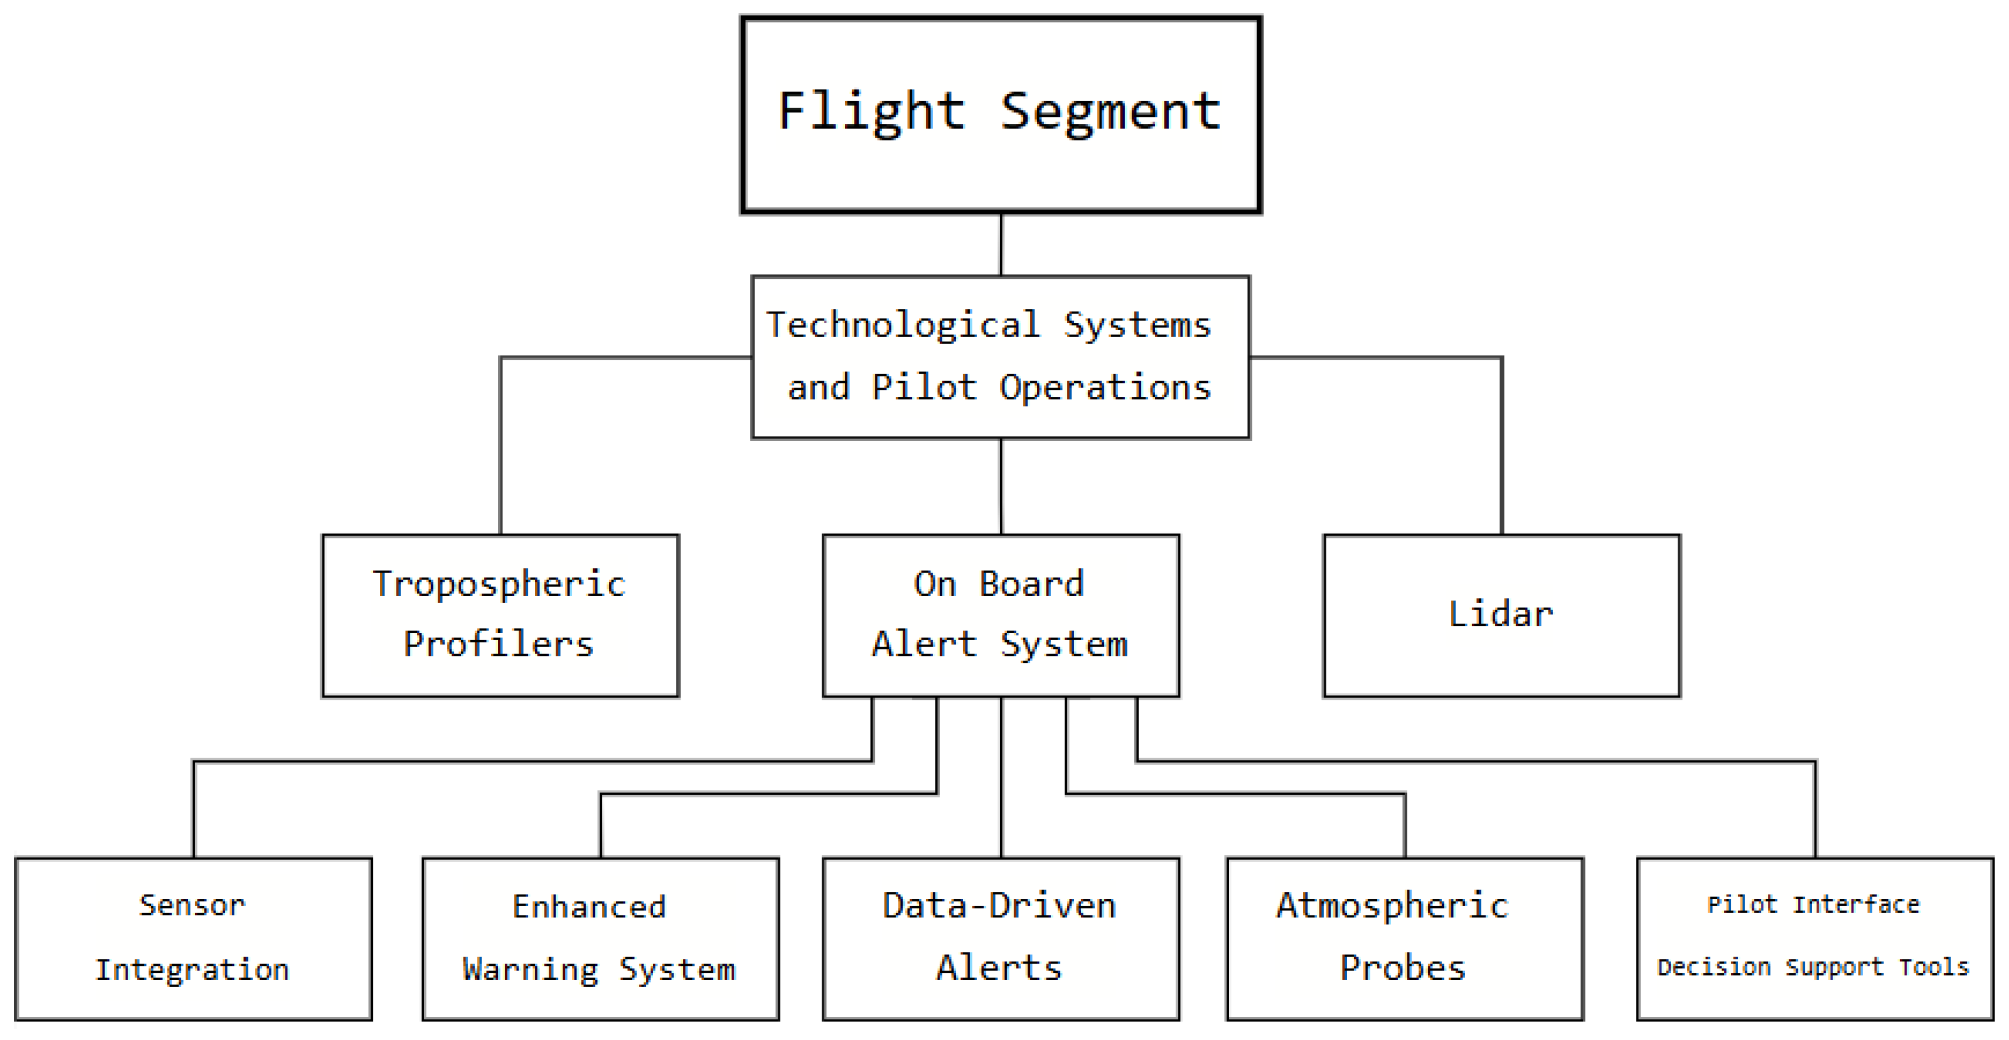
Overall, onboard alarm systems provide an important layer of protection against the unexpected nature of CAT. While these systems are mostly reactive, ongoing developments in sensor integration, data sharing, and predictive capabilities are increasing their overall effectiveness. Having concluded the discussion regarding the flight segment, the impact of clear-air turbulence on aeronautical operations from the point of view of the flight segment can be summarized in the following diagram, shown in
Figure 9. The diagram represents the synthesis of the main technological and operational systems used during the flight management of the CAT.
4.2. Ground Segment: ATM and ATC Tools for CAT Management
The ground segment plays a central role in the CAT management, through advanced air traffic management (ATM) and air traffic control (ATC) tools to increase flight safety and efficiency. Differently from onboard systems, which supply real-time alerts during flight, the ground segment, when addressing the ATM-related aspects, focuses on wide, strategic (i.e., at planning level, before flight) measures aimed to guarantee that aircraft are provided with safe routes to reach their assigned destinations on time, while taking into account foreseen traffic as well as environmental conditions. In these terms, turbulence forecasting tools and procedures for airspace coordination and communication are fundamental. When considering the tactical level (i.e., at execution level, during flight), the ground segment, through the ATC infrastructure, then ensures that proper monitoring of the actual flight execution is performed and that timely corrective actions are commanded to the aircraft, if needed, in order to manage possible hazardous unforeseen occurrences during flight (in terms of traffic, atmospheric conditions, failures, piloting errors, and others), for instance the insurgence of CAT along the assigned route. Based on such considerations, it is clear that with the integration of predictive weather models, real-time data-sharing platforms, and collaborative decision-making processes, ATM and ATC systems have the possibility to identify potential turbulence zones, enabling the mitigation of their effects on the affected aircraft by suggesting the proper modification of the flight profile, at both the strategic and tactical levels.
There are several technologies used by these tools, like satellite-based observations, tropospheric profiling, and aircraft-sourced turbulence data, to create an image of atmospheric conditions. Moreover, ATC’s role in communicating turbulence advisories and coordinating route definition highlights the importance of relying on robust communication networks. The synergy between ATM systems, pilots, and meteorological services is fundamental for CAT management, facilitating safer, more efficient airspace utilization and minimizing turbulence impact on passengers and operations.
4.2.1. ATM and ATC Coordination
ATM and ATC coordination is primary in the risk mitigation of CAT. These systems can guarantee safe and efficient aircraft operations by integrating modern forecasting tools, real-time turbulence reports, and routing protocols.
Predictive Tools and Real-Time Data Integration—ATM systems use Numerical Weather Prediction (NWP) [
66] models to forecast turbulence zones, integrating data from satellites, ground-based systems, and aircraft. Combining these inputs, ATM could create dynamic turbulence maps shared with ATC and pilots. This coordination could allow a proactive adjustment to flight plans, reducing turbulence exposure.
Collaborative Decision Making (CDM)—The CDM platforms could enable seamless communication between ATC and pilots, guaranteeing that updated turbulence data are quickly disseminated, thus allowing stakeholders to make knowledgeable decisions. For instance, pilots can receive rerouting suggestions based on the most recent ATM models, while ATC could coordinate airspace adaptation to avert potential turbulent area congestion.
Tactical Rerouting and Altitude Adjustments—ATC plays a central role in turbulence mitigation strategies during flights: in coordination with ATM and pilots, ATC can instruct aircraft to move to safer altitudes or reroute aircraft to avoid, by surrounding, the turbulent zones.
These mitigation strategies need to be supported by systems such as ADS-B and ACARS, providing real-time updates on the intensity and location of turbulence. In addition, important information about CAT, along with other atmospheric hazards, are traditionally disseminated through in-flight weather advisories, e.g., PIREPs (Pilot Reports), which are messages reporting the actual weather conditions existing in the air as observed by pilots, or SIGMET (Significant Meteorological Information) and AIRMET (Airmen’s Meteorological Information), which provide forecasts of potentially hazardous weather conditions during the flight. Furthermore, automated turbulence reporting systems are common on many commercial aircraft using the Aircraft Meteorological Data Relay (AMDAR) system [
19]. The AMDAR program was initiated by the World Meteorological Organization (WMO) with the objective to automatically derive and transmit meteorological data from the aircraft platform to support improved weather forecasts and applications for aviation and the wider community.
4.2.2. Advanced Weather Models for CAT Prediction
ATM tools are increasingly incorporating advanced weather models to forecast the presence of CAT. As considered in detail above, these models use data from atmospheric sensors, satellites, and tropospheric profilers to generate real-time turbulence maps. These maps are fundamental for ATC to promptly provide pilots with the proper instructions, guaranteeing routes are modified before being faced with turbulence [
67].
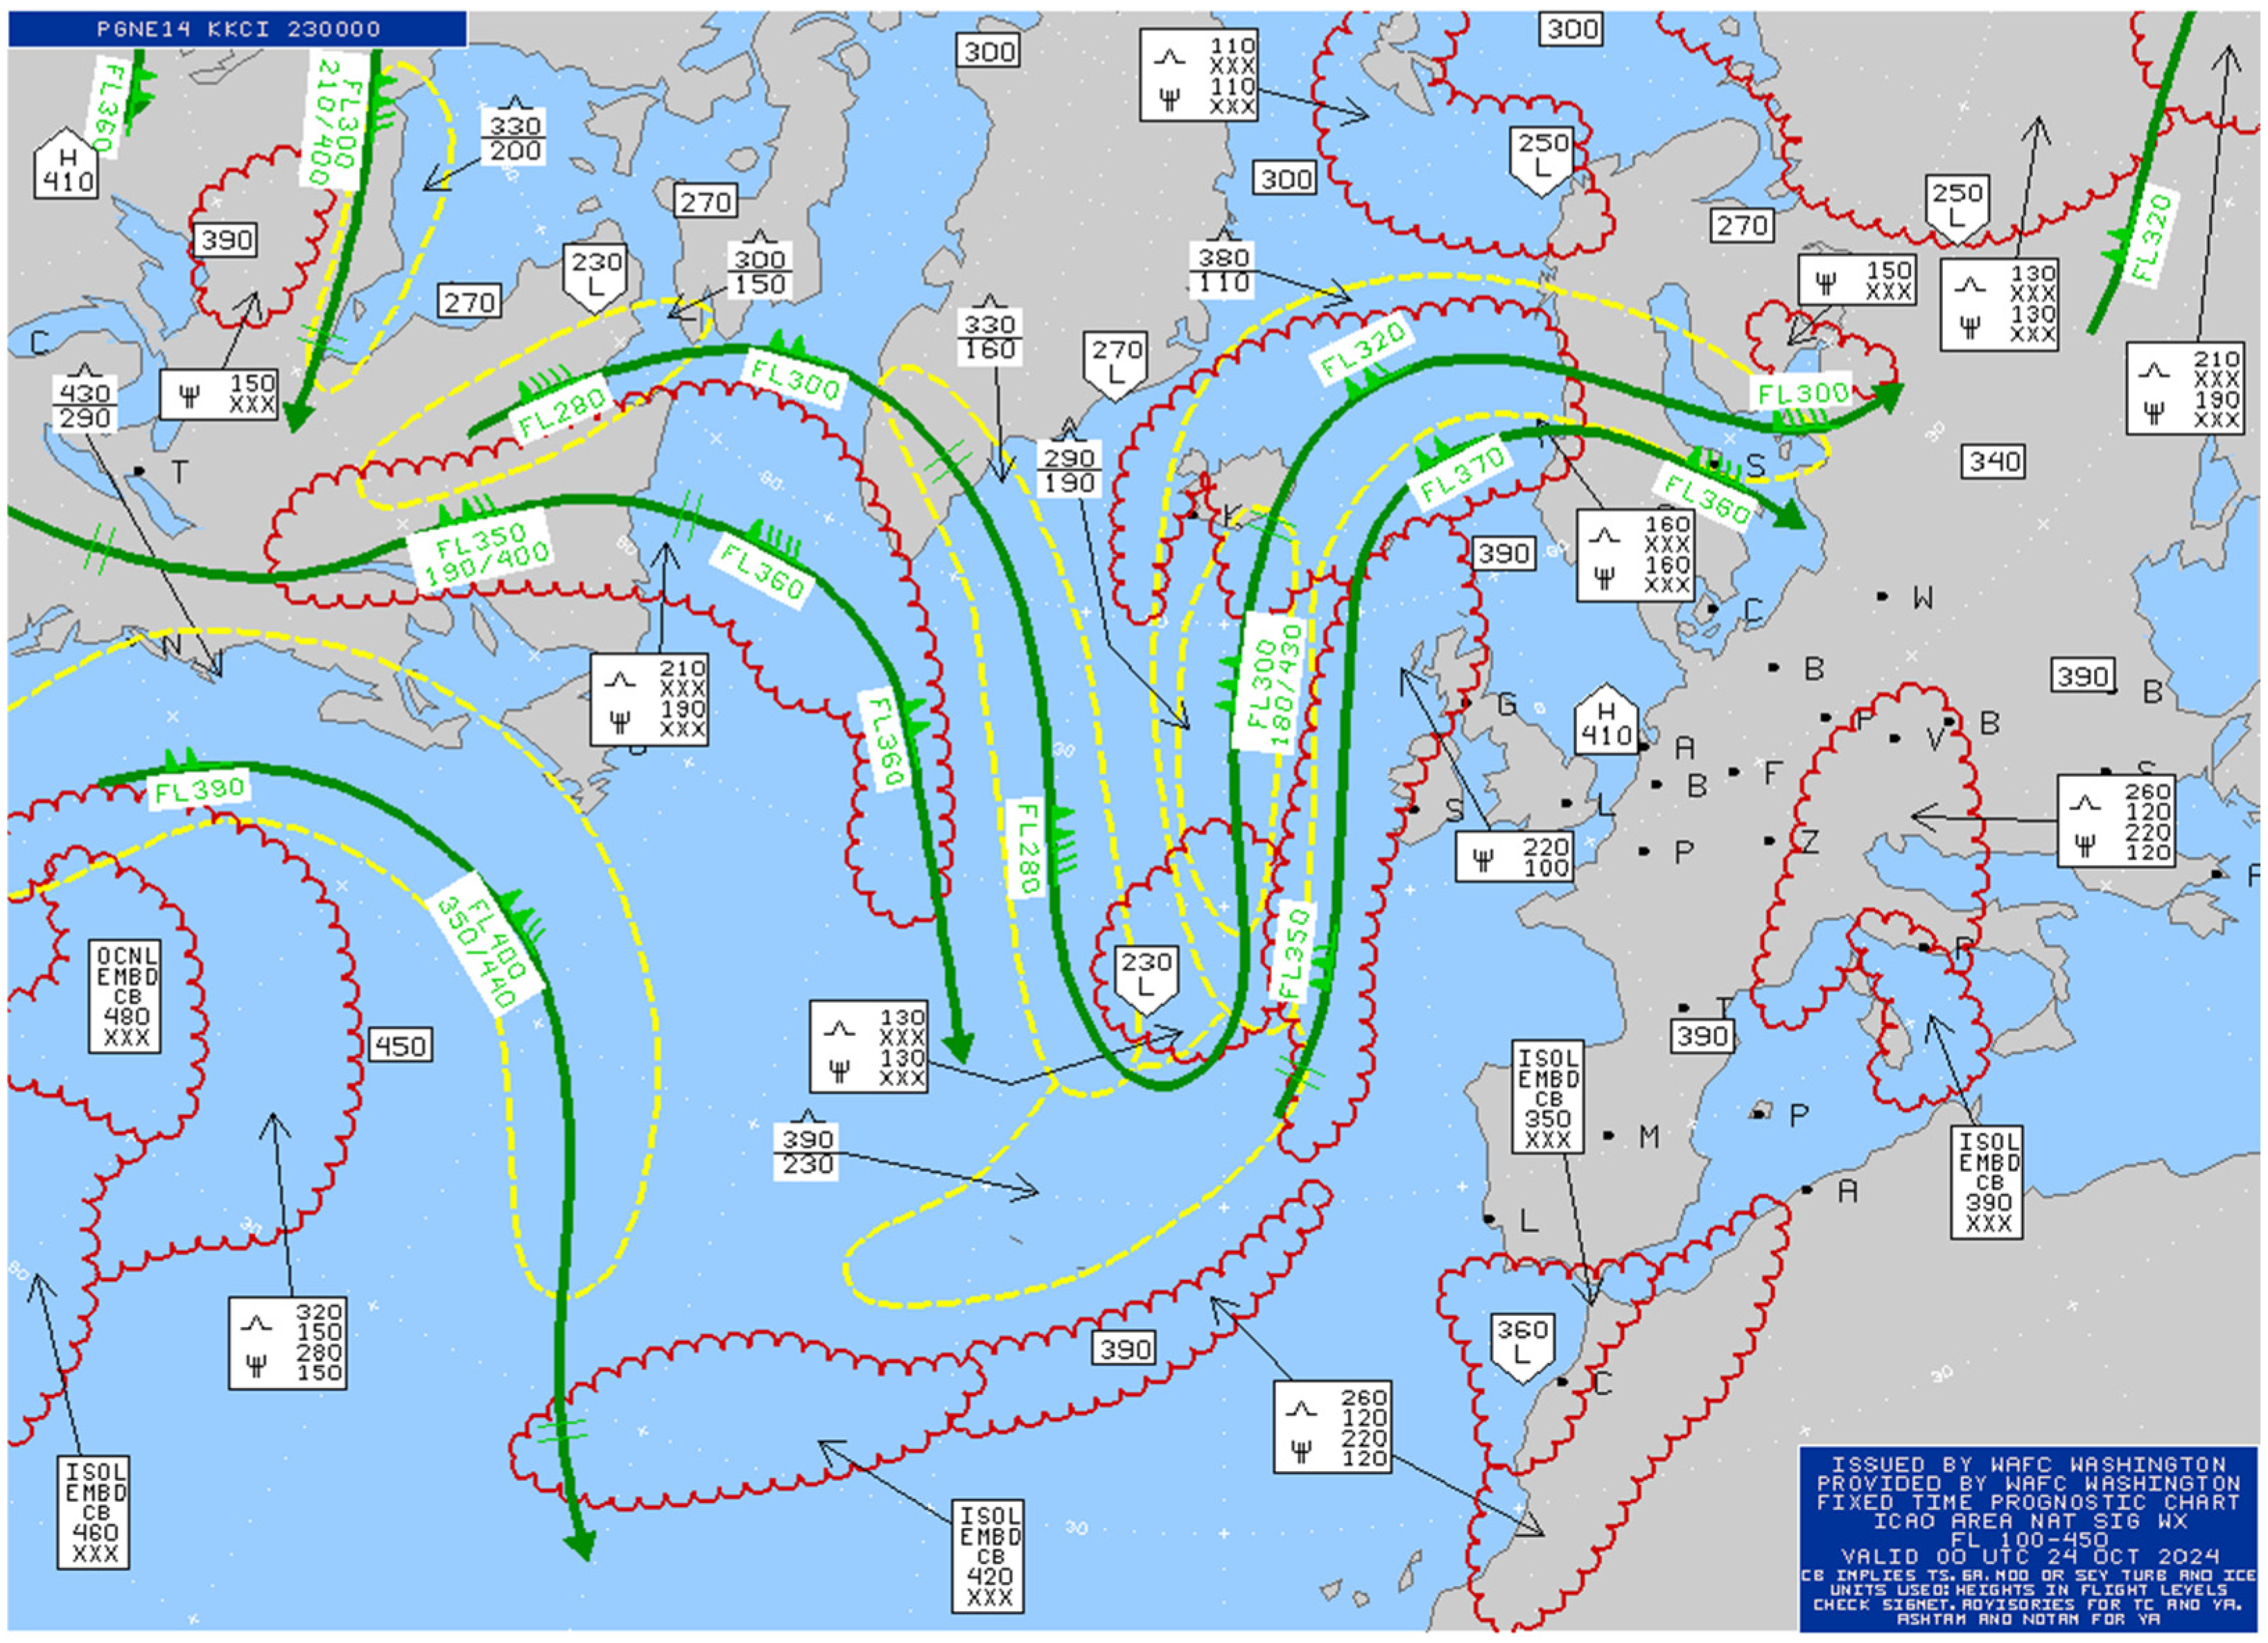
Another tool used to distribute information about turbulence is available worldwide through the World Area Forecast System (WAFS), which has the aim of providing forecasting of significant weather hazards. To provide meteorological information to the aviation community, two World Area Forecast Centres (WAFCs) exist: one is operated by the National Oceanic and Atmospheric Administration (NOAA) in the USA, and the other one is operated by the UK Met Office in Europe. The traditional Significant Weather (SIGWX) forecasts issued by the WAFCs, usually seen in chart form and produced for a single timestamp every 6 h (see example shown in
Figure 10), are currently flanked by the new gridded high-resolution forecasts, available at 3 h timesteps from 6 to 36 h ahead, and updated every 6 h [
68]. Gill (2014) [
69] performed an objective verification of WAFC products using in situ aircraft observations and found that the skill of the new automated gridded forecasts is better than the skill of the SIGWX forecasts. These gridded forecasts are sanctioned by International Civil Aviation Organization (ICAO) for use in flight planning. The ICAO standard dimension for automated turbulence reporting is the cube root of the eddy dissipation rate (EDR). It is a particularly useful metric of turbulence intensity, since it is a state-of-the-atmosphere measure and is independent of the aircraft type [
70].
4.2.3. Collaborative Decision Making (CDM)
In general, CDM aspires to improve the efficiency and resilience of airport operations by optimizing resource use and improving air traffic predictability. This is a systematic approach where stakeholders airlines, ATC, meteorological services, and airport operators work in cooperation to make informed, consensus-based decisions. In CAT management, as outlined above, CDM guarantees efficient communication and coordination between these entities, resulting in enterprising measures to mitigate the impact of turbulence. The main opportunities for CDM exploitation in CAT management are outlined as follows:
Real-Time Information Sharing—In CDM, shared platforms are leveraged to share real-time turbulence data across stakeholders. For instance, aircraft equipped with turbulence detection systems could provide localized information reports, which are integrated into turbulence maps. These maps, dynamically updated, allow ATC and airlines to promptly identify and react to the newest CAT zones at a tactical level.
Proactive Flight Planning—By exploiting predictive weather models, collaborative tools enable pre-flight and in-flight route adjustments. Airlines and ATC could collaborate in replanning aircraft route away from areas predicted having critical CAT, in this way benefitting safety, operational efficiency, and airspace congestion.
Enhanced Communication Channels—The System Wide Information Management (SWIM) framework can facilitate seamless data exchange among all the addressed different stakeholders. Thanks to SWIM, stakeholders can share turbulence forecasts, real-time radar observations, and Pilot Reports (PIREPs), guaranteeing the alignment of decision-making processes.
Improved Passenger Safety and Comfort—By integrating data from diverse sources, CDM can minimize the risk of unexpected turbulence, in this way inherently supporting the increase in passenger comfort and minimizing the risks of injuries caused by these turbulence.
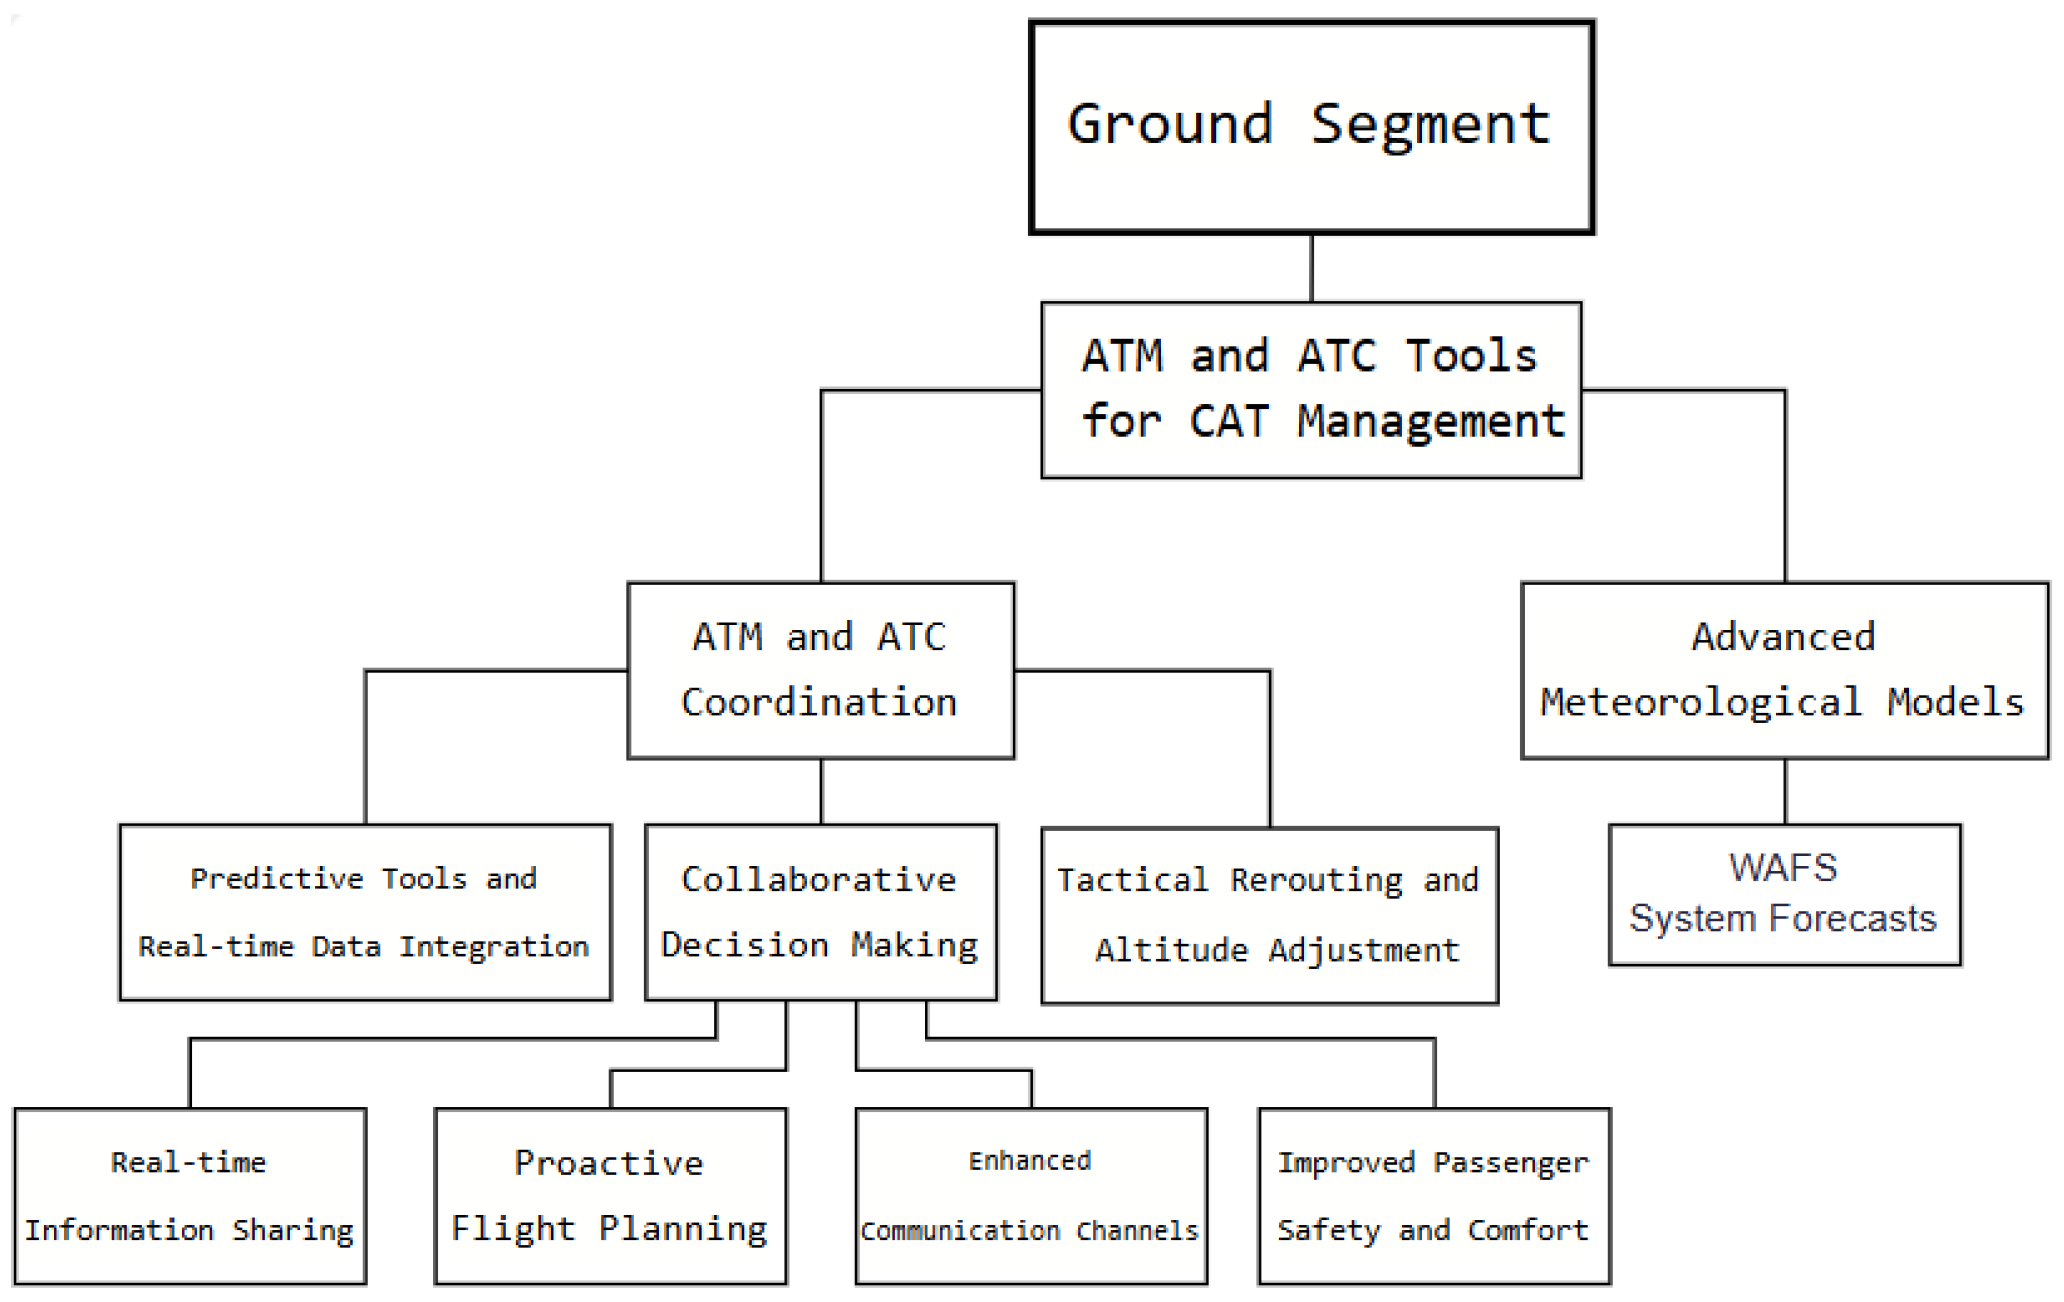
Overall, the technological and operational strategies to manage CAT have evolved considerably, with LIDAR systems, tropospheric profilers, and advanced ATM tools at the forefront. The combination of real-time data from onboard systems and predictive models from ground-based tools ensures better detection, avoidance, and management of CAT. Enhanced coordination between the flight and ground segments remains essential in mitigating the risks associated with CAT, ensuring safer and more efficient aviation operations. Also, regarding the ground segment, it can be summarized in the diagram below (
Figure 11) the impact of clear-air turbulence on aeronautical operations from the point of view of the ground segment. In the figure, we can observe the synthesis of the main technological and operational systems used in the ground segment in the CAT management.
5. Conclusions
Clear-air turbulence poses serious issues for aviation, causing discomfort, injuries, and problems that may have serious effects at an operational level and may negatively impact the safety and efficiency of aviation operations. Such issues have emerged as important aspects in the flow of news in recent years, based on the increased occurrence and severity of CAT due to climate change effects. Because CAT is hard to see with the naked eye or standard weather radar, progress in both scientific understanding and applicable technologies and strategies for mitigation are essential for handling it during flights. In this review paper, the state of the art and most recent progresses in this domain have been addressed and examined, by first indicating the CAT causes and formation process, and then analyzing two macro areas (scientific, encompassing the methodologies for CAT detection and forecast; technological and operational, encompassing the onboard and ground technologies for CAT detection) and the mitigation strategies that can be put in place to prevent the aircraft from flying into turbulent areas.
The main challenge related to CAT occurrence is that it is not possible for pilots to visually or instrumentally detect during flight. Therefore, CAT forecasts have traditionally relied on Numerical Weather Prediction models, which nevertheless suffer from issues in terms of scale because CAT involves physical processes at scales usually smaller than the resolution of NWP models. On one hand, this indicates the need for further research in NWP, and on the other it provides motivation in the push to exploit real-time satellite data as a further means to identify the occurrence of CAT. Nevertheless, CAT detection has proven very difficult even with remote sensing, thus motivating further research and development in this domain.
Regarding the onboard available technologies supporting pilots in detecting and managing CAT, available alarm systems provide an important layer of protection against the unexpected nature of CAT. Nevertheless, to date, such systems are designed as reactive ones, motivating the need for further developments in sensor integration, data sharing, and predictive capabilities in order to also provide such systems with proactive features. LIDAR systems, tropospheric profilers, and advanced ATM tools are the core of the ongoing technological enhancements and are promising toward this aim, thanks also to the possibility of combining real-time data from onboard systems and predictive models from ground-based tools to ensure the better detection, avoidance, and management of CAT. In addition, the possibility of using flying aircraft as real-time sensors of occurring CAT events and sharing such information in a broadcast to enable the creation of a tactical picture of CAT, and to prevent other aircraft from crossing the affected airspace volumes, is very important and promising. It emphasizes the importance of reliable and well-dimensioned communication network for air–air and air–ground communication.
Finally, in terms of CAT management strategies, enhanced coordination between the flight and ground segments remains essential in mitigating the risks associated with CAT, ensuring safer and more efficient aviation operations. In this framework, the ever-increasing importance of the paradigm of Collaborative Decision Making (CDM) supported by SWIM infrastructure is evident.
Overall, it is clear from the analysis carried out in this paper that the consideration of CAT started several decades ago and progressed over time, making available up-to-date a range of methodological and technological tools for understanding, predicting, and detecting such phenomena. Nevertheless, these tools still need to be improved to achieve better results and more appropriate anticipation of the phenomena at a tactical level. A highly relevant aspect to be considered to inform and drive future research and development activities is the need and opportunity to enhance the coordination between airborne and ground segments, in order to enable shared information and tactical maps for detecting CAT among onboard and ground segments, in real time, during a flight. The benefits arising from such future improvements would be further maximized by the anticipation, as accurately as possible, of CAT prediction, thus allowing pilots, air traffic controllers, and all stakeholders involved to take corresponding measures in advance, in this way reducing ex ante the impact of CAT. Such considerations very clearly motivate and justify a relevant increase in the research and development efforts in this domain.


 ,
, 


