
Research on the Anti-Erosion Capacity of Aeolian Sand Solidified with Enzyme Mineralization and Fiber Reinforcement Under Ultraviolet Erosion and Freeze–Thaw Erosion


Abstract
1. Introduction
2. Materials and Methods
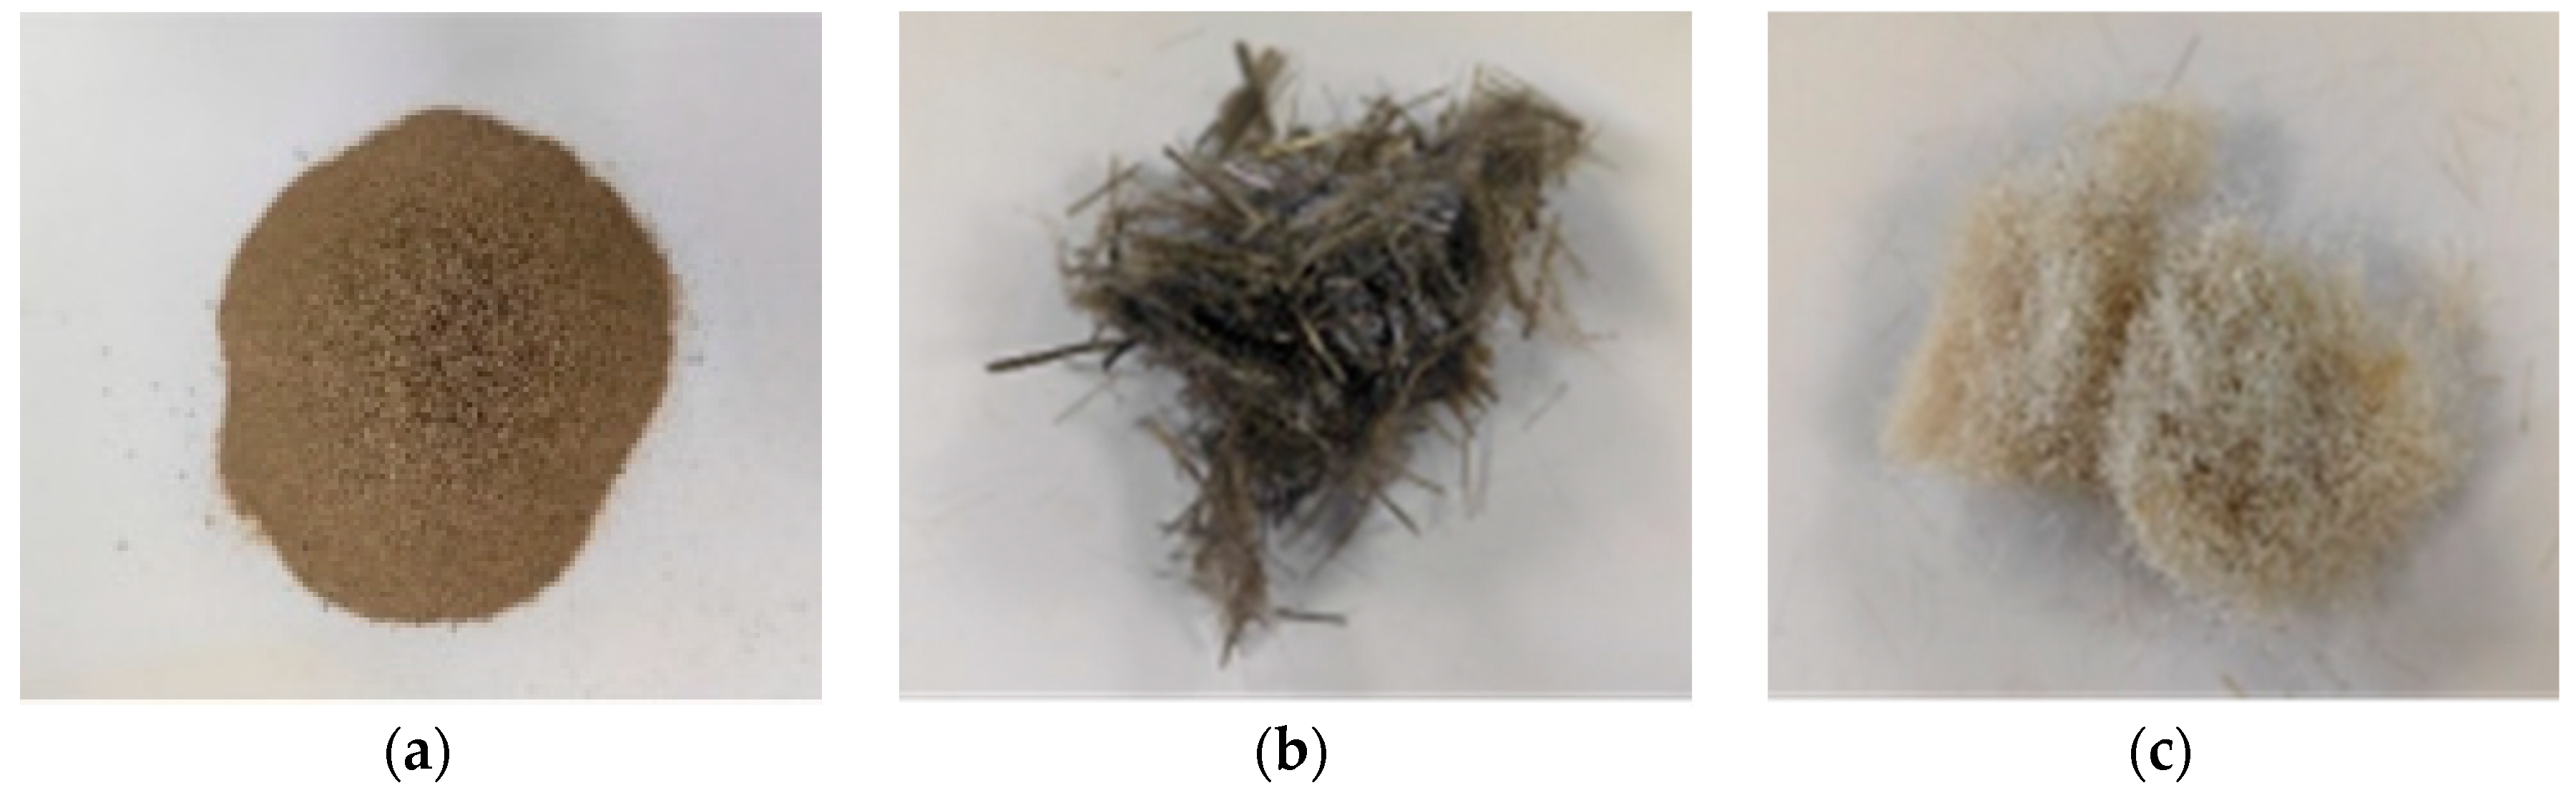
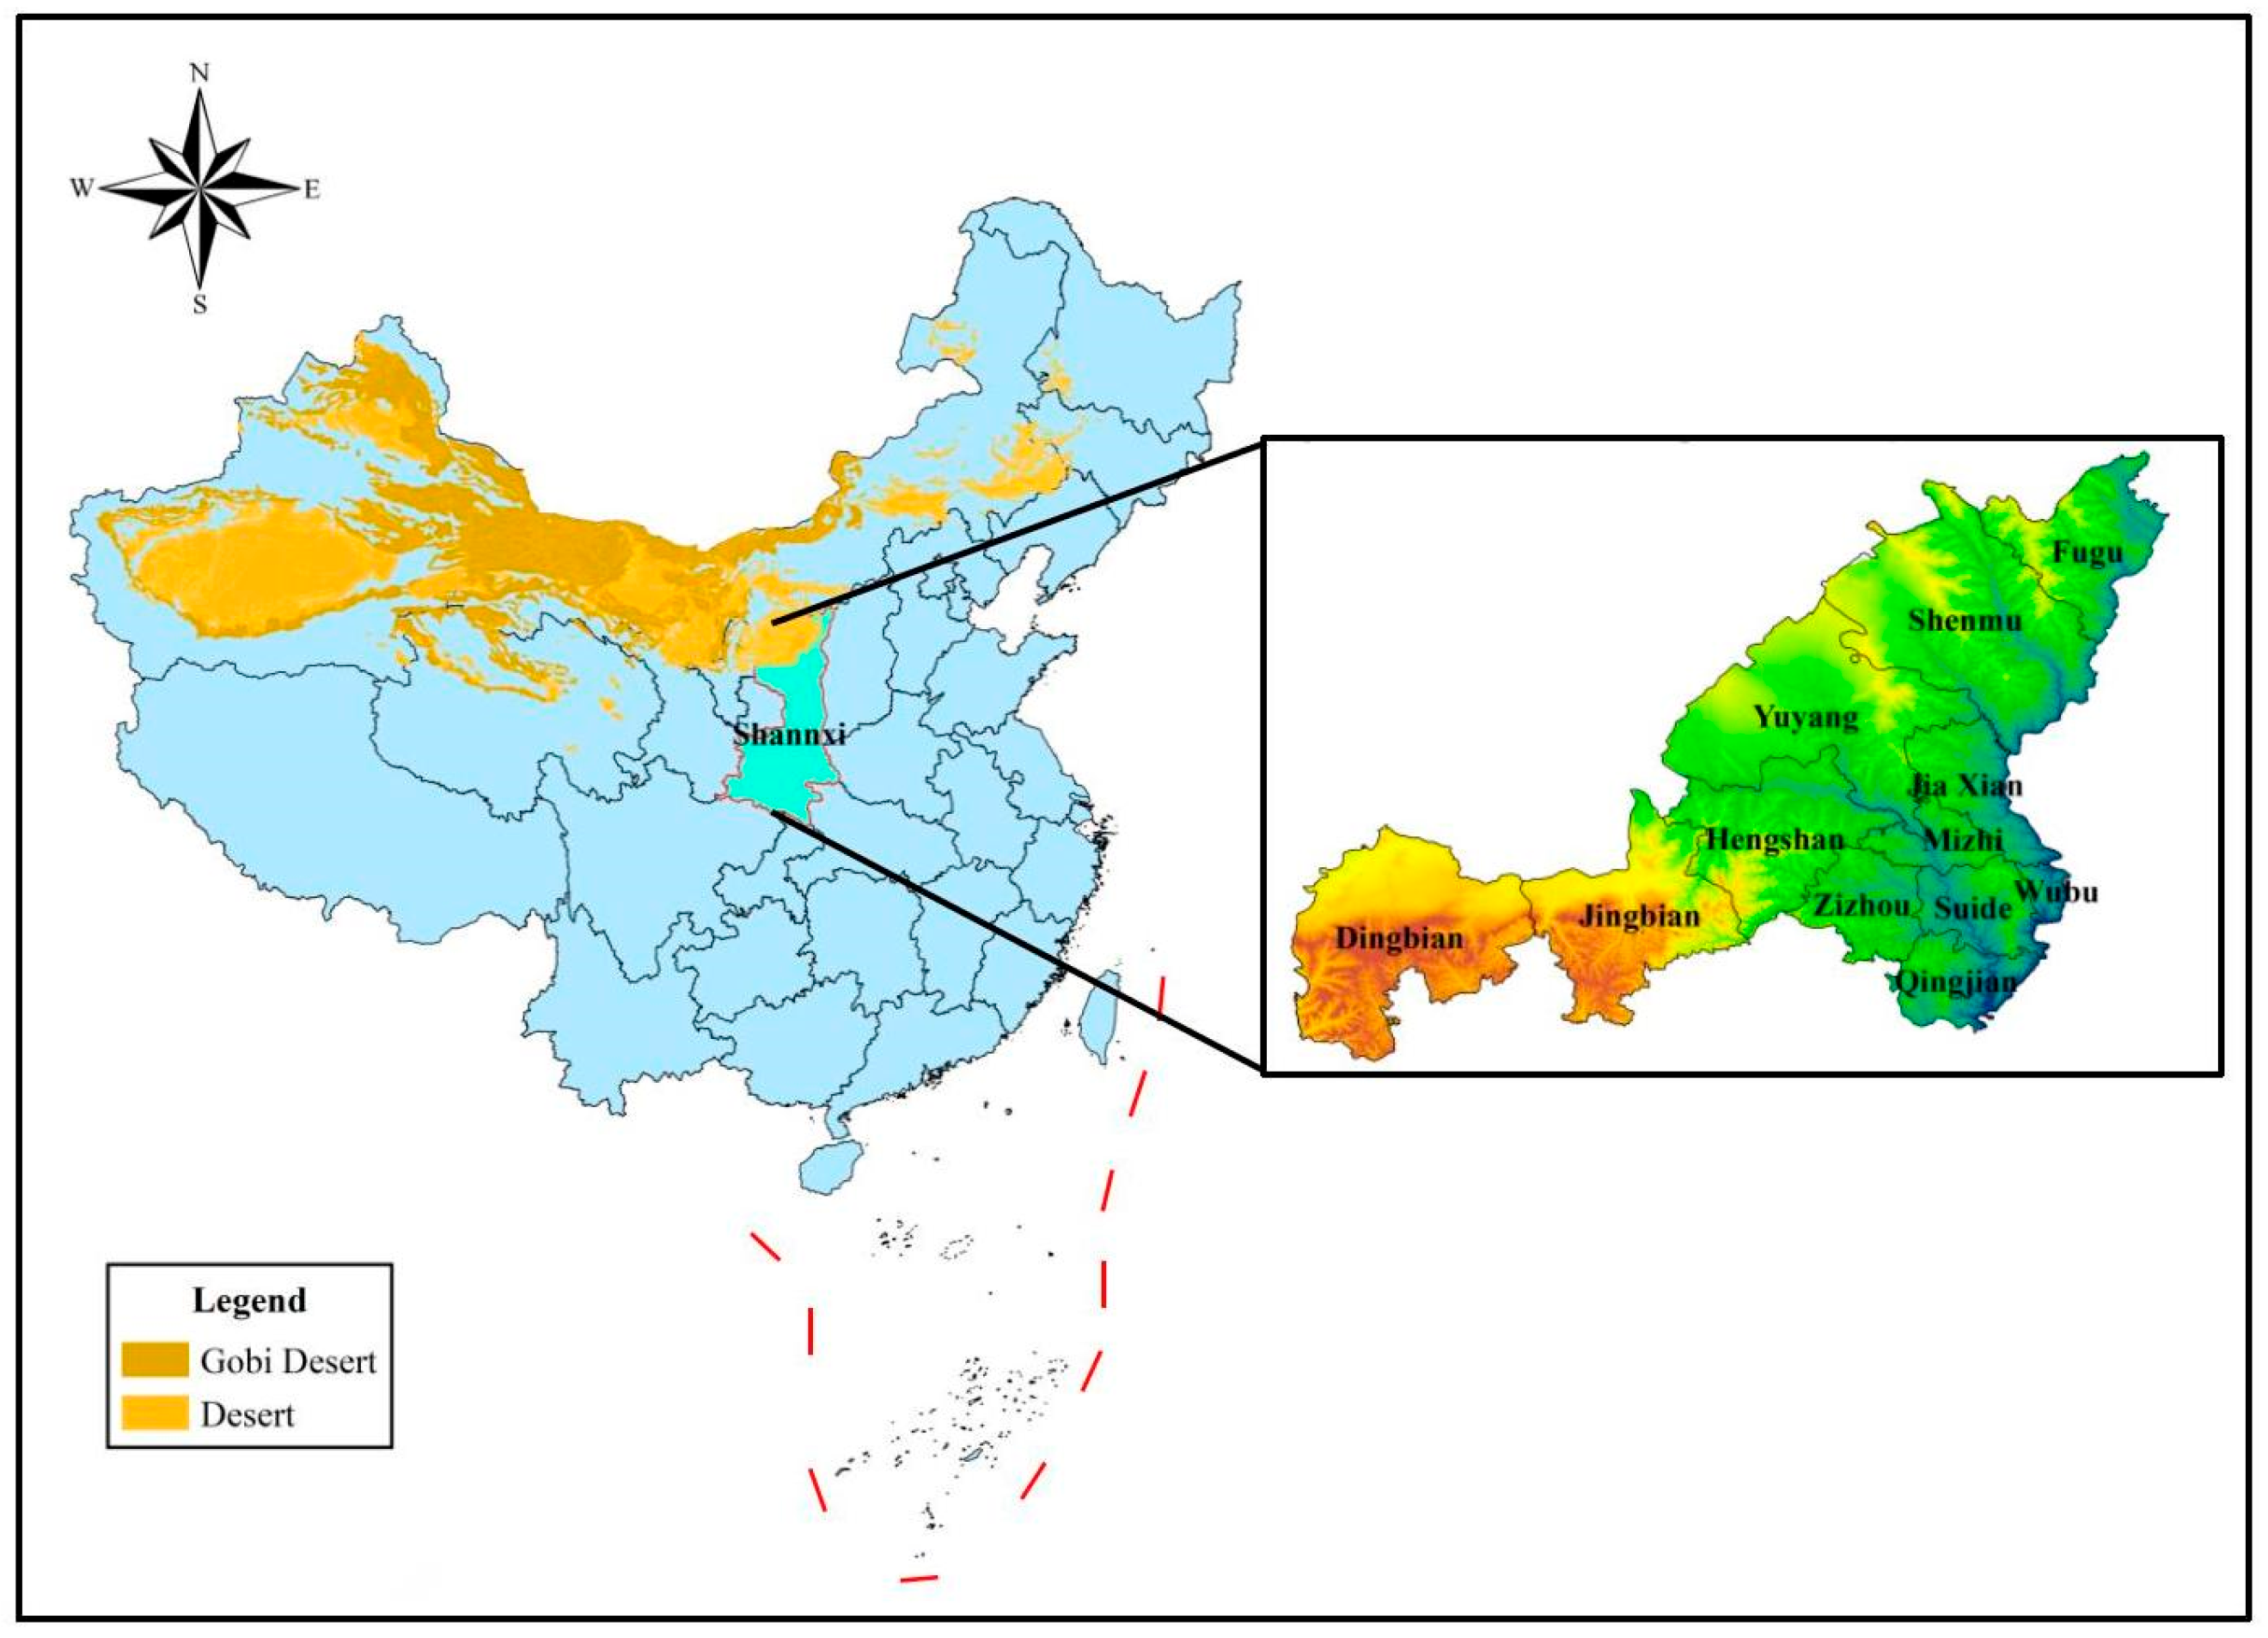
2.1. Test Materials
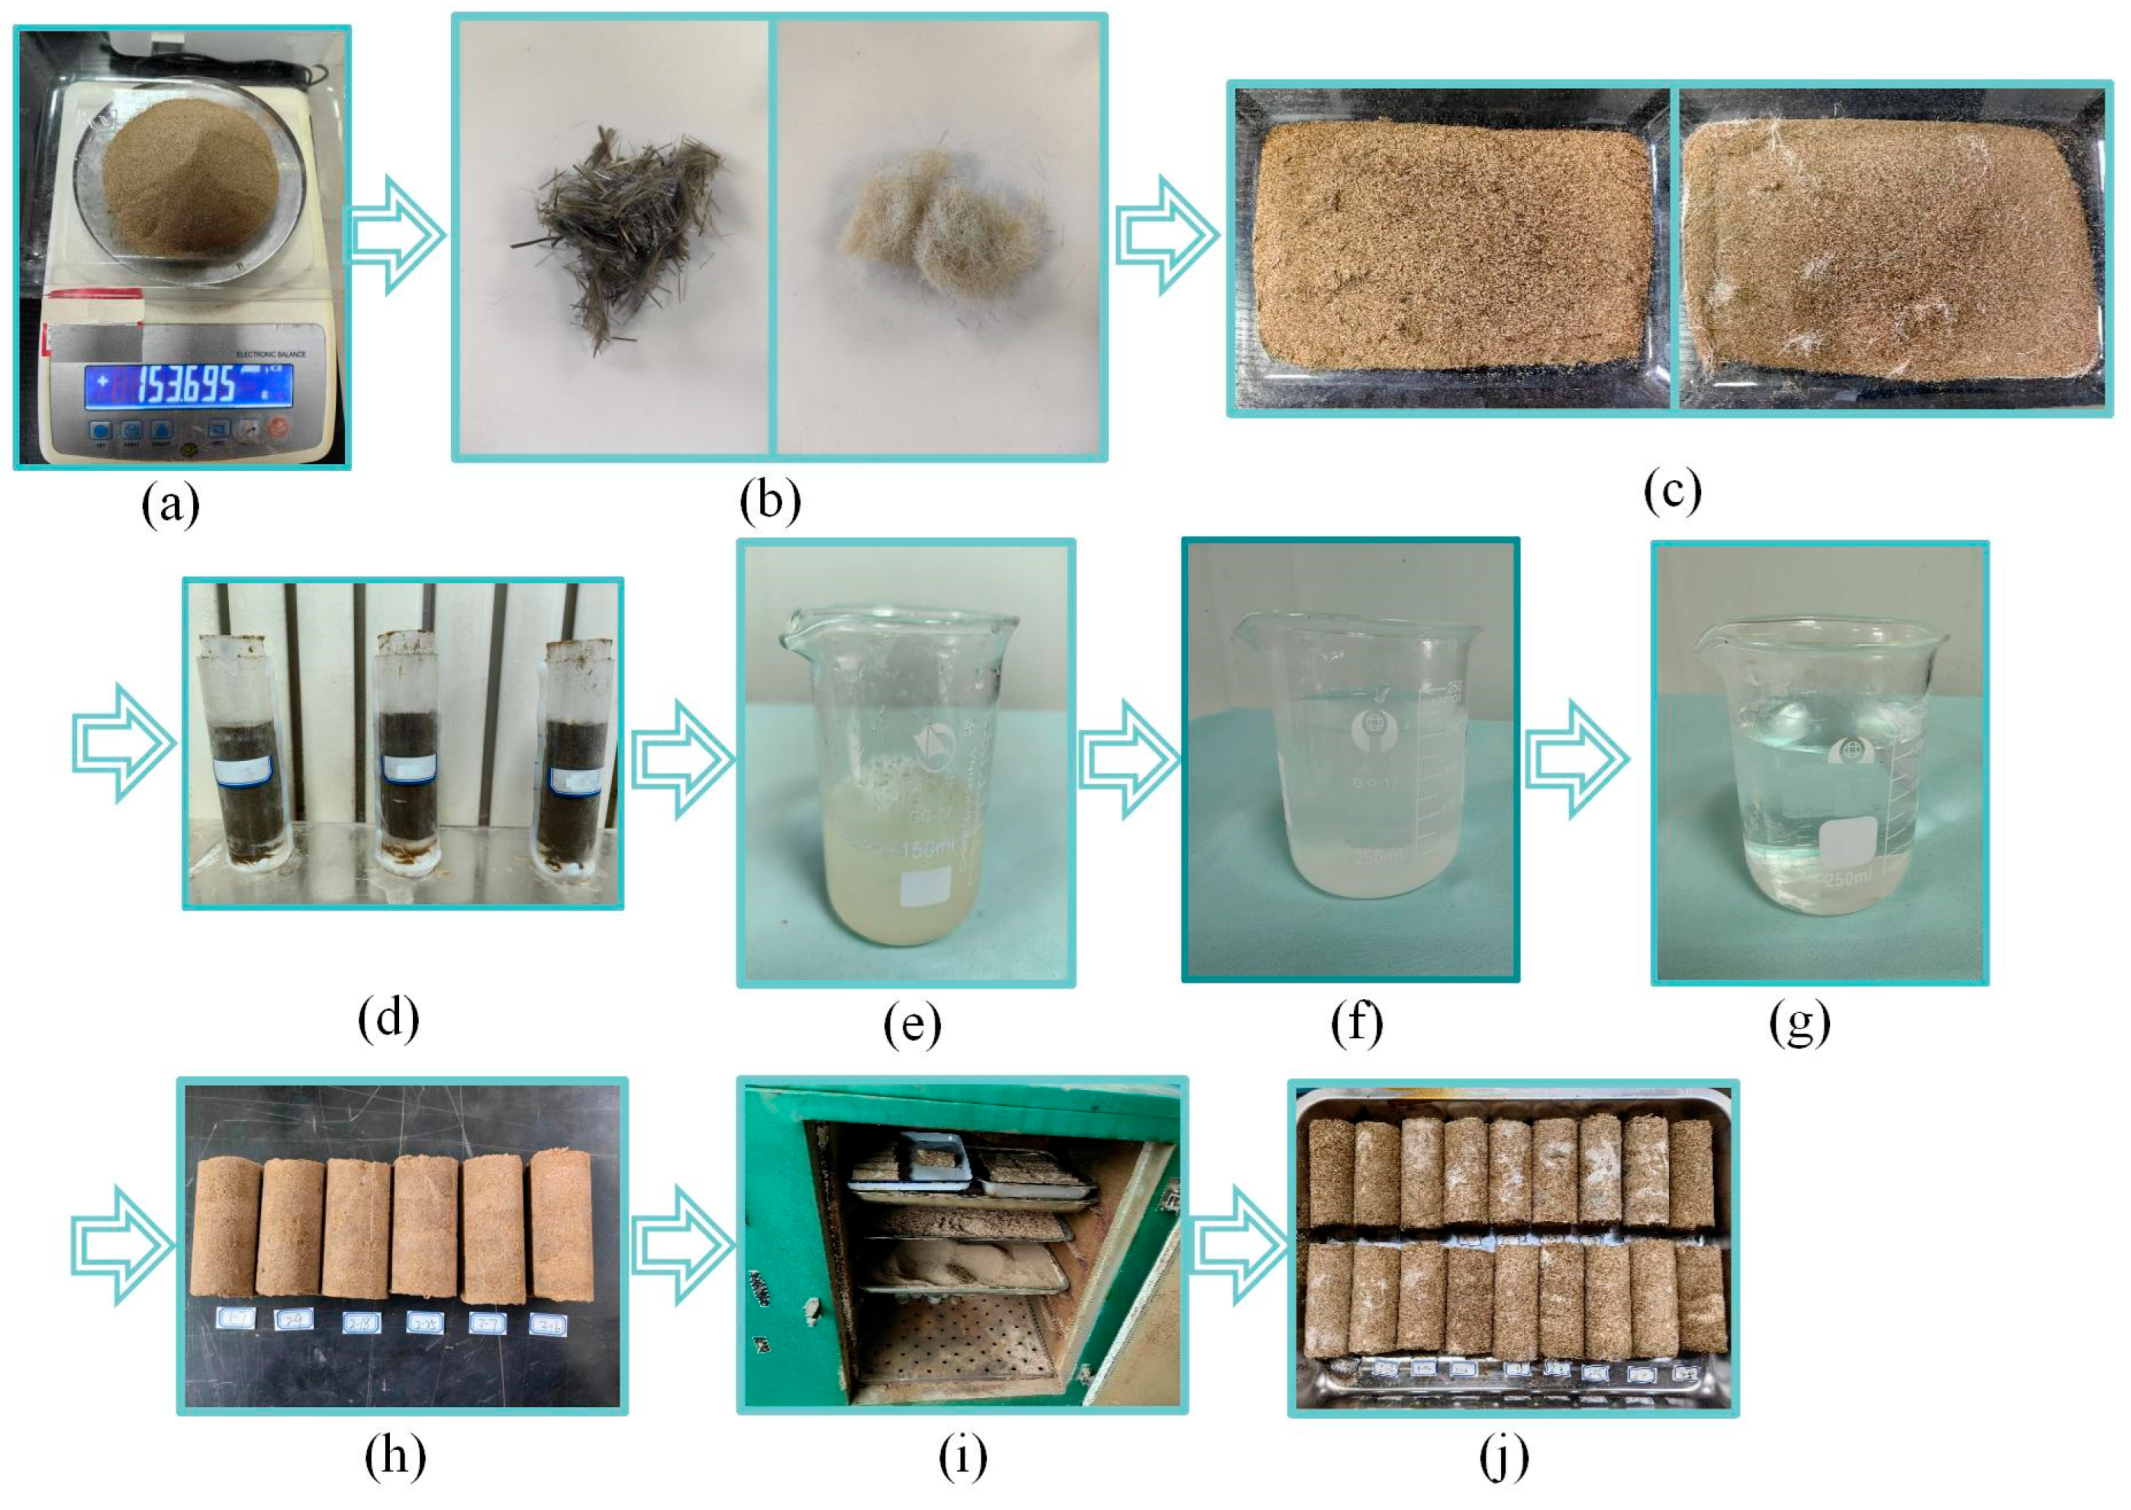
2.2. Sample Preparation
2.3. Test Methods
3. Results and Analysis of UV Erosion Test
3.1. Analysis of Sample Appearance
3.2. Analysis of Quality Losses
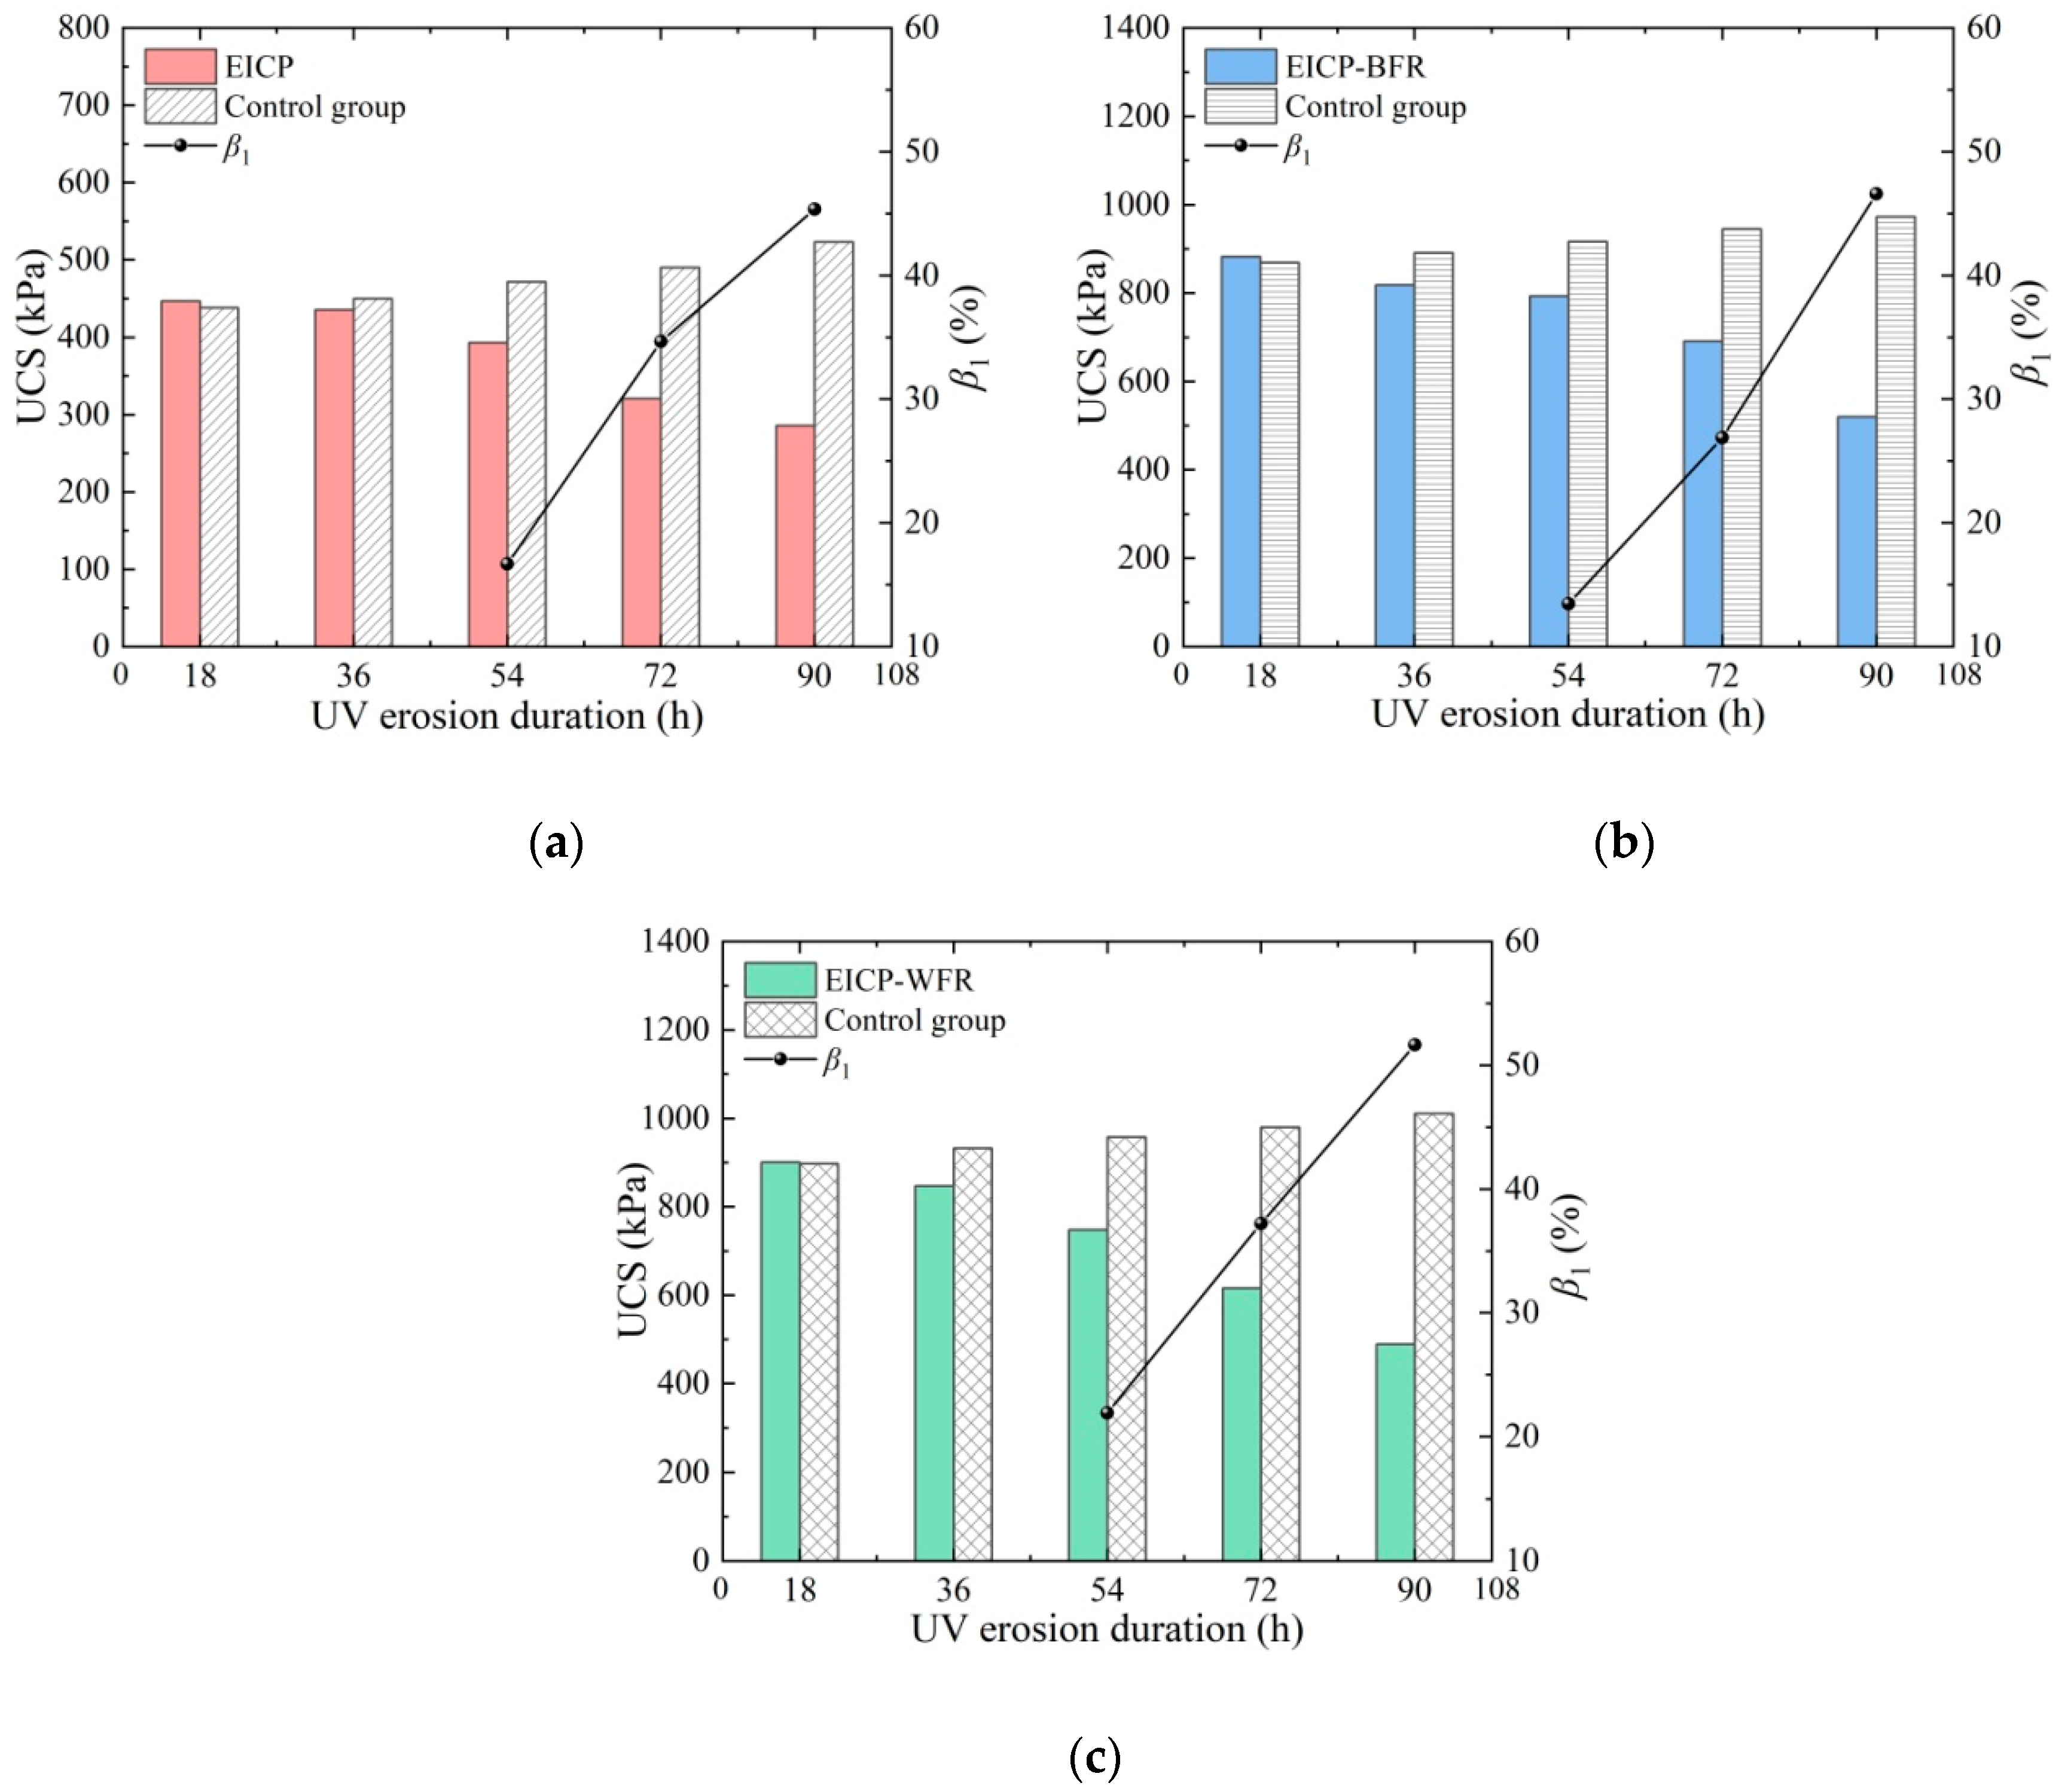
3.3. Analysis of UCS
3.4. Analysis of UV Erosion Mechanism
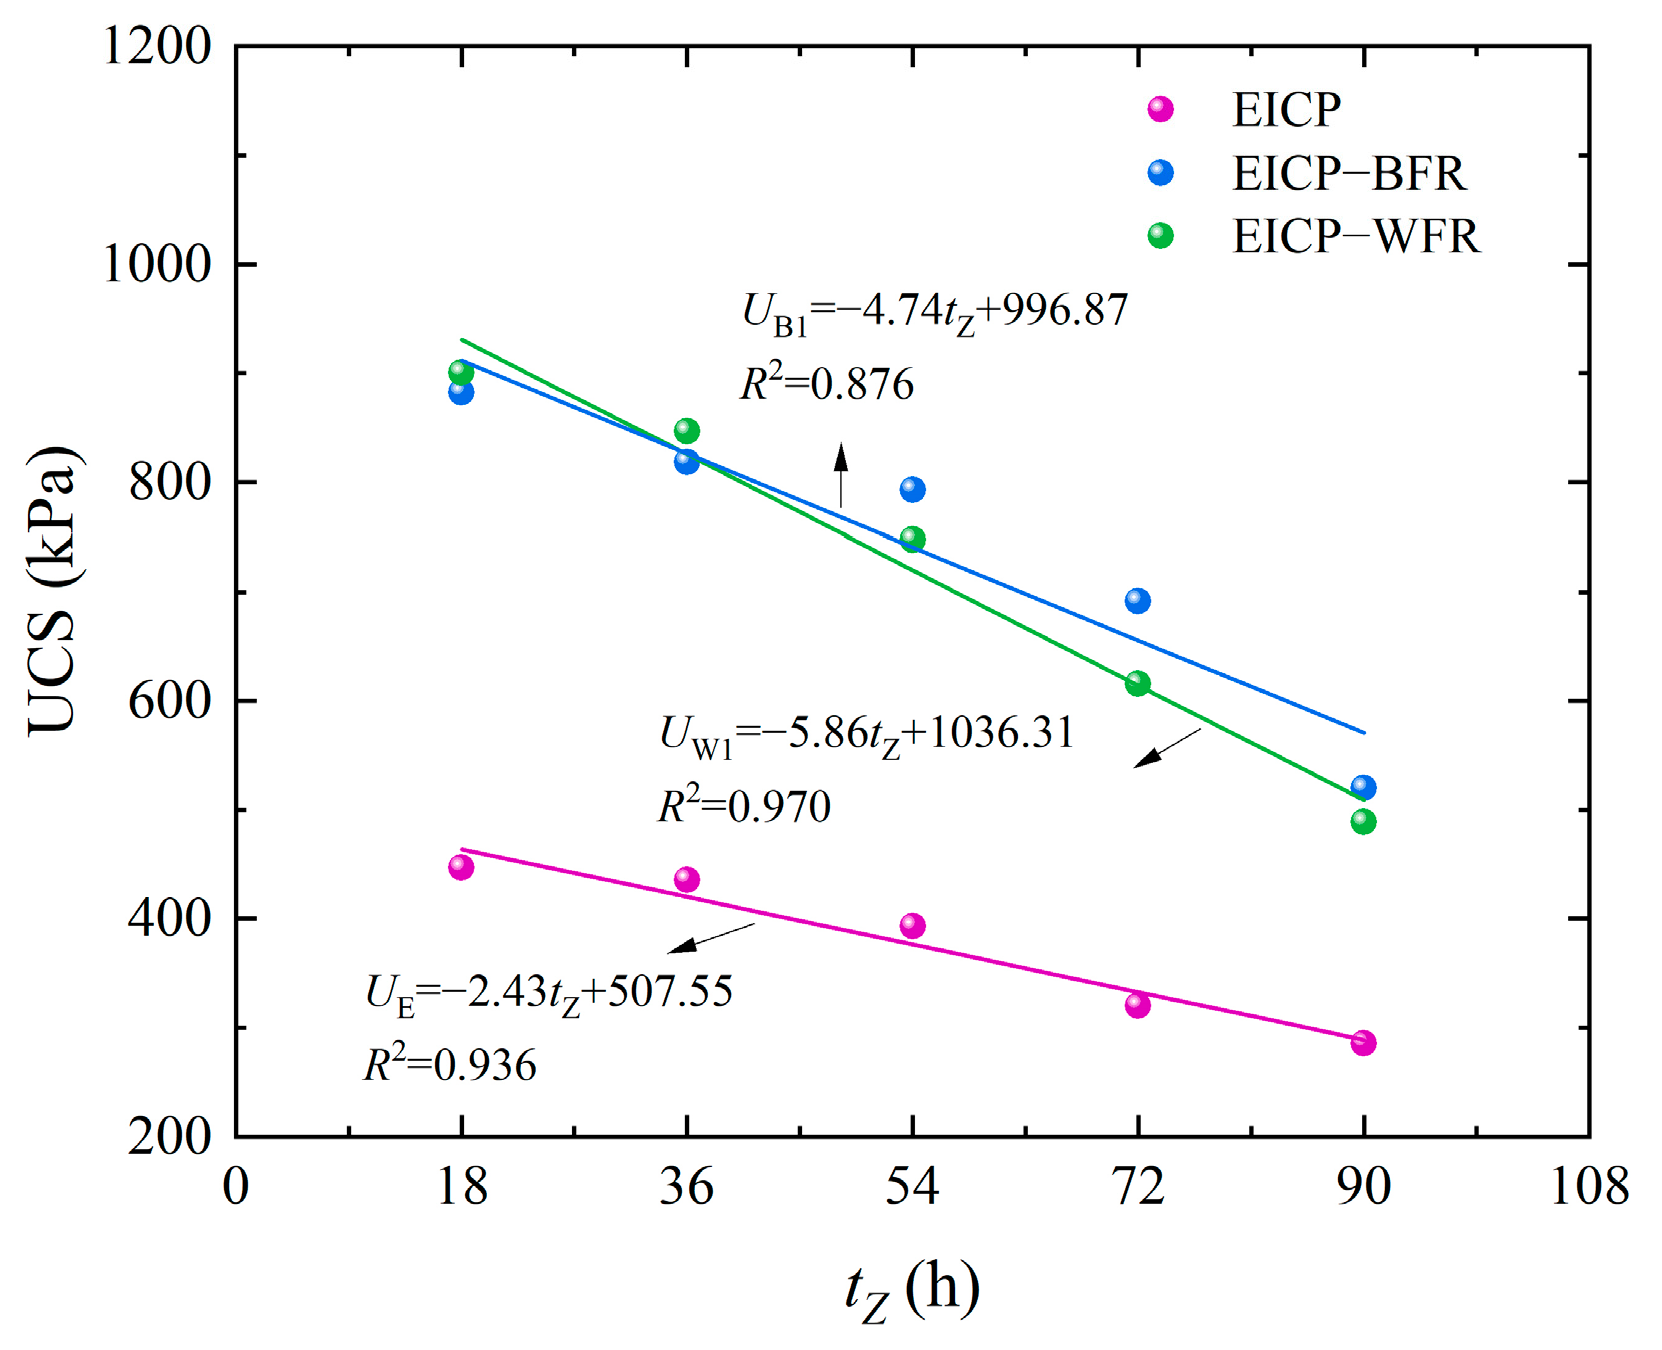
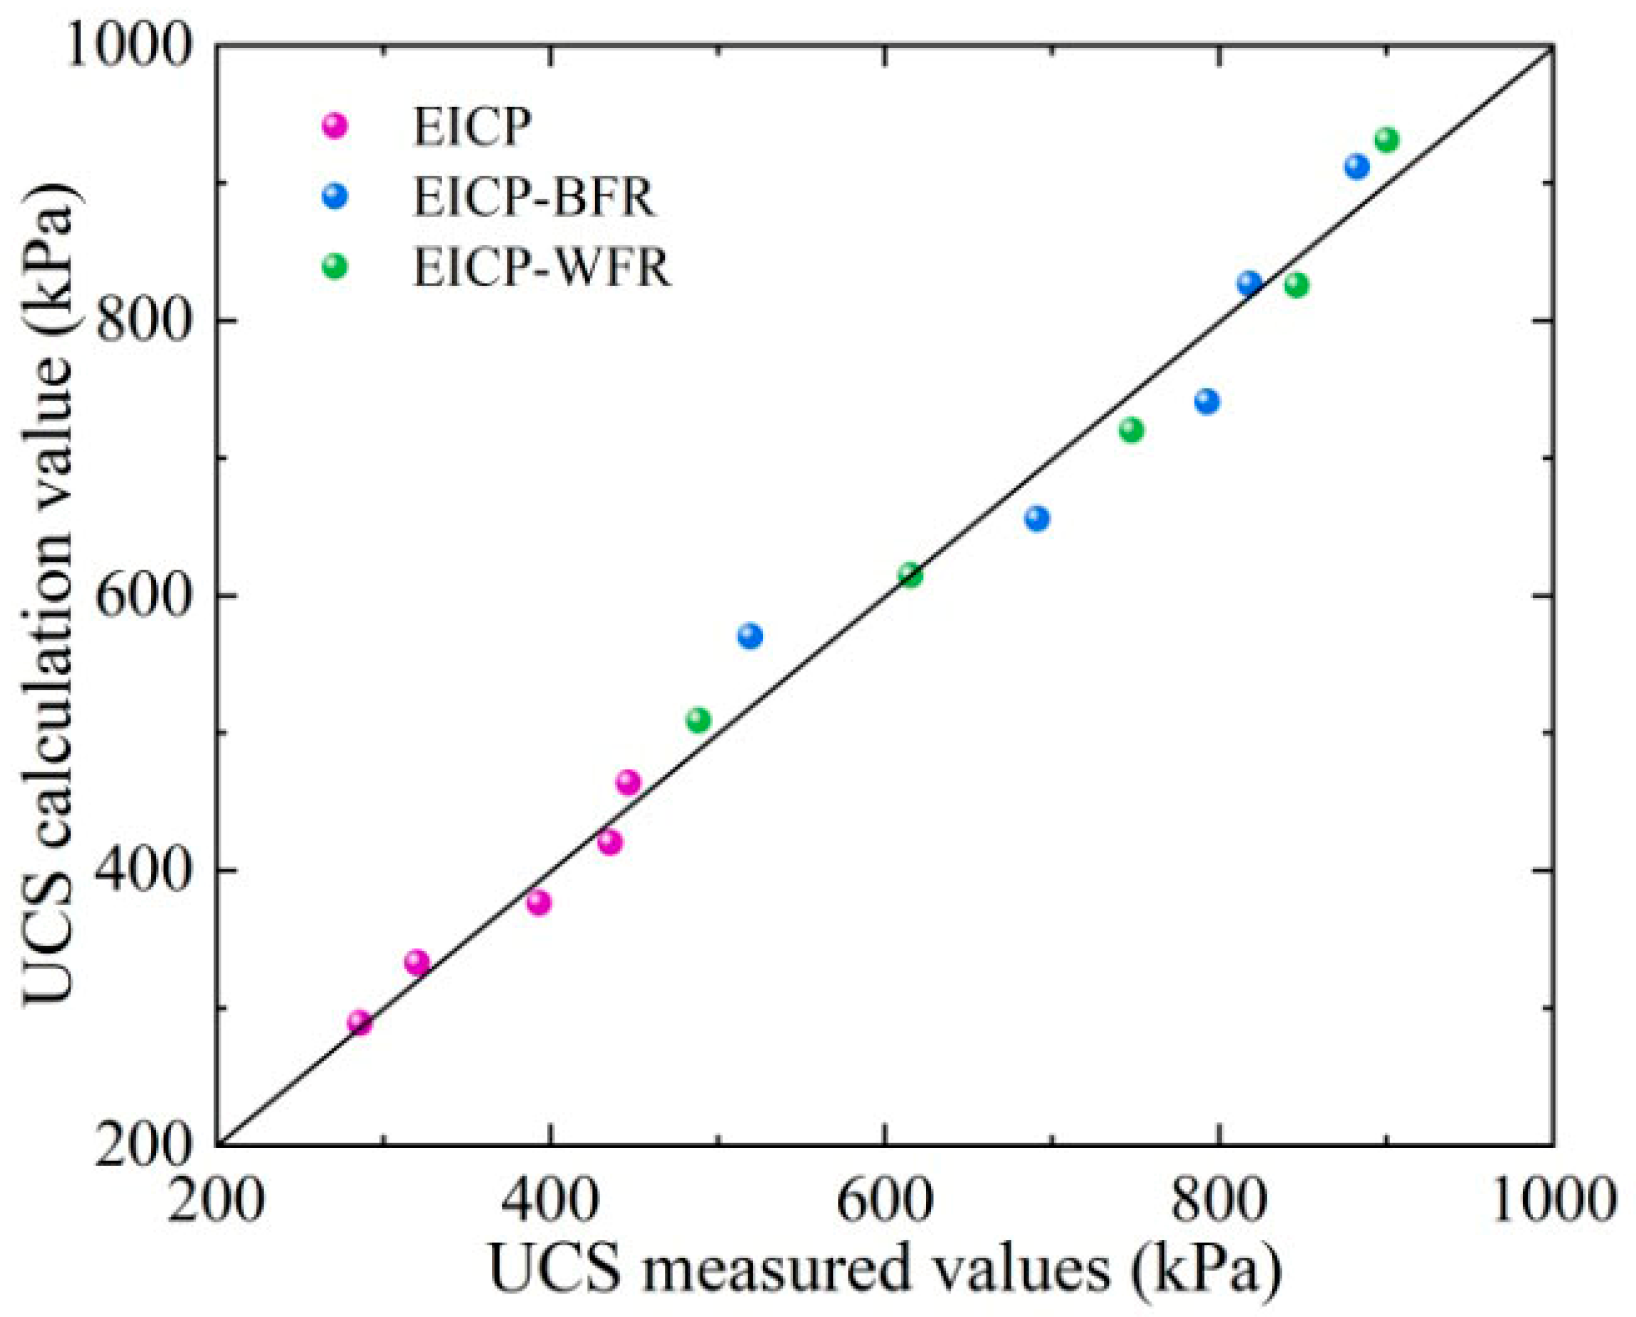
3.5. UCS Model Establishment and Verification
4. Results and Analysis of Freeze–Thaw Erosion Test
4.1. Analysis of Sample Appearance
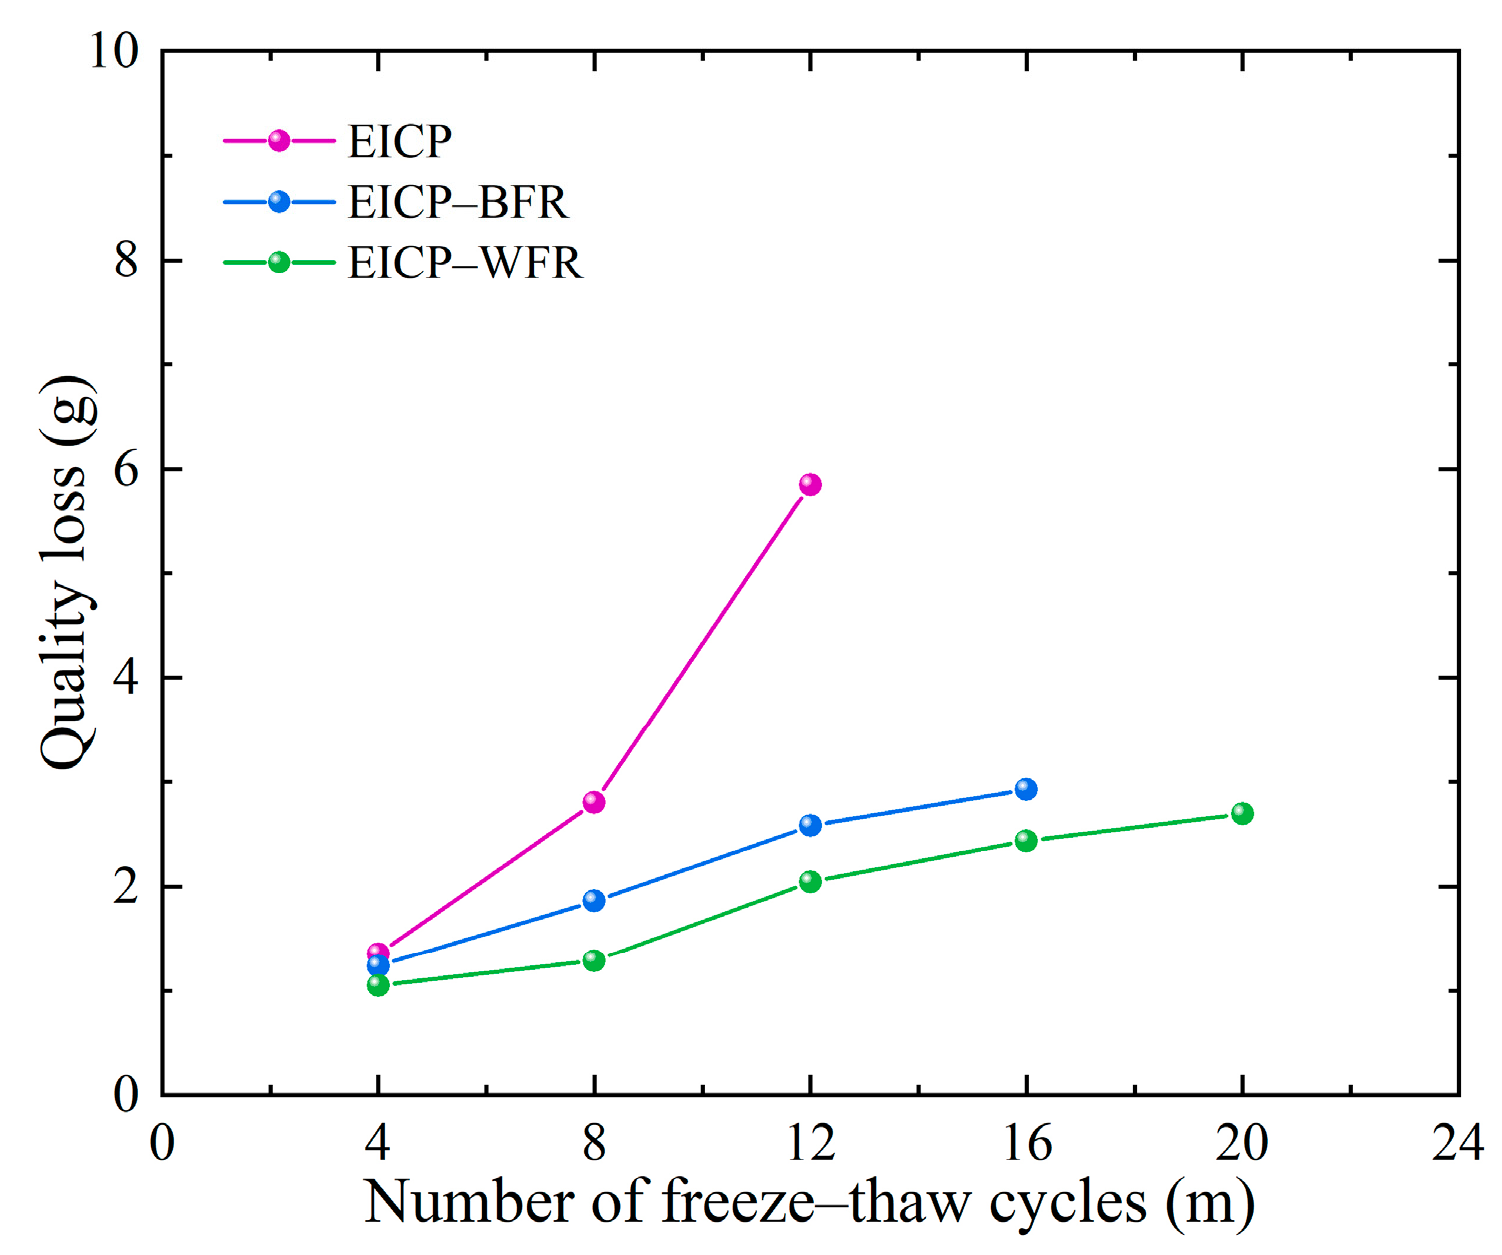
4.2. Analysis of Quality Losses
4.3. Analysis of UCS
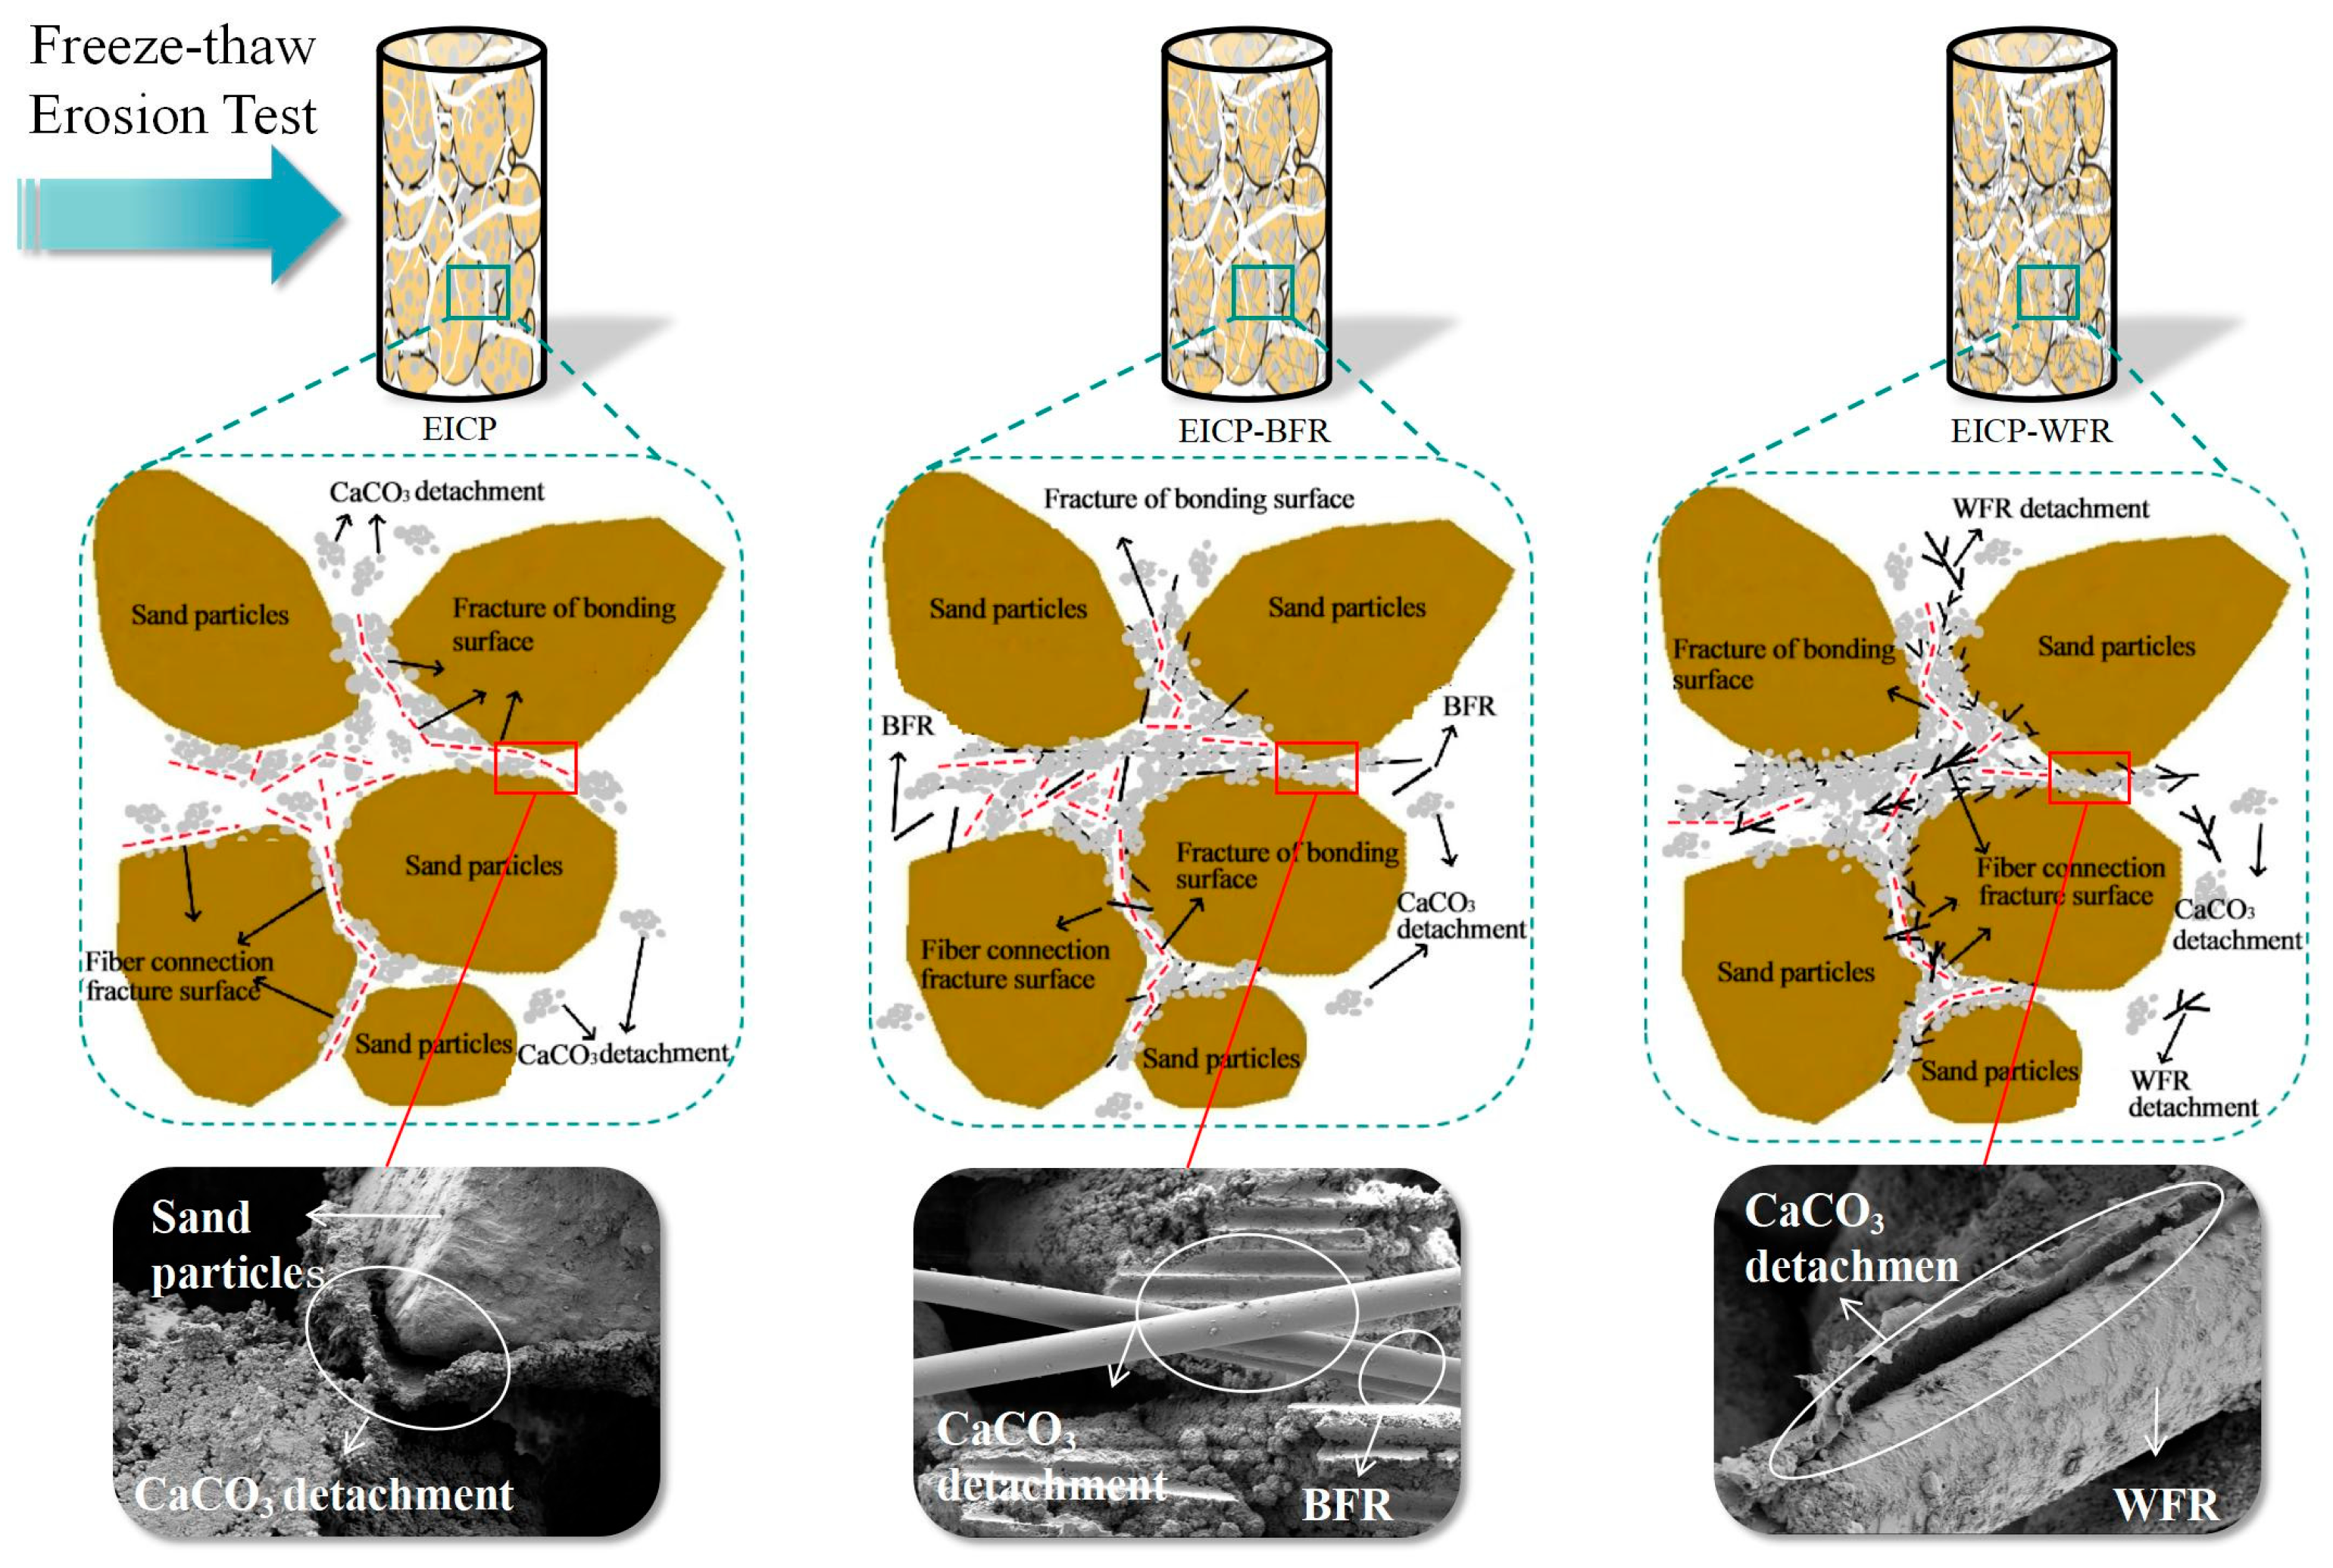
4.4. Analysis of Freeze–Thaw Erosion Mechanism
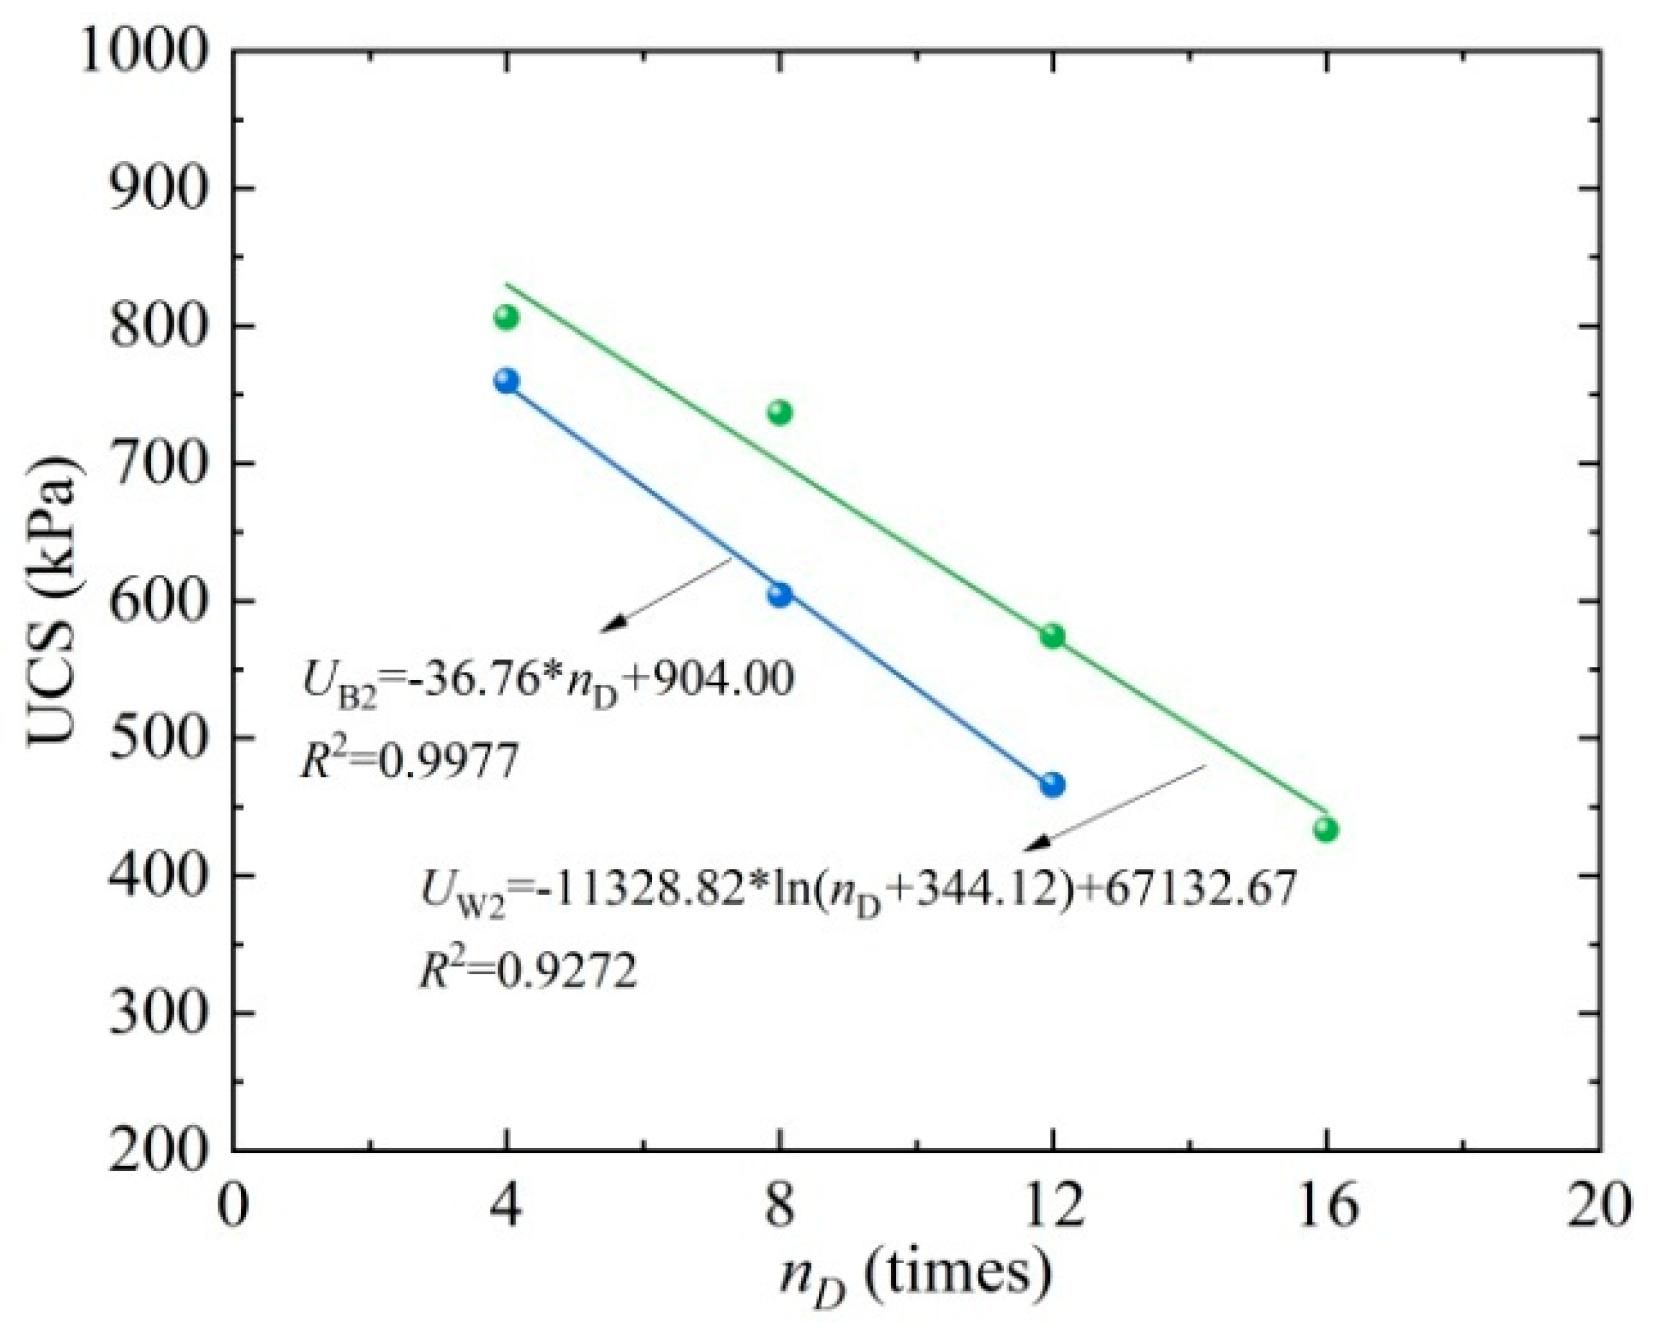
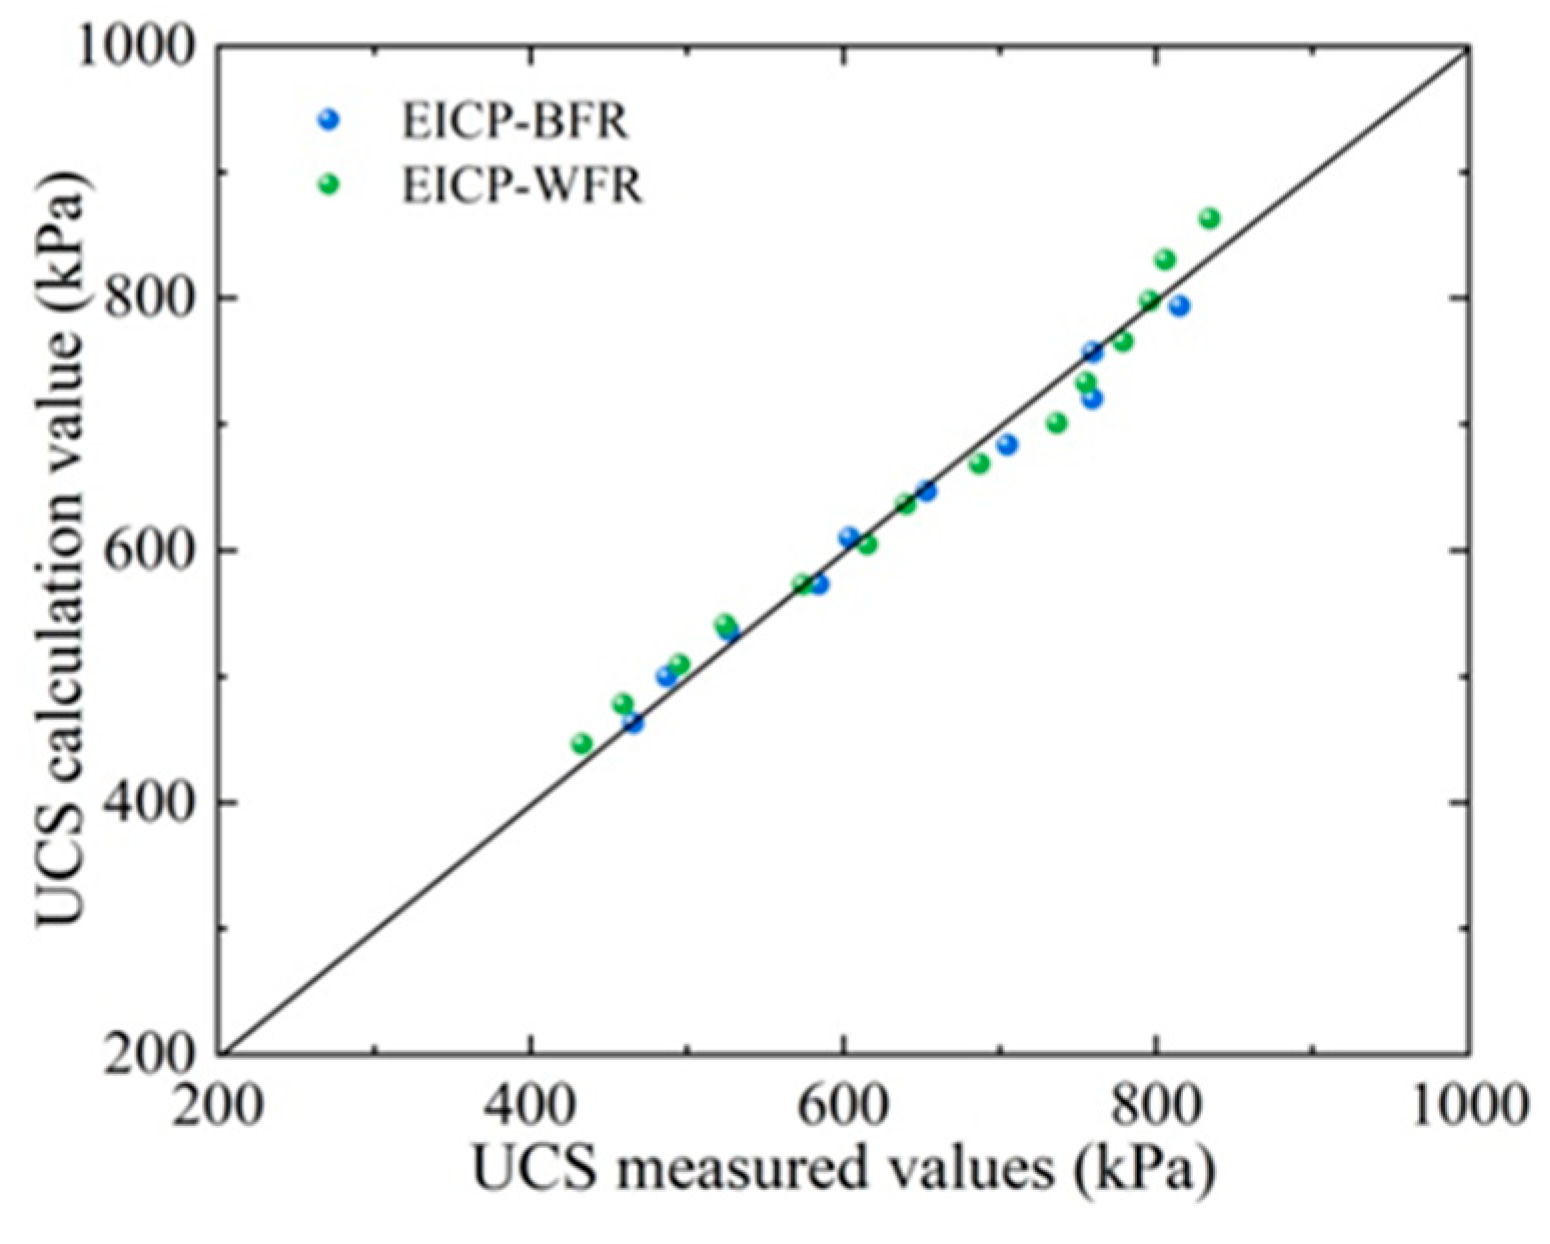
4.5. UCS Model Establishment and Verification
5. Conclusions
- Under UV erosion, the apparent conditions of the three samples show different patterns with the increase in ultraviolet erosion duration. After 18 h, a large amount of CaCO3 crystals precipitated on the surface of the EICP sample, but there was no significant effect on the appearance of the sample with increasing time. After 36 h, sand particles and CaCO3 crystals fell off the surface of the EICP–BFR sample. After 36 h, the color of the EICP–WFR sample gradually deepened, and the sand particles, CaCO3 crystals, and wool fibers on the sample’s surface gradually fell off.
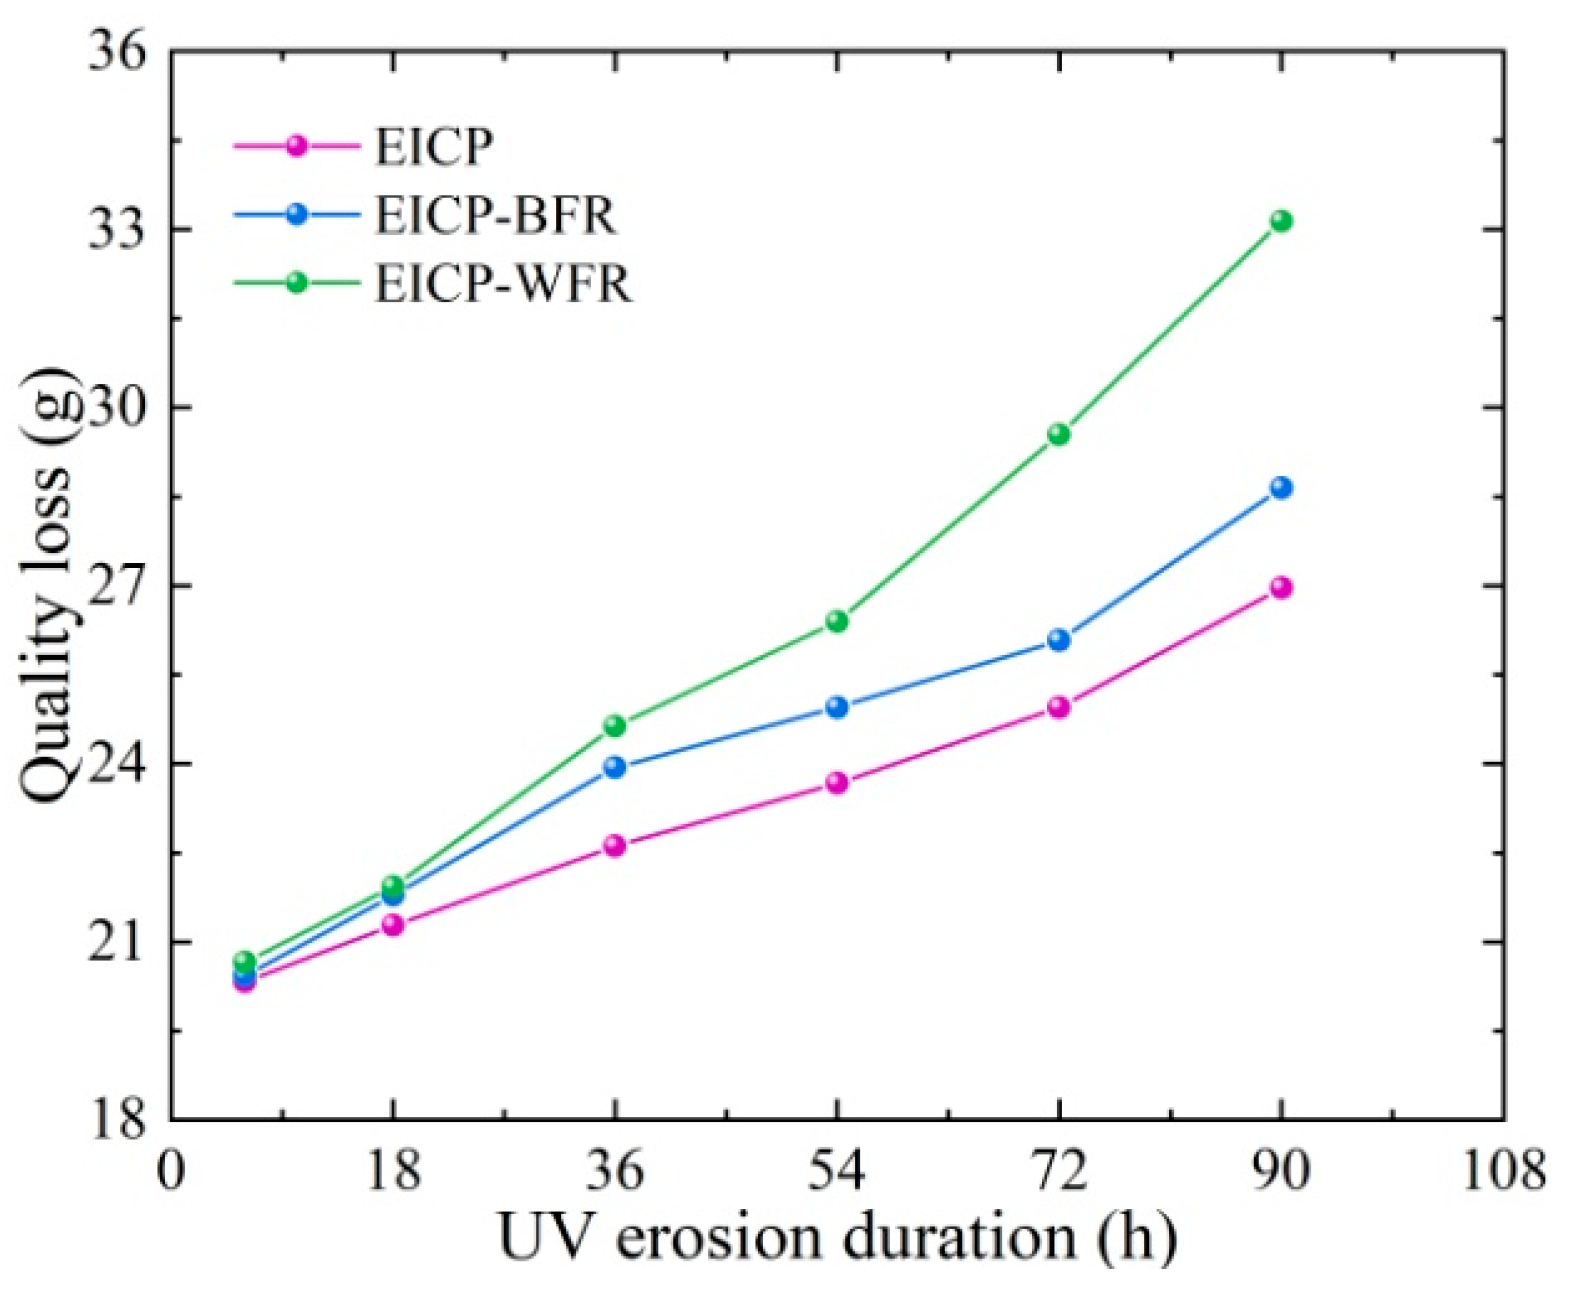
- Under UV erosion, the mass loss of the three samples increases continuously with the increase in UV erosion duration. When the UV erosion duration was 90 h, the mass loss measurements of the aeolian sand samples cured by EICP, EICP–BFR, and EICP–WFR were 26.96 g, 27.64 g, and 33.14 g, respectively. Due to the leading cause of mass loss in the early stage of the sample being the evaporation of internal moisture, the mass lost under UV erosion was 6.63 g for EICP, 9.21 g for EICP–BFR, and 12.98 g for EICP–WFR.
- Under UV erosion, the UCS of the three samples decreases continuously with increased ultraviolet erosion duration. At UV erosion duration of 90 h, the UCS of the aeolian sand specimens cured with EICP, EICP–BFR, and EICP–WFR reached 285.85 kPa, 519.72 kPa, and 488.64 kPa, respectively. Compared to the UCS of the control group, the loss rates were 45.4%, 46.6%, and 51.6%, respectively.
- Under FT erosion, the apparent conditions of the three samples showed the phenomenon of sand particle detachment and CaCO3 crystal slagging in the freeze–thaw erosion test. When the EICP-cured aeolian sand sample reaches 12 freeze–thaw cycles and the EICP–BFR-cured aeolian sand sample reaches 16 freeze–thaw cycles, cracks or fractures may occur upon light touch. The EICP–WFR-cured aeolian sand sample relies on the advantage of the rough surface of wool fibers and is the least susceptible to erosion and damage.
- Under FT erosion, the mass loss of the three samples increases continuously with the increase in freeze–thaw cycles. When the number of freeze–thaw cycles is 12, the maximum mass loss of the EICP-cured aeolian sand sample is 5.85 g; when the number of freeze–thaw cycles is 16, the mass loss of the EICP–BFR cured aeolian sand sample is 2.93 g; when the number of freeze–thaw cycles is 20, the mass loss of the EICP–WFR-cured aeolian sand sample is 2.69 g.
- Under FT erosion, the UCS of the three specimens decreases continuously with the increase in freeze–thaw cycles. When subjected to eight freeze–thaw cycles, the UCS of the aeolian sand specimen cured by EICP was 265.76 kPa; when subjected to 12 freeze–thaw cycles, the UCS of the aeolian sand specimen cured by EICP–BFR was 465.78 kPa; when subjected to 16 freeze–thaw cycles, the UCS of the aeolian sand specimen cured by EICP–WFR was 433.15 kPa. The loss rates of the UCS of the three samples relative to the control group were 41.0%, 49.2%, and 55.8%, respectively.
- Based on the UV erosion and FT erosion tests, the UCS model considering the damage effects was established, respectively. The determination coefficients of the UCS models were more than 0.876, indicating that the test results were in good agreement with the predicted results and verifying the reliability of the established models.
- The experimental process of EICP collaborative fiber reinforcement for aeolian sand is limited to the indoor testing stage. Due to the complexity and variability of the desert environment, this technology has not yet been applied in practical conditions. Looking ahead, whether the EICP collaborative fiber reinforcement method is suitable for on-site environments will become the main research direction. This has profound implications for the stability or environmental restoration of sand dune edges.
Author Contributions
Funding
Institutional Review Board Statement
Informed Consent Statement
Data Availability Statement
Conflicts of Interest
References
- Ettorre, U.S.; Liso, I.S.; Parise, M. Desertification in karst areas: A review. Earth Sci. Rev. 2024, 253, 104786. [Google Scholar] [CrossRef]
- Jain, S.; Srivastava, A.; Khadke, L.; Uday, C.; Ahmed, E. Global-scale water security and desertification management amidst climate change. Environ. Sci. Pollut. Res. 2024, 31, 58720–58744. [Google Scholar] [CrossRef]
- Middleton, N.J. Desert dust hazards: A global review. Aeol. Res. 2017, 24, 53–63. [Google Scholar] [CrossRef]
- Wu, J.G.; Zhai, P.M. New understanding on climate change and desertification. Clim. Change Res. 2020, 16, 28–36. [Google Scholar] [CrossRef]
- Zan, G.; Wang, C.; Li, F.; Liu, Z.; Sun, T. Key data results and trend analysis of the sixth national survey on desertification and sandification. For. Ecol. Manag. 2023, 1, 1–7. [Google Scholar] [CrossRef]
- Tu, Z.; Li, M.; Sun, T. The Status and trend analysis of desertification and sandification. For. Ecol. Manag. 2016, 1, 1–5+13. [Google Scholar] [CrossRef]
- Zhang, R.; Tian, Y.; Otitoju, T.A.; Feng, Z.; Wang, Y.; Sun, T. Sand-fixation model for interface engineering of layered titania and N/O-Doped carbon composites to enhance potassium/sodiumstorage. Small 2023, 19, 2302148. [Google Scholar] [CrossRef] [PubMed]
- Cui, M.J.; Lai, H.J.; Hoang, T.; Chu, J. One-phase-low-pH enzyme induced carbonate precipitation (EICP) method for soil improvement. Acta Geotech. 2021, 16, 481–489. [Google Scholar] [CrossRef]
- Zhao, Y.; Wang, J. Mechanical sand fixing is more beneficial than chemical sand fixing for artificial cyanobacteria crust colonization and development in a sand deser. Appl. Soil Ecol. 2019, 140, 115–120. [Google Scholar] [CrossRef]
- Xie, D.; Zhang, R.; Wang, J. The influence of environmental factors and precipitation precursors on enzyme-induced carbonate precipitation (EICP) process and its application on modification of recycled concrete aggregates. J. Clean. Prod. 2023, 395, 136444. [Google Scholar] [CrossRef]
- Liu, L.; Gong, L.; Jin, Y.; Shi, M.; Hu, Z.; Zhu, S.; Liu, S.; Hao, T.; Guo, X. Experimental study on the mechanical behavior of EICP-casein-treated calcareous sand. Mar. Georesour. Geotech. 2024, 42, 1348–1367. [Google Scholar] [CrossRef]
- Wei, H.; Fan, Y.; Sun, L.; Du, H.; Liang, R. Experimental study on high-temperature damage repair of concrete by soybean enzyme induced carbonate precipitation. Materials 2022, 15, 2436. [Google Scholar] [CrossRef]
- Yue, J.; Wang, W.; Zhu, Y. Experimental study on modification of ancient building mortar with MICP technology. J. Henan Univ. 2021, 51, 289–298. [Google Scholar] [CrossRef]
- Bian, H.; Ji, P.; Wang, J.; Zhang, X.; Xu, X. Study on the environmental durability of heavy metal contaminated soil remediated by enzyme induced carbonate precipitation. Rock Soil Mech. 2023, 44, 2779–2788. [Google Scholar] [CrossRef]
- Kidanemariam, T.G.; Gebru, K.A.; Kidane Gebretinsae, H. A mini review of enzyme-induced calcite precipitation (EICP) technique for eco-friendly bio-cement production. Environ. Sci. Pollut. Res. 2024, 31, 16206–16215. [Google Scholar] [CrossRef] [PubMed]
- Gao, Y.; Ren, G.; Fan, H.; Fan, H.; Li, X.; Pang, S.; Meng, M. Study on the modification of different kinds of dispersive soils using EICP: Comparative analysis with traditional modification materials. J. Environ. Chem. Eng. 2025, 13, 115826. [Google Scholar] [CrossRef]
- Ahenkorah, I.; Rahman, M.M.; Karim, M.R.; Beecham, S. Unconfined compressive strength of MICP and EICP treated sands subjected to cycles of wetting-drying, freezing-thawing and elevated temperature: Experimental and EPR modelling. J. Rock Mech. Geotech. Eng. 2023, 15, 1226–1247. [Google Scholar] [CrossRef]
- Zhang, Q.; Zhang, Z.; Lin, D.; Zhang, Y. Influence of alternating temperature on the effectiveness of EICP in consolidating aeolian sand. Appl. Sci. 2023, 13, 7035. [Google Scholar] [CrossRef]
- Ma, Q.; Li, M.; Zhou, X.L.; Xi, L.; Sun, J. Mechanical properties and microscopic mechanisms of enzyme-induced calcium car-bonate precipitation (EICP)-reinforced clay mixtures with rubber particles. Chin. J. Geotech. Eng. 2024, 46, 72–76. [Google Scholar] [CrossRef]
- Cui, M.; Xiong, H.; Lv, S.; Zheng, J.; Cui, M.; Zeng, C. Multivariate experimental study on EICP combined with polypropylene fiber solidified desert sand. J. Civ. Eng. 2024, 28, 2221–2230. [Google Scholar] [CrossRef]
- Shu, S.; Yan, B.; Meng, H.; Bian, X. Comparative study of EICP treatment methods on the mechanical properties of sandy soil. Soils Found. 2022, 62, 101246. [Google Scholar] [CrossRef]
- Xu, K.; Huang, M.; Liu, Z.; Cui, M.; Li, S. Mechanical properties and disintegration behavior of EICP-reinforced sea sand subjected to drying-wetting cycles. Biogeotechnics 2023, 1, 100019. [Google Scholar] [CrossRef]
- Almajed, A.; Lemboye, K.; Arab, M.G.; Alnuaim, A. Mitigating wind erosion of sand using biopolymer-assisted EICP tech-nique. Soils Found. 2020, 60, 356–371. [Google Scholar] [CrossRef]
- Zomorodian, S.M.A.; Nikbakht, S.; Ghaffari, H.; Kelly, B.C. Enzymatic-induced calcite precipitation (EICP) method for im-proving hydraulic erosion resistance of surface sand layer: A laboratory investigation. Sustainability 2023, 15, 5567. [Google Scholar] [CrossRef]
- Jedrzejko, M.J.; Gan, Y.; Chen, X.; Jonkers, H.M.; Luo, H. Performance evaluation of EICP with organic/non-organic additives for repairing external cracks in cement-based materials. Constr. Build. Mater. 2025, 458, 139646. [Google Scholar] [CrossRef]
- Yuan, Z.; Wu, T.J.; Wang, L.B.; Huang, Y.C.; Tang, Q. The engineering performance of EICP-modified municipal solid waste incineration bottom ash for road construction. Clean. Mater. 2024, 15, 100285. [Google Scholar] [CrossRef]
- Xu, J.; Li, X.; Liu, Y.H.; Li, Z.H.; Wang, S.H. Evaluation of wind erosion resistance of EICP solidified desert sand based on response surface methodology. Constr. Build. Mater. 2024, 447, 138119. [Google Scholar] [CrossRef]
- GB/T50123-2019; Standard for Geotechnical Testing Method. Construction Ministry of PRC: Beijing, China, 2019.
- Gao, Y.; Yao, D.; Han, H.; Li, C. Micro-experiment on MICP-treated aeolian sandy soil under ultraviolet erosion environment. Chin. J. Geotech. Eng. 2020, 42, 254–258. [Google Scholar] [CrossRef]
- Wei, Y.; Dong, R.; Long, G.; Wang, H.; Tang, C. Influence of intense ultraviolet radiation on drying shrinkage of cement paste and its mechanism. J. Rail. Sci. Eng. 2024, 21, 2755–2765. [Google Scholar] [CrossRef]
- Liang, S.; Xie, Y.; Deng, Y. Microbially induced calcium carbonate precipitation technique progress and review of engineering applications. J. Guangdong Univ. Technol. 2024, 41, 11–22. [Google Scholar] [CrossRef]
- Almajed, A.; Lateef, M.A.; Moghal, A.A.B.; Lemboye, K. State-of-the-art review of the applicability and challenges of microbial-induced calcite precipitation (MICP) and enzyme-induced calcite precipitation (EICP) techniques for geotechnical and geoenvironmental applications. Crystals 2021, 11, 370. [Google Scholar] [CrossRef]
- Kiakhani, M.; Safapour, S.; Sabzi, F.; Bagha, A. Effect of ultra violet (UV) irradiation as an environmentally friendly pre-treatment on dyeing characteristic and colorimetric analysis of wool. Fibers Polym. 2020, 21, 179–187. [Google Scholar] [CrossRef]
- He, Y.; Guo, X.; Zhao, G.; Wu, R. Mechanics mechanism of wind-sand erosion damage on tempered glass surface under combined freeze-thaw cycles and ultraviolet irradiation. Surf. Technol. 2024, 40, 307–313. [Google Scholar] [CrossRef]
- Cai, A.; Zhang, Y.; Yang, Z.; Liu, Y.; Liu, W.; Lu, F.; Li, Y. Enhanced expression of protease k in pichia pastoris through molecular chaperones and analysis of its effect on wool scale layer. Biotechnol. Bull. 2024, 40, 307–313. [Google Scholar] [CrossRef]
- Liu, W.; Ling, T.; Tang, J.; Jiang, Y.; Liu, X. Influence of airflow on the frost heaving force in tunnels underwindy-thermo-hydro-mechanical coupling. J. Railway Sci. Eng. 2024, 6, 5151–5162. [Google Scholar] [CrossRef]
- Gao, Z.; Chen, B.; Chen, J.; Yuan, Z. Pore structure and mechanical properties of foam concrete under freeze-thaw environment. Acta Mater. Compos. Sin. 2024, 41, 827–838. [Google Scholar] [CrossRef]
- Yuan, H.; Shi, Q.; Li, J.; Zhao, Z. Effect of freeze–thaw cycling on mechanical properties of Na-montmorillonite modified EICP-treated silty sand. Case Stud. Constr. Mater. 2023, 19, e02641. [Google Scholar] [CrossRef]
- Cao, J.; Kang, L.; Xu, H.; Zhang, M. Research on the salt freeze durability of polypropylene fiber pre mixed concrete. Tech. Innov. Appl. 2023, 13, 72–75. [Google Scholar] [CrossRef]
- Gao, Y.; Yao, D.; Qing, Y.; Li, C. Study on freeze-thaw properties for microbial mineralization geotechnical materials in salt corrosion environment. J. Disaster Prev. Mitig. Eng. 2018, 38, 787–794. [Google Scholar] [CrossRef]
- Lehrsch, G.A.; Sojka, R.E.; Carter, D.L.; Jolley, P.M. Freezing effects on aggregate stability affected by texture, mineralogy, and organic matter. Soil Sci. Soc. Am. J. 1991, 55, 1401–1406. [Google Scholar] [CrossRef]
- Sun, X.; Miao, L.; Wang, H.; Yuan, J.; Wu, L. Research on freeze-thaw and dry-wet durability of enzymatic calcification for surface protection. Environ. Sci. Pollut. Res. 2022, 29, 16762–16771. [Google Scholar] [CrossRef] [PubMed]
- Zhu, J.; Liu, R.; Wang, H. Frost heaving characteristics of silty sand in songbei district of harbin. J. Inner Mong. Agric. Univ. 2024, 45, 41–50. [Google Scholar] [CrossRef]
- Zhang, M.; Wang, Y.; Niu, S.; Cai, B.; Zhang, Z. Research progress on effects of freeze-thaw action on wind erosion and dust resistance of microbial cured bare soil. Ind. Constr. 2024, 54, 191–197. [Google Scholar] [CrossRef]
- Gong, L.; Qin, Y.; Tian, Y.; Huang, D.; Feng, B. Research on damage model of steel slag concrete with desert sand under freeze-thaw cycle. Met. Mine 2025, 3, 286–291. [Google Scholar] [CrossRef]


| Specific Gravity Gs | Density ρ (g/cm3) | Water Content w (%) | Void Ratio e | Plastic Limit wP (%) | Liquid Limit wL (%) | Plasticity Index IP | Coefficient of Uniformity Cu | Coefficient of Curvature Cc |
|---|---|---|---|---|---|---|---|---|
| 2.65 | 1.59 | 2.60 | 0.67 | 19.6 | 25.0 | 5.4 | 2.30 | 0.85 |
| Area | Annual Mean Temperature (°C) | Sunshine Duration (h) | Sun Annual Exposure level (MJ/m2) | Ultraviolet Ray Annual Exposure Level (MJ/m2) |
|---|---|---|---|---|
| Yulin, Shaanxi | 8.5 | 2750 | 5127.8 | 358.95 |
| Sample Type | Duration of Irradiation (h) | Exposure (MJ/m2) |
|---|---|---|
| EICP EICP–BFR EICP–WFR | 18 | 385.92 |
| 36 | 771.84 | |
| 54 | 1157.76 | |
| 72 | 1543.68 | |
| 90 | 1929.60 |
| Aeolian Sand | Erosion Time | |||||
|---|---|---|---|---|---|---|
| 0 h | 18 h | 36 h | 54 h | 72 h | 90 h | |
| EICP |  |  | 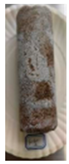 |  |  |  |
| EICP–BFR | 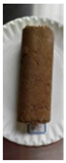 | 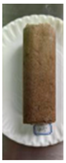 | 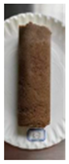 | 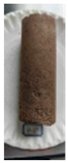 | 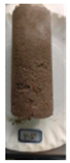 | 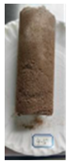 |
| EICP–WFR | 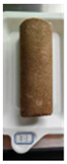 | 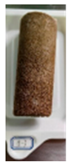 | 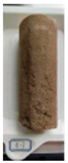 | 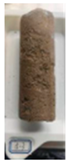 |  | 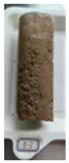 |
| Sample | x | y | R2 |
|---|---|---|---|
| EICP | −2.43 | 507.55 | 0.9356 |
| EICP–BFR | −4.74 | 996.87 | 0.9702 |
| EICP–WFR | −5.86 | 1036.31 | 0.8764 |
| Aeolian Sand | Number of Freeze–Thaw Cycles | |||||
|---|---|---|---|---|---|---|
| 0 Times | 4 Times | 8 Times | 12 Times | 16 Times | 20 Times | |
| EICP | 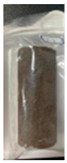 | 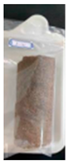 | 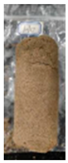 | 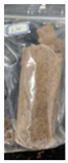 | --- | --- |
| EICP–BFR | 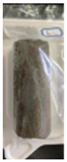 |  |  | 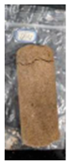 | 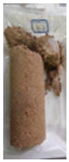 | --- |
| EICP–WFR | 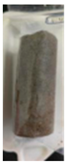 | 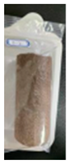 | 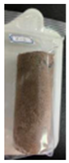 | 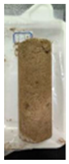 | 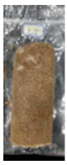 | 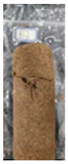 |
| Sample | x(1,2) | y | c(1,2) | R2 |
|---|---|---|---|---|
| EICP–BFR | −36.76 | — | 904.00 | 0.9977 |
| EICP–WFR | −11,328.82 | 344.12 | 67132.67 | 0.9272 |
Disclaimer/Publisher’s Note: The statements, opinions and data contained in all publications are solely those of the individual author(s) and contributor(s) and not of MDPI and/or the editor(s). MDPI and/or the editor(s) disclaim responsibility for any injury to people or property resulting from any ideas, methods, instructions or products referred to in the content. |
© 2025 by the authors. Licensee MDPI, Basel, Switzerland. This article is an open access article distributed under the terms and conditions of the Creative Commons Attribution (CC BY) license (https://creativecommons.org/licenses/by/4.0/).
Share and Cite
Liu, J.; Zhu, Q.; Li, G.; Qu, J.; Zhang, J. Research on the Anti-Erosion Capacity of Aeolian Sand Solidified with Enzyme Mineralization and Fiber Reinforcement Under Ultraviolet Erosion and Freeze–Thaw Erosion. Sustainability 2025, 17, 5053. https://doi.org/10.3390/su17115053
Liu J, Zhu Q, Li G, Qu J, Zhang J. Research on the Anti-Erosion Capacity of Aeolian Sand Solidified with Enzyme Mineralization and Fiber Reinforcement Under Ultraviolet Erosion and Freeze–Thaw Erosion. Sustainability. 2025; 17(11):5053. https://doi.org/10.3390/su17115053
Chicago/Turabian StyleLiu, Jia, Qinchen Zhu, Gang Li, Jing Qu, and Jinli Zhang. 2025. "Research on the Anti-Erosion Capacity of Aeolian Sand Solidified with Enzyme Mineralization and Fiber Reinforcement Under Ultraviolet Erosion and Freeze–Thaw Erosion" Sustainability 17, no. 11: 5053. https://doi.org/10.3390/su17115053
APA StyleLiu, J., Zhu, Q., Li, G., Qu, J., & Zhang, J. (2025). Research on the Anti-Erosion Capacity of Aeolian Sand Solidified with Enzyme Mineralization and Fiber Reinforcement Under Ultraviolet Erosion and Freeze–Thaw Erosion. Sustainability, 17(11), 5053. https://doi.org/10.3390/su17115053