Article

A Citizen Science Approach to Supporting Environmental Sustainability and Marine Litter Monitoring: A Case Study of USV Mapping of the Distribution of Anthropogenic Debris on Italian Sandy Beaches

1
Istituto di Scienze Marine del Consiglio Nazionale delle Ricerche (ISMAR-CNR), 19032 Lerici, Italy
2
Istituto di Fisiologia Clinica del Consiglio Nazionale delle Ricerche (IFC-CNR), 56124 Pisa, Italy
3
Istituto per la Bioeconomia del Consiglio Nazionale delle Ricerche (IBE-CNR), 50145 Firenze, Italy
4
Istituto Nazionale di Geofisica e Vulcanologia, Via di Vigna Murata 605, 00143 Roma, Italy
*
Author to whom correspondence should be addressed.
Sustainability 2025, 17(11), 5048; https://doi.org/10.3390/su17115048
Submission received: 20 March 2025 / Revised: 12 May 2025 / Accepted: 13 May 2025 / Published: 30 May 2025

Abstract

:
Research on the dynamic mechanisms driving the accumulation of anthropogenic marine debris (AMD) in highly dynamic environments, such as extensive sandy beaches, remains limited. Unmanned aerial vehicles (UAVs) can be used to map macro-marine litter in these environments over large temporal and spatial scales, but several challenges remain in their interpretation. In this study, secondary school students participated in a citizen science initiative, during which they identified, marked, and classified waste items using a series of UAV orthophotos collected along an 800 m extended Italian beach in different seasons. A specific training program and a collection of working tools were developed to support these activities, which were carried out under the constraints imposed by the COVID-19 pandemic. The accuracy of the citizen science approach was evaluated by comparing its results with standard in situ visual census surveys conducted in the same area. This methodology not only enabled an analysis of the temporal dynamics of AMD accumulation but also served an important educational function. The effectiveness of the learning experience was estimated using pre- and post-activity questionnaires. The results indicate a clear improvement in the students’ knowledge, interest, and awareness regarding marine litter, highlighting the potential of citizen science to both support environmental monitoring and promote sustainability education among younger generations.

1. Introduction

The growth of the accumulation of anthropogenic marine debris (AMD), particularly in remote and protected coastal areas, has emerged as a major environmental issue in recent decades. In recent years, interest in AMD pollution has led to a significant increase in data related to such materials in oceans [1]. In the Mediterranean region, knowledge about the concentration and composition of marine litter (ML) has improved [2,3,4], but our understanding of its sources and accumulation processes remains limited. Beached marine litter (BML) represents a subset of ML characterized by a tendency to accumulate on shores and featuring prolonged exposure on coasts/beaches. In particular, plastic BML exhibits faster photodegradation on land than at sea [5], fragmenting into meso- and microplastics (5 mm–2.5 cm) that enter the sea [6,7], adding to the material directly released by rivers [8,9,10,11,12]. It is noteworthy that estimating the flow of material transported by water courses is essential for assessing its impact on the areas surrounding river deltas and estuaries. Consequently, there is an urgent need for methods that define the protocols and monitoring strategies for the successful spatial and temporal mapping of beach litter [13,14]. Recent studies [12,15] have highlighted that marine protected areas (MPAs) are particularly vulnerable to AMD from industrialized regions, while the waste management in remote MPAs remains challenging. In these isolated areas, the amount of AMD is largely underestimated. Aerial surveys could be an effective way to overcome these difficulties, although satellite imagery, limited by its resolution, could also be suited to identifying the large-scale accumulation of waste [16,17]. Recent advancements in unmanned aerial vehicle (UAV) technology now allow for centimeter-scale imaging, making UAVs highly effective for detecting AMD. Drones can perform repeatable surveys across seasons, generating accurate digital elevation models (DEMs) and orthomosaics of large areas. UAVs are efficiently used in structural geology, agroforestry, archaeology, and disaster monitoring [18,19,20,21,22,23,24,25,26,27,28,29,30,31,32], offering an optimal balance between cost, precision, and reproducibility [33,34,35].
Recently, UAVs have also been used to monitor macro-ML (>2.5 mm [1]) in various environments, including beaches and coastal dunes [2,3,5,17,29,35,36,37,38,39,40,41,42,43,44], lakeshores [45], remote islands [39], the sea’s surface [16,46], and river waters [47]. However, standardized protocols for data acquisition and processing are still lacking, with the approaches ranging from visual interpretation of images [40,42,44] and analyses of the spectral profiles of litter [48,49] to the use of machine learning methods [39,41,50,51,52]. Most of these studies have focused on the detection of the BML stock in remote areas [39], but they have rarely addressed the dynamics of BML’s deposition over time [35]. While UAV surveys provide high resolution and repeatability, the detection of ML in orthomosaic images requires highly time-consuming processing tasks. Despite numerous automated approaches being used to count and classify BML from orthophotos, manual visual censuses still provide the most accurate classification of litter types [35,42,43]. In this study, we propose a novel and cost-effective approach to monitoring beach litter dynamics through a citizen science approach, achieving a high spatiotemporal resolution. Citizen science has historically contributed significantly to research [53], despite concerns about data accuracy and bias [54,55,56].
Nevertheless, citizen science can be an effective vector for raising awareness among young people about environmental problems and promoting responsible behavior. Different studies have shown that volunteer participation in scientific surveys not only contributes to the collection of data for research purposes but also generates benefits in the participants, including civil empowerment and an increase in their ocean literacy [57,58,59,60]. Several studies have implemented citizen science methods for marine litter monitoring [57,61,62,63,64,65,66,67,68,69], assessing both the data quality and methodologies [66,70,71]. We have used a similar approach since 2013, engaging several schools in an in situ survey of marine litter by means of the SeaCleaner protocol (https://sites.google.com/view/seacleaner/home-page (accessed on 1 May 2025)). Through this approach, we have been able to collect a large amount of data related to the distribution, total amount, and types of beached AMD [71].
In these ten years, through various citizen science programs, we have consolidated the research–education relationship, including initiatives such as “Pathways for Transversal Skills and Orientation” (PCTO).
In this study, we asked high school students to monitor AMD across three coastal areas of Tuscany—Migliarino, Massaciuccoli, and San Rossore Park (SRPRK; Figure 1). The research was conducted during the COVID-19 pandemic, using virtual monitoring through UAV imagery due to fieldwork restrictions. We evaluated not only the reliability of the collected data, as detailed in the Materials and Methods section, but also the responses of students to the ML issue, using specially designed questionnaires [71].
Lastly, we discuss the potential and limitations of citizen-science-based approaches for coastal management applications.

2. Materials and Methods

The methodology used in this study is based on three previous studies conducted in the same coastal area:
-
The first study focused on the analysis of the dynamics of ML accumulation over a 100-m-long natural beach within the SRPRK area (Figure 1) over a period of 9 months by using UAVs [35].
-
The second study regarded the assessment of the reliability of UAV-derived orthophotos analyzed through a visual-based approach by citizen scientists (high school students [42]). In this case, BML accumulation estimations over a 900 m2 coastal test area in SRPRK were compared with results of an interoperating assessment test performed by professional researchers [44]. The results showed that properly trained students could achieve data reliability comparable to that of researchers, despite their lack of specialized expertise. These findings encouraged the expansion of this approach to a much larger coastal area (1 km long, 10–30-m-wide beach), investigating the spatial and temporal dynamics of AMD accumulation more broadly. Finally, the third study concerned the evaluation of the citizen science approach as a useful tool for raising awareness of marine litter problems among high school students [71].
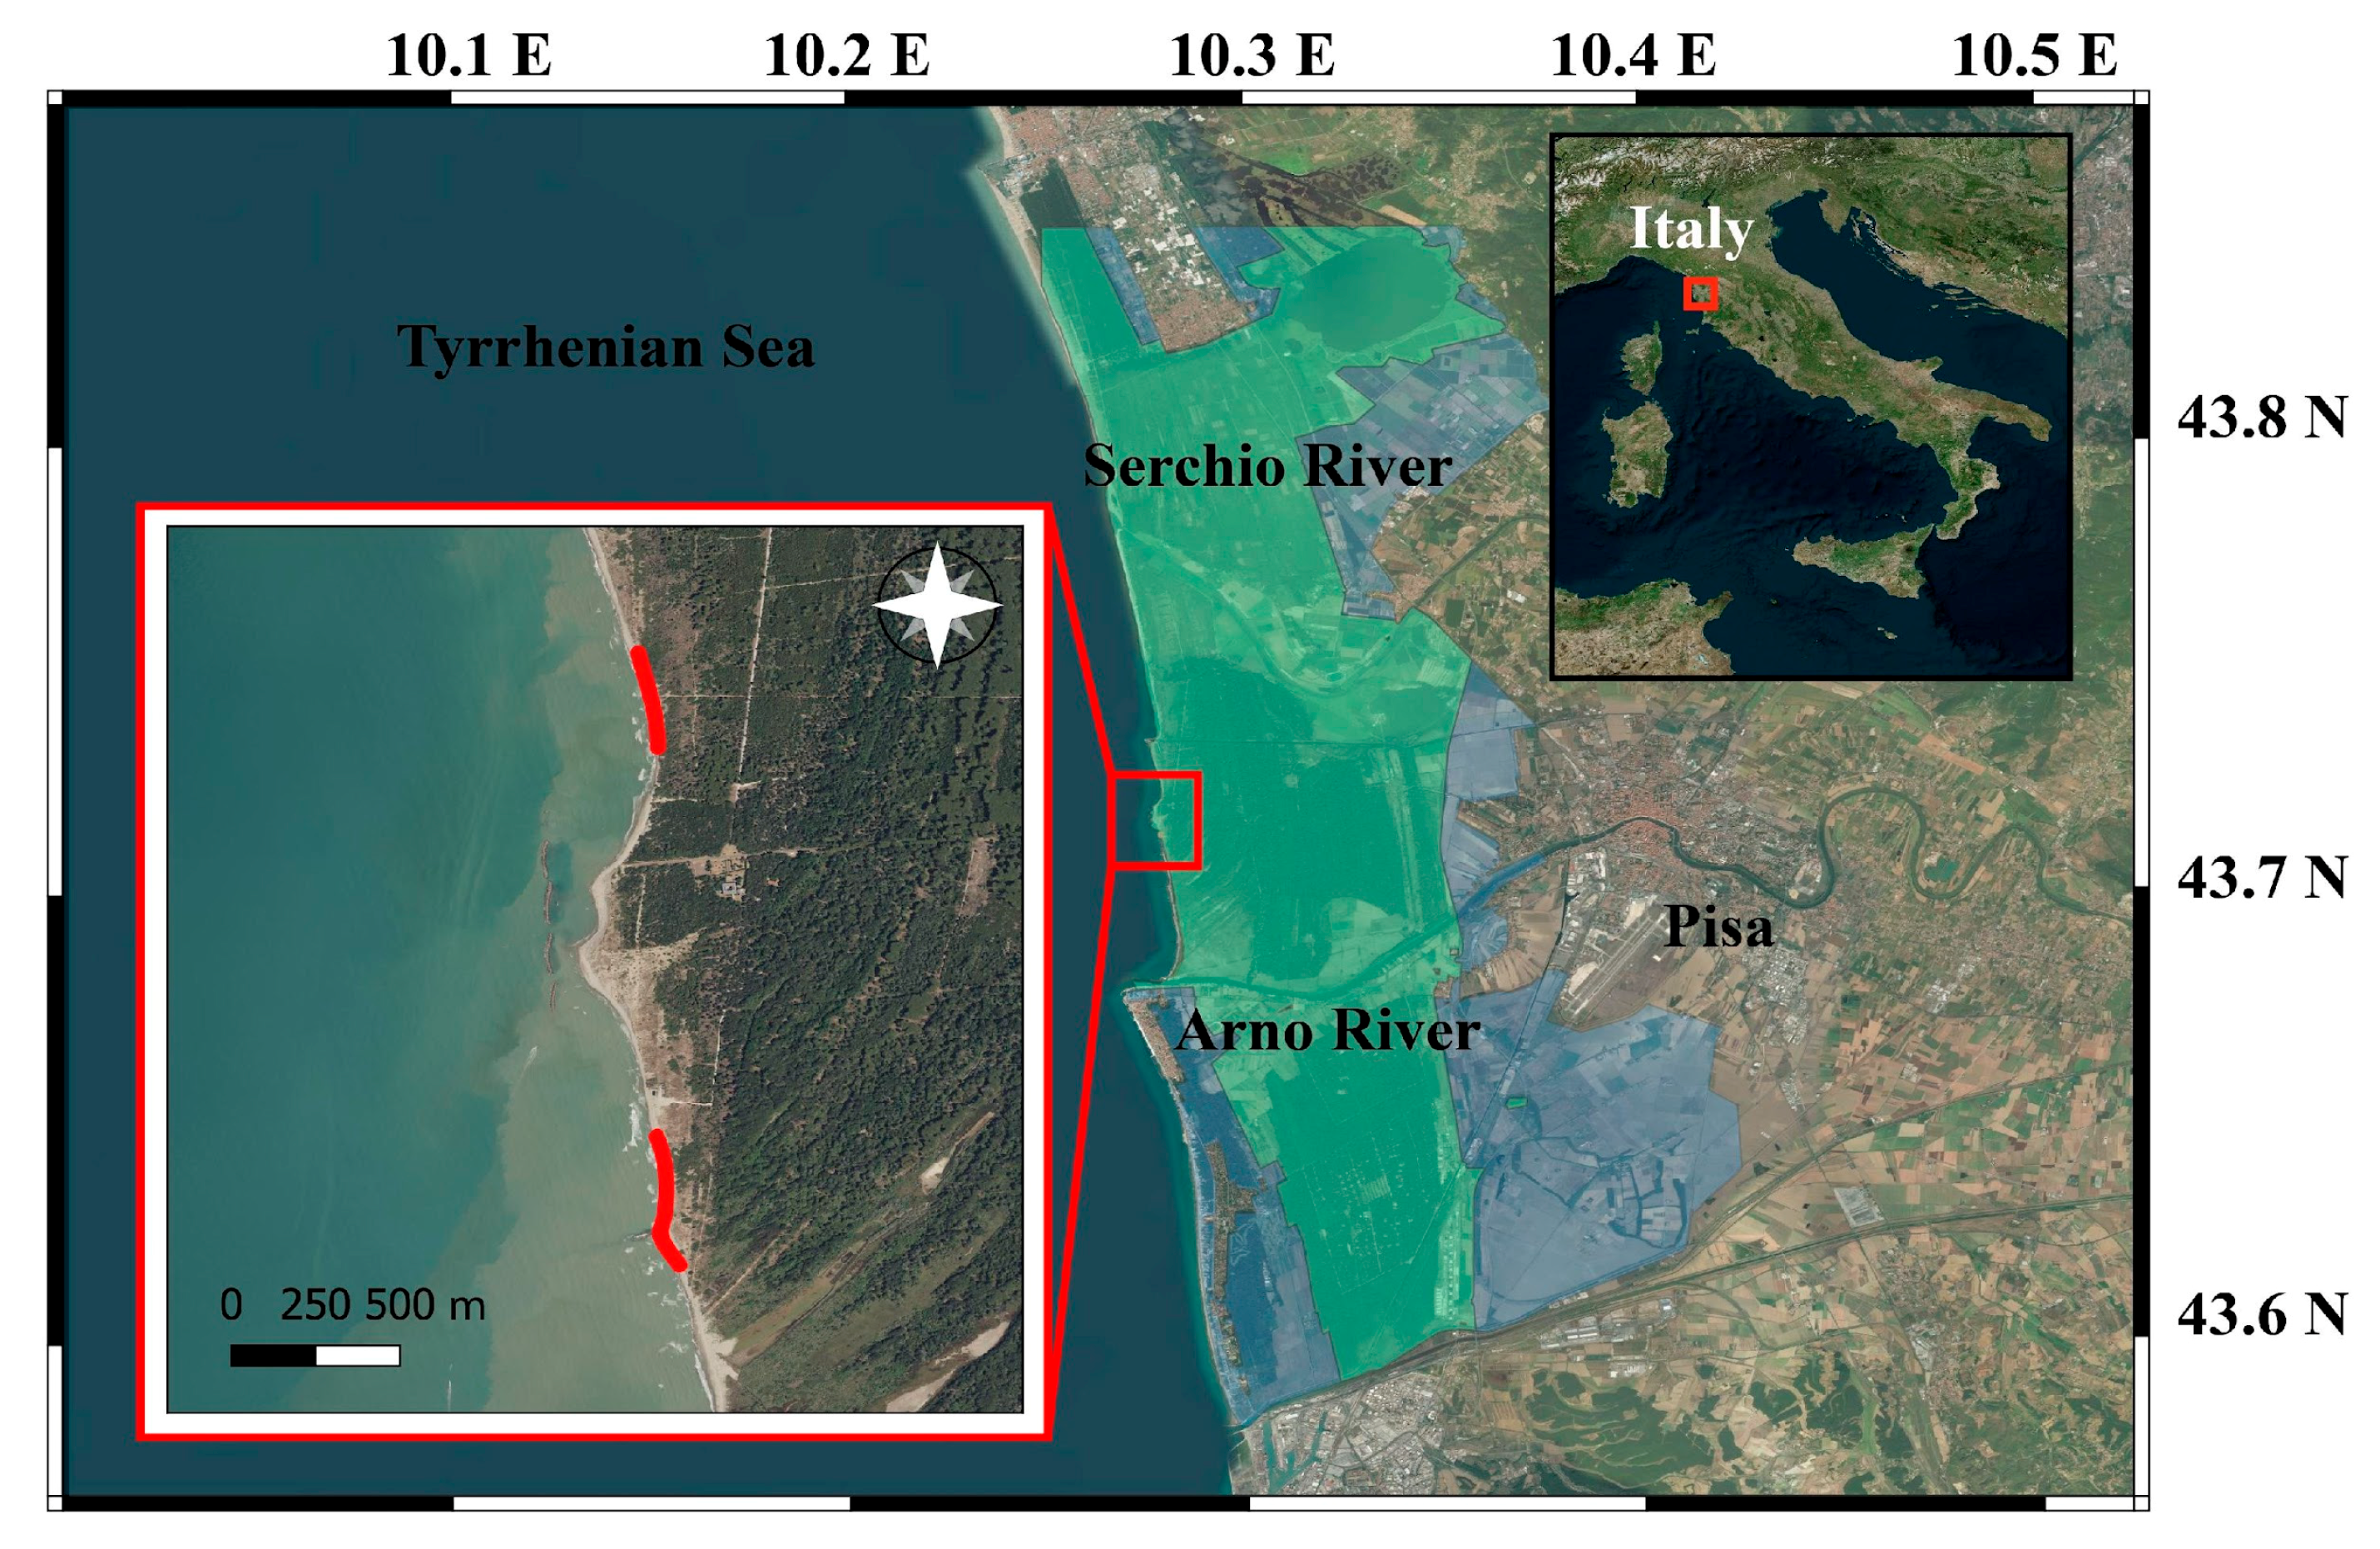
2.1. The Study Area

SRPRK is a natural protected area of Tuscany (Italy), extending for 230 km2 and bordered by 30 km of coastline between the Arno River to the north and the Serchio River to the south (Figure 1). The coastal area consists of a continuous sequence of sandy beaches extending for approximately 11 km, interrupted by two water channels (Morto vecchio and Morto nuovo). The whole coastline is limited backward by a dune system reaching up to 7 m in height [72], which represents the restricted access nature reserve. The area is influenced by a marine current departing from the Arno River’s mouth, which transports a considerable amount of fluvial material from inland areas (notably from Pisa and Firenze). SRPRK also experiences significant coastal erosion, leading to landscape modification, localized sedimentary processes, and, more importantly, the accumulation of AMD [20,35,73]. Due to the limited tidal amplitude, the foreshore is very narrow, as observed along much of the coasts of the Italian Peninsula. In this work, the selected study area was composed of two 400-m-long separated beach stretches (Figure 1), located in the north and south of a touristic area characterized by a small seasonal establishment that operates during the summer. In this central area, artificial reef barriers are placed in front of the shoreline. To avoid bias in data collection, the selected study areas were positioned outside the influence of these anthropogenic structures, specifically excluding both the reef barriers and the tourist establishments.

2.2. UAV Photogrammetric Survey

High-resolution photogrammetry was conducted using a DJI Phantom 4 Pro v2 quadcopter (SZ DJI technology Co., Ltd., Shenzhen, China), with a high-performance camera featuring a 1-inch, 20-megapixel CMOS sensor and a 24-mm full-frame lens. The camera was installed on a stabilized gimbal fixed at a 90° nadir orientation (perpendicular to the ground). Images were recorded with 80% front and side overlaps. The UAV operated automatically using Drone Harmony (DH) ground station software (ver. 1.17). Based on previous similar studies [5,26], a 15-m flight altitude was selected as the optimal balance between ground sampling distance (GSD) and area coverage, allowing us to survey each selected area in ~15 min. This setup provided a digital surface model (DSM) and an orthophoto map of the beaches. The image dataset was treated by applying Structure-from-Motion–Multi-View Stereo (SfM-MVS) photogrammetric processing on Agisoft Metashape (ver. 1.7.1) [49,50,51,52], resulting in an orthophoto GSD resolution of 0.41 cm/pixel (Figure 1). The UAV investigation started on 9 June 2020 with an initial mapping, followed by 6 temporal replicas of the same areas, performed every 30/60 days throughout the year. In this work, we focus on three representative replicas: T2 (7 August 2020), T4 (8 October 2020), and T6 (14 December 2020).

2.3. Citizen Science Contribution: Data Acquisition and Training Phases

Merlino et al. [42] described a new virtual monitoring protocol developed inside the QGIS platform (Ver.3.14), originally proposed by Andriolo et al. [43]. This procedure is based on a drop-down list of tasks with interdependent combo boxes, which lead to successively highlighting all of the characteristics of the objects recognized on the orthophotos. The updated protocol also allows users to digitize the contours of the objects and retrieve their geometric properties (area, length, and GPS coordinates of the centroid). These data are essential for estimating the surface area covered by objects and their spatial and temporal variation on the beach.
To apply this methodology, a group of citizen science operators (CSOs) was recruited from high school students aged 16–18 (https://sites.google.com/view/seacleaner/home-page (accessed on 1 May 2025)).
In total, 122 students from 9 classes of 5 different Italian secondary schools participated in the virtual survey. The students were trained in the use of QGIS software and introduced to the ML issue. They received various supporting materials, including a video catalogue featuring images of ML extracted from orthophotos of the SRPRK test area, an illustrated guide, and a recorded video tutorial regarding ML recognition and USV operations.
The two surveyed areas were divided into 8 sub-areas, each covering approximately 100 m of coastline. The corresponding orthomosaics were assigned to the CSOs for the virtual analysis. In total, 60 different images (combined into a gpkg file) derived from the T2, T4, and T6 temporal replicas were analyzed. Each CSO examined their assigned dataset, identifying and extracting relevant information on ML. To account for intrinsic variability in the data, the same images were assigned to three different CSOs, ensuring a triplicate analysis of each area on the same date. Each participant produced a shapefile containing (i) the geometric properties of ML and (ii) descriptive attributes such as type, material, color, and size.

2.4. Citizen Science Data Analysis and Validation

Validating data collected through a citizen science approach, particularly when involving non-expert participants, is not straightforward and must follow a well-defined protocol. In this study, we adopted the same protocol proposed by Merlino et al. [42], applying a screening process to filter the datasets collected by students, retaining only the reliable ones.
As a first criterion, datasets containing fewer than 25 items in the assigned area were excluded. Based on this, two datasets (one from T4 and one from T6) were discarded. Another dataset from T4 was excluded, because the identified objects fell outside the studied area, likely due to positioning errors during the QGIS mapping. Furthermore, all identified objects smaller than 5 cm were excluded.
The total number of items and the counts, grouped by category, type, material, and dimension, were averaged over the number of students who analyzed the same area. Average percentages for these groupings were calculated for the entire study area and presented accordingly. Using QGIS, the density of the average number of items (items/m2) across the three replicas (T2, T4, and T6) was also calculated. The procedure was applied to produce maps of items grouped by dimensional class (small, medium, and large) material (plastic and polystyrene); and type (bottles) (Figure 2 and Figure 3). Their spatial distributions were also visualized through maps (Figure 4, Figure 5, Figure 6, Figure 7 and Figure 8).
To do this, a 2 × 2 m grid was overlaid across the entire study area, and the “Count Points in Polygon” tool was used to quantify the items falling within each grid cell. The position of the items was determined based on the coordinates of the centroid provided automatically by QGIS during the digitalization. For each cell, the number of items was averaged considering the number of students who analyzed that area and then divided by the area of the cell to obtain density values per square meter.
The final results were expressed in terms of the density of BML: general density (number of BML/m2) and relative density (number of items of a “specific type”/m2, number of items of a “specific material”/m2 or number of items of a “specific dimensional class”/m2). Visualization of these “density” metrics was rendered through a pseudo-color map (see Figure 4, Figure 5, Figure 6, Figure 7 and Figure 8).

2.5. Students’ Involvement in Other Activities

Our project also had an educational connotation, involving students in a range of activities related to the proposed topic. In addition to the different lectures and seminars provided, including specific training in ML recognition (Section 2.3), we organized remote visits of the “Plastic and us” exhibition, conceived by the Natural History Museum of the University of Pisa (Calci, Pisa, Italy) in the period from 20 July 2020 to 31 May 2021, in collaboration with CNR-ISMAR and INGV [74].
Due to the COVID-19 emergency, only remote visits were possible. An operator of the museum, equipped with a video camera, led students through the museum’s educational path, showcasing the exhibits and interacting with them as much as possible in real time.
Since in-person activities were not possible, we created digital versions of hands-on experiences to convey key concepts, such as the different impacts of various types of marine litter on biota, depending on size (nano, micro, macro, etc.), as well as the challenges related to material degradation over time, including issues concerning “bioplastics”.

2.6. Questionnaire Preparation, Administration, and Data Analysis

Multiple-choice questionnaires, based on a previous study [71], were administered to 122 students before and after the activities (see Section 2.5); however, only 87 students completed the post-activities questionnaire.
We adopted a Likert-scale scoring response with five choice options (see the Supplementary Materials). The survey covered several topics: general knowledge, problem awareness and concern, perceived proportion of plastic, perceived impacts, perceived causes, and self-reported litter-reducing behavior. Two new sections about QGIS tools and UAVs were added compared to the previous version [71].
The pre-activities questionnaire was administered ~10 days before starting the activities, and the post-activities questionnaire was administered 10–26 days after the end of the project. This time interval was sufficiently short to correlate the answers with the performed activities. Both questionnaires were nearly identical, except for Q1 and Q17: the first had two different wordings (one “pre” and the other “post” activities), while the second—the last question of the questionnaire—had only “post” wording. The students completed the survey anonymously, either digitally (via Google Docs) or on paper. The questionnaire activities were supported by the science teachers of the high schools involved in the study, as part of a PCTO project.
For each school, the PCTO period took place over 5 months, between February 2021 and June 2021. Despite reminders, four of the nine classes did not complete the post-questionnaire, so the data analysis was restricted to 87 students who completed both questionnaires. Unlike our previous study, where statistical analysis based on Friedman for Wilcoxon’s matched-pairs signed-rank test (Z score) was applied, in the present case we did not proceed with such analysis, as pre- and post-questionnaire comparisons did not reveal sufficient differences to justify deeper statistical investigations (see the Supplementary Materials).

3. Results

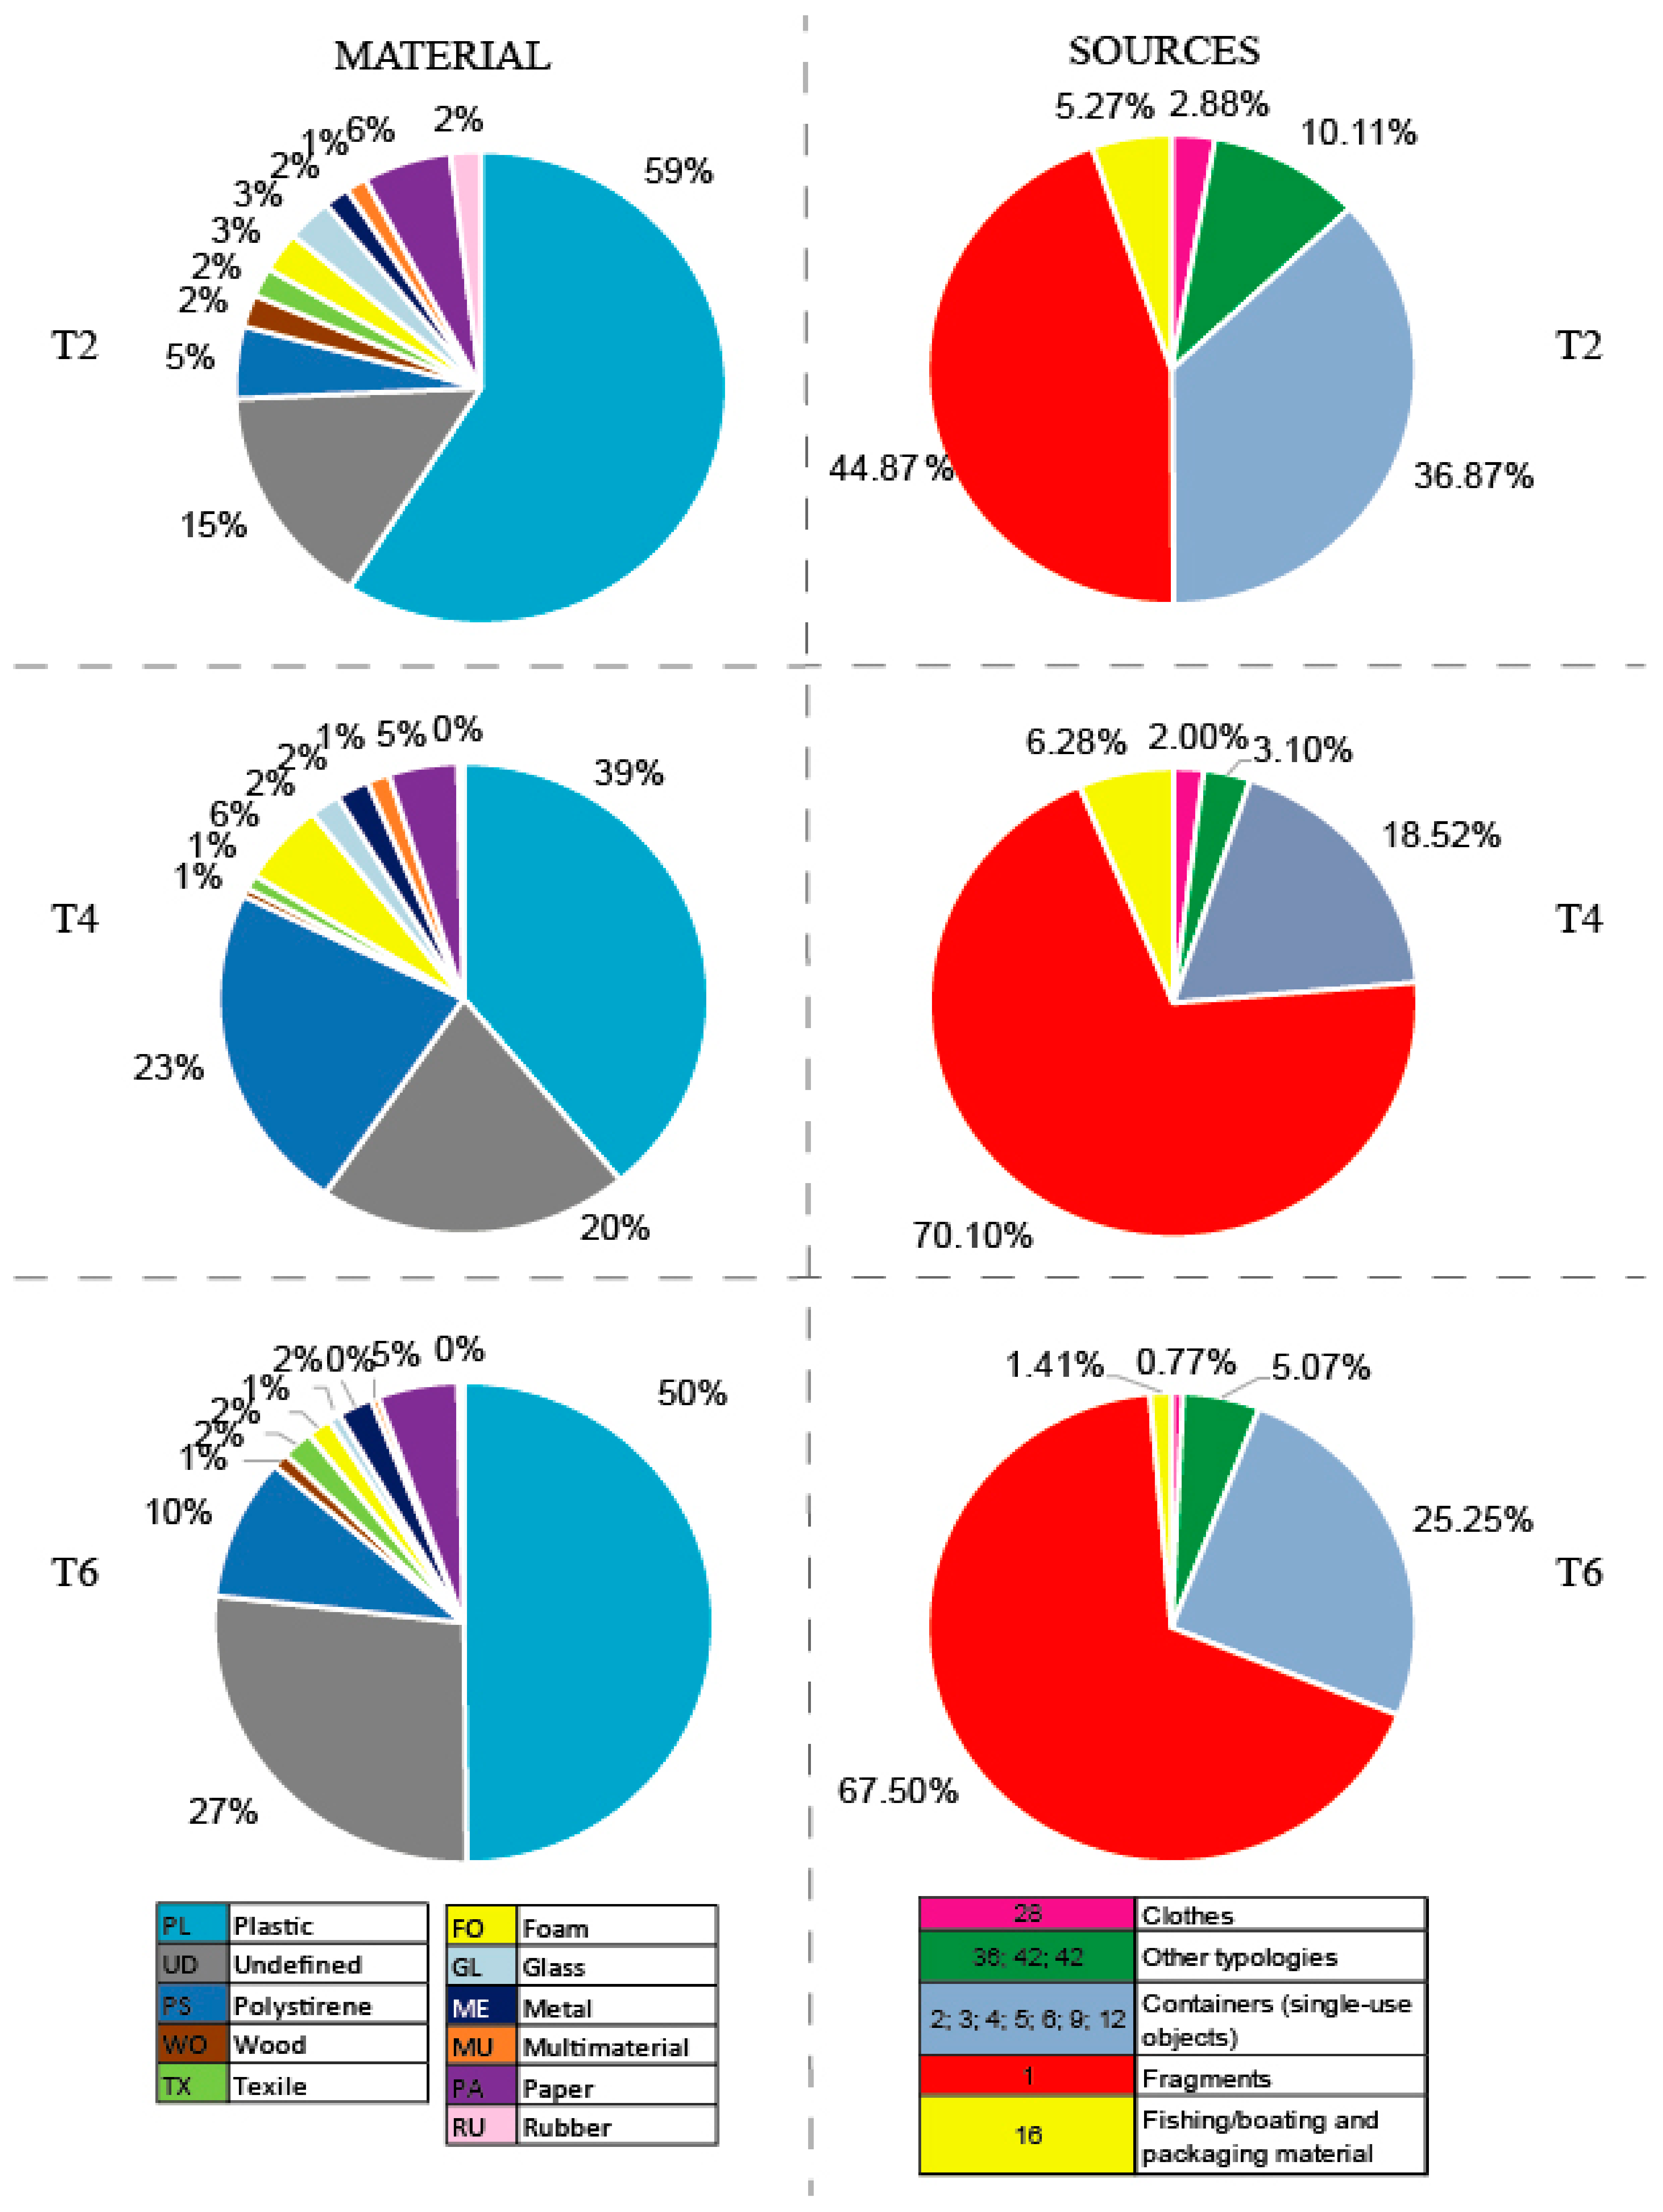
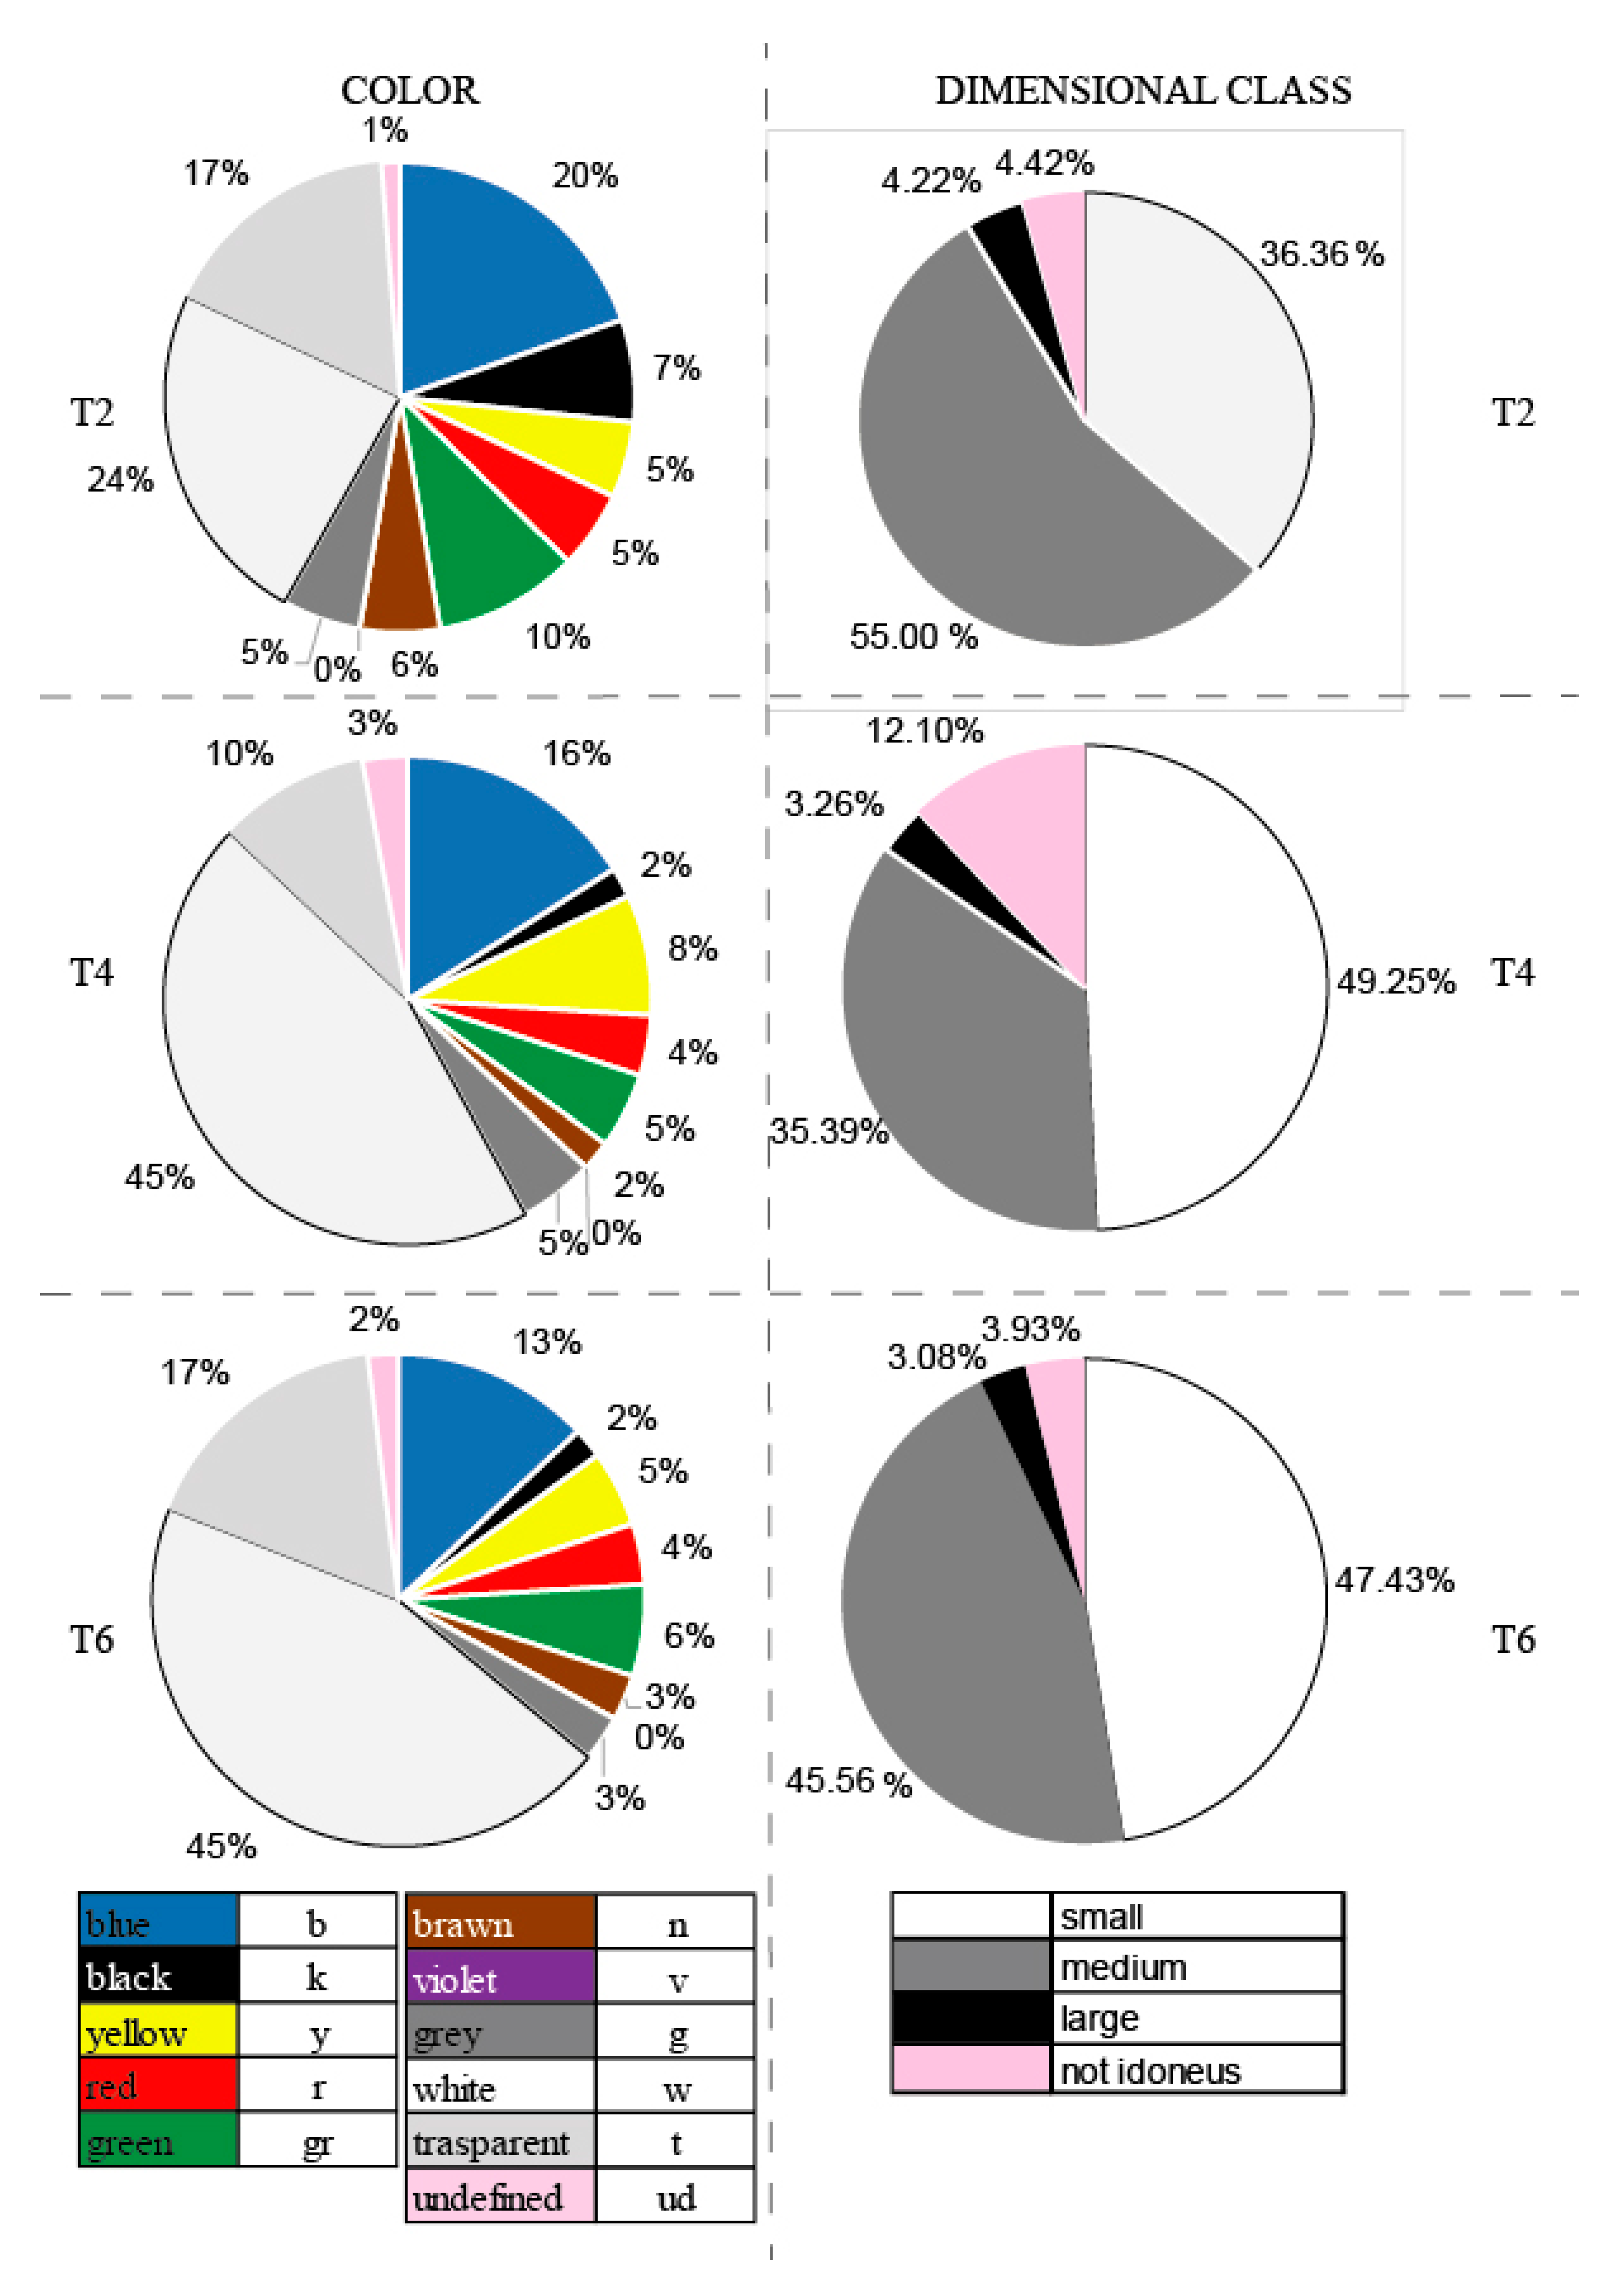
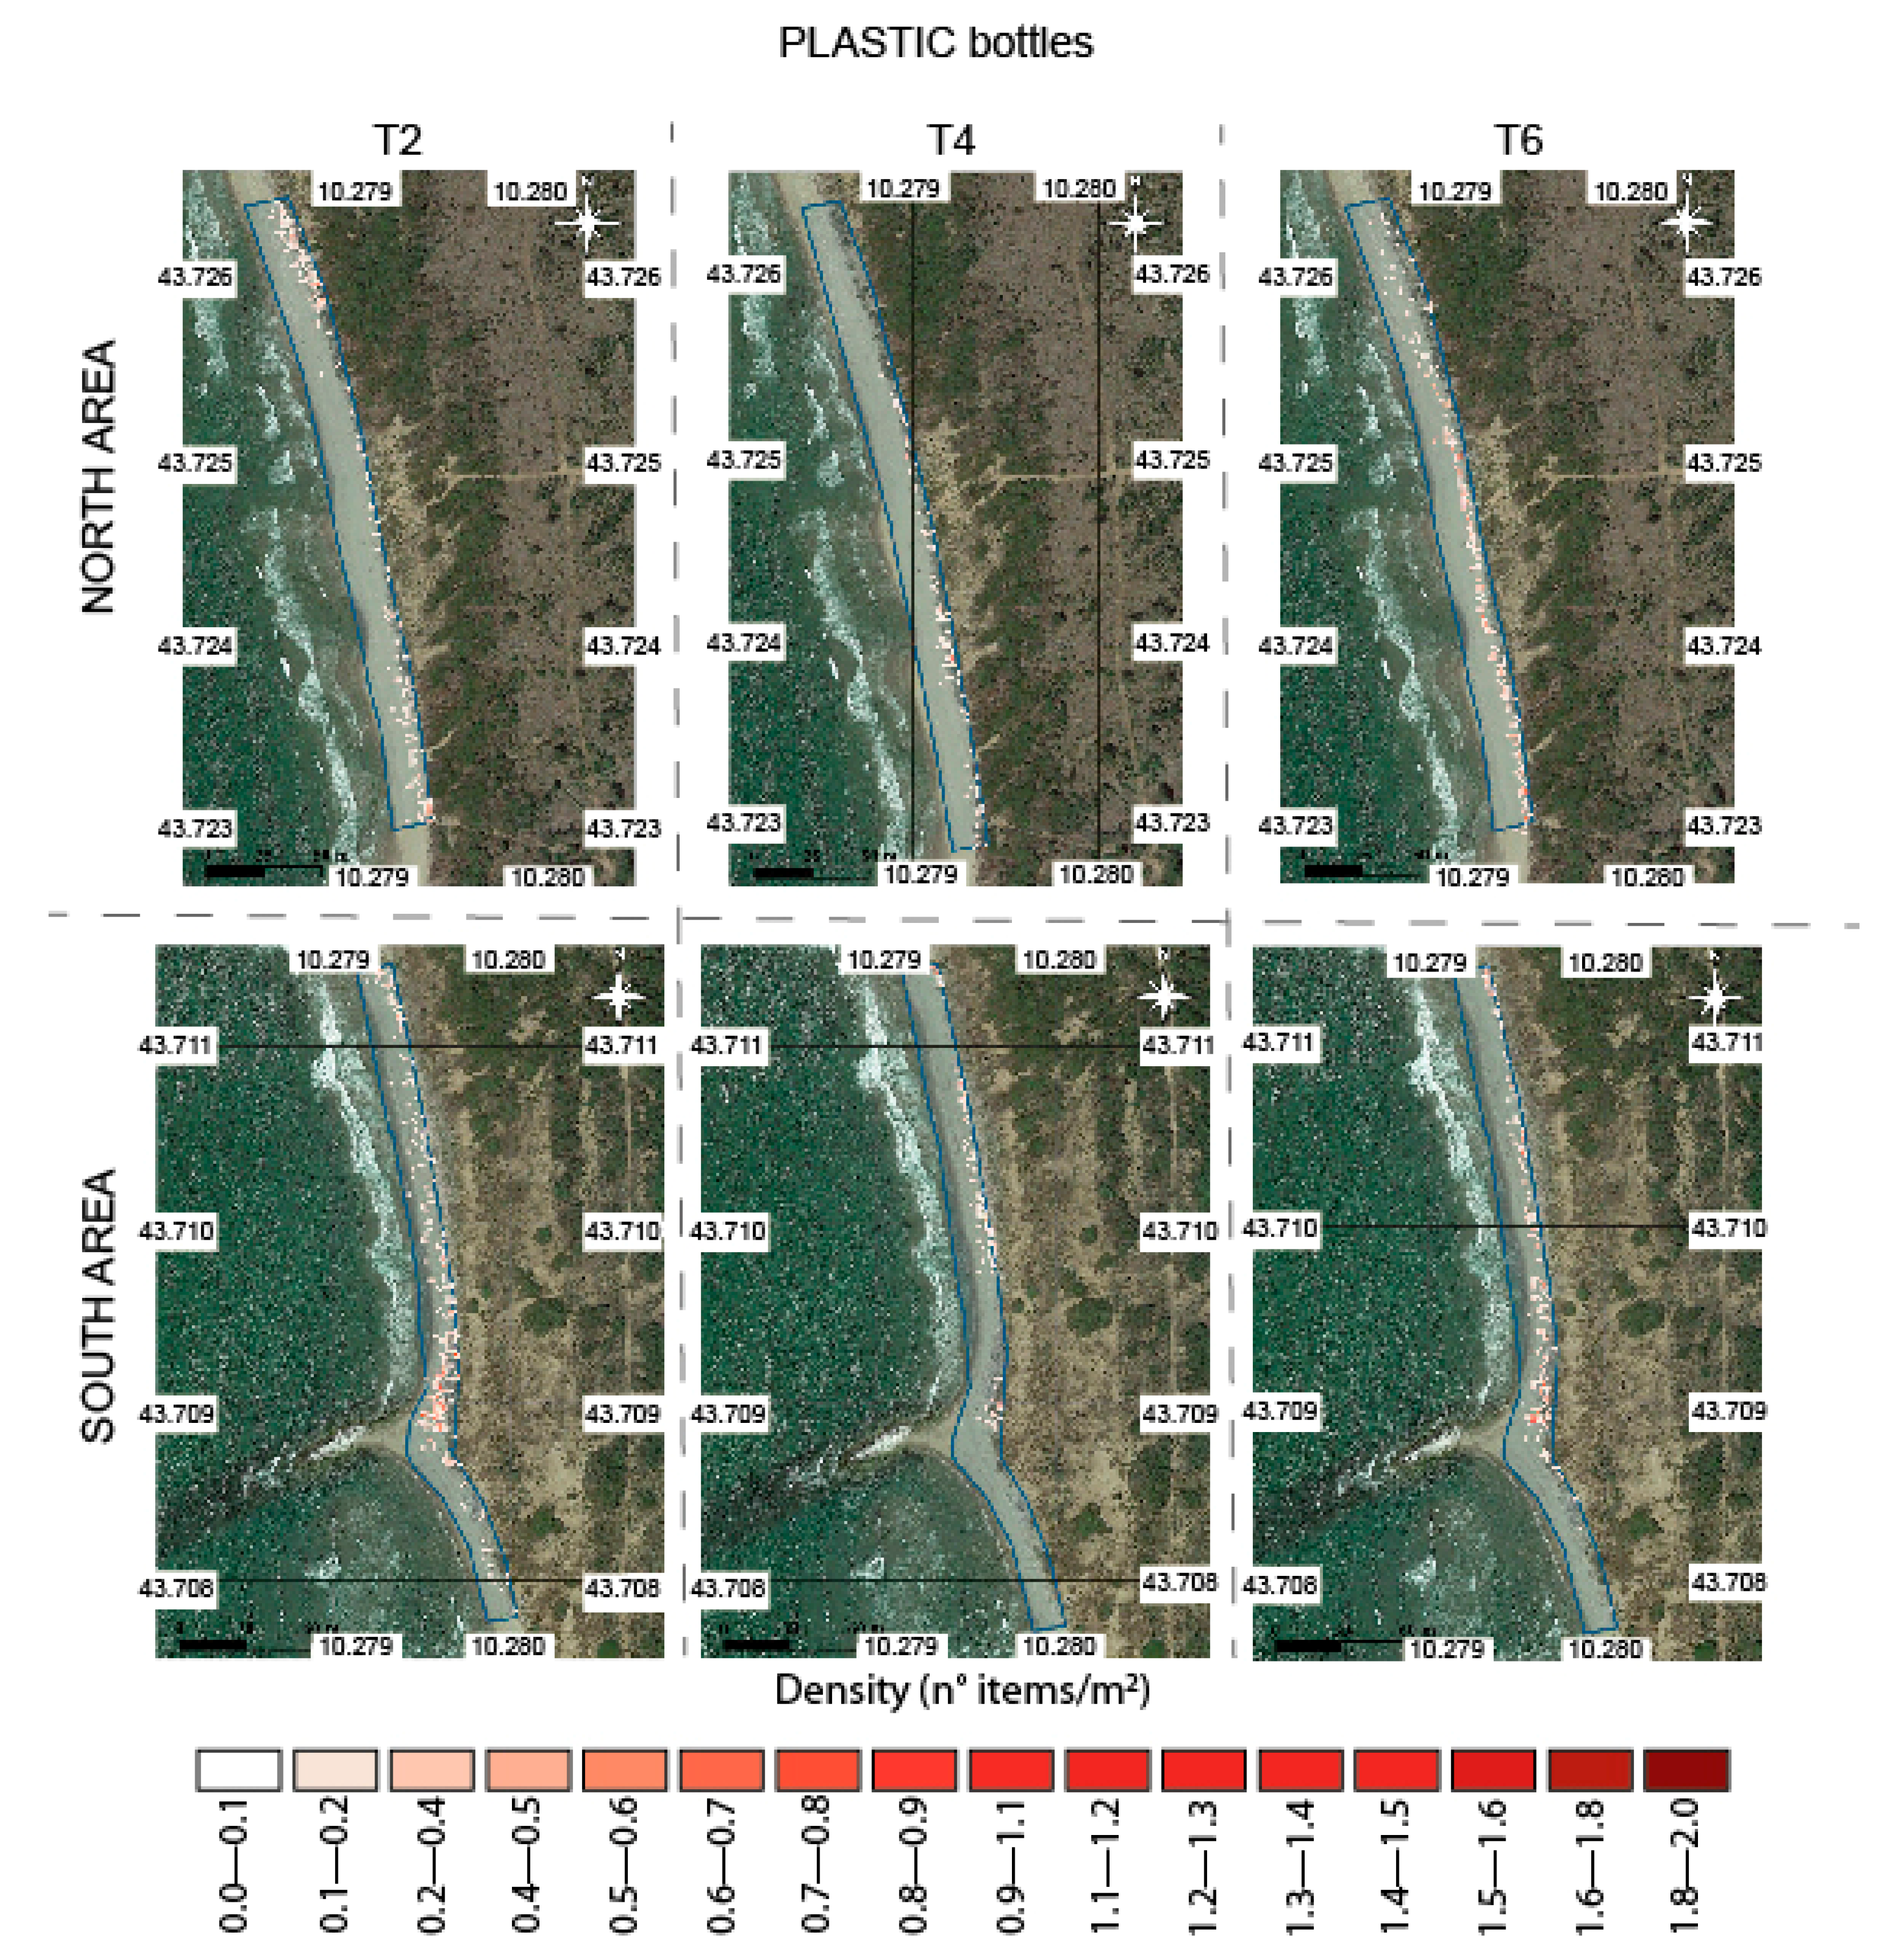
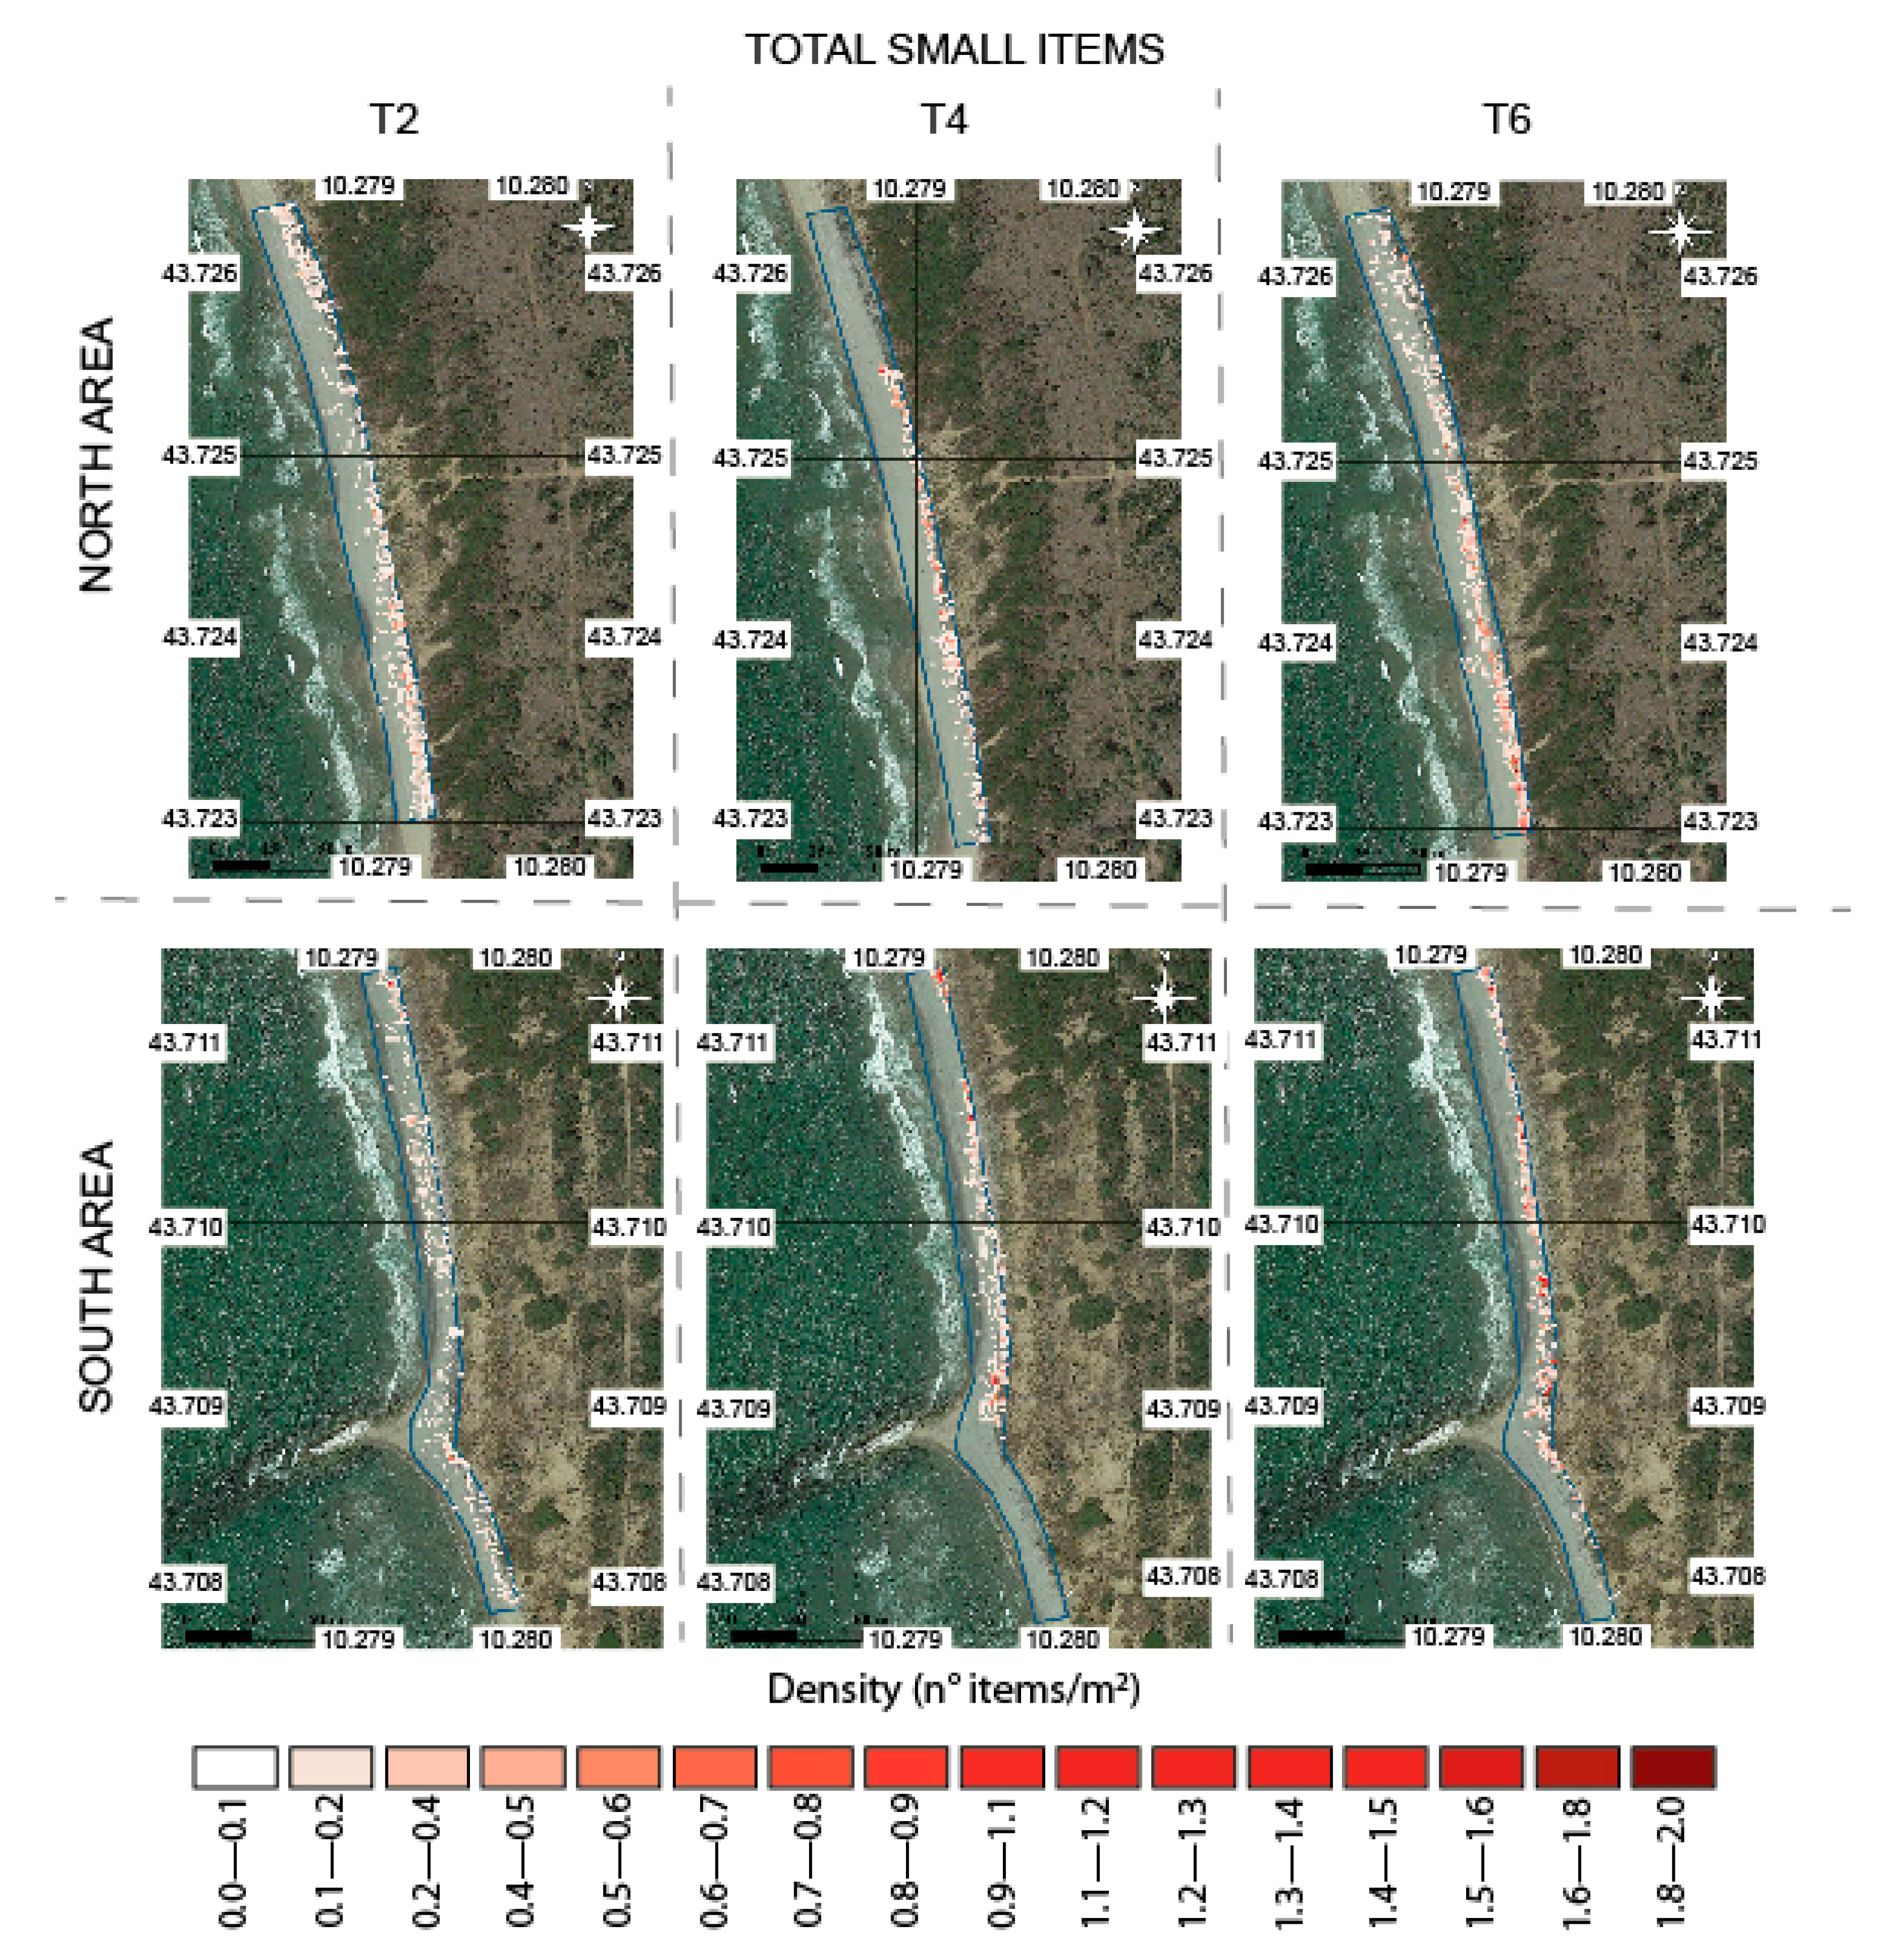
3.1. Quantity, Typology, and Spatial and Temporal Distribution of BML

The results for the three time surveys (T2, T4, and T6) are reported in Figure 2, Figure 3, Figure 4, Figure 5, Figure 6, Figure 7 and Figure 8 (as pie charts and spatial maps); we selected some of the obtained maps showing the most relevant features (see the Supplementary Materials and https://sites.google.com/view/seacleaner/citizen-science-data (accessed on 1 May 2025)).
Figure 2 and Figure 3 present the results for the MATERIAL, SOURCES, COLOR, and DIMENSIONAL CLASS categories for the study area, as described in [42].
Figure 2 (and Table S1 in the Supplementary Materials) shows a predominance of specific MATERIAL categories: “plastic”, “polystyrene” (which varies greatly depending on the time period), “undefined”, and “paper”. Considering the SOURCES category, “fragments” is the most densely populated, most likely representing a macro-category accounting for undefined items, followed by “containers” (single-use objects). For COLORS, “white” and “transparent” are the most common, with “blue” the leading color among the colored objects (Figure 3).
Concerning the “DIMENSIONAL CLASS”, small and medium objects were similarly recognized, while a clearer distinction was observed between “large” and “not idoneous” objects (Figure 3). Here, we report selected maps regarding the distribution of total items (Figure 4), plastic items (Figure 5), polystyrene items (Figure 6), plastic bottle items (Figure 7), and large items (Figure 8). Other maps are reported in the Supplementary Materials.
As a general observation, higher densities of recognized items (deep pink/red) were clustered near the dunes’ edge.
The map of total items (Figure 4) and the map of plastic items (Figure 5) show similar spatial and temporal patterns. In particular, the north area shows a high density of items across all replicas (especially T2 and T6), while the south area seems to be less affected by accumulation. For T2, the top part of the north area is more densely populated than the bottom part, while this behavior is reversed for T6. The south area shows lower accumulation overall, with a decreasing trend from T2 to T6. For T4, the top part of the north area and the bottom part of the south area were not completely studied, as the related data were not fully returned by the CSOs.
Figure 6 and Figure 7 show the distribution of plastic bottles and polystyrene, which were among the most abundant ML types found during the surveys. The spatial and temporal distributions follow the general distribution of all plastic items, but they substantially differ from one another. In particular, in the upper portion of the north area, polystyrene is scarce, whereas the bottle density is high.
In the south area, both types of items show lower density toward the coast edge, below the reef barrier. Regarding their temporal variation, polystyrene’s density seems to be higher for T4 and T6, with respect to T2. The bottles show similar density for T2 and T6 (slightly higher for T2), with a visible decrease for T4. Spatially, both bottles and polystyrene are more concentrated along the dune zone for all periods. In some cases, the items are more widespread over the entire beach (i.e., the south area, bottles, and polystyrene for T2; north area, bottles for T6). Figure 8 exhibits the distribution of “Large Items”, which represents the least numerous category, displaying a preferential distribution along the dune zone for T4 and T6. The distributions of “Medium” and “Small” items are included in Annex S3 of the Supplementary Materials.

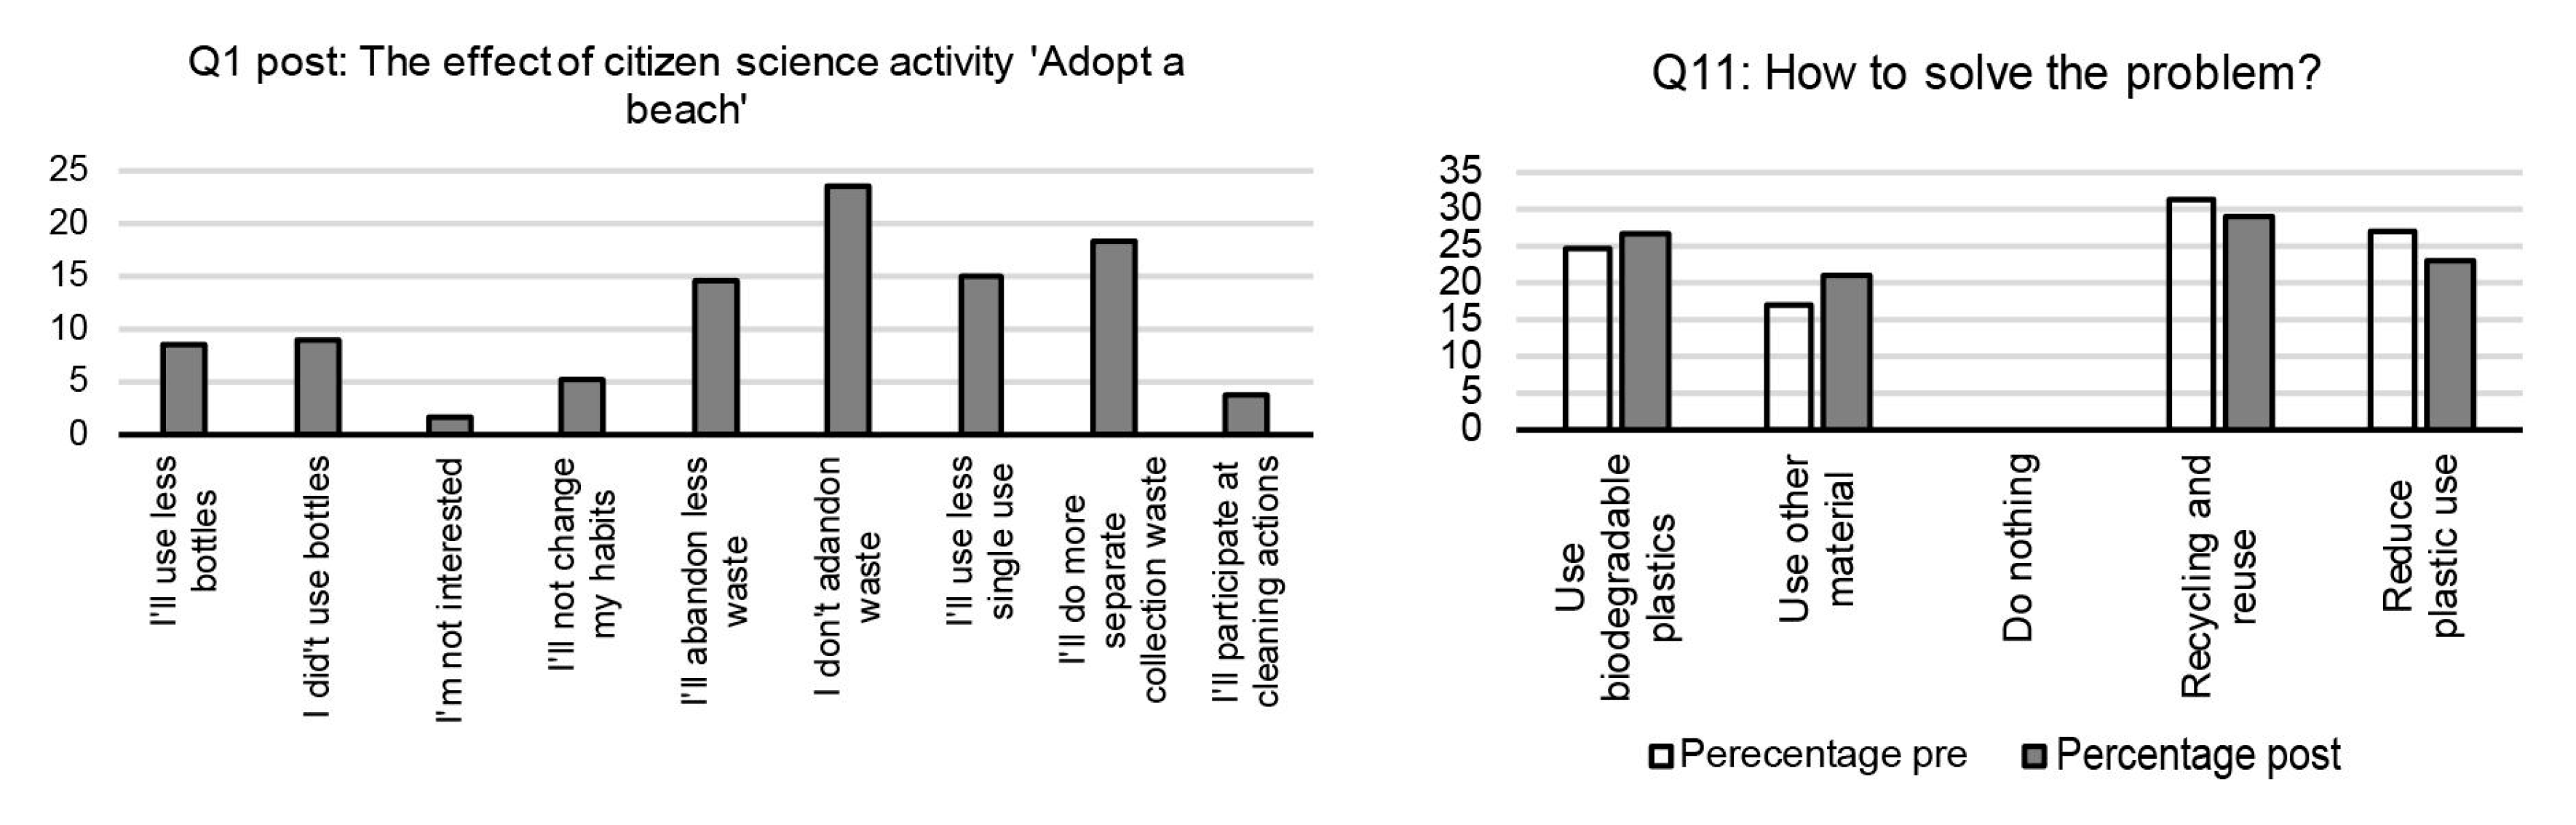
3.2. Questionnaire Results

The graphs reported in Figure 9 and Figure 10 show the results of pre- and post-questionnaires administered to the students involved in this project.
Both graphs reflect the variation in acquiring information and the perception of the ML problem before and after the remote activities. Overall, the activities led to small changes in the students’ responses, with a greater impact on factual knowledge (Figure 9) and less on changing perceptions (Figure 10).
For instance, in Q8 (Figure 9), “Waste most present on the beaches”, responses about cotton buds, polystyrene, and cigarettes decreased after the training. This reflects the specific conditions of the monitored marine park areas, where access is restricted and urban-type waste is rarer. On the other hand, sea-borne plastic debris is predominant, as evidenced by the high percentage of cotton buds (banned in the EU only since June 2021). The students also showed an improved understanding about the difference between plastic and microplastic (Q2), as well as the proportion of plastic among marine litter (Q7), leading to a slight positive shift in their answers.
Notably, while the students were familiar with geographic information systems (GISs), they were less confident about the technical definition of UAVs. The responses to Q9 indicated that most of their information about marine litter was from media sources (Internet and TV).
In terms of perception (Figure 10), the students exhibited a minor improvement, especially regarding the anthropogenic pollution affecting marine parks (Q13) and the effects of plastic and microplastic in marine environments (Q3 and Q4). However, they demonstrated a better understanding of the causes of ML pollution (Q5, Q6, and Q9).
Finally, Figure 11 shows responses to the first post-questionnaire item (replacing Qi-pre, concerning sources of information) and to the last question (Q11) about “self-reported actions”.
The results indicate that, after the activities, the students’ interest in choosing biodegradable plastics increased, while their interest in recycling and reusing plastics decreased.

4. Discussion

The results of this study suggest that it is possible to estimate both the quantity and type of marine litter through a citizen science approach, if the quality of the data provided by a non-specialist user is correctly validated by specialists (Figure 2 and Figure 3). Moreover, these data allow for the production of “accumulation maps” over a large coastal area, showing the spatial distribution of different ML categories.
Since this work was mainly methodological, only a few of the possible maps are shown (Figure 4, Figure 5, Figure 6, Figure 7 and Figure 8), although this project collected extensive data capable of producing additional maps of different types of marine litter (see https://sites.google.com/view/seacleaner/citizen-science-data (accessed on 1 May 2025) for the full table with the data obtained). Moreover, multiple temporal surveys of the same area provide an opportunity to investigate the dynamics of AMD accumulation over time.
While analyzing the causes behind spatial and temporal differences was not the primary goal of this study, several trends emerge from the maps. For instance, the north area showed higher object densities in each of the considered time periods (particularly T2 and T6) compared to the south area. The distribution of plastic items (Figure 5) mirrors the pattern of total items (Figure 4), since plastic represents the dominant material among the monitored items (Figure 2). The visible difference between the bottle and polystyrene distributions (Figure 6 and Figure 7) may be attributable to their distinct sources and dispersal patterns. Bottles are ubiquitous and widespread in all monitoring, particularly those originating from rivers [75]. In contrast, polystyrene is mostly linked to fishing activities and shows more seasonal variations. In autumn and winter (T4 and T6), fishing vessels approach closer to the coast due to reduced tourist activity, increasing the deposition of polystyrene. Another interesting feature is the emergence of areas where permanent accumulations exist, such as the artificial reef of rocks visible in all of the presented maps. Additionally, some areas show strong seasonal variability, with litter either concentrated near the dunes or dispersed along the beach (e.g., the north area for T6 and the south area for T2; Figure 4, Figure 5, Figure 6 and Figure 7). These patterns are influenced by multiple factors, including wave action, sea condition, storm surges, and wind. In fact, while broader factors contribute to an increase or decrease in the amount of debris (season, river floods, etc.), affecting the entire shoreline similarly, more localized variations are shaped by other features, such as artifacts, the local morphological gradients, and/or the extension of the area. These factors favor the accumulation of debris near the dunes, where items may persist longer before being removed by the waves’ motion.
A proper evaluation of these local morphological and meteorological factors influencing debris accumulation requires a detailed study of local dynamics (e.g., prevailing winds, direction of currents, etc.)—a future step made possible thanks to the data collected through this citizen science project.
We should consider that the maps presented here were produced by averaging the density values for each area across the number of students who analyzed it. As shown in Table 1, the data from T2 are slightly more statistically reliable compared to those from T4 and T6.
Comparing the color distribution results (Figure 2 and Figure 3) with those reported by Merlino et al. [42], we observed notable similarities. The percentage of white-colored litter in T4 (45%) and T6 (46%) matched closely with the previous study’s findings via both in situ visual census (46%) and manual image screening (43%). However, considering T2, this percentage was much lower (24%). The percentages of the other colors were consistent across all of the time replicas, with transparent representing the second-most-abundant color, followed by blue and green.
An interesting result is the relatively high percentage of items classified as “paper”, which could be indicative of a potential misidentification by the CSOs. The students may have overestimated the “paper”, “cigarettes”, and “glass” categories without considering that such types of waste are less common in restricted marine parks due to limited public access. Again, the low difference between the small and medium categories (Figure 3) may reflect a limitation of the manual image screening methodology. In prior studies [42,76], “small” objects typically represented over 85% of the total, whereas, in the present research, they ranged from 36% in T2 to 49% in T4. This underestimation is likely related to the difficulty of visual detecting small objects. In fact, the limited image resolution and colors of the background might mislead both manual and semi-automatic interpretation.
As a result, our study provides insight about engagement and awareness in school-age populations. Using pre- and post-training activity questionnaires, we assessed whether the activities, despite the challenges of the COVID-19 period, improved knowledge and raised environmental awareness. This approach aimed to compare the results of “remote” activities to those from the “on the field” activities conducted in the previous study. Although some improvement was observed between the pre- and post-activity responses, the impact was more limited compared to pre-COVID-19 fieldwork studies [71] in terms of both knowledge acquisition and problem perception. This is probably because the “on-field” experiences have a greater impact in terms of both improving the students’ background knowledge and stimulating them to change their perceptions. Nevertheless, targeted activities, including preparatory lectures and training sessions, led to the better understanding of concepts such as the definition of “microplastics” (see graph Q2), a better recognition of plastic waste (see graph Q7), and the main waste categories found in the studied areas (see graph Q8). At the same time, training activities served to increase the students’ capacity to use QGIS software (see graph Q14) and UAVs (see graph Q16), both belonging in the category “Technical Knowledge”.
The most discordant results are related to the pre- and post-activities responses concerning the students’ perceptions about the “Perceived negative impact” of plastics (in general, Q3), microplastics in the marine environment (Q4), and their effects on marine protected areas (Q13). These discrepancies contrast with the high emphasis placed on these topics during the lectures, where the importance of reducing plastic use, promoting recycling and reuse, and highlighting the limited effectiveness of bioplastics (which are not fully degradable in marine environments) was clearly discussed.
Unfortunately, these concepts were not sufficiently understood by the students, as evidenced by the graph on “self-reported actions” (Q11, Figure 11). Moreover, considering the answer to Q1-post (Figure 11) concerning “self-reported actions”, i.e., the personal contribution to reducing ML, the students’ responses—e.g., “not abandon garbage”, engage in “recycling collection”, and “try not to use single use plastic”—seemed to be in stark contradiction to what their responses to Q11 revealed.
We expected that the specific activities, such as the classification of waste using orthophotos, could reinforce the students’ awareness about single-use plastics and recycling, especially since the students were directly identifying many recyclable items. However, the results for Q11 suggest that the students prioritized switching to bioplastics or other alternatives over adopting the broader principles of “reduce, reuse, recycle”.
Therefore, while the image-based cataloguing activity seems to have helped the students to understand the causes of ML pollution (Q9, Q5, and Q6), other activities, such as remote lectures and virtual visits, were less effective. This may be related to a general decrease in the engagement of students in remote activities. In essence, less “empathy” due to the “remote” mode of the presentation of the concepts was probably the cause of such reduced interest and interaction among the students.
Interestingly, the responses to Q1-pre (Figure 9) highlight that most of the students obtained their information from sources such as the Internet, television, and social media, rather than from specialists in the specific research topic.

5. Conclusions

This methodological work demonstrates how it is possible to obtain quantitatively and qualitatively valid data on marine litter distribution in large beach areas, even from “non-specialist” operators (i.e., high school students), via a citizen science approach and the use of aerial drones.
We produced several spatial and temporal distribution maps for different marine litter categories over vast areas of coastline, especially those that are difficult to access. These can prove useful in assessing the different causes that contribute to the variation in the distribution of objects over the course of a year and thus in planning targeted interventions and/or increasing the effectiveness of prevention and removal actions by the authorities in charge of their management and conservation.
As a result, we attest that the activities carried out in the “remote” mode (due to the COVID-19 emergency) proved to be less useful in properly conveying much of the information to the students during the project, causing only minimal (if any) changes in their awareness, perceptions, and attitudes with respect to dealing with the issue of litter dispersal in marine environments.

Supplementary Materials

The following are available online at https://www.mdpi.com/article/10.3390/su17115048/s1. Supporting information is reported in the Supplementary Materials: Table S1 (Annex S1): Data related to Figure 3 and Figure 4. Supplementary Text-1 (Annex S2): Description of the project PCTO Adopt a Beach “at a distance”. Figure S1 (Annex S3): Distribution of the medium items. Figure S2 (Annex S3): Distribution of the small items. Supplementary Text-2 (Annex S4): Questionnaires.

Author Contributions

Conceptualization, S.M.; methodology, S.M., M.L. and L.M.; software, M.P. and L.M.; validation, L.M. and L.C.; formal analysis, L.M., M.L. and M.P.; investigation, S.M., M.L. and L.M.; resources, S.M. and M.P.; data curation, M.L., L.C., L.M. and M.P.; writing—original draft preparation, S.M.; writing—review and editing, S.M. and L.C.; visualization, M.L., M.P. and L.M.; supervision, S.M.; project administration, S.M., M.L. and L.C.; funding acquisition, M.P. All authors have read and agreed to the published version of the manuscript.

Funding

This research received no external funding.

Institutional Review Board Statement

This study was conducted in accordance with institutional policies and ethical standards. Formal IRB approval was not required for this type of educational research involving anonymous questionnaires.

Informed Consent Statement

Informed consent was implied through voluntary participation. The questionnaires were completed anonymously by students as part of a school-based educational project, with prior consent from the participants and their supervisors.

Data Availability Statement

The data presented in this study are available on request from the corresponding author.

Acknowledgments

We would like to thank the Park of Migliarino, Massaciuccoli, and San Rossore for the permission to access the protected area and perform the field experiments. Special thanks go to the involved scholastic institutes, to the students that participated in this citizen science and educational experience during the hard days of the COVID-19 emergency, and to who supported them and helped us in collecting the data: for IIS Meucci of Massa (MS), Fabio Pieraccioni; for IIS Zaccagna-Galilei of Carrara (MS), Chiara Collotti and M. Cristina Matelli; for IIS Agnoletti of Sesto Fiorentino (FI), Laura Dei; for ISI Garfagnana of Castelnuovo (LU), Andrea Malagoli; for LS Marconi San Miniato (PI), Laura Doria. Thanks also to the NAUTILOS project (European Union’s Horizon 2020 research and innovation program under grant agreement no. 101000825) for providing storage space for our data.

Conflicts of Interest

The authors declare no conflicts of interest.

Abbreviations

The following abbreviations are used in this manuscript:
AMDAnthropogenic marine debris
BMLBeached marine litter
CSOCitizen science operators
DSMDigital surface model
DTMDigital terrain model
GSDGround sampling distance
MPAMarine protected area
MLMarine litter
PCTOPathways for Transversal Skills and Orientation
SRPRKSan Rossore Park
UAVUnmanned aerial vehicle

References

  1. Cózar, A.; Echevarría, F.; González-Gordillo, J.I.; Irigoien, X.; Úbeda, B.; Hernández-León, S.; Palma, Á.T.; Navarro, S.; García-de-Lomas, J.; Ruiz, A.; et al. Plastic Debris in the Open Ocean. Proc. Natl. Acad. Sci. USA 2014, 111, 10239–10244. [Google Scholar] [CrossRef] [PubMed]
  2. Cózar, A.; Sanz-Martín, M.; Martí, E.; González-Gordillo, J.I.; Ubeda, B.; Gálvez, J.Á.; Irigoien, X.; Duarte, C.M. Plastic Accumulation in the Mediterranean Sea. PLoS ONE 2015, 10, e0121762. [Google Scholar] [CrossRef] [PubMed]
  3. Suaria, G.; Avio, C.G.; Mineo, A.; Lattin, G.L.; Magaldi, M.G.; Belmonte, G.; Moore, C.J.; Regoli, F.; Aliani, S. The Mediterranean Plastic Soup: Synthetic Polymers in Mediterranean Surface Waters. Sci. Rep. 2016, 6, 37551. [Google Scholar] [CrossRef] [PubMed]
  4. Giovacchini, A.; Merlino, S.; Locritani, M.; Stroobant, M. Spatial Distribution of Marine Litter along Italian Coastal Areas in the Pelagos Sanctuary (Ligurian Sea–NW Mediterranean Sea): A Focus on Natural and Urban Beaches. Mar. Pollut. Bull. 2018, 130, 140–152. [Google Scholar] [CrossRef]
  5. Andrady, A.L. The Plastic in Microplastics: A Review. Mar. Pollut. Bull. 2017, 119, 12–22. [Google Scholar] [CrossRef]
  6. Saliu, F.; Montano, S.; Garavaglia, M.G.; Lasagni, M.; Seveso, D.; Galli, P. Microplastic and Charred Microplastic in the Faafu Atoll, Maldives. Mar. Pollut. Bull. 2018, 136, 464–471. [Google Scholar] [CrossRef]
  7. Olivelli, A.; Hardesty, B.D.; Wilcox, C. Coastal Margins and Backshores Represent a Major Sink for Marine Debris: Insights from a Continental-Scale Analysis. Environ. Res. Lett. 2020, 15, 074037. [Google Scholar] [CrossRef]
  8. Lebreton, L.C.M.; Van Der Zwet, J.; Damsteeg, J.-W.; Slat, B.; Andrady, A.; Reisser, J. River Plastic Emissions to the World’s Oceans. Nat. Commun. 2017, 8, 15611. [Google Scholar] [CrossRef]
  9. Pierdomenico, M.; Casalbore, D.; Chiocci, F.L. Massive Benthic Litter Funnelled to Deep Sea by Flash-Flood Generated Hyperpycnal Flows. Sci. Rep. 2019, 9, 5330. [Google Scholar] [CrossRef]
  10. González-Fernández, D.; Cózar, A.; Hanke, G.; Viejo, J.; Morales-Caselles, C.; Bakiu, R.; Barceló, D.; Bessa, F.; Bruge, A.; Cabrera, M.; et al. Floating Macrolitter Leaked from Europe into the Ocean. Nat. Sustain. 2021, 4, 474–483. [Google Scholar] [CrossRef]
  11. Van Emmerik, T.; Schwarz, A. Plastic Debris in Rivers. WIREs Water 2020, 7, e1398. [Google Scholar] [CrossRef]
  12. Merlino, S.; Locritani, M.; Guarnieri, A.; Delrosso, D.; Bianucci, M.; Paterni, M. Marine Litter Tracking System: A Case Study with Open-Source Technology and a Citizen Science-Based Approach. Sensors 2023, 23, 935. [Google Scholar] [CrossRef] [PubMed]
  13. Galgani, F.; Hanke, G.; Werner, S.; De Vrees, L. Marine Litter within the European Marine Strategy Framework Directive. ICES J. Mar. Sci. 2013, 70, 1055–1064. [Google Scholar] [CrossRef]
  14. Gesamp. Guidelines for the Monitoring and Assessment of Plastic Litter and Microplastics in the Ocean; Gesamp Report and Studies. 2019, p. 123. Available online: http://www.gesamp.org/publications/guidelines-for-the-monitoring-and-assessment-of-plastic-litter-in-the-ocean (accessed on 1 May 2025).
  15. Castro-Rosero, L.M.; Hernandez, I.; Mestres, M.; Liste, M.; Alsina, J.M.; Espino, M. Numerical Modeling of the Dispersion and Accumulation of Marine Litter from the Dniester River in Coastal Areas of the Northwestern Black Sea. Mar. Pollut. Bull. 2025, 213, 117602. [Google Scholar] [CrossRef]
  16. Topouzelis, K.; Papakonstantinou, A.; Garaba, S.P. Detection of Floating Plastics from Satellite and Unmanned Aerial Systems (Plastic Litter Project 2018). Int. J. Appl. Earth Obs. Geoinf. 2019, 79, 175–183. [Google Scholar] [CrossRef]
  17. Cózar, A.; Arias, M.; Suaria, G.; Viejo, J.; Aliani, S.; Koutroulis, A.; Delaney, J.; Bonnery, G.; Macías, D.; De Vries, R.; et al. Proof of Concept for a New Sensor to Monitor Marine Litter from Space. Nat. Commun. 2024, 15, 4637. [Google Scholar] [CrossRef]
  18. Navarro, A.; Young, M.; Allan, B.; Carnell, P.; Macreadie, P.; Ierodiaconou, D. The Application of Unmanned Aerial Vehicles (UAVs) to Estimate above-Ground Biomass of Mangrove Ecosystems. Remote Sens. Environ. 2020, 242, 111747. [Google Scholar] [CrossRef]
  19. Carrera-Hernández, J.J.; Levresse, G.; Lacan, P. Is UAV-SfM Surveying Ready to Replace Traditional Surveying Techniques? Int. J. Remote Sens. 2020, 41, 4820–4837. [Google Scholar] [CrossRef]
  20. Luppichini, M.; Bini, M.; Paterni, M.; Berton, A.; Merlino, S. A New Beach Topography-Based Method for Shoreline Identification. Water 2020, 12, 3110. [Google Scholar] [CrossRef]
  21. Ciccarelli, D.; Cini, E.; Mo, A.; Paterni, M.; Massetti, L.; Rangel-Buitrago, N.; Merlino, S. The Assessment and Management of Plant Invasions with Unmanned Aerial Vehicles. The Yucca Gloriosa Case, Italy. Reg. Stud. Mar. Sci. 2023, 57, 102759. [Google Scholar] [CrossRef]
  22. Massetti, L.; Mo, A.; Cini, E.; Paterni, M.; Merlino, S.; Ciccarelli, D. Detection of Yucca Gloriosa in Mediterranean Coastal Dunes: A Comparative Analysis of Field-Based Sampling, Human Interpretation of UAV Imagery and Deep Learning to Develop an Effective Tool for Controlling Invasive Plants. Reg. Stud. Mar. Sci. 2023, 68, 103265. [Google Scholar] [CrossRef]
  23. Torresan, C.; Berton, A.; Carotenuto, F.; Di Gennaro, S.F.; Gioli, B.; Matese, A.; Miglietta, F.; Vagnoli, C.; Zaldei, A.; Wallace, L. Forestry Applications of UAVs in Europe: A Review. Int. J. Remote Sens. 2017, 38, 2427–2447. [Google Scholar] [CrossRef]
  24. Bonali, F.L.; Tibaldi, A.; Marchese, F.; Fallati, L.; Russo, E.; Corselli, C.; Savini, A. UAV-Based Surveying in Volcano-Tectonics: An Example from the Iceland Rift. J. Struct. Geol. 2019, 121, 46–64. [Google Scholar] [CrossRef]
  25. Pérez, J.A.; Gonçalves, G.R.; Rangel, J.M.G.; Ortega, P.F. Accuracy and Effectiveness of Orthophotos Obtained from Low Cost UASs Video Imagery for Traffic Accident Scenes Documentation. Adv. Eng. Softw. 2019, 132, 47–54. [Google Scholar] [CrossRef]
  26. Pérez-Alvárez, J.A.; Gonçalves, G.R.; Cerrillo-Cuenca, E. A Protocol for Mapping Archaeological Sites through Aerial 4k Videos. Digit. Appl. Archaeol. Cult. Herit. 2019, 13, e00101. [Google Scholar] [CrossRef]
  27. Kiszka, J.; Mourier, J.; Gastrich, K.; Heithaus, M. Using Unmanned Aerial Vehicles (UAVs) to Investigate Shark and Ray Densities in a Shallow Coral Lagoon. Mar. Ecol. Prog. Ser. 2016, 560, 237–242. [Google Scholar] [CrossRef]
  28. Levy, J.; Hunter, C.; Lukacazyk, T.; Franklin, E.C. Assessing the Spatial Distribution of Coral Bleaching Using Small Unmanned Aerial Systems. Coral Reefs 2018, 37, 373–387. [Google Scholar] [CrossRef]
  29. Gonçalves, G.R.; Pérez, J.A.; Duarte, J. Accuracy and Effectiveness of Low Cost UASs and Open Source Photogrammetric Software for Foredunes Mapping. Int. J. Remote Sens. 2018, 39, 5059–5077. [Google Scholar] [CrossRef]
  30. Holman, R.A.; Holland, K.T.; Lalejini, D.M.; Spansel, S.D. Surf Zone Characterization from Unmanned Aerial Vehicle Imagery. Ocean Dyn. 2011, 61, 1927–1935. [Google Scholar] [CrossRef]
  31. Turner, I.L.; Harley, M.D.; Drummond, C.D. UAVs for Coastal Surveying. Coast. Eng. 2016, 114, 19–24. [Google Scholar] [CrossRef]
  32. Pádua, L.; Vanko, J.; Hruška, J.; Adão, T.; Sousa, J.J.; Peres, E.; Morais, R. UAS, Sensors, and Data Processing in Agroforestry: A Review towards Practical Applications. Int. J. Remote Sens. 2017, 38, 2349–2391. [Google Scholar] [CrossRef]
  33. Gonçalves, J.A.; Henriques, R. UAV Photogrammetry for Topographic Monitoring of Coastal Areas. ISPRS J. Photogramm. Remote Sens. 2015, 104, 101–111. [Google Scholar] [CrossRef]
  34. Brunier, G.; Fleury, J.; Anthony, E.J.; Gardel, A.; Dussouillez, P. Close-Range Airborne Structure-from-Motion Photogrammetry for High-Resolution Beach Morphometric Surveys: Examples from an Embayed Rotating Beach. Geomorphology 2016, 261, 76–88. [Google Scholar] [CrossRef]
  35. Merlino, S.; Paterni, M.; Berton, A.; Massetti, L. Unmanned Aerial Vehicles for Debris Survey in Coastal Areas: Long-Term Monitoring Programme to Study Spatial and Temporal Accumulation of the Dynamics of Beached Marine Litter. Remote Sens. 2020, 12, 1260. [Google Scholar] [CrossRef]
  36. Alomar, C.; Estarellas, F.; Deudero, S. Microplastics in the Mediterranean Sea: Deposition in Coastal Shallow Sediments, Spatial Variation and Preferential Grain Size. Mar. Environ. Res. 2016, 115, 1–10. [Google Scholar] [CrossRef]
  37. Andrady, A.L. Microplastics in the Marine Environment. Mar. Pollut. Bull. 2011, 62, 1596–1605. [Google Scholar] [CrossRef]
  38. Galgani, F.; Jaunet, S.; Campillo, A.; Guenegen, X.; His, E. Distribution and Abundance of Debris on the Continental Shelf of the North-Western Mediterranean Sea. Mar. Pollut. Bull. 1995, 30, 713–717. [Google Scholar] [CrossRef]
  39. Fallati, L.; Polidori, A.; Salvatore, C.; Saponari, L.; Savini, A.; Galli, P. Anthropogenic Marine Debris Assessment with Unmanned Aerial Vehicle Imagery and Deep Learning: A Case Study along the Beaches of the Republic of Maldives. Sci. Total Environ. 2019, 693, 133581. [Google Scholar] [CrossRef]
  40. Deidun, A.; Gauci, A.; Lagorio, S.; Galgani, F. Optimising Beached Litter Monitoring Protocols through Aerial Imagery. Mar. Pollut. Bull. 2018, 131, 212–217. [Google Scholar] [CrossRef]
  41. Martin, C.; Parkes, S.; Zhang, Q.; Zhang, X.; McCabe, M.F.; Duarte, C.M. Use of Unmanned Aerial Vehicles for Efficient Beach Litter Monitoring. Mar. Pollut. Bull. 2018, 131, 662–673. [Google Scholar] [CrossRef]
  42. Merlino, S.; Paterni, M.; Locritani, M.; Andriolo, U.; Gonçalves, G.; Massetti, L. Citizen Science for Marine Litter Detection and Classification on Unmanned Aerial Vehicle Images. Water 2021, 13, 3349. [Google Scholar] [CrossRef]
  43. Andriolo, U.; Gonçalves, G.; Rangel-Buitrago, N.; Paterni, M.; Bessa, F.; Gonçalves, L.M.S.; Sobral, P.; Bini, M.; Duarte, D.; Fontán-Bouzas, Á.; et al. Drones for Litter Mapping: An Inter-Operator Concordance Test in Marking Beached Items on Aerial Images. Mar. Pollut. Bull. 2021, 169, 112542. [Google Scholar] [CrossRef] [PubMed]
  44. Andriolo, U.; Gonçalves, G.; Sobral, P.; Bessa, F. Spatial and Size Distribution of Macro-Litter on Coastal Dunes from Drone Images: A Case Study on the Atlantic Coast. Mar. Pollut. Bull. 2021, 169, 112490. [Google Scholar] [CrossRef] [PubMed]
  45. Hengstmann, E.; Fischer, E.K. Anthropogenic Litter in Freshwater Environments—Study on Lake Beaches Evaluating Marine Guidelines and Aerial Imaging. Environ. Res. 2020, 189, 109945. [Google Scholar] [CrossRef]
  46. Garcia-Garin, O.; Borrell, A.; Aguilar, A.; Cardona, L.; Vighi, M. Floating Marine Macro-Litter in the North Western Mediterranean Sea: Results from a Combined Monitoring Approach. Mar. Pollut. Bull. 2020, 159, 111467. [Google Scholar] [CrossRef]
  47. Geraeds, M.; Van Emmerik, T.; De Vries, R.; Bin Ab Razak, M.S. Riverine Plastic Litter Monitoring Using Unmanned Aerial Vehicles (UAVs). Remote Sens. 2019, 11, 2045. [Google Scholar] [CrossRef]
  48. Gonçalves, G.; Andriolo, U. Operational Use of Multispectral Images for Macro-Litter Mapping and Categorization by Unmanned Aerial Vehicle. Mar. Pollut. Bull. 2022, 176, 113431. [Google Scholar] [CrossRef]
  49. Andriolo, U.; Topouzelis, K.; Van Emmerik, T.H.M.; Papakonstantinou, A.; Monteiro, J.G.; Isobe, A.; Hidaka, M.; Kako, S.; Kataoka, T.; Gonçalves, G. Drones for Litter Monitoring on Coasts and Rivers: Suitable Flight Altitude and Image Resolution. Mar. Pollut. Bull. 2023, 195, 115521. [Google Scholar] [CrossRef]
  50. Bao, Z.; Sha, J.; Li, X.; Hanchiso, T.; Shifaw, E. Monitoring of Beach Litter by Automatic Interpretation of Unmanned Aerial Vehicle Images Using the Segmentation Threshold Method. Mar. Pollut. Bull. 2018, 137, 388–398. [Google Scholar] [CrossRef]
  51. Martin, C.; Zhang, Q.; Zhai, D.; Zhang, X.; Duarte, C.M. Enabling a Large-Scale Assessment of Litter along Saudi Arabian Red Sea Shores by Combining Drones and Machine Learning. Environ. Pollut. 2021, 277, 116730. [Google Scholar] [CrossRef]
  52. Wolf, M.; Van Den Berg, K.; Garaba, S.P.; Gnann, N.; Sattler, K.; Stahl, F.; Zielinski, O. Machine Learning for Aquatic Plastic Litter Detection, Classification and Quantification (APLASTIC-Q). Environ. Res. Lett. 2020, 15, 114042. [Google Scholar] [CrossRef]
  53. McKinley, D.C.; Miller-Rushing, A.J.; Ballard, H.L.; Bonney, R.; Brown, H.; Cook-Patton, S.C.; Evans, D.M.; French, R.A.; Parrish, J.K.; Phillips, T.B.; et al. Citizen Science Can Improve Conservation Science, Natural Resource Management, and Environmental Protection. Biol. Conserv. 2017, 208, 15–28. [Google Scholar] [CrossRef]
  54. Cohn, J.P. Citizen Science: Can Volunteers Do Real Research? BioScience 2008, 58, 192–197. [Google Scholar] [CrossRef]
  55. Silvertown, J. A New Dawn for Citizen Science. Trends Ecol. Evol. 2009, 24, 467–471. [Google Scholar] [CrossRef]
  56. Kosmala, M.; Wiggins, A.; Swanson, A.; Simmons, B. Assessing Data Quality in Citizen Science. Front. Ecol. Environ. 2016, 14, 551–560. [Google Scholar] [CrossRef]
  57. Thiel, M.; Penna-Díaz, M.A.; Luna-Jorquera, G.; Salas, S.; Sellanes, J.; Stotz, W. Citizen Scientists and Marine Research: Volunteer Participants, Their Contributions, and Projection for the Future. In Oceanography and Marine Biology; Hughes, R.N., Hughes, D.J., Smith, I.P., Eds.; CRC Press: Boca Raton, FL, USA, 2014; pp. 257–314. ISBN 978-0-429-16139-1. [Google Scholar]
  58. Eastman, L.B.; Núñez, P.; Crettier, B.; Thiel, M. Identification of Self-Reported User Behavior, Education Level, and Preferences to Reduce Littering on Beaches—A Survey from the SE Pacific. Ocean Coast. Manag. 2013, 78, 18–24. [Google Scholar] [CrossRef]
  59. Gelcich, S.; Buckley, P.; Pinnegar, J.K.; Chilvers, J.; Lorenzoni, I.; Terry, G.; Guerrero, M.; Castilla, J.C.; Valdebenito, A.; Duarte, C.M. Public Awareness, Concerns, and Priorities about Anthropogenic Impacts on Marine Environments. Proc. Natl. Acad. Sci. USA 2014, 111, 15042–15047. [Google Scholar] [CrossRef]
  60. Hartley, B.L.; Thompson, R.C.; Pahl, S. Marine Litter Education Boosts Children’s Understanding and Self-Reported Actions. Mar. Pollut. Bull. 2015, 90, 209–217. [Google Scholar] [CrossRef]
  61. Bravo, M.; De Los Ángeles Gallardo, M.; Luna-Jorquera, G.; Núñez, P.; Vásquez, N.; Thiel, M. Anthropogenic Debris on Beaches in the SE Pacific (Chile): Results from a National Survey Supported by Volunteers. Mar. Pollut. Bull. 2009, 58, 1718–1726. [Google Scholar] [CrossRef]
  62. Browne, M.A.; Crump, P.; Niven, S.J.; Teuten, E.; Tonkin, A.; Galloway, T.; Thompson, R. Accumulation of Microplastic on Shorelines Woldwide: Sources and Sinks. Environ. Sci. Technol. 2011, 45, 9175–9179. [Google Scholar] [CrossRef]
  63. Carson, H.S. The Incidence of Plastic Ingestion by Fishes: From the Prey’s Perspective. Mar. Pollut. Bull. 2013, 74, 170–174. [Google Scholar] [CrossRef] [PubMed]
  64. Claessens, M.; Meester, S.D.; Landuyt, L.V.; Clerck, K.D.; Janssen, C.R. Occurrence and Distribution of Microplastics in Marine Sediments along the Belgian Coast. Mar. Pollut. Bull. 2011, 62, 2199–2204. [Google Scholar] [CrossRef]
  65. Gago, J.; Lahuerta, F.; Antelo, P. Characteristics (Abundance, Type and Origin) of Beach Litter on the Galician Coast (NW Spain) from 2001 to 2010. Sci. Mar. 2014, 78, 125–134. [Google Scholar] [CrossRef]
  66. Hidalgo-Ruz, V.; Thiel, M. Distribution and Abundance of Small Plastic Debris on Beaches in the SE Pacific (Chile): A Study Supported by a Citizen Science Project. Mar. Environ. Res. 2013, 87–88, 12–18. [Google Scholar] [CrossRef] [PubMed]
  67. Alvisi, F.; Baldrighi, E.; Merlino, S.; Locritani, M.; Panfili, M.; Colella, S.; Bronco, S.; Cicogna, F.; Coiai, S.; King, E.H. Walking on the Sea Traces: Developing a Platform to Bring Ocean Literacy and Citizen Science at Home. Mediterr. Mar. Sci. 2022, 23, 389–404. [Google Scholar] [CrossRef]
  68. Kawabe, L.A.; Ghilardi-Lopes, N.P.; Turra, A.; Wyles, K.J. Citizen Science in Marine Litter Research: A Review. Mar. Pollut. Bull. 2022, 182, 114011. [Google Scholar] [CrossRef]
  69. Catarino, A.I.; Mahu, E.; Severin, M.I.; Akpetou, L.K.; Annasawmy, P.; Asuquo, F.E.; Beckman, F.; Benomar, M.; Jaya-Ram, A.; Malouli, M.; et al. Addressing Data Gaps in Marine Litter Distribution: Citizen Science Observation of Plastics in Coastal Ecosystems by High-School Students. Front. Mar. Sci. 2023, 10, 1126895. [Google Scholar] [CrossRef]
  70. Van Der Velde, T.; Milton, D.A.; Lawson, T.J.; Wilcox, C.; Lansdell, M.; Davis, G.; Perkins, G.; Hardesty, B.D. Comparison of Marine Debris Data Collected by Researchers and Citizen Scientists: Is Citizen Science Data Worth the Effort? Biol. Conserv. 2017, 208, 127–138. [Google Scholar] [CrossRef]
  71. Locritani, M.; Merlino, S.; Abbate, M. Assessing the Citizen Science Approach as Tool to Increase Awareness on the Marine Litter Problem. Mar. Pollut. Bull. 2019, 140, 320–329. [Google Scholar] [CrossRef]
  72. Bertacchi, A. Dune Habitats of the Migliarino–San Rossore–Massaciuccoli Regional Park (Tuscany–Italy). J. Maps 2017, 13, 322–331. [Google Scholar] [CrossRef]
  73. Bini, M.; Casarosa, N.; Luppichini, M. Exploring the Relationship between River Discharge and Coastal Erosion: An Integrated Approach Applied to the Pisa Coastal Plain (Italy). Remote Sens. 2021, 13, 226. [Google Scholar] [CrossRef]
  74. Merlino, S.; Locritani, M.; Farina, S.; Sorbini, C.; Battaglini, S.; Dellacasa, M.; Scaglia, P.; Marchi, D.; Bonaccorsi, E. Plastic and Us: Looking at the Marine Litter Problem from inside the Rubbish. An Unusual Temporary Exhibition at the Natural History Museum of the University of Pisa. Mediterr. Mar. Sci. 2022, 23, 338–356. [Google Scholar] [CrossRef]
  75. Arcangeli, A.; Crosti, R.; Dodaro, G.; Manghi, G.; Santini, E.; Silvestri, C.; Squitteri, F. Quaderni ISPRA-Ricerca Marina. 19/2024, Roma. 2024; p. 75. Available online: https://www.isprambiente.gov.it/files2024/pubblicazioni/quaderni/quaderno-ispra-ricerca-marina-19-2024.pdf (accessed on 1 May 2025).
  76. Merlino, S.; Locritani, M.; Mioni, E.; Vignali, L. Towards a Greater Integration of Marine Science into School Curricula: Shortening the Distance between Students and Ocean Challenges. J. Ocean Technol. 2019, 14, 43–56. [Google Scholar]
Figure 1. Map of the investigated sites (red lines inside the white square) in the Migliarino, Massaciuccoli, and San Rossore Park areas, located north of the Arno River’s mouth, Italy (green and blue-shaded colored mask indicate the high- and low-protection areas of the park, respectively).
Sustainability 17 05048 g001
Figure 2. Comparison of counts obtained for the categories “MATERIALS” and “SOURCES” (with subdivision into the different types) for the three time replicas (T2, T4, and T6) and for the whole monitored area (data from Table S1 in the Supplementary Materials).
Sustainability 17 05048 g002
Figure 3. Comparison of the counts obtained for the categories “COLORS” and “DIMENSIONAL CLASSES” (with subdivision into the different types) for the three time replicas (T2, T4, and T6) and for the whole monitored area (data from Table S1 in the Supplementary Materials).
Sustainability 17 05048 g003
Figure 4. Total item distribution (number of items/m2) obtained from citizen science data for the north area (upper panels) and south area (lower panel) for the T2, T4, and T6 replicas. The blue line identifies the area surveyed by the UAV.
Sustainability 17 05048 g004
Figure 5. Total plastic item distribution (number of items/m2) obtained from citizen science data for the north area (upper panels) and south area (lower panel) for the T2, T4, and T6 replicas. The blue line identifies the area surveyed by the UAV.
Sustainability 17 05048 g005
Figure 6. Plastic bottle distribution (number of items/m2) obtained from citizen science data for the north area (upper panels) and south area (lower panel) for the T2, T4, and T6 replicas. The blue line identifies the area surveyed by the UAV.
Sustainability 17 05048 g006
Figure 7. Plastic polystyrene distribution (number of items/m2) obtained from citizen science data for the north area (upper panels) and south area (lower panel) for the T2, T4, and T6 replicas. The blue line identifies the area surveyed by the UAV.
Sustainability 17 05048 g007
Figure 8. Distribution of large items (number of items/m2) obtained from citizen science data for the north area (upper panels) and south area (lower panel) for the T2, T4, and T6 replicas. The blue line identifies the area surveyed by the UAV.
Sustainability 17 05048 g008
Figure 9. Some questions related to “General Information Knowledge” (see the complete questionnaire in the Supplementary Materials).
Sustainability 17 05048 g009
Figure 10. Q3 to Q5: questions related to “Perceived Impact”; Q6, Q9, and Q13: questions related to “Perceived Causes” (complete questionnaire in the Supplementary Materials).
Sustainability 17 05048 g010
Figure 11. Q1-post and Q11 (pre and post) (full questionnaire in the Supplementary Materials).
Sustainability 17 05048 g011
Table 1. Total number of digitized areas, operators, and digitized items for the T2, T4, and T6 replicas after the data quality check. Unfortunately, for T4, the results for two sub-areas were absent.
TimeN. AreaN. OperatorN. Items
T28244178
T46183350
T68154913
Disclaimer/Publisher’s Note: The statements, opinions and data contained in all publications are solely those of the individual author(s) and contributor(s) and not of MDPI and/or the editor(s). MDPI and/or the editor(s) disclaim responsibility for any injury to people or property resulting from any ideas, methods, instructions or products referred to in the content.

