1. Introduction
As a vital component of the rural economy, the forestry sector plays a crucial role in supplying resources to a wide range of industries. Beyond its economic contribution, forestry is a strategic focus in China’s efforts to comprehensively promote rural revitalization and achieve common prosperity in the new era. It also serves as an important lever for advancing Chinese-style modernization by aligning ecological sustainability with socio-economic development.
The strategic importance of forestry has been further elevated in recent policy directives. Document No. 1 of the Chinese Central Committee in 2025 explicitly emphasizes the need to accelerate the high-quality development of the forestry sector, identifying it as a key driver for achieving balanced regional development and ecological security within the broader rural revitalization framework.
China’s forestry industry has achieved continuous and substantial growth. The sector has demonstrated improvements in productivity, industrial output, and integration with national and regional development strategies. According to official statistics, by 2024, the total output value of the forestry industry reached CNY 10.17 trillion, while the international trade volume in forest products exceeded USD 180 billion. These achievements have positioned China as the world’s leading producer, trader, and consumer of forest products.
Empirical studies further show that the development of the forestry economy has significantly expanded employment opportunities in rural areas, increased farmers’ incomes, and improved their livelihoods, making it a crucial engine for rural industrial revitalization [
1,
2,
3].
However, alongside these achievements, the forestry sector faces persistent challenges. In the dual context of intensifying global climate change and the pursuit of high-quality economic development, the resilience of the forestry economic system—an essential pillar of ecological security and livelihood protection—has become increasingly critical to sustainable development. Nevertheless, the sector’s long production cycles and its vulnerability to natural disturbances such as climate variability, pest infestations, and wildfires pose serious threats. In addition, the traditional forestry economy is hindered by structural weaknesses, including strong resource dependence, a low-end industrial structure, and limited capacity to manage risks. These factors undermine its ability to respond effectively to an increasingly complex and volatile external environment.
In January 2024, General Secretary Xi Jinping highlighted that the primary goal in the overall development of a modern socialist country is to achieve high-quality development. He further highlighted that fostering NQPFs constitutes a critical pathway toward realizing this development objective. The essence of NQPFs lies in leveraging scientific and technological innovation to drive industrial upgrading, break away from traditional growth models, and facilitate the intelligent and green transformation of conventional industries. This approach aims to foster economic development that is characterized by high quality, high efficiency, and advanced technological content [
4]. Therefore, the emergence of NQPFs—centered on digitalization, green development, and intelligent technologies—offers a new theoretical framework and technical pathway for the transformation and upgrading of the forestry economy.
Integrating the concept of NQPFs with resilience theory offers an expanded interdisciplinary perspective for forestry economic research, addressing the fragmentation often found in traditional analyses across technological, economic, and ecological dimensions. By constructing a coupled coordination model, this integration can help uncover the synergistic interaction mechanisms between NQPFs and the economic resilience of the forestry sector, thereby contributing new insights to the theoretical foundation of sustainable forestry development.
Specifically, by promoting the extension of the forestry industrial chain toward higher value-added segments, NQPFs can facilitate the formation of a diversified resilience structure, thereby enhancing the overall resilience of the forestry economy. Conversely, the development of economic resilience within the forestry sector also exerts a catalytic effect, driving further breakthroughs in forestry-related NQPFs.
Previous studies have either implicitly or partially addressed the development of NQPFs and the resilience of the forestry economy—focusing on themes such as the integration of NQPFs and high-quality forestry development [
5,
6], as well as rural digitalization and forestry economic resilience [
7]. While these works offer valuable insights and references for the present research, none have directly examined the coupling and coordination mechanisms, spatiotemporal evolution patterns, and driving factors underpinning the relationship between NQPFs and forestry economic resilience.
The potential contributions of this study are threefold. First, this study builds upon existing research to construct a coupled coordination model between NQPFs and forestry economic resilience, with the goal of elucidating the dynamic interactions and mutual reinforcement mechanisms between the two systems. Second, this study conducts an analysis of the spatiotemporal evolution patterns of the coordination level between NQPFs and forestry economic resilience. It further provides trend forecasts, offering empirical insights into temporal dynamics and regional disparities. Third, this study identifies and assesses the key drivers influencing the coordinated development of NQPFs and forestry economic resilience. By uncovering regional variations in these influencing factors, the findings provide a basis for targeted policy recommendations aimed at enhancing coordination levels across diverse regional contexts.
2. Literature Review
Existing research in this field primarily focuses on three areas: NQPFs, forestry economic resilience, and the relationship between these two systems.
2.1. NQPFs
Since its introduction in September 2023, the concept of NQPFs—an economic paradigm with distinct Chinese characteristics—has rapidly emerged as a focal point in both academic discourse and policy research. Research closely related to this study primarily focuses on the conceptual connotation, measurement frameworks, and influencing factors of NQPFs.
A growing body of scholarship has extensively explored the concept and theoretical connotation of NQPFs. From the perspective of political economy, Zhou Wen and Xu Lingyun argue that NQPFs are a form of productivity driven by scientific and technological innovation, with an emphasis on achieving breakthroughs in key and disruptive technologies [
4]. According to Jiang Yongmu and Qiao Zhangyuan, the term “new” refers to new factors, new technologies, and new industries; “quality” denotes high quality, multiple dimensions of quality, and integrated (dual) quality; while “productive force” is embodied in five key dimensions: digitalization, collaboration, greenness, marine (“blue”), and openness [
8]. According to Gong Xiaoying and Yan Yujun, NQPFs are composed of three fundamental elementstechnological innovation, environmental sustainability (green), and digital transformation [
9].
With respect to measurement, due to the broad connotation and extensive scope of NQPFs, most existing studies adopt comprehensive indicator systems to assess them, aiming to achieve a more holistic and in-depth evaluation of their development level. Lu Jiang et al. constructed a measurement framework for NQPFs based on three key dimensions: scientific and technological productivity, green productivity, and digital productivity [
10]. Similarly, Han Wenlong et al. proposed an indicator system that captures the core characteristics of NQPFs by incorporating both physical and permeable elements. The physical elements are assessed through indicators related to new types of laborers, means of labor, and objects of labor, while the permeable elements are measured through the integration of new technologies, production organization models, and data-related components. This framework places greater emphasis on the optimal configuration and synergy among various factors of productivity [
11]. Wang Ning et al. developed an indicator system comprising four dimensions: scientific and technological innovation, industrial upgrading, green ecology, and integration and sharing. They argue that this framework places greater emphasis on key drivers such as innovation and industrial transformation, thereby offering a more targeted and dynamic approach to measuring NQPFs [
12]. As the above discussion illustrates, there is currently no universally accepted standard for measuring the level of NQPFs. Existing studies have proposed diverse indicator systems from various disciplinary perspectives, often focusing on provincial or municipal scales [
13]. At the micro level, several scholars have developed enterprise-level index systems to measure NQPFs. For instance, Zheng Chongyuan and Shao Yanhong assessed enterprise-level NQPFs based on three key dimensions: high technology, high efficiency, and high quality [
14].
Meanwhile, the existing literature explores the driving factors of NQPFs from both internal and external dimensions. Zhu Bo and Zeng Lidan (2023) examined how the development of digital finance can enhance regional NQPFs by stimulating entrepreneurial activity and optimizing industrial structure [
15]. Liang Xiaocheng et al. investigated the impact of data factor marketization on firms’ NQPFs and empirically validated the mediating roles of digital technology adoption and resource allocation efficiency at the firm level [
16]. Many scholars have examined the factors influencing NQPFs from multiple dimensions, including economic development level, marketization, industrial structure, institutional environment, and governmental capacity, thereby proposing targeted policy measures for their enhancement [
17,
18].
2.2. Forestry Economic Resilience
The research most closely related to this study primarily focuses on the conceptual framework, measurement systems, and influencing factors of forestry economic resilience.
Resilience in the context of forestry is generally conceptualized in three broad forms: engineering resilience, ecological resilience, and socio-ecological resilience [
19]. Engineering resilience refers to the speed at which a system returns to its pre-disturbance equilibrium state following a shock or perturbation [
20]. Ecological resilience refers to a system’s capacity to absorb disturbances and changes while maintaining its core functions, structure, and feedback over time [
21]. Socio-ecological resilience refers to the capacity of a social-ecological system to absorb or withstand disturbances while largely maintaining its structure and function. It also encompasses the system’s ability to self-organize, learn, and adapt in response to change [
22,
23]. Although the concept of resilience is well established in forest ecology, its application in forestry economics and management remains limited and underdeveloped [
24]. Forestry economic resilience refers to the capacity of the forestry economic system to sustain its core production functions and service delivery in the face of external shocks—such as natural disasters and climate change—by leveraging its inherent abilities of resistance, adaptability, recovery, and transformation. This concept underscores the multidimensional and dynamic adaptive capacity of the forestry economic system in response to external disturbances. It encompasses short-term resistance to shocks, medium-term adaptability to changing environments, the capacity to recover from disruptions, and long-term transformative potential for structural upgrading and innovation [
25,
26,
27].
Existing studies have progressively developed resilience assessment frameworks within fields such as agricultural and regional economics, which have increasingly been adapted to the forestry sector. These frameworks commonly emphasize four key dimensions: resistance, adaptability, recovery, and transformation. Sicheng An et al. developed a forestry economic resilience indicator system based on short-term shocks—using the pressure–state–response (PSR) framework—and long-term disturbances, such as industrial structure and policy intensity [
5]. In contrast, Yali Mu et al. assessed resilience through three dimensions: resistance, adaptive capacity, and transformative ability [
7]. However, a unified and standardized indicator system for evaluating the level of economic resilience in the forestry sector has yet to be established.
Given that forestry possesses both natural and socio-ecological attributes, the level of economic resilience in the sector is influenced not only by natural factors—such as temperature, precipitation, and soil quality—but also by a range of socio-economic variables. These include labor availability, advancements in forestry science and technology, the property rights regime, industrial structure, human capital development, and policy support, among others [
28,
29,
30,
31]. Therefore, the level of economic resilience in the forestry sector reflects the combined influence of both natural environmental conditions and socio-economic factors.
2.3. Exploring the Relationship Between NQPFs and Forestry Economic Resilience
Although the existing literature has not explicitly examined the interaction between NQPFs and the economic resilience of the forestry sector, it has explored the mechanisms underlying the relationship between NQPFs and high-quality economic development. These studies highlight the dual role of NQPFs in fostering high-quality development and, conversely, the role of high-quality development in catalyzing and shaping the evolution of NQPFs [
32,
33,
34]. Specifically with regard to resilience, existing studies have primarily focused on the unidirectional impact of NQPFs on various dimensions of resilience—such as economic resilience [
35], industrial chain resilience [
36], and supply chain resilience [
37]. In contrast, limited attention has been paid to the reciprocal influence, particularly the driving and guiding role of economic resilience in shaping NQPFs, as well as the dynamic interactions between these two systems.
A review of the existing literature reveals that most studies predominantly focus on the independent analysis of either the development level of NQPFs or the resilience of the forestry economy. However, there remains a notable gap in the quantitative evaluation of the coupled and synergistic relationship between these two systems. NQPFs serve as a critical driver of high-quality development in the forestry sector while enhancing the resilience of the forestry economy constitutes an essential prerequisite for achieving such development. Therefore, investigating the coupling and coordination relationship (CCR) between NQPFs and forestry economic resilience is both necessary and urgent. From a disciplinary standpoint, examining the spatiotemporal coupling and synergistic evolution between NQPFs and forestry economic resilience—through both geographic and economic lenses—holds significant value for deepening our understanding of the interactive dynamics and mutual influences between the two systems.
In light of the above, this study undertakes a comprehensive analysis of the coupled and coordinated relationship between new quality productive forces and forestry economic resilience across 30 provinces in mainland China over the period from 2012 to 2022, with the aim of uncovering the dynamic interactions and spatiotemporal patterns between these two key systems. First, building upon prior research, this study selects representative indicators to construct comprehensive evaluation index systems for both new quality productive forces and forestry economic resilience. The entropy method is employed to calculate the development levels of both systems, followed by the application of a coupling coordination degree (CCD) model to assess the extent of their coordinated development. Subsequently, a combination of time series analysis, traditional and spatial Kernel density estimation, Gini coefficient analysis, spatial Markov chains, and geographical detector models is employed to investigate the spatiotemporal evolution, multidimensional dynamic processes, and key influencing factors of both systems.
This study seeks to make the following marginal contribution: it endeavors to construct a theoretical framework for the coupled synergy between NQPFs and forestry economic resilience, thereby providing a conceptual foundation and theoretical reference for future research in related fields. By employing the CCD model and GIS-based spatial analysis, this study examines the spatiotemporal patterns and regional disparities in the CCR between NQPFs and forestry economic resilience. This provides novel insights into the identification of developmental heterogeneity among different regions. Conditional Kernel density estimation and spatial Markov chain methods are employed to analyze the dynamic evolution patterns and long-term transition trends of the CCR between NQPFs and forestry economic resilience. The use of geographical detectors to explore influencing factors is intended to provide a scientific foundation for government agencies in formulating targeted and effective policy interventions.
3. Mechanisms for Coupling and Coordinating NQPFs and Forestry Economic Resilience
NQPFs represent a crucial mechanism for enhancing the resilience of the forestry economy. In turn, improvements in forestry economic resilience foster the development of NQPFs. This reciprocal relationship integrates the concept of NQPFs into the forestry economic development process, thereby promoting the continuous enhancement of forestry economic resilience. The positive synergy arising from the mutual reinforcement of these two elements plays a significant role in the advancement of the forestry sector. However, the interplay among various subjective and objective factors creates several challenges for the interaction between new productivity and forestry economic resilience. This may lead to an antagonistic relationship between them, resulting in insufficient resistance and adaptability of the forestry economy, inadequate management practices, and other related problems [
38,
39], all of which hinder high-quality development. As the development of NQPFs and the forestry economy deepens and their integration intensifies, the relationship between NQPFs and forestry economic resilience is expected to strengthen, ultimately leading to a positive and mutually reinforcing interaction. Therefore, this study conceptualizes the interaction between NQPFs and the resilience of the forestry economy as an open complex system in which both subsystems mutually enhance, empower, and collaborate with each other (
Figure 1).
NQPFs play a crucial role in improving the robustness of the forestry economy, serving as both a key driving force and a fundamental guarantee for its improvement. First, by leveraging advanced technologies and management practices, new workforce members can utilize big data and artificial intelligence to optimize forestry resource management, monitor the health of forest ecosystems in real time, and provide early warnings for pests, diseases, and natural disasters, thereby enhancing the intrinsic stability of the forestry system. Second, through continuous learning and scientific and technological innovation, the new workforce can drive the evolution and enhancement of the forestry production model, design and implement sustainable forest management programs, and advance the research, development, and application of forestry technologies, thereby enhancing the adaptive capacity of the forestry economy. Furthermore, workers with interdisciplinary backgrounds can effectively integrate information technology with forestry production, foster the development of the secondary and tertiary forestry industries, optimize the structure of the forestry sector, and enhance the added value of the economy. Additionally, the involvement of new workers in policy formulation and implementation can enhance the forestry investment and labor transfer system, thereby providing institutional support for transforming the forestry economy. For new quality workers, the diversity and high quality of labor inputs can strengthen the forestry economy’s resilience to risks. For example, introducing high-quality seedlings can enhance the stability and productivity of forest ecosystems, thereby bolstering the overall resilience of the forestry economy [
40]. Third, the resilience and stability of forest ecosystems can be strengthened by promoting ecological restoration techniques and sustainable management practices, thereby enhancing the ecological resilience of forestry economies. Finally, by developing a range of high-value-added products, such as an understory economy and carbon sink products, the growth potential of the forestry economy can be expanded, thus promoting its structural transformation and overall resilience. The application of new quality labor resources provides essential tools and mechanisms for enhancing the economic resilience of the forestry sector. First, the application of digital machinery and information technology in forestry can reduce labor costs and production risks, facilitate real-time monitoring and precise management of forestry resources, and enhance the stability and efficiency of forestry production [
41]. Second, energy-efficient and environmentally friendly forestry machinery can mitigate the negative environmental impact of forestry production, thereby enhancing the resilience and stability of forest ecosystems. The digital management of new quality labor materials can facilitate the synergistic development of the digital economy and forestry industry chain, thereby enhancing the market adaptability of the forestry economy [
42].
Forestry economic resilience serves as a solid foundation and catalyst for the advancement of NQPFs by enhancing resistance, adaptability, and transformative capacity. Resistance capacity provides the foundation the forestry economy requires to withstand short-term shocks and external pressures, and its enhancement establishes a stable environment conducive to NQPF development. Adaptation capacity is crucial for the resilience of the forestry economy to long-term changes and complex environments, and its enhancement provides the flexibility and innovation necessary for NQPF development. Change capacity is the driving force behind the resilience of the forestry economy, enabling innovation-driven high-quality development. It offers the strategic support and institutional frameworks essential for the advancement of new productivity. Specifically, strengthening the resilience of the forestry economy requires the active contribution of new quality workers equipped with advanced technologies, management expertise, and a strong capacity for innovation and adaptability. These new quality workers can develop a diverse range of new quality labor resources such as innovative timber products, forest food, bio-energy, and under-forest economy products. They can leverage digital technologies and infrastructure to enhance the development and utilization of forestry economic products, thereby upgrading the structure of the forestry economy, driving high-quality development, and contributing to the construction of a strong forestry sector. This process enhances the resilience, adaptability, and capacity for change within the forestry sector, thereby promoting the high-quality development of the forestry economy and contributing to the establishment of a robust forestry nation. Thus, enhancing the resilience of the forestry economy can drive the development of NQPFs across various dimensions including talent, technology, systems, management, and infrastructure [
43,
44].
In conclusion, the CCR between NQPFs and forestry economic resilience constitutes a multilevel, multidimensional, and dynamic process. This process not only enhances the forestry economy’s resilience to risks and market competitiveness but also fosters its sustainable and high-quality development, providing critical support for the attainment of the ‘dual carbon’ objectives and the strategy for rural revitalization.
4. Methods and Data Sources
4.1. Building the Indicator System
This study focuses on the connotations of China’s NQPFs and forestry economic resilience, as well as their coupling and coordination mechanisms. It draws on existing academic research on indicator systems for NQPFs and forestry economic resilience [
45] and adheres to principles such as scientific rigor and representativeness in designing indicators. Based on these principles, an indicator system for NQPFs and forestry economic resilience is developed (
Table 1). NQPFs represent a comprehensive enhancement and innovative development of the labor force, objects, and means within the framework of Marxian economics, adapted to the new conditions of economic and social development. Building on the research by Jue Wang and Rongji Wang [
46], we construct an evaluation index system based on three key dimensions: new quality labor force, new quality labor objects, and new quality means of production (
Table 1). Additionally, we apply the entropy method to compute a comprehensive index of digital NQPFs. Furthermore, referring to Yali Mu and Fanbin Kong et al. [
7], we develop an index system to assess the level of economic resilience in the forestry economy, focusing on three dimensions: resistance, adaptive capacity, and the ability to change (
Table 2).
4.2. Research Methodology
4.2.1. Entropy Weight Method
The entropy weight method represents an objective approach that effectively reflects the fundamental characteristics of NQPFs and forestry economic resilience. This method is employed to compute the thorough assessment values of both NQPFs and forestry economic resilience. Because the units of each indicator are not identical, it is necessary to first standardize the data, then determine the weight assigned to each indicator, and finally determine the comprehensive evaluation value. The specific steps are as follows:
(1) Standardize the data to mitigate the impact of variations in the scale of the indicators, among other factors, on the outcomes. Address the positive and negative indicators independently as follows:
(2) Calculate the percentage of the value of the
-th indicator in year
:
(3) Calculate the information entropy of the
-th indicator:
, and then we have ; when , let .
(4) Calculate the information entropy redundancy as follows:
(5) Determine the indicator weights as follows:
where
and
denote the results of normalizing the value of the
-th indicator in year
and the original value, respectively;
indicate the maximum and minimum values of the
-th indicator for all years, respectively;
is the total number of years measured;
is the number of indicators used for measurement;
represents the share of indicator
in year
in the sum of indicator
in year
;
denotes the information entropy redundancy (coefficient of variation) of the jth indicator;
indicates the value of the
-th indicator weight; and
is the composite assessment value.
4.2.2. Modelling the Degree and Classifying the Type of Coupling Coordination
The coupling coordination degree (CCD) model (D) effectively captures the CCD among systems. The formula for calculating the CCD and relative development between NQPFs and forestry economic resilience is as follows:
where
and
represent the levels of NQPFs and forestry economic resilience, respectively; C denotes the degree of coupling; D represents the degree of coordination; T represents the comprehensive evaluation index; and the coefficients
α and
β are to be determined. Given the current state of development, this study assumes that the two subsystems contribute equally to the coordinated development process, adhering to the principle of impartiality and avoiding potential biases arising from subjective weighting, assigning both a value of 0.5.
Table 3 presents the specific criteria for classifying coupling and coordination degrees based on prior research [
47].
4.2.3. Dagum Gini Coefficient
This research utilizes the Dagum Gini coefficient along with its decomposition methodology to evaluate the extent and origins of spatial disparities among urban areas in China. This methodology is employed to examine the comprehensive differences, intra-regional variations, inter-regional disparities, and contribution rates to the CCD. The specific formulas are as follows [
48]:
In this context, G represents the overall Gini coefficient, k denotes the total number of regions, and nj (nh) indicates the number of provinces in region j(h). yji (yhr) denotes the CCD of any province in region j(h) and y is the mean. j,h = 1, 2, 3, ..., k; i,r = 1, 2, 3, ..., nj (nh ); Pj = nj/n; and Sj = njyj/ny. Gjj denotes the intra-regional Gini coefficient, while Djh signifies the interaction of the CCD values across regions. Additionally, djh quantifies the disparity of values between regions, and pjh indicates the hypervariable first-order moments. Fj (Fh) denotes the cumulative distribution function of the CCD values for region j(h), Gjh signifies the inter-regional Gini coefficient, Gw indicates the intra-regional variation, Gnb refers to the inter-regional variation, and Gt is the hypervariable density.
4.2.4. Kernel Density Estimation
Kernel density estimation represents a nonparametric approach employed to estimate the probability density function of a random variable [
49]. In this study, Kernel density estimation is employed to analyze the distribution patterns and trends of the CCD between NQPFs and forestry economic resilience across China. By utilizing Kernel density estimation, this methodology offers a more comprehensive insight into the spatial distribution and temporal evolution of the degree of coupled coordination. The traditional formula for calculating Kernel density is as follows:
where
n represents the number of observed samples,
h denotes the bandwidth,
X refers to the set of observations,
x is the mean of these observations, and
K(·) indicates the Gaussian Kernel function.
Conditional Kernel density estimation integrates spatial attributes into the conventional Kernel density methodology, facilitating a more accurate representation of spatial dynamics in the distribution of the CCD between NQPFs and forestry economic resilience. The formula is as follows:
where
g(
y|
x) represents the Kernel density under spatial conditions, and
f(
x,
y) denotes the joint probability density of
x and
y.
4.2.5. Markov Chains
(1) Traditional Markov Chains
A Markov chain represents a stochastic process characterized by its discrete nature in both time and state, enabling it to model the dynamics of changes in the relative positions of the CCD across different research units, as well as the likelihood of state transitions. In this process, the system is categorized into
n distinct states, with the evolution of each state governed by the transition probabilities. These probabilities are encapsulated in an
n ×
n matrix, in which each element represents the probability of transferring from time
m type
i to
j [
50]. It is calculated by the following formula:
where
and
represent the probability distributions at different time points, and
Ms denotes the
Sth power of the transition probability matrix
M.
(2) Spatial Markov Chains
The traditional Markov process does not incorporate spatial factors. Introducing the concept of ‘spatial lag’ into the standard Markov analysis allows for a more comprehensive understanding of the spatial interactions between the changes occurring in a specific spatial unit and those in adjacent units as well as the potential spillover effects. The corresponding formula is as follows:
where
lagi represents the spatial lag operator,
xi is the observed value of the variable under study, and
wij denotes the weight associated with the spatial lag operator.
4.3. Data Sources
Owing to data availability constraints, this study analyses the CCD between NQPFs and forestry economic resilience across 30 provinces in China (excluding Tibet, Hong Kong, Macau, and Taiwan due to incomplete data) from 2012 to 2022. The data used in this study were primarily sourced from the 2012–2023 China Statistical Yearbook, China Forestry and Grassland Statistical Yearbook, China Environmental Statistical Yearbook, China Rural Statistical Yearbook, and the official website of the National Forestry and Grassland Administration. Additional data were obtained from the statistical yearbooks and national economic and social development bulletins of individual provinces and regions. Linear interpolation is employed for missing data points to estimate and fill in the gaps.
5. Spatiotemporal CCR Between NQPFs and Forest Economic Resilience
5.1. Temporal Evolution
Using the entropy weighting method, this study measures the indicator weights and comprehensive development levels of China’s NQPFs and forestry economic resilience from 2012 to 2022 and conducts a sensitivity analysis. The results indicate that the variations in the weights of the NQPF indicators were below 1.2%, while those of the forestry economic resilience indicators were below 1.1%. These minimal fluctuations confirm the robustness of the entropy weighting method and the rationality of the indicator system design. The results demonstrate the robustness of the entropy weighting method and validate the rationality of the constructed indicator system. Subsequently, the coupling coordination index of the NQPFs and forestry economic resilience is derived using the CCD model (
Figure 2). At the national level, the CCD between NQPFs and forestry economic resilience demonstrates a consistent upward trajectory throughout the study period, evolving from severe dysfunction to high-quality coordination. However, the value of the high-quality coordination index remains relatively low, indicating significant potential for future improvement. The evolution of the coupling coordination stage identifies 2018 as a pivotal turning point. This period included a rapid reduction in severe dysfunction, the emergence of high-quality coordination, and a predominance of primary and good coordination. The observed changes are likely attributable to the optimization and reform of China’s forestry and grassland management institutions in 2018, including the establishment of the State Forestry and Grassland Administration and the addition of a national parks management bureau under the Ministry of Natural Resources. Furthermore, the initiation of large-scale land greening operations, the introduction of new pilot large-scale forestry farms, and continued optimization of the forestry industry structure, particularly the expansion of the tertiary sector with forest ecotourism emerging as a new driver of forestry economic growth, contributed to these developments. However, the deepening of supply side structural reforms, the rapid advancement of scientific and technological innovation and its application, the integration of the digital economy into forestry development, and the effective construction of an ecological civilization have all contributed to the continuous optimization of both systems. These factors play crucial roles in enhancing the CCD between systems. Notably, in 2020, despite the impact of public health emergencies, the CCD between the two systems continued to improve rather than decline. This could be partly attributable to the significant increase in demand for and interest in forest ecotourism, forest recreation, and other health-related tourism activities during the health crisis.
China’s National Bureau of Statistics (NBS) and the State Council have categorized the country into four major regions—eastern, central, western, and northeastern—based on criteria such as economic development level, geographic location, and national strategic planning. In this study, the regional classification follows the standards of the National Bureau of Statistics. Specifically, the eastern region comprises ten provinces and municipalities: Beijing, Tianjin, Hebei, Shandong, Jiangsu, Shanghai, Zhejiang, Fujian, Guangdong, and Hainan. The central region includes six provinces: Shanxi, Anhui, Jiangxi, Henan, Hubei, and Hunan. The western region consists of eleven provinces and autonomous regions: Inner Mongolia, Guangxi, Chongqing, Sichuan, Guizhou, Yunnan, Shaanxi, Gansu, Qinghai, Ningxia, and Xinjiang. The northeastern region comprises three provinces: Liaoning, Jilin, and Heilongjiang. At the regional level, the progression of the CCR between NQPFs and forestry economic resilience across the four major regions largely follows a similar trajectory, with steady increases in most years. However, both the northeastern and western regions experienced a slight decline in 2019. The average CCD across the four regions showed distinct regional variations: east (0.621) > central (0.605) > northeast (0.546) > west (0.516). Specifically, the CCD in the eastern region steadily increased from 0.519 in 2012 to 0.709 in 2022, with a prolonged period of stability during the transition from the primary coordination stage to the good coordination stage. This progress can be attributed to the eastern region’s advantages in geographic location, economic strength, scientific and technological innovation, industrial structure, human resources, policy support, and openness to global markets.
The CCD has shown an increase from 0.501 in 2012 to 0.691 in 2022, exhibiting a development trend parallel to that of the eastern region. This can be primarily attributed to the ability of the central region to effectively learn from and adopt the advanced technology and management practices of the eastern region. By doing so, the central region has optimized its resource allocation and industrial structure, which has helped increase its CCD. The CCD in the northeastern and western regions increased from 0.482 and 0.394 in 2012 to 0.602 and 0.601 in 2022, respectively. Notably, the western region experienced rapid improvement from 2012 to 2018, advancing from serious dislocation to primary coordination. Since 2018, the CCDs of the two regions have nearly aligned, and both are now in a well-coordinated stage. This phenomenon can be largely attributed to the initial constraints faced by the northeastern and western regions, including strict forest protection mandates, limited economic capacity, and geographical disadvantages, collectively hindering the formation of a higher CCD. However, with the gradual intensification of the eastern region’s support for the western region and the strategic revitalization of the northeastern region in the new era, significant progress has been made. These developments have facilitated the optimization of industrial structures and the strengthening of economic foundations in both regions, thereby contributing to the sustained improvement in their CCDs.
5.2. Spatial Distribution Analysis
To further examine the spatial distribution of the CCR between NQPFs and forestry economic resilience in China, 2012, 2015, 2019, and 2022 are selected as representative time nodes. The spatial patterns are visualized and analyzed using ArcGIS 10.8 software. As demonstrated in
Figure 3, the overall CCD displayed an upward trajectory throughout the study period, transitioning from predominantly primary to good coordination. Spatially, a distinct pattern of ‘high in the east and low in the west’ can be observed, indicating significant regional disparities in synergistic development.
Specifically, in 2012, the overall CCD between the two systems was relatively low, with most provinces, accounting for approximately 90% of the research units, falling into either the severe dysfunction or primary coordination category. Only Guangdong, Zhejiang, and Jiangsu had reached the well-coordinated stage. These provinces, located in the economically advanced eastern and southern coastal regions, are characterized by higher levels of NQPFs, stronger economic resilience within the forestry sector, and correspondingly higher degrees of coupling coordination. By 2015, the overall CCD between the two systems had improved, with primary coordination emerging as the dominant category, encompassing 70% of the study units. The areas exhibiting primary coordination expanded in the Xinjiang, Guizhou, and Hainan provinces, while the regions demonstrating good coordination grew in the Shandong and Fujian provinces. Initially, regions with higher coupling coordination degrees exerted a certain radiating effect on neighboring provinces, although the driving force remained relatively weak. By 2019, the CCD of the two systems had significantly improved, with the spatial pattern of ‘high in the south and low in the north’ becoming more pronounced. None of the regions experienced severe dysfunction, with 40% of the study units in the primary coordination stage and 56.7% in the good coordination stage. By 2022, the CCD between the two systems showed further improvement. The Inner Mongolia Autonomous Region and Liaoning province had transitioned to the well-coordinated category, along with the Jiangsu and Zhejiang provinces. Thus, the proportion of areas in the well-coordinated stage reached 73.4%.
5.3. Regional Heterogeneity in the CCR Between NQPFs and Forestry Economic Resilience
Regional disparities in the CCD between NQPFs and forestry economic resilience were assessed using the Dagum Gini coefficient decomposition method. The results are presented in
Table 4 and
Figure 4.
First, considering both overall and intra-regional disparities, the evolution of the Gini coefficient from 2012 to 2022 reveals an initial decline, subsequently followed by a rebound. This pattern indicates that the regional imbalance first decreased and then gradually increased. This shift may be attributable to the significant challenges posed by public health emergencies in 2020, which tested the development of NQPFs and forestry economic resilience. The Gini coefficient was lower in 2022 than in 2012, indicating a gradual narrowing of the overall differences in the CCD of NQPFs and forestry economic resilience. This imbalance diminished over time, suggesting that the overall disparity in the CCD of NQPFs and forestry economic resilience gradually decreased, driven by advancements in productivity and improvements in production relations. A comparison of the four major regions reveals significant gradation in the intra-regional differences in the CCD. The annual average intra-regional Gini coefficient is the highest in the eastern region (0.124), followed by the western (0.091) and central regions (0.038), with the northeastern region exhibiting the lowest value (0.013). This suggests that intra-regional coordination disparities are most pronounced in the east, followed by the west, whereas the central and northeastern regions exhibit relatively smaller differences.
Second, inter-regional differences are illustrated in
Figure 4b, which presents the variations in the CCD across regions. While the central–western and eastern–northeastern regions exhibit a gradual increase, all other regions demonstrate a fluctuating downward trend. Notably, the Gini coefficient in the eastern–western region declines at the fastest rate, indicating that the spatial disparities between the central–western and eastern–northeastern regions are progressively widening. The trend towards spatial balance in other regions has been increasing, reflecting the positive outcomes of China’s long-term implementation of its coordinated regional development strategy. Regarding the magnitude of inter-regional differences, the top three annual average inter-regional Gini coefficients are east–northeast (0.121), east–west (0.147), and east–central (0.101), whereas the lowest three are central–west (0.095), northeast–west (0.071), and northeast–central (0.060). These findings indicate that inter-regional differences in CCR are primarily driven by significant disparities between the eastern and northeastern, eastern and western, and eastern and central regions.
Finally, concerning the origins and factors influencing regional diversity,
Table 3 shows that, in terms of contribution size, the annual average contribution of inter-regional differences (0.414) is higher than that of intra-regional differences (0.260) and hypervariable density (0.327). Consequently, subsequent endeavors ought to concentrate on addressing spatial imbalances in the CCR of NQPFs and forestry economic resilience in China, with a concerted effort to reduce inter-regional disparities and intra-regional imbalances.
6. Multidimensional Dynamic Evolutionary Trends and Influencing Factors in the CCR of NQPFs and Forestry Economic Resilience
Probability density curves are generated for the CCDs of 30 provinces using Kernel density estimation to further explore the dynamic evolution of the CCR between NQPFs and forestry economic resilience in China. Subsequently, the temporal, spatial, and dynamic distribution characteristics of the CCR between these two major systems are analyzed. In addition, Markov chains are employed to calculate the probability of transitions between different coordination degrees across various regions.
6.1. Multidimensional Dynamic Evolutionary Trends
6.1.1. Traditional Kernel Density Estimation
The Kernel density curve of the CCR level between NQPFs and forestry economic resilience in China from 2012 to 2022 was plotted using Matlab 2024a software. The analysis primarily focuses on the distribution, developmental trends, horizontal extensibility, and vertical polarization of the Kernel density curve to reveal the dynamic evolution characteristics of the CCD.
Figure 5 presents the results. First, the center of the Kernel density function consistently shifts to the right throughout the study period, indicating an overall increase in the CCD. Second, the peak height of the Kernel density curve initially decreases and then increases, suggesting that the overall disparity in the CCDs first narrows and subsequently widens. The slight broadening of the curve width indicates a gradual expansion in the absolute differences in regional CCR.
The long left-skewed tail in the overall Kernel density plot indicates that a considerable number of regions maintain a comparatively low CCD. Third, the emergence of bimodal patterns within the overall distribution curve in certain years suggests a divergence in CCDs, reflecting persistent spatial disparities and a relatively stable pattern of regional imbalance.
6.1.2. Conditional Kernel Density Estimation
Traditional Kernel density estimation fails to effectively account for spatial effects, whereas conditional Kernel density estimation offers the advantage of simultaneously capturing spatial and temporal dynamics.
Figure 6 present the Kernel density estimations and corresponding contour plots of the CCD between China’s NQPFs and high-quality development of the forestry economy under three conditions: unconditional, spatially static, and spatially dynamic. In the Kernel density plots, the X- and Y-axes denote the CCDs, whereas the Z-axis indicates the density (i.e., the probability) associated with each point on the X–Y plane. In the Kernel density contour plots, the X- and Y-axes represent the CCDs. The contour lines denote different density levels, with values increasing towards the center, indicating a higher probability density. A greater concentration of contour lines reflects a steeper gradient, corresponding to sharper peaks on the Kernel density surface.
(1) Unconditional Kernel Density Estimation: In both the Kernel density plot and the corresponding contour map, a positive 45° diagonal line is used as a reference to indicate the evolutionary trajectory of the coupling coordination relationship level between NQPFs and forestry economic resilience in China. This diagonal serves as a benchmark for assessing modifications in the allocation and progression of coordination over time. In the unconditional Kernel density estimation, the X-axis denotes the CCD of each province in year
t, whereas the Y-axis denotes the corresponding level in year
t+3. This setup facilitates the observation of temporal transitions and the overall evolutionary trajectory of CDR across provinces over time. If the probability mass is concentrated along the positive 45° diagonal, it indicates that the CCD remains relatively stable between years
t and
t+3, with no significant temporal shifts observed. If the probability mass is concentrated along the negative 45° diagonal, it suggests a significant shift in the CCD between years
t and year
t+3, with provinces that previously exhibited high CCD transitioning to lower levels. If the probability mass is concentrated around a specific value on the Y-axis and runs parallel to the X-axis, it indicates convergence in the CCDs. This suggests that, regardless of the CCD of each province in year
t, all provinces will reach the same level in year
t+3. As shown in
Figure 6, when the CCD of a region in year
t is below 0.3, the Kernel density contours are nearly parallel to the X-axis, indicating that the CCD will converge around 0.3–0.4 by year
t+3. In contrast, when the CCD in year
t exceeds 0.3, the Kernel density contours are positioned above the positive 45° diagonal, suggesting that the CCD will show a stable growth trend from year
t to year
t+3, with minimal fluctuations and a reduced likelihood of significant changes. Furthermore, several wave peaks are observed above the positive 45° diagonal, with the primary peaks distributed along the X-axis at 0.4, 0.5, 0.6, 0.7, 0.8, and 0.9. These wave peaks are all above the diagonal, indicating a consistent growth trend in the coupling coordination degrees across these intervals. The CCDs of the NQPFs and forestry economic resilience are generally above 0.3. At this stage, the CCDs in China are trending towards stable improvement. However, significant regional disparities persist, with notable variations in certain areas.
(2) Spatial Static Kernel Density Estimation:
Figure 7 illustrates the evolutionary trend of the CCD in a given province influenced by the CCDs of neighboring provinces. The X-axis represents the CCD of neighboring provinces in year
t, the Y-axis represents the CCD of the province in year t, and the Z-axis denotes the probability of Y, given condition X. When the X-axis is below 0.3, the probability mass converges between 0.3 and 0.43, indicating that spatial spillover has minimal influence on the CCD of a province when the CCDs of its neighboring provinces are low. Instead, it stabilizes within the 0.3 to 0.43 range. When the X-axis value ranges between 0.43 and 0.9, the probability mass is predominantly concentrated near the positive 45° diagonal, indicating a positive spatial correlation characterized by low–low and medium-high–medium-high clusters. When the X-axis value exceeds 0.9, the probability mass is located below the positive 45° diagonal and remains parallel to the X-axis near y = 0.52. This suggests that when a province’s CCD reaches a certain threshold, it becomes difficult to increase it further through spatial spillover effects, even if neighboring provinces exhibit higher levels. At this stage, the CCD can only be increased further through mechanisms such as technological innovation, increased productivity, and the upgrading of the forestry industry structure, which would enable leapfrog development in the CCD.
(3) Spatial Dynamic Kernel Density Estimation: This study further investigates the dynamic influence of neighboring provinces on the future development of CCR in a given province, considering both spatial conditions and temporal span. In
Figure 8, the X-axis represents the CCD of neighboring provinces in year t, while the Y-axis represents the CCD of the focal province in year t+3. The distribution characteristics of the probability mass under spatial dynamic conditions are similar to those observed under spatial static conditions, suggesting that the CCD of NQPFs and forestry economic resilience in China exhibits spatial persistence. Specifically, the CCD of a neighboring province in year t is not only spatially positively correlated with the CCD of the focal province in year t but also persists into year t+3. However, when the CCD of neighboring provinces in year t exceeds 0.8, the probability mass becomes parallel to the X-axis, with a distribution position almost identical to that under the static spatial condition. This indicates that the correlation between neighboring provinces with a CCD higher than 0.8 and the focal province, with a three-year lag, weakens. These findings suggest that the time factor does not significantly contribute to the upward shift of the focal province’s CCD compared to neighboring provinces with higher levels. Thus, temporal factors do not significantly contribute to the upward shift in the focal province’s CCD compared to neighboring provinces with higher levels.
For neighboring provinces with medium and low CCD, a longer time span contributes to an upward shift in their respective CCDs.
6.2. Predictive Analysis
Using Kernel density estimation to analyze the dynamic evolution of the CCD between NQPFs and forestry economic resilience in China relies on the assumption of continuous probability density. However, this method does not effectively capture the dynamic changes in the relative positions of provinces’ CCDs or the probability of state transitions. Thus, Kernel density estimation fails to reflect whether a province’s CCD increases, decreases, or remains unchanged. In contrast, the Markov chain approach, which is based on discrete quantification, reveals the probability of transitions at the CCD to different states. This method complements the findings obtained using Kernel density estimation by providing a broader perspective on the dynamic evolution of the system. In this study, based on the principles of Markov chain analysis, the quartile method is used to classify coupling coordination degrees into four categories: low-value (below 25%), medium-value (26–50%), medium-high-value (51–75%), and high-value (above 75%) areas. By comparing and analyzing the changes in the traditional Markov chain transfer probability matrix (
Table 5) and spatial Markov chain transfer probability matrix (
Table 6), we further explore the spatiotemporal dynamics of the transfer process and the patterns governing the CCD between NQPFs and the economic resilience of forestry in China.
As shown in
Table 4, the probabilities along the main diagonal (0.845) in the transfer probability matrix are significantly higher than those in other positions, with the maximum value on the off-diagonal being only 0.241. This suggests that when spatial factors are not considered, the CCD between NQPFs and forestry economic resilience in China exhibits high stability, low mobility, and strong persistence. Thus, different types of provincial units will find it difficult to experience significant shifts in their hierarchical status. These results are consistent with those obtained from the unconditional Kernel density estimation. The probability values on the right side of the off-diagonal are higher than those on the left side, indicating that the likelihood of an upward shift in the CCD is greater than that of a downward shift. This suggests that the CCD of China’s NQPFs and forestry economic resilience was more likely to continue increasing during the study period, which aligns with the previous analysis. Overall, the probabilities of maintaining the same level after one year for the four types of provinces are 0.813, 0.759, 0.808, and 1, respectively. These values are higher than the probabilities of upward or downward transitions, indicating a ‘higher remains higher and lower remains lower’ phenomenon in the continuous transition of the CCD. These results indicate that the CCD of NQPFs and forestry economic resilience in China is unlikely to experience rapid fluctuations, either decreases or increases, over a short period. Cross-level transfer in the CCD of NQPFs and forestry economic resilience is possible; however, the probability of transfer between neighboring levels is higher. For example, the probability of transferring from a low level to a medium-low level is 0.175, which is greater than the probability of transferring to a medium-high level (0.013) or a high level (0). This suggests that increasing the CCD between the two systems is a gradual process, making cross-type transfers less likely.
Conventional Markov chains consider only the evolutionary trends along the time dimension. However, the ‘first law of geography’ posits that the closer the spatial distance between entities, the stronger their relationship. Therefore, incorporating the ‘spatial lag’ term into the Markov chain model may provide a more accurate explanation of the coordination degree between NQPFs and forestry economic resilience in China.
Table 5 reveals several findings. First, the CCD between NQPFs and forestry economic resilience shows a clear spillover effect. Provinces with different neighboring types exhibit distinct probability transfer characteristics, thus demonstrating a certain level of spatial dependence. Second, the transfer probability along the diagonal is notably higher than that on the off-diagonal, with the leading elements consistently larger than the intermediate ones. This suggests that the ‘Matthew effect’ has been amplified under the influence of spatial spillover, and a ‘path-dependent’ development trend persists. Third, the higher probability values of the diagonal remain concentrated near the periphery of the diagonal, indicating that the transfer of CCDs primarily occurs between neighboring provinces and regions. Consequently, significant ‘leapfrogging’ transfers remain rare. Fourth, the impact of the same lag type on probability transfers at different levels varies. When neighboring low-level provinces, the probability of an upward transfer of one level decreases, with values of 0.172, 0.143, and 0 for the low, medium-low, and medium-high levels, respectively. In contrast, when neighboring high-level provinces, the probabilities of upward transfer for low, medium-low, and medium-high levels are 0.143, 0.250, and 0.267, respectively, exhibiting an increasing trend. This suggests that the transfer probability is influenced by the lag type, and achieving a ‘jump’ transfer remains difficult. Furthermore, as the CCD of neighboring provinces increases, the probability of upward transfer tends to increase accordingly.
6.3. Analysis of Influencing Factors
6.3.1. Selection of Influencing Factors
To investigate the influencing factors underlying the spatiotemporal divergence in the CCR between China’s NQPFs and forestry economic resilience, this study draws upon established research frameworks [
51,
52,
53]. Accordingly, the following indicators are selected to represent key dimensions affecting the two systems: (1) per capita regional gross domestic product (GDP), reflecting the level of economic development; (2) ratio of total imports and exports to regional GDP, capturing the degree of openness; (3) Fan Gang Marketization Index [
54], indicating the level of marketization; (4) proportion of social security and employment expenditure in the general public budget, representing the level of social security; (5) ratio of regional general public budget revenue to GDP, reflecting the degree of government intervention; (6) Digital Economy Index [
55], measuring the development of the digital economy; (7) proportion of college students enrolled relative to the year-end resident population, serving as a proxy for human capital level; and (8) ratio of keywords related to new digital infrastructure in provincial government work reports to total word count, indicating the intensity of digital infrastructure development. The values of the selected influencing factors were classified into five categorical levels using the natural breaks (Jenks) classification method, which optimally partitions data by minimizing intra-class variance and maximizing inter-class variance. Geographic detectors were utilized to assess the explanatory power of each factor on the spatial heterogeneity of coupling coordination levels, as well as to evaluate the interactive effects among multiple factors. The data pertaining to the influencing factors were primarily obtained from the China Statistical Yearbook and the respective provincial statistical yearbooks.
6.3.2. Results of Single-Factor Detection
Table 6 presents the results of the geographic detector analysis on the influencing factors of the coupled coordination between NQPFs and forestry economic resilience for the full sample in 2022. As shown in
Table 7, with the exception of government intervention (X5) and human capital (X7), all other factors exhibit significant explanatory power regarding the provincial-level coupling coordination degree. Among them, the top three factors—digital economy development (X6), marketization level (X3), and social security level (X4)—demonstrate the highest explanatory strength, each with a q-value exceeding 0.2. Notably, digital economy development and marketization level emerge as the dominant drivers of coupling coordination. Following these are the degree of openness (X2), digital infrastructure level (X8), and economic development level (X1), which also contribute meaningfully to the spatial differentiation in coordination levels. In contrast, government intervention (X5) and human capital (X7) exert relatively limited influence.
6.3.3. Results of Interactive Detection
Interaction analysis examines the impact of driver interactions on the CCD and further explores the synergistic effects of pairs of independent variables on the CCD in 2022 (see
Figure 9). In
Figure 9, the diagonal values represent the individual factor q-values, whereas the off-diagonal values reflect the interactive explanatory power between pairs of factors. The results indicate that all interactions between factors exhibit either mutually reinforcing or nonlinear relationships, with no independent factors identified. This suggests that the coupling coordination degree in 2022 is influenced by the combined effect of multiple factors. Ten pairs exhibited a two-factor enhancement interaction, while 18 pairs displayed a nonlinear enhancement interaction. In the two-factor augmented combination, the maximum interaction explanatory power is 0.834, which was observed between digital economy development and digital infrastructure level. The maximum interaction explanatory power of 0.923 was observed in the nonlinearly augmented portfolio, specifically between the level of marketization and government intervention. Furthermore, the q-value for the interaction between digital economic development and each factor exceeds 0.6, supporting the conclusion that digital economic development is the primary driver of the coupling coordination degree.
7. Discussion and Recommendations
7.1. Discussion
The overall CCD between NQPFs and forestry economic resilience has been increasing steadily. This finding aligns with the conclusions of An Sicheng [
5] and Ke Shuifa [
56]. This suggests that societal progress, advancements in science and technology, human resource development, and economic growth have contributed to the enhanced coordination between NQPFs and forestry economic resilience. The current CCD is moderate and predominantly falls within the primary and good coordination stages. This contrasts with the findings of An Sicheng [
5], who reported that coordination was largely mildly dysfunctional until 2022, and on the verge of dysfunctionality by that year. Sicheng’s analysis primarily focused on the high-quality development of NQPFs and the forestry economy. In contrast, the present study examines NQPFs and forestry economic resilience from a different perspective, leading to significant differences in both the indicator system and coordination stage classification. A few provinces are in the quality coordination and severe dysfunction stages, indicating significant disparities and polarization across provinces. These findings align with those of Ke Shui Fa et al. [
56].
Spatial heterogeneity exists in the CCD of NQPFs and forestry economic resilience, with notable regional differences observed across the eastern, central, western, and northeastern regions. These findings are consistent with those of An Sicheng [
5] and Ke Shui-fa [
56]. This phenomenon is influenced by geographic location, resource endowment, economic development, and technological advancements in different regions. Geographic location and resource endowment are crucial factors that influence economic development, whereas economic development and technological advancement are key drivers of inter-regional disparities. The CCD in the eastern region is notably higher than those in the other regions, primarily because of its advantageous geographic location, advanced economic development, and strong support from scientific and technological progress.
The CCD between NQPFs and forestry economic resilience demonstrates a relatively stable development trend, accompanied by a notable spatial spillover effect. These findings are largely consistent with those of Ke Shui-fa [
56], underscoring the spatial agglomeration characteristics exhibited among neighboring provinces. Significant spatial agglomeration and spillover effects exist among neighboring provinces, primarily driven by similarities in geographic location and resource endowments, as well as the relatively high mobility of talent, technology, and other development factors.
The analysis of influencing factors reveals that the digital economy is the primary driver of the coordinated development of NQPFs and forestry economic resilience. Specifically, the digital economy enhances regional productivity and economic development in the forestry sector through improvements in digital infrastructure, the upgrading of industrial structures, and the continuous advancement of digital platforms, among other factors. This finding aligns with the study by Chen et al., which demonstrates that the digital economy fosters the coupled and coordinated development of NQPFs and forestry economic resilience through industrial structure upgrades [
57]. Additionally, green technology innovation enhances the level of green total factor productivity in forestry, further promoting the coupled and coordinated development of productivity and economic resilience in the sector. The role of digital infrastructure in facilitating coupled coordination, coupled with the synergistic effects of the digital economy, aligns with the findings of David Eaves et al. [
58]. Brazil is currently undergoing a digital transformation, where the strategic design and governance of digital public infrastructure play a crucial role in promoting sustainable economic development. Brazil is rich in forest resources; however, it faces significant challenges, including indiscriminate deforestation and inefficiencies within the forestry sector. In response, the country is actively promoting digital agriculture and the circular economy within forestry, initiatives that are expected to enhance the development of new qualitative productivity, strengthen the economic resilience of the forestry industry, and foster sustainable forestry practices [
59]. Digitization has increasingly permeated the field of natural resource governance. Scholars, including Rantala, have developed a conceptual framework to analyze how natural resource governance influences the digital governance of natural resources and the factors that hinder the establishment of natural resource data institutions. Using Finland and Canada as case studies, this framework underscores the critical role of digital governance in advancing the forestry economy [
60].
The direct effect of government intervention is not significant; however, when interacting with other factors, its impact is notably enhanced. In particular, the interaction with the level of marketization yields an interactive explanatory power of 0.923. This suggests that relying solely on government intervention is insufficient to promote the coordinated development of NQPFs and forestry economic resilience. Instead, a combination of government action and marketization development is necessary to achieve a more substantial effect. This aligns with Bennich’s findings, which highlight that Sweden and Norway are transitioning from a traditional forestry economy to a bioeconomy [
61]. Furthermore, certain interventions, such as increased investment in research and development, may have synergistic effects, creating greater potential for high-value-added production [
62]. To effectively implement the forest management system, while ensuring protection, the working group should focus on several key areas: the development and refinement of forestry economic incentive policies, the promotion of forestry technology innovation, the optimization and upgrading of the forestry industry structure, the integration of forestry with other industries, and the enhancement of foresters’ comprehensive literacy across various domains.
7.2. Recommendations
The CCD between NQPFs and forestry economic resilience has shown a steady upward trend. However, the overall level remains relatively low, accompanied by pronounced inter- and intra-regional disparities. These disparities significantly impede the synergistic and coordinated development of the two systems. Therefore, the coupling and coordinated development of these two systems must be advanced through context-specific adaptation, evidence-based planning, and differentiated management strategies tailored to regional conditions.
First, strategies for development ought to be crafted in alignment with specific local conditions by leveraging the maximum potential of regional strengths. The eastern region, with its pronounced advantage in coupling coordination, should capitalize on its robust economic foundation, abundant resources, skilled talent pool, and technological innovation to expedite the upgrading of its industrial structure. By fully leveraging spatial spillover effects, this region can effectively stimulate and support the development of adjacent areas. Specifically, provinces such as Jiangsu, Zhejiang, and Guangdong, which are currently in the quality coordination stage, should actively serve as regional growth poles, leveraging their strengths to radiate development and assist neighboring areas in enhancing their coupling and coordination degrees. The central region should actively adopt the advanced management practices and technologies of the eastern region, fully capitalize on its resource advantages, and leverage its strategic position as a transportation hub to foster the coordinated development of NQPFs and forestry economic resilience. The western and northeastern regions, characterized by weaker economic foundations and lower development levels, should actively pursue distinctive development pathways. Additionally, these regions should actively seek to strengthen their regional cooperation with the eastern and central regions to accelerate their development.
Second, the advancement of new forestry productivity and strengthening of forestry economic resilience are needed. The development of new forestry productivity is crucial for achieving both ecological conservation and economic benefits. It is essential to enhance innovation in forestry science and technology by actively advancing the application of intelligent technologies such as satellite remote sensing, drone monitoring, the Internet of Things, and smart equipment within the sector. Furthermore, research should prioritize the development of new tree varieties with improved resistance and accelerated growth. Industrial restructuring must be promoted by advancing green industries, including the forest economy, carbon sink economy, and production of high-value-added products. Actively promoting institutional innovations, including the establishment of forestry green development funds, low-interest loans, and other financial support mechanisms, is also essential. Market-oriented reforms in the forestry sector should be promoted and mechanisms strengthened for the diversified realization of ecological product values. Technological advancements, industrial restructuring, and institutional innovations will further enhance the resilience of the forestry economy.
Third, the strategy of promoting coordinated regional development should be implemented more comprehensively, with synergistic development platforms and mechanisms being established to address regional development imbalance. It is recommended that a national-level coordinated development plan be developed for the forestry sector, with clearly defined functional roles and development priorities. This plan should include the establishment of a cross-regional cooperation platform to facilitate the exchange and contribution of data, technology, talent, and other resources, emphasizing supporting disadvantaged regions or provinces through collaboration with more advantaged areas. Additionally, an inter-regional scientific and technological innovation alliance should be formed to foster the cross-regional transformation and application of technological achievements. The industrial layout should be optimized to encourage the collaborative advancement of both the upstream and downstream sectors along the industrial chain, aligned with the resource endowments and industrial foundations of each province and region. Furthermore, regional financial innovation should be encouraged, with a focus on developing green finance, technology finance, and other emerging financial models, to provide essential financial support for inter-regional cooperative development. A monitoring mechanism should be established to track regional coordinated development, thereby enabling regular assessments of its effectiveness. This mechanism should facilitate timely adjustments and optimizations of policy measures based on assessment outcomes. These policies aim to address the issue of unbalanced regional development by promoting more equitable growth and cooperation across regions.
Given that the digital economy plays a pivotal role in enhancing NQPFs and economic resilience within the forestry sector, it is essential for governments at all levels to prioritize the development of digital infrastructure, the establishment of digital platforms, and the improvement of digital public services. This will provide a strong foundation for the digital transformation of forestry. To further advance this transformation, it is crucial to foster the development of digital industrialization and the digitization of the entire industrial chain. This includes enhancing both the digital forestry monitoring system and the digital forestry supply chain infrastructure, ensuring that these components work seamlessly together. Achieving these goals requires coordinated efforts from both the government and the market. The government should focus on refining policies and expanding digital public services, while the market must lead the drive for digital industrialization and the practical implementation of digitization in the sector.
7.3. Limitations and Future Recommendations
This study explores the CDR between NQPFs and forestry economic resilience in China. However, this study has several limitations that warrant further investigation. First, owing to limited data availability, the analysis is based on a data sample from 30 provinces from 2012 to 2022. Future research should examine the relationship between these two systems on a more granular scale to enhance both relevance and timeliness. Future research should broaden the integration of environmental data, such as soil quality and biodiversity, to further refine the indicator system for economic resilience in forestry. These factors are crucial not only for assessing economic resilience but also for strengthening forest resilience. In addition, it is essential to expand data acquisition channels by utilizing advanced technologies, such as satellite imagery and crowdsourcing. These technologies will enable the collection of valuable data on forest cover, density, species distribution, hydrology, and other relevant variables. This approach will enhance the granularity of micro-scale research, providing deeper insights and increasing the overall significance of the findings. Future research should focus on a more in-depth examination of the mechanisms through which NQPF factors influence forestry economic resilience. Such an analysis would facilitate a comprehensive understanding of how these factors foster resilience within forestry economies, offering critical insights for both governmental and corporate decision-making. Finally, the mechanism through which new quality productive forces affect the resilience of the forestry economy still requires further investigation. This is crucial for developing new quality productive forces in forestry and enhancing the resilience of the forestry economy, and it will be the focus of our future research.
8. Conclusions
This study constructs an indicator system to assess the CCR between NQPFs and forestry economic resilience. It measures the CCDs of these two systems across 30 provinces from 2012 to 2022 by employing a CCD model. Furthermore, GIS spatial analysis, the Gini coefficient, conditional Kernel density estimation, and spatial Markov chains are applied to depict spatial and temporal patterns and the multidimensional dynamics of the evolution trends.
First, regarding temporal evolution, NQPFs and forestry economic resilience exhibit mutually adaptive and synergistic development, with the CCD generally increasing. The coupling coordination stage has shifted from severe dissonance to quality coordination. However, at the national level, China remains primarily in the good and primary coordination stages, with a few provinces still in the severe dissonance stage. This has created regional disparities, with the eastern region outperforming the central, western, and northeastern regions.
Second, regarding spatial patterns, notable spatial heterogeneity exists in the CCRs between NQPFs and forestry economic resilience, with pronounced regional imbalances and agglomerations. The overall spatial distribution follows a ‘high in the south and low in the north’ pattern. Furthermore, compared to the northeastern and western regions, the eastern coastal provinces exhibit higher economic development levels and faster coupling and coordination. This advanced development in the east can drive the growth of surrounding areas to some extent.
Third, regarding spatial disparities and decomposition, regional differences in coupling coordination, arising from both inter- and intra-regional variations, have diminished over time. Therefore, addressing both inter- and intra-regional disparities has emerged as the primary catalyst for resolving the spatial imbalance in the CCR between NQPFs and the economic resilience of forestry.
Fourth, regarding the dynamic evolution of distribution, the overall CCD in each province exhibits an upward trend, although significant regional disparities persist. When spatial factors are not considered, the CCD across provinces shows considerable continuity and relatively low mobility. However, when the spatial influence of neighboring regions is incorporated, both the dynamic and static estimates yield similar results, albeit with some differences. Specifically, temporal factors do not significantly improve a province’s CCD when those of its neighboring provinces are high. In contrast, when the CCD of neighboring provinces is at a medium or low level, temporal factors play a notable role in facilitating the upward shift in the province’s CCD.
Fifth, regarding the probability transfer trend, the development of CCD between NQPFs and forestry economic resilience in China remains relatively stable, exhibiting clear path dependence and the Matthew effect. At the hierarchical transfer level, asymptotic changes typically occur only between neighboring types, making an upward transfer across types difficult. Notably, when a region is adjacent to a high-level province, the radiation effect from the neighboring region significantly increases the probability of upward transfer and progression. These findings highlight the role of spatial spillover effects in driving regional development.
Finally, the results indicate that several factors significantly influence the coupling and coordination degree of the province, including economic development, openness, marketization, social security, the digital economy, and digital infrastructure. Among these, the top three factors, based on their q-values, are the development of the digital economy, the level of marketization, and the level of social security. Notably, the development of the digital economy emerges as the dominant driver of the coupling and coordination degree. The next most significant impacts come from the degree of liberalization, the level of digital infrastructure, and economic development. In contrast, the effects of government intervention and human capital are minimal, showing no significant influence.


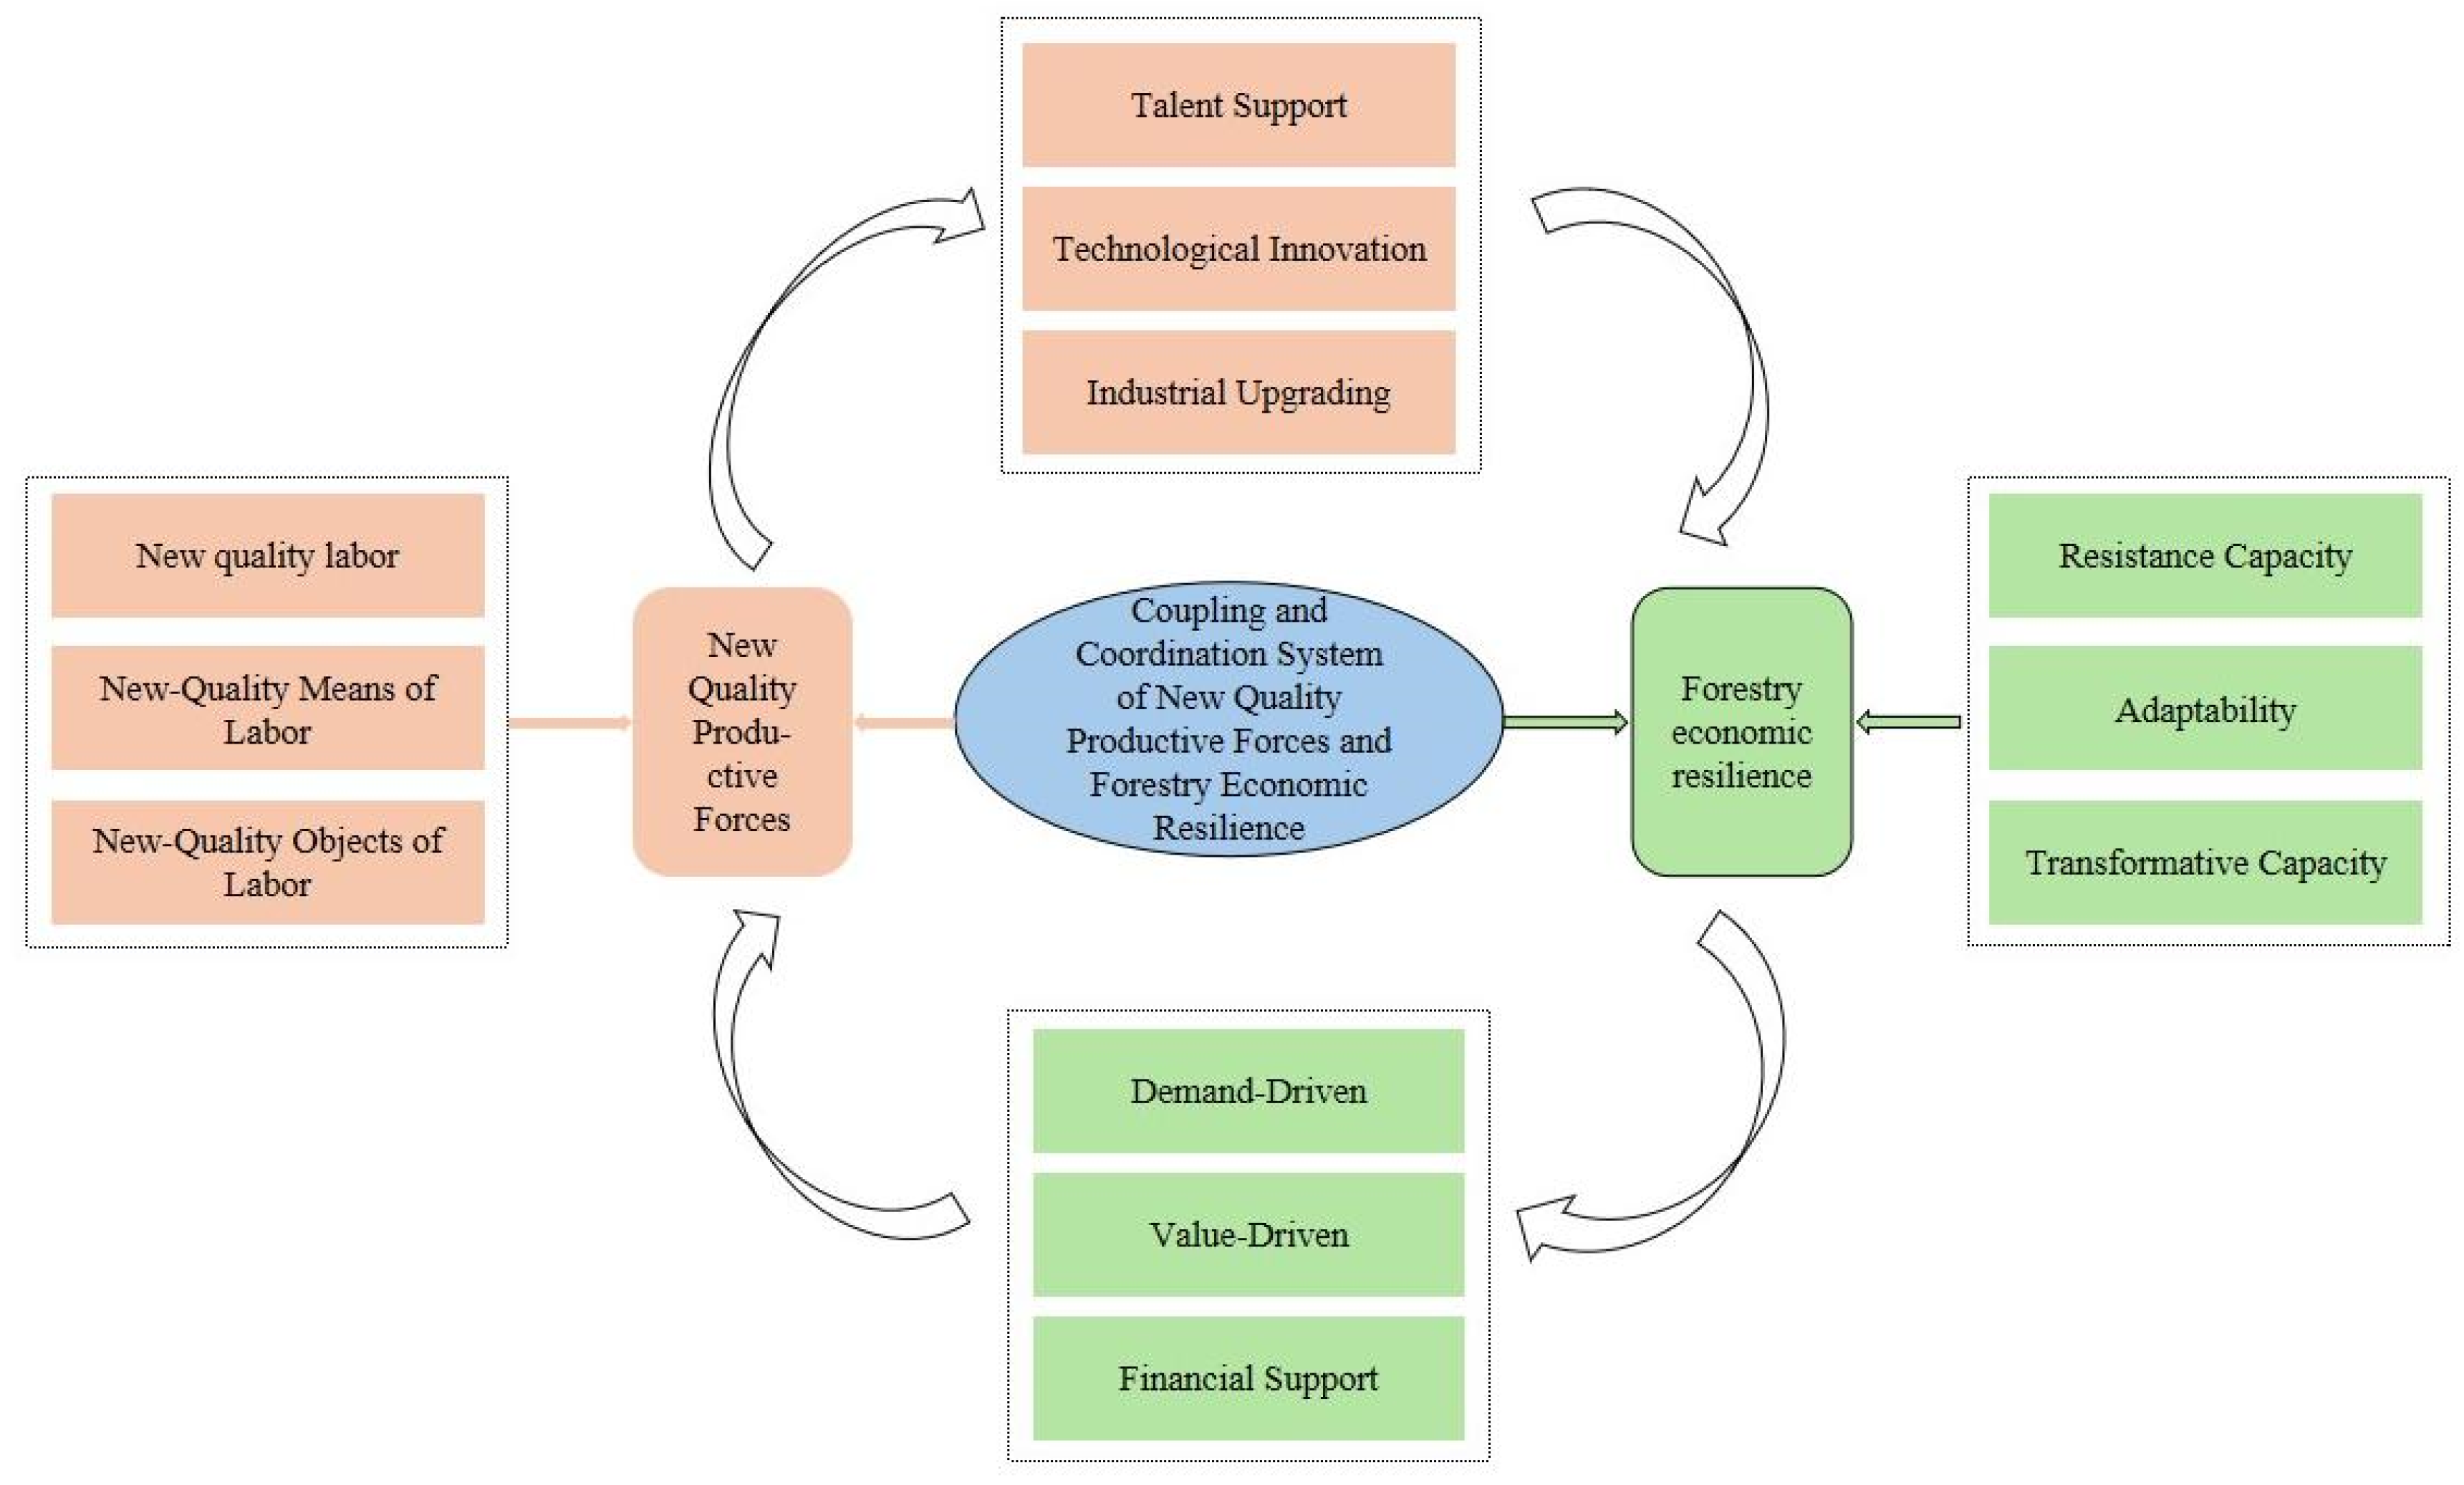
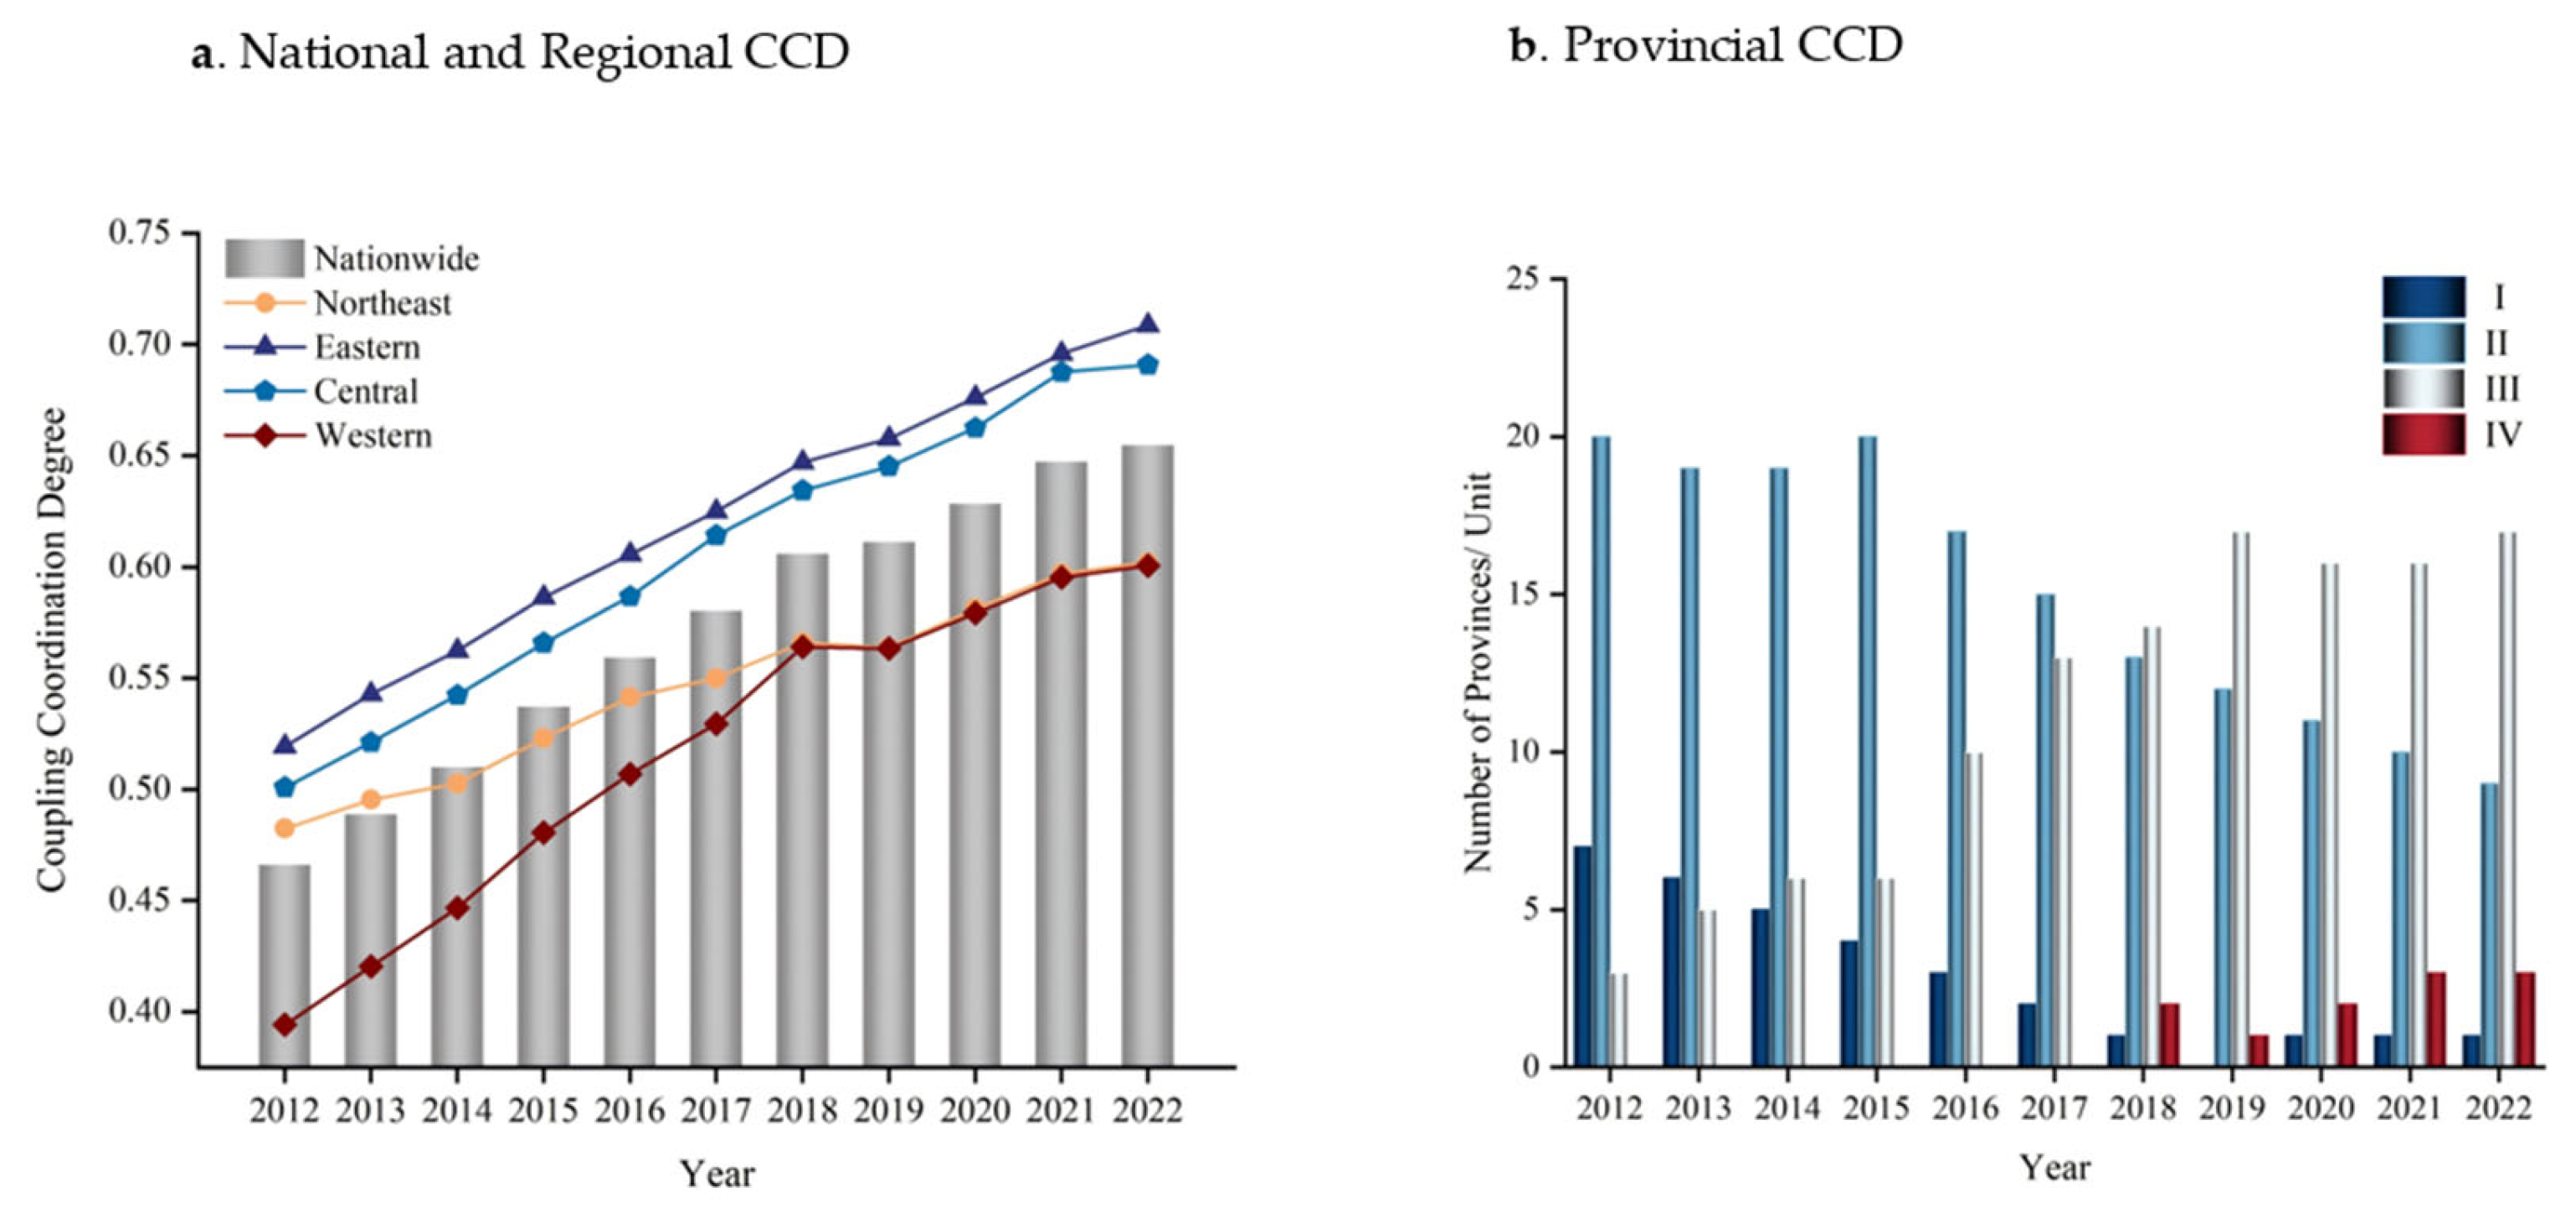
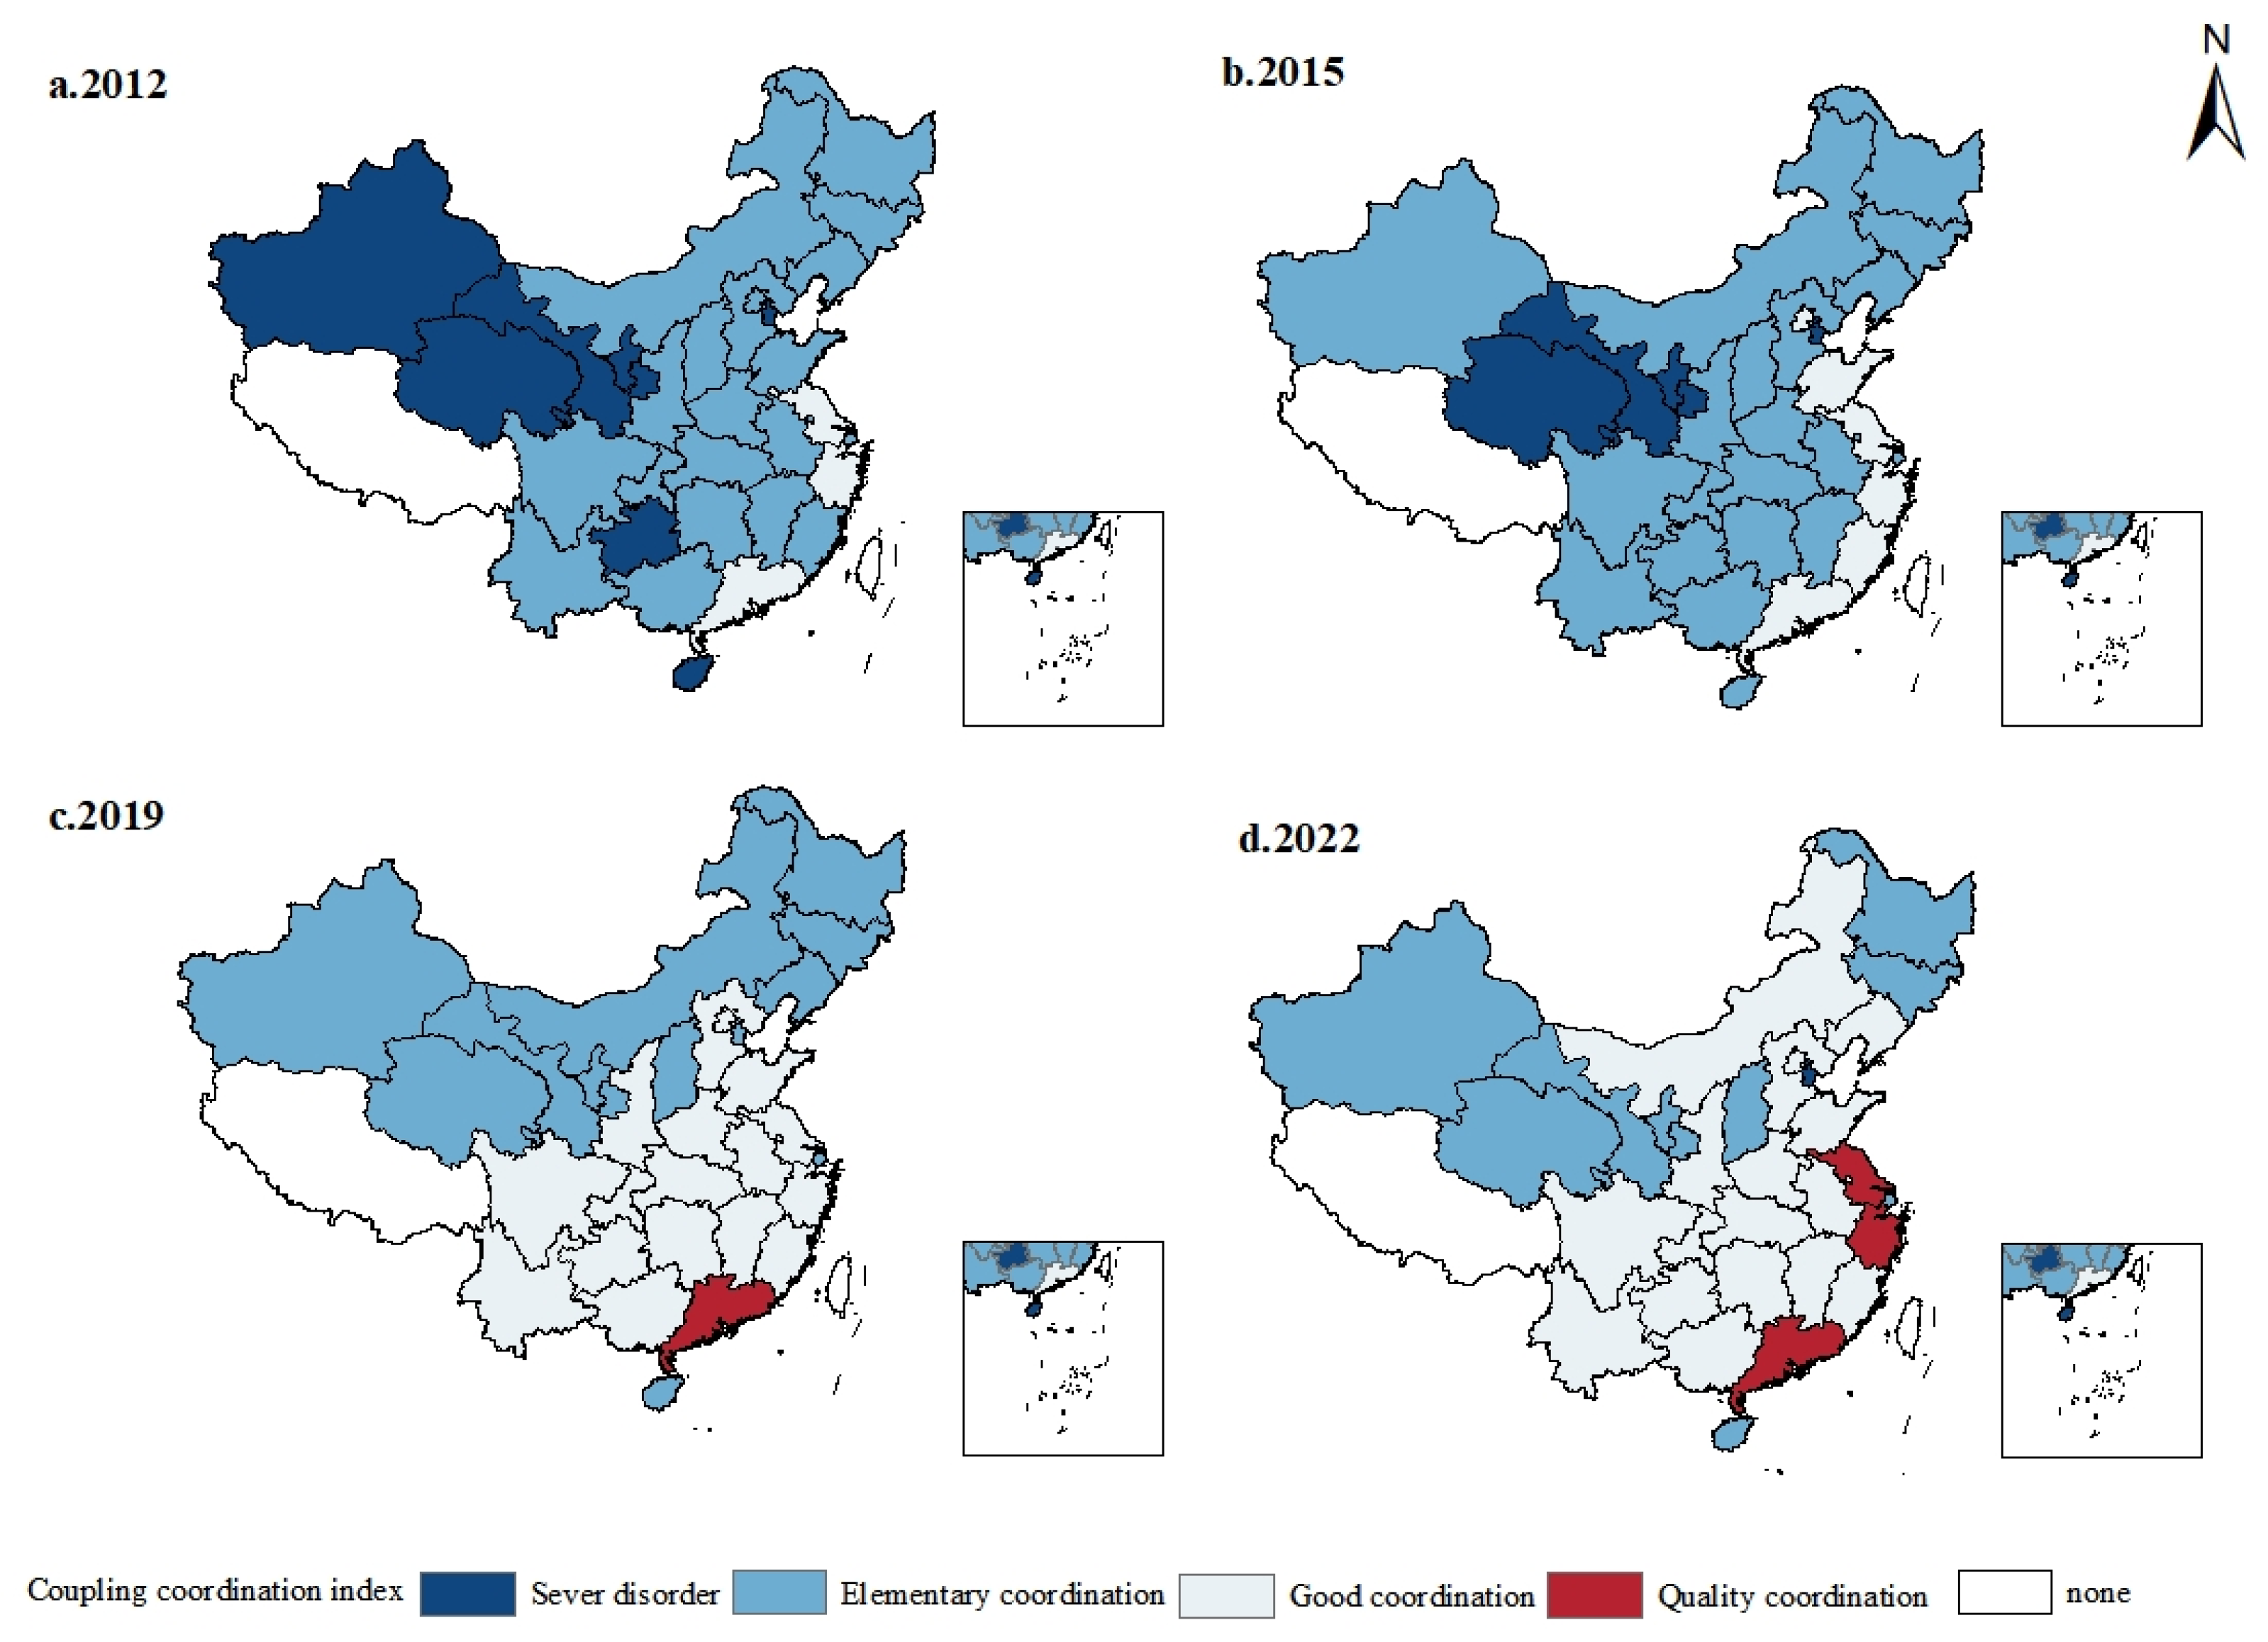
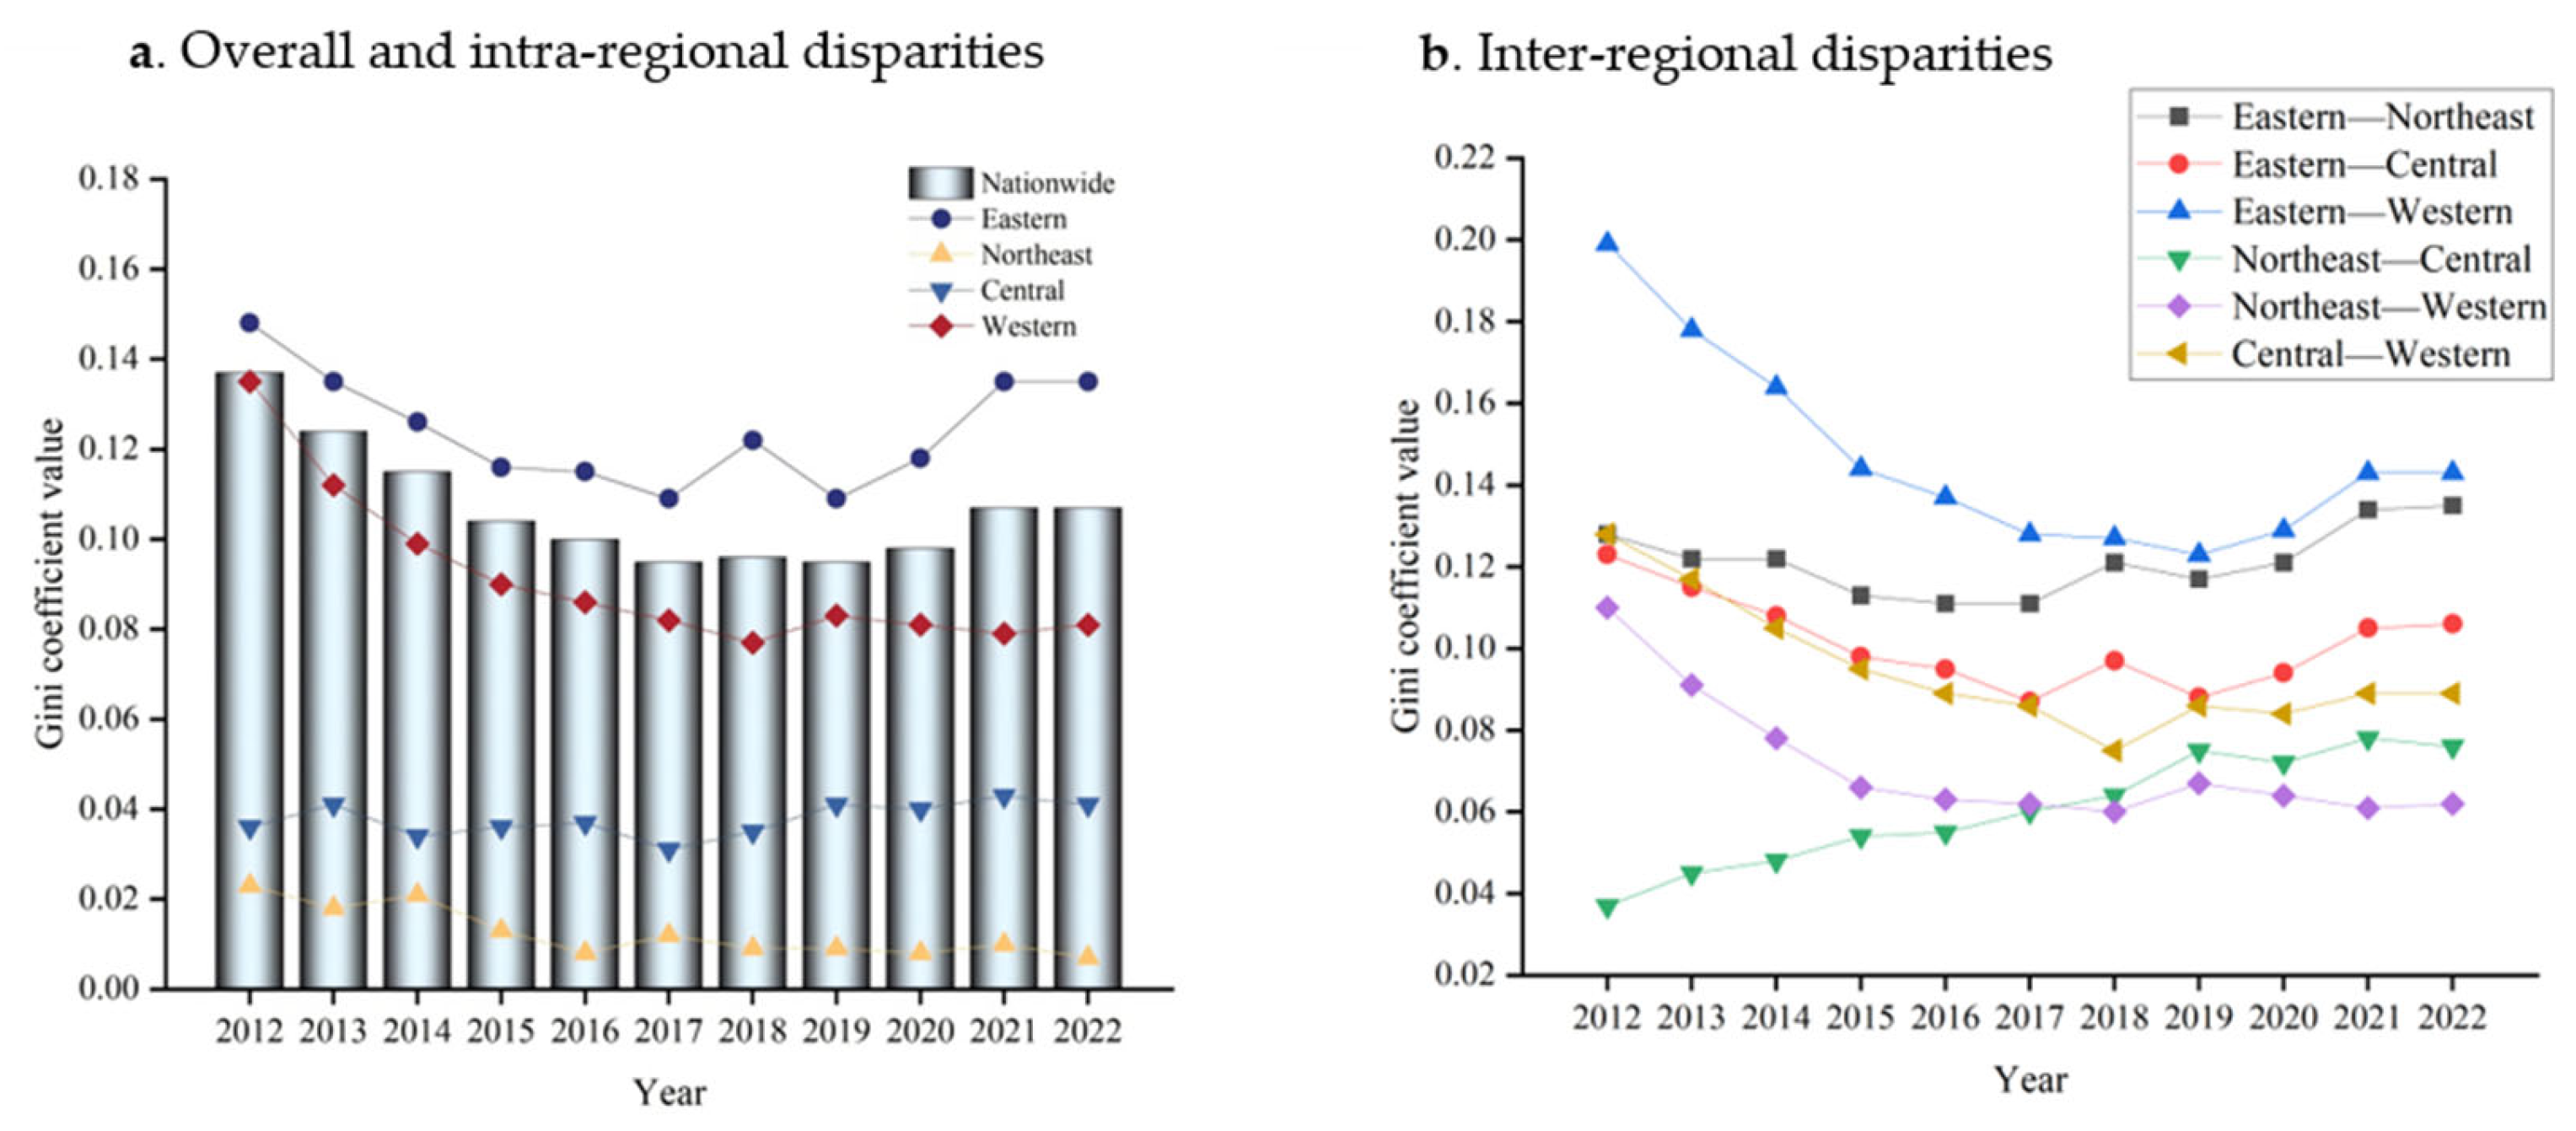
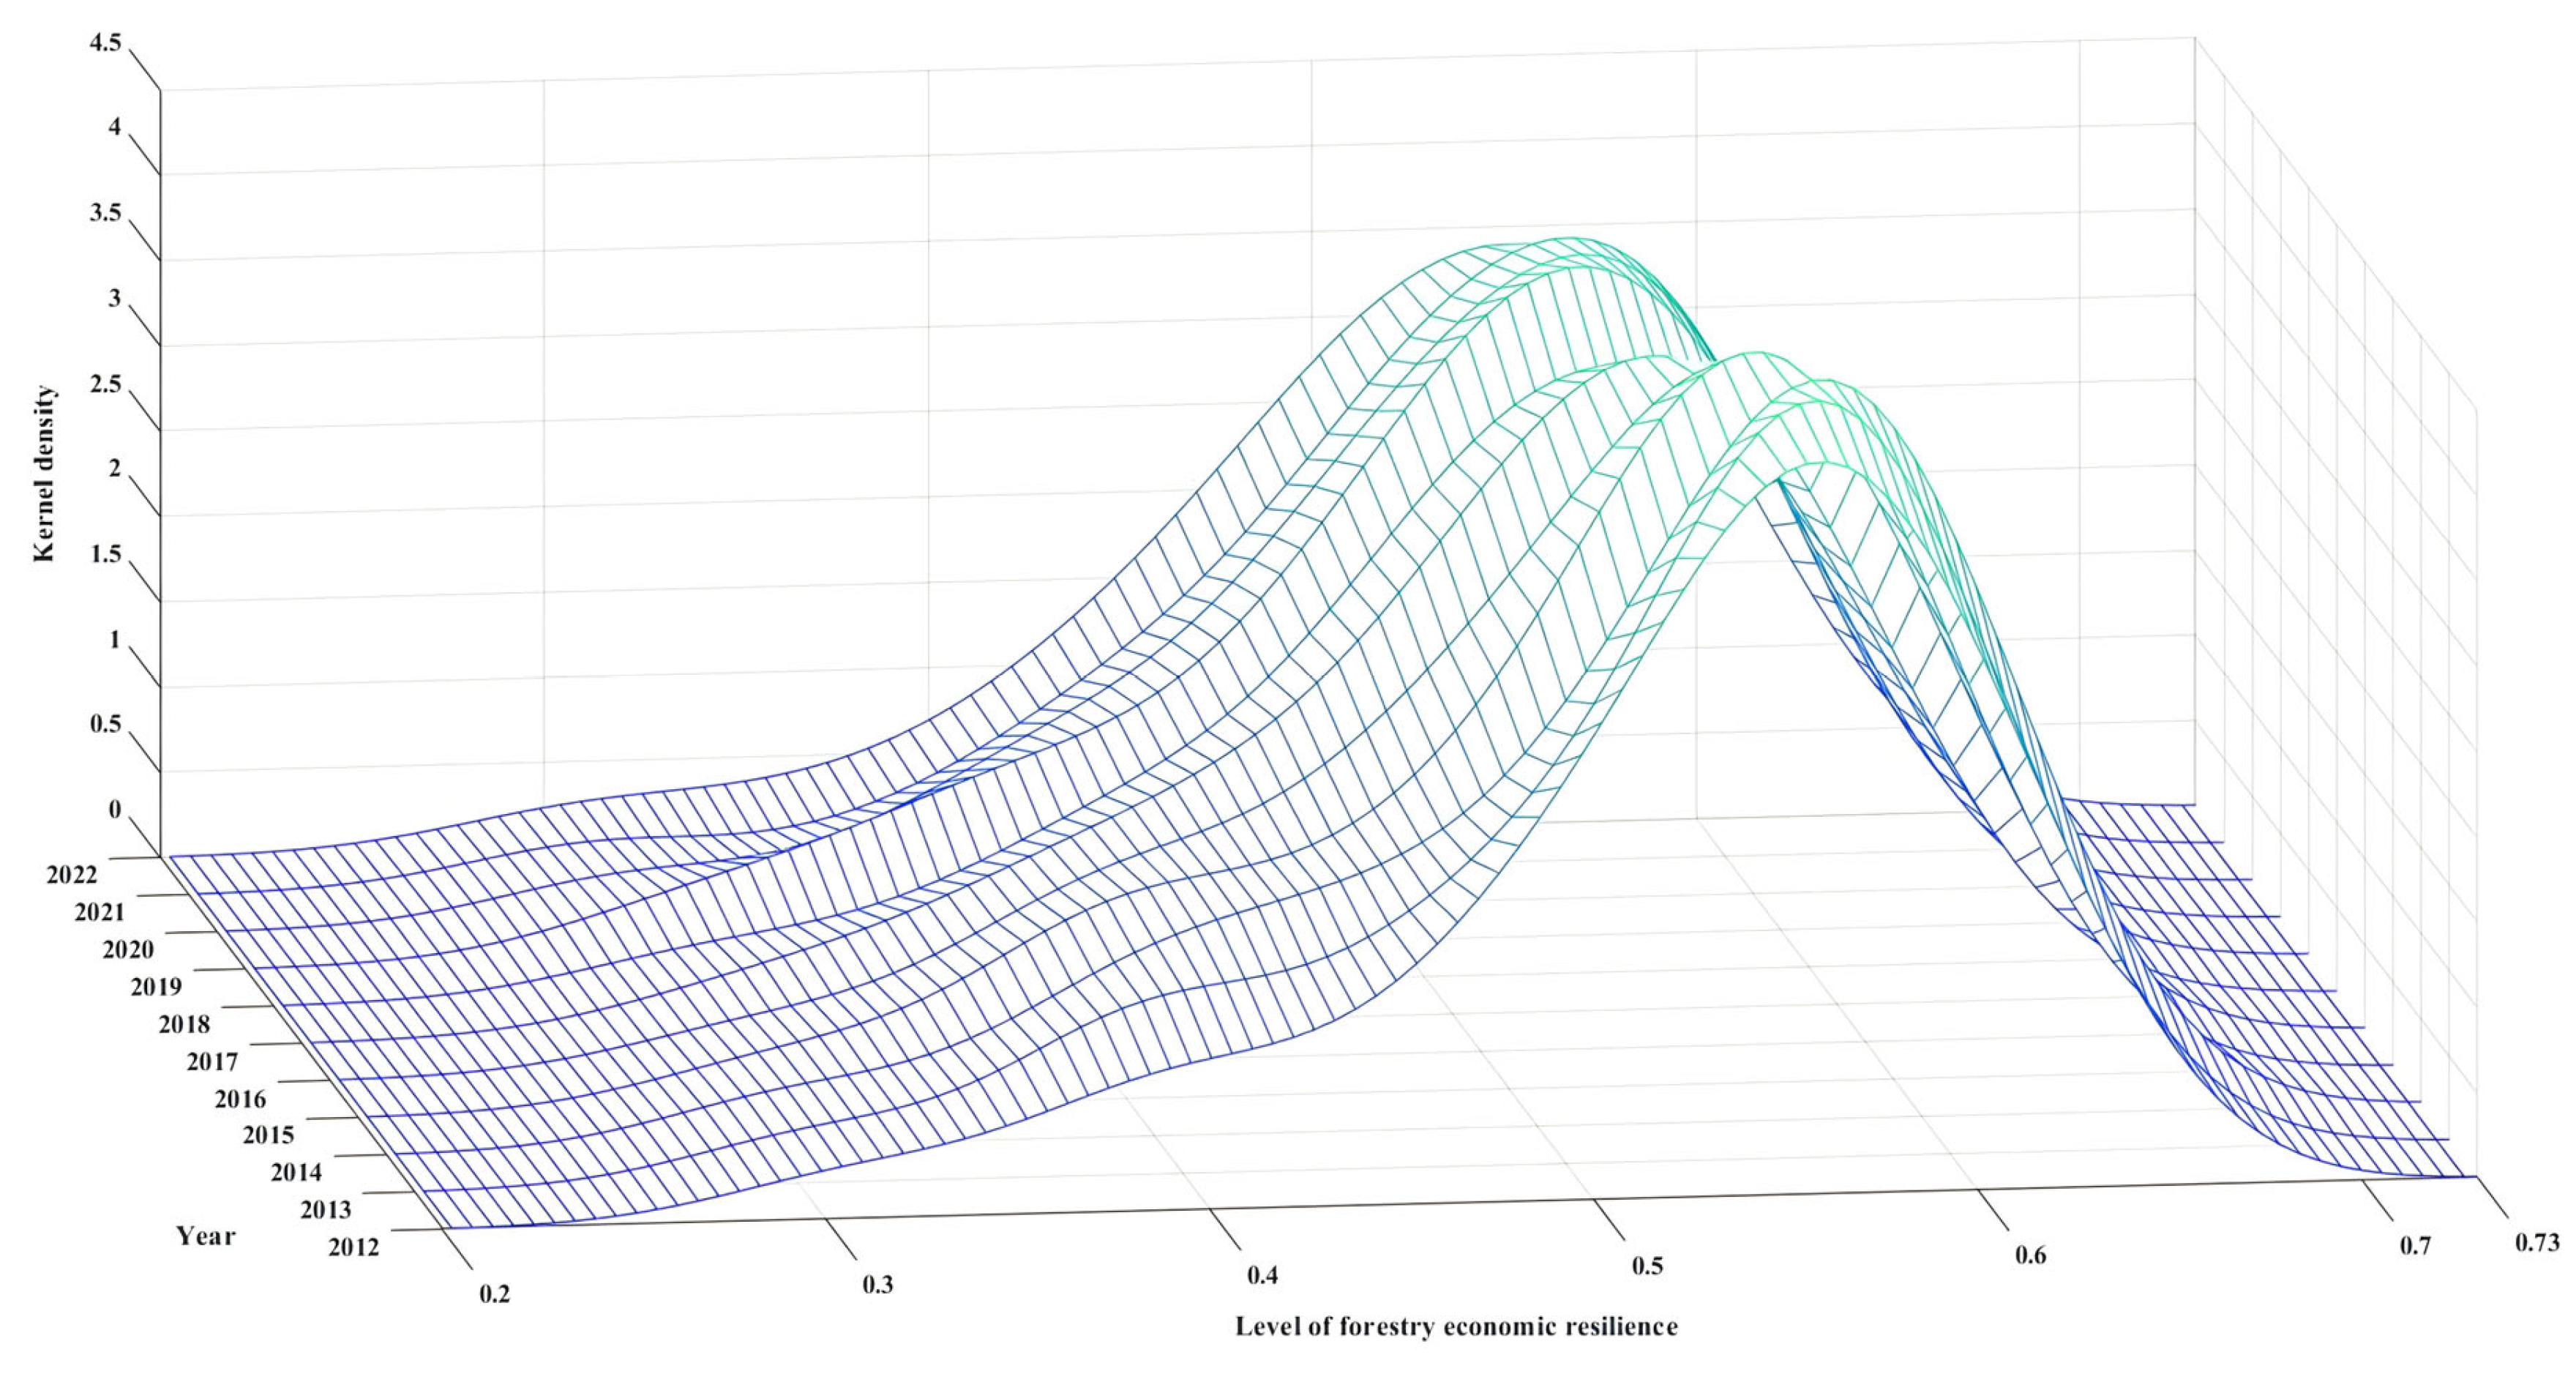

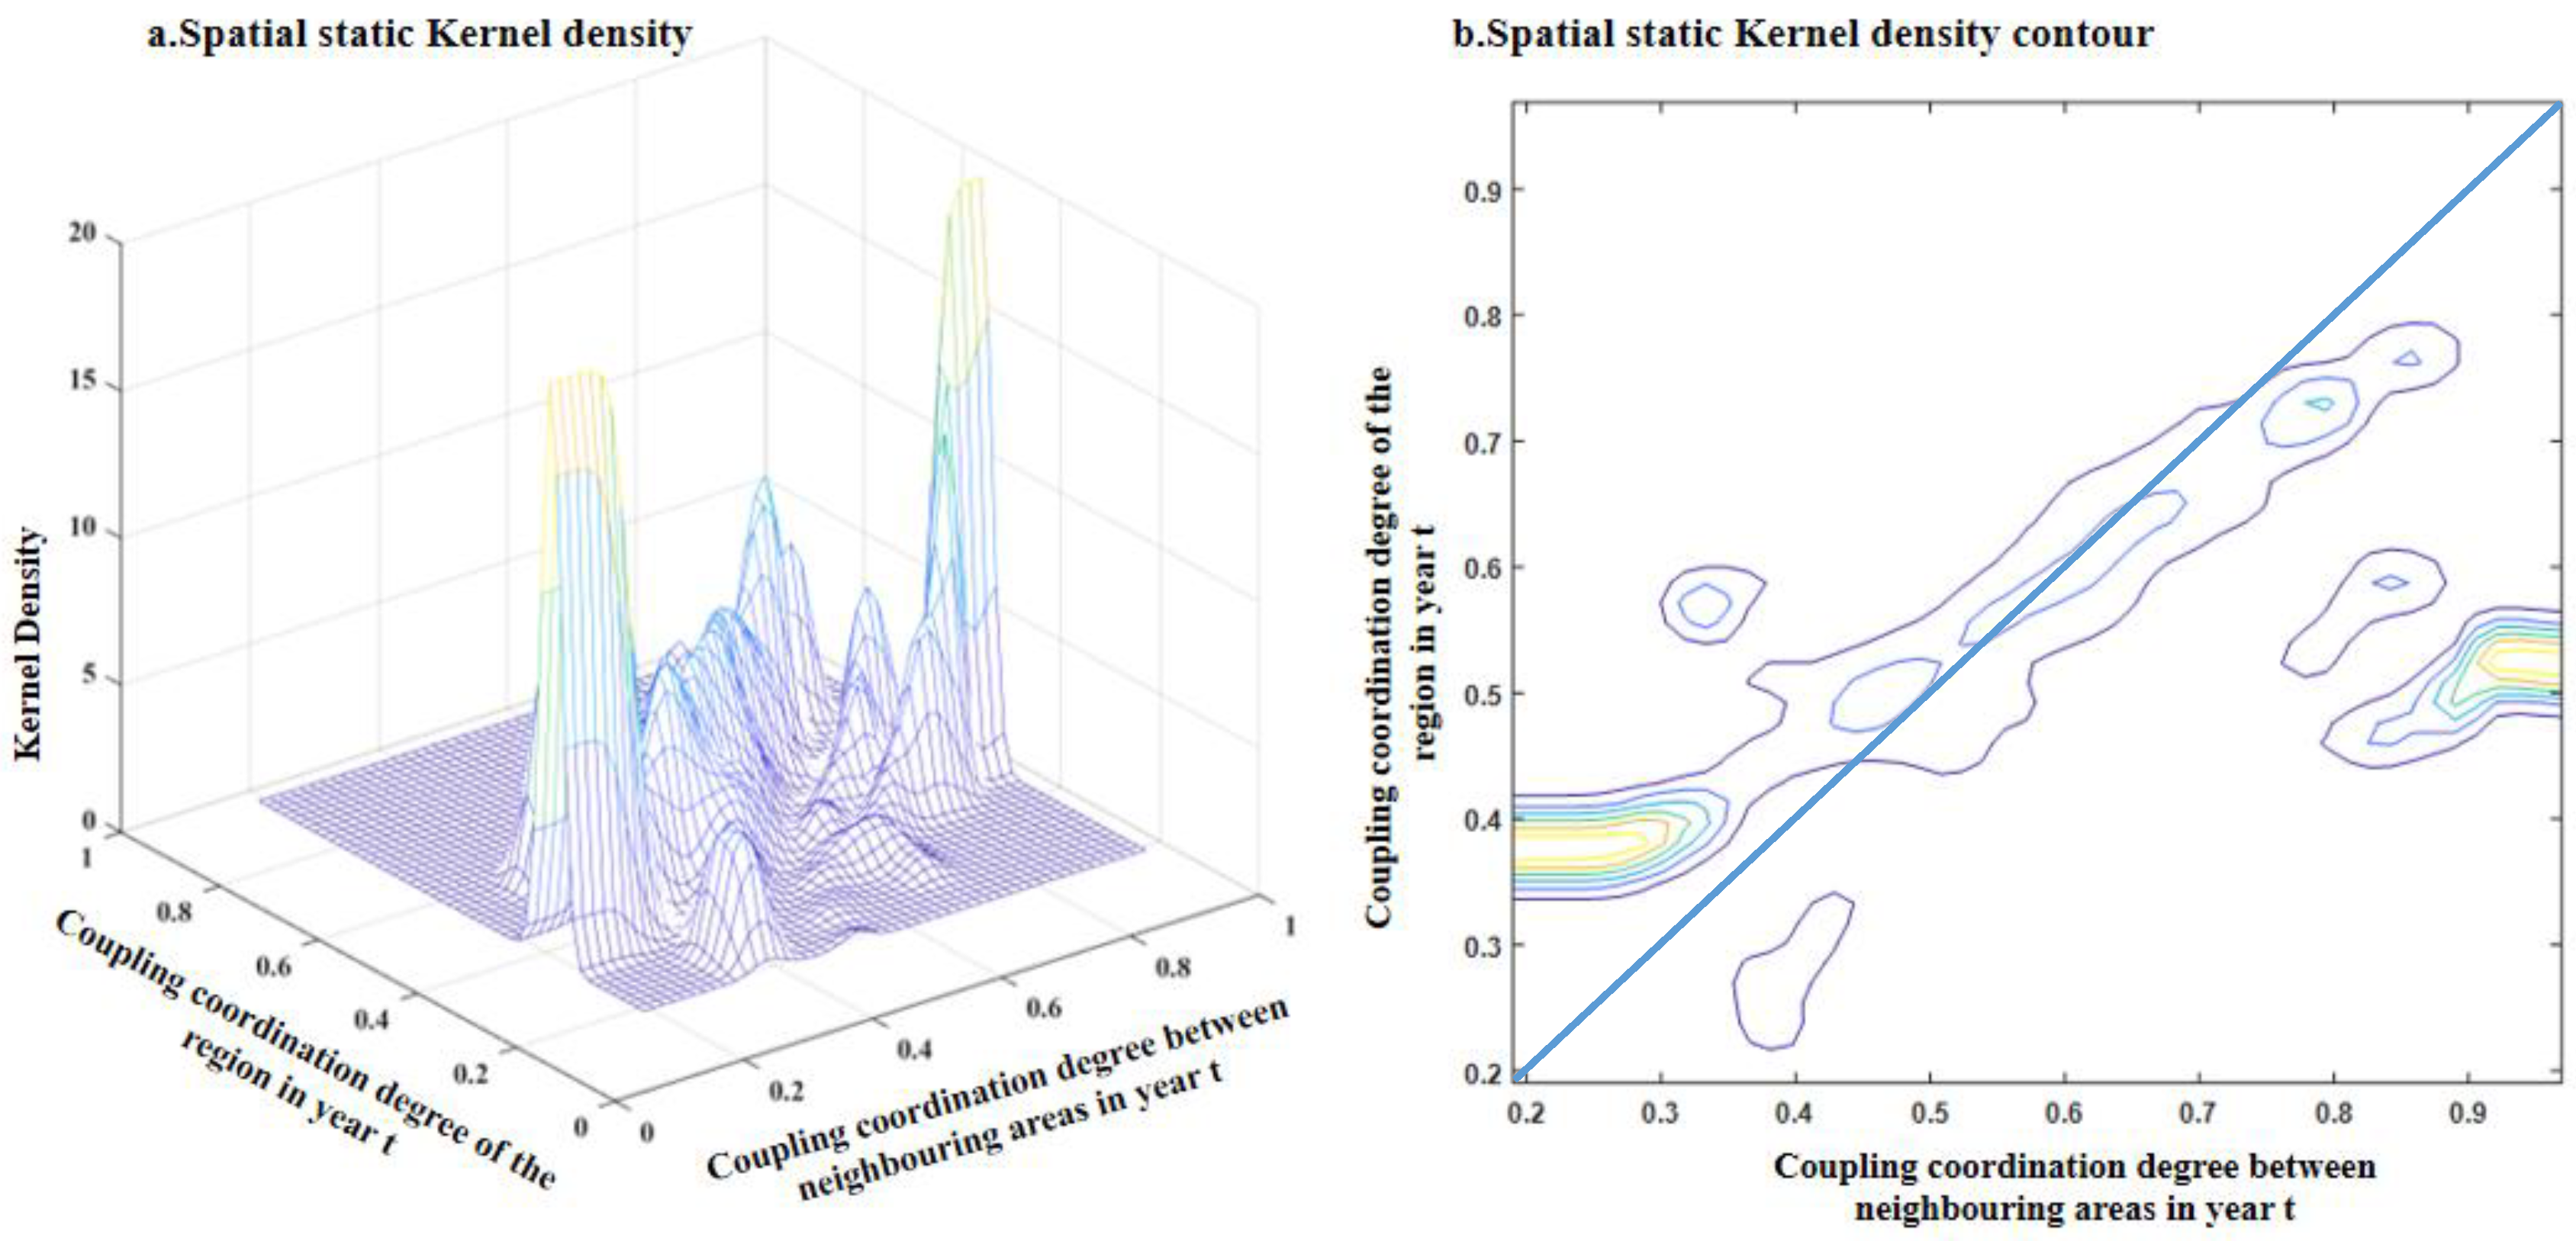


