Article

Analysis of Spatiotemporal Dynamics and Driving Mechanisms of Cultural Heritage Distribution Along the Jiangnan Canal, China

1
College of Resources Environment and Tourism, Capital Normal University, Beijing 100048, China
2
Beijing Laboratory of Water Resource Security, Beijing 100048, China
3
Beijing Municipal Key Laboratory of Resources Environment and GIS, Beijing 100048, China
4
College of History, Capital Normal University, Beijing 100048, China
*
Author to whom correspondence should be addressed.
Sustainability 2025, 17(11), 5026; https://doi.org/10.3390/su17115026
Submission received: 7 April 2025 / Revised: 21 May 2025 / Accepted: 27 May 2025 / Published: 30 May 2025
(This article belongs to the Special Issue Cultural Heritage Conservation and Sustainable Development)

Abstract

As a crucial component of the Beijing–Hangzhou Grand Canal’s hydraulic engineering, the Jiangnan Canal has historically played a pivotal role in China’s development as a key hydraulic infrastructure. This water conservancy project, connecting northern and southern water systems, not only facilitated regional economic integration but also nurtured unique cultural landscapes along its course. The Jiangnan Canal and its adjacent cities were selected as the study area to systematically investigate 334 tangible cultural heritage (TCH) sites and 420 intangible cultural heritage (ICH) elements. Through integrated Geographical Information System (GIS) spatial analyses—encompassing nearest neighbor index, kernel density estimation, standard deviation ellipse assessment, multi-ring buffer zoning, and Geodetector modeling, the spatiotemporal distribution features of cultural heritage were quantitatively characterized, with a focus on identifying the underlying driving factors shaping its spatial configuration. The analysis yields four main findings: (1) both TCH and ICH exhibit significant spatial clustering patterns across historical periods, with TCH distribution displaying an axis-core structure centered on the canal, whereas ICH evolved from dispersed to clustered configurations. (2) The center of gravity of TCH is primarily around Taihu Lake, while that of ICH is mainly on the south side of Taihu Lake, and the direction of distribution of both is consistent with the direction of the canal. (3) Multi-ring buffer analysis indicates that 77.2% of TCH and 49.8% of ICH clusters are concentrated within 0–10 km of the canal, demonstrating distinct spatial patterns: TCH exhibits a gradual canal-dependent density decrease with distance, whereas ICH reveals multifactorial spatial dynamics. (4) Human activity factors, particularly nighttime light intensity, are identified as predominant drivers of heritage distribution patterns, with natural environmental factors exerting comparatively weaker influence. These findings provide empirical support for developing differentiated conservation strategies for canal-related cultural heritage. The methodology offers replicable frameworks for analyzing heritage corridors in complex historical landscapes, contributing to both applied conservation practices and theoretical advancements in cultural geography.

1. Introduction

The Beijing–Hangzhou Grand Canal is one of the most outstanding hydraulic engineering feats in Chinese history [1,2], ranking among the world’s foremost artificial waterways in terms of both length and construction complexity. Inscribed on the UNESCO World Heritage List in 2014 [3,4], it extends 1794 km from Beijing in the north to Hangzhou, Zhejiang Province, in the south, and interconnects China’s five major water systems [1]. The 330 km Jiangnan Canal, the southernmost and most strategically significant part of the Grand Canal, constitutes 18.4 % of the total length and flows southward through Zhenjiang, Changzhou, Wuxi, and Suzhou in Jiangsu Province, as well as Huzhou, Jiaxing, and Hangzhou in Zhejiang Province. This stretch links the greatest number of water systems, covers the largest area, embodies the richest cultural heritage, and passes through the most prosperous towns of the entire Grand Canal. Beyond its role as a waterway, the Jiangnan Canal corridor also serves as a living repository of both material and immaterial cultural assets.
The Jiangnan Canal corridor contains abundant cultural heritage resources, including both tangible and intangible forms. According to UNESCO, tangible cultural heritage refers to material and immovable objects or landscapes [5], such as canal locks, stone arch bridges, and temple complexes, which are of great significance to human culture and history. In contrast, intangible cultural heritage is expressed through non-material forms that reflect regional ways of life, including traditional craftsmanship, religious practices, and communal lifestyles specific to a region [6], such as Kunqu opera and dragon boat festivals. These diverse cultural assets form the foundation of regional cultural identity. Moreover, these tangible and intangible elements together constitute a historical cultural landscape [7], reflecting the co-evolution of human society and the natural environment over time, carrying collective memories, mirroring past technological and social transformations, and anchoring regional identity through both material remains and living traditions. However, their spatial distribution and driving mechanisms shaping these heritage resources remain insufficiently explored, warranting further systematic investigation.
Currently, research on the spatiotemporal dynamics and driving mechanisms of cultural heritage is beset by three limitations. First, the majority of relevant studies have been restricted to single-city analyses. This narrow-focused approach has given rise to a fragmented understanding of spatial scales. For example, Yan Huang [8] mapped the spatiotemporal evolution of ICH in the Suzhou Canal area and found that canal characteristics strongly shape distribution patterns. Jiahao Zhang et al. explored the cultural heritage in Fuzhou and likewise emphasized local water-land transport routes as density drivers [9]. However, neither study breaks out of the single-city perspective, failing to adopt an overarching view of the entire river basin and thus overlooking the broader context and inter-relationships [10]. Tianxin Zhang [11] conducted research on the intangible cultural heritage in the Yangtze River Economic Belt and identified 37 heritage corridors, successfully transcending administrative boundaries and highlighting macro-scale integration and collaboration.
Secondly, the diversity of heritage types under investigation is rather limited [12,13,14]. Take Lin Li’s study on folk songs in the Grand Canal Basin as an example [15]: it revealed a spatial distribution pattern of “distribution along the river, with two cores and two belts”. Meanwhile, Pérez-Álvaro’s research on future changes in tangible cultural heritage under climate change focused primarily on projecting climate impacts but overlooked the interdependent relationship between intangible cultural heritage and human activities [16]. Such studies therefore fail to reveal how TCH and ICH co-evolve or why they exhibit divergent spatial evolution trajectories within the same geographical context.
Third, many studies of cultural heritage still rely on qualitative approaches or single-discipline perspectives. For example, Wojcieszak M [17] employed radiocarbon dating to establish the ages of heritage sites, and Morel H [18] examined heritage transmission and conservation through the lens of the climate crisis. While these works offer important insights into history, archaeology, and climate science, they generally lack integration with geographic information technologies such as remote sensing, GPS-based mapping, spatial statistical methods (e.g., hotspot analysis, kernel density estimation), and interpretative tools like the Geodetector model. In recent years, GIS has been applied to hotspot identification and spatial statistics [19,20,21], but few studies synthesize multiple spatial tools, let alone deploy the Geodetector model to quantify the spatial explanatory power of various drivers for the distribution of cultural heritage. As a result, there remains no replicable, multi-method spatial analysis framework to support systematic corridor-scale research on cultural heritage. The Geodetector model not only quantifies the relative contribution of each driver (via q-values) and uncovers their interactive effects, but also delivers in-depth empirical insights into the mechanisms driving heritage distribution, thereby facilitating the integration of spatial statistical findings with cultural geography theories such as power-space relations and the production of place [22].
To bridge these gaps, this study develops a replicable “aggregation–orientation–proximity–driver” framework that not only maps macro-scale spatial structures but also quantifies the relative explanatory power (q-values) and interactive effects of multiple natural and socioeconomic drivers. Building on this methodological advance, protection systems for cultural heritage both at home and abroad have gradually transitioned from single-object conservation to more holistic, landscape-scale approaches [1]. European and American countries have championed concepts such as cultural routes [23] and heritage corridors [11,24,25], and China has likewise introduced the notion of linear cultural heritage [26]. Consequently, integrated GIS-based frameworks are critical for visualizing and analyzing these broader conservation units.
Accordingly, we pose two guiding questions:
RQ1. What are the millennial-scale spatiotemporal distribution patterns of TCH and ICH along the Jiangnan Canal corridor?
RQ2. Which natural, socio-economic, and human-activity factors most strongly drive these patterns, and how do their influences differ between TCH and ICH?
To answer these questions, this study employs an integrated suite of GIS-based analytical tools: Kernel Density Estimation (KDE) to quantify clustering intensity and detect high-density nuclei; the standard deviation ellipse (SDE) to capture directional trends and shifts in spatial centroids; the multiple ring buffer (MRB) to assess spatial dependence on canal proximity; and the Geodetector model to compare quantitatively the explanatory power of multiple drivers (q-values).
Based on this framework, our work advances three key innovations:
a.
Basin-wide scope. We compile and georeference 334 TCH and 420 ICH points across all seven Jiangnan Canal cities (Zhenjiang–Hangzhou), overcoming the single-city limitation of prior work [8,9,10,27].
b.
Integrated TCH–ICH analysis. By examining both tangible and intangible heritage within the same spatial framework, we reveal their patterns of co-location, divergence, and mutual influence—an advance over studies that treat these categories in isolation [15,16].
c.
Multi-tool spatial framework. We combine kernel density estimation, standard deviation ellipse, multi-ring buffer analysis, and the Geodetector model [28] to (i) map clustering and directional trends, (ii) trace temporal shifts in centers of gravity, and (iii) quantify each driver’s explanatory power (q-values) and interaction effects under complex human–environment dynamics.
By uniting rigorous GIS-based quantification with a “wise stance” toward landscape complexity [29,30] and engaging with cultural-geography insights on power intensities/forms [31] and culture as assemblage, mediated experience, and forms-of-life [32], our work offers both a replicable analytical framework for heritage corridors and theoretical advances in understanding how spatial processes and cultural meanings co-produce each other.

2. Materials and Methods
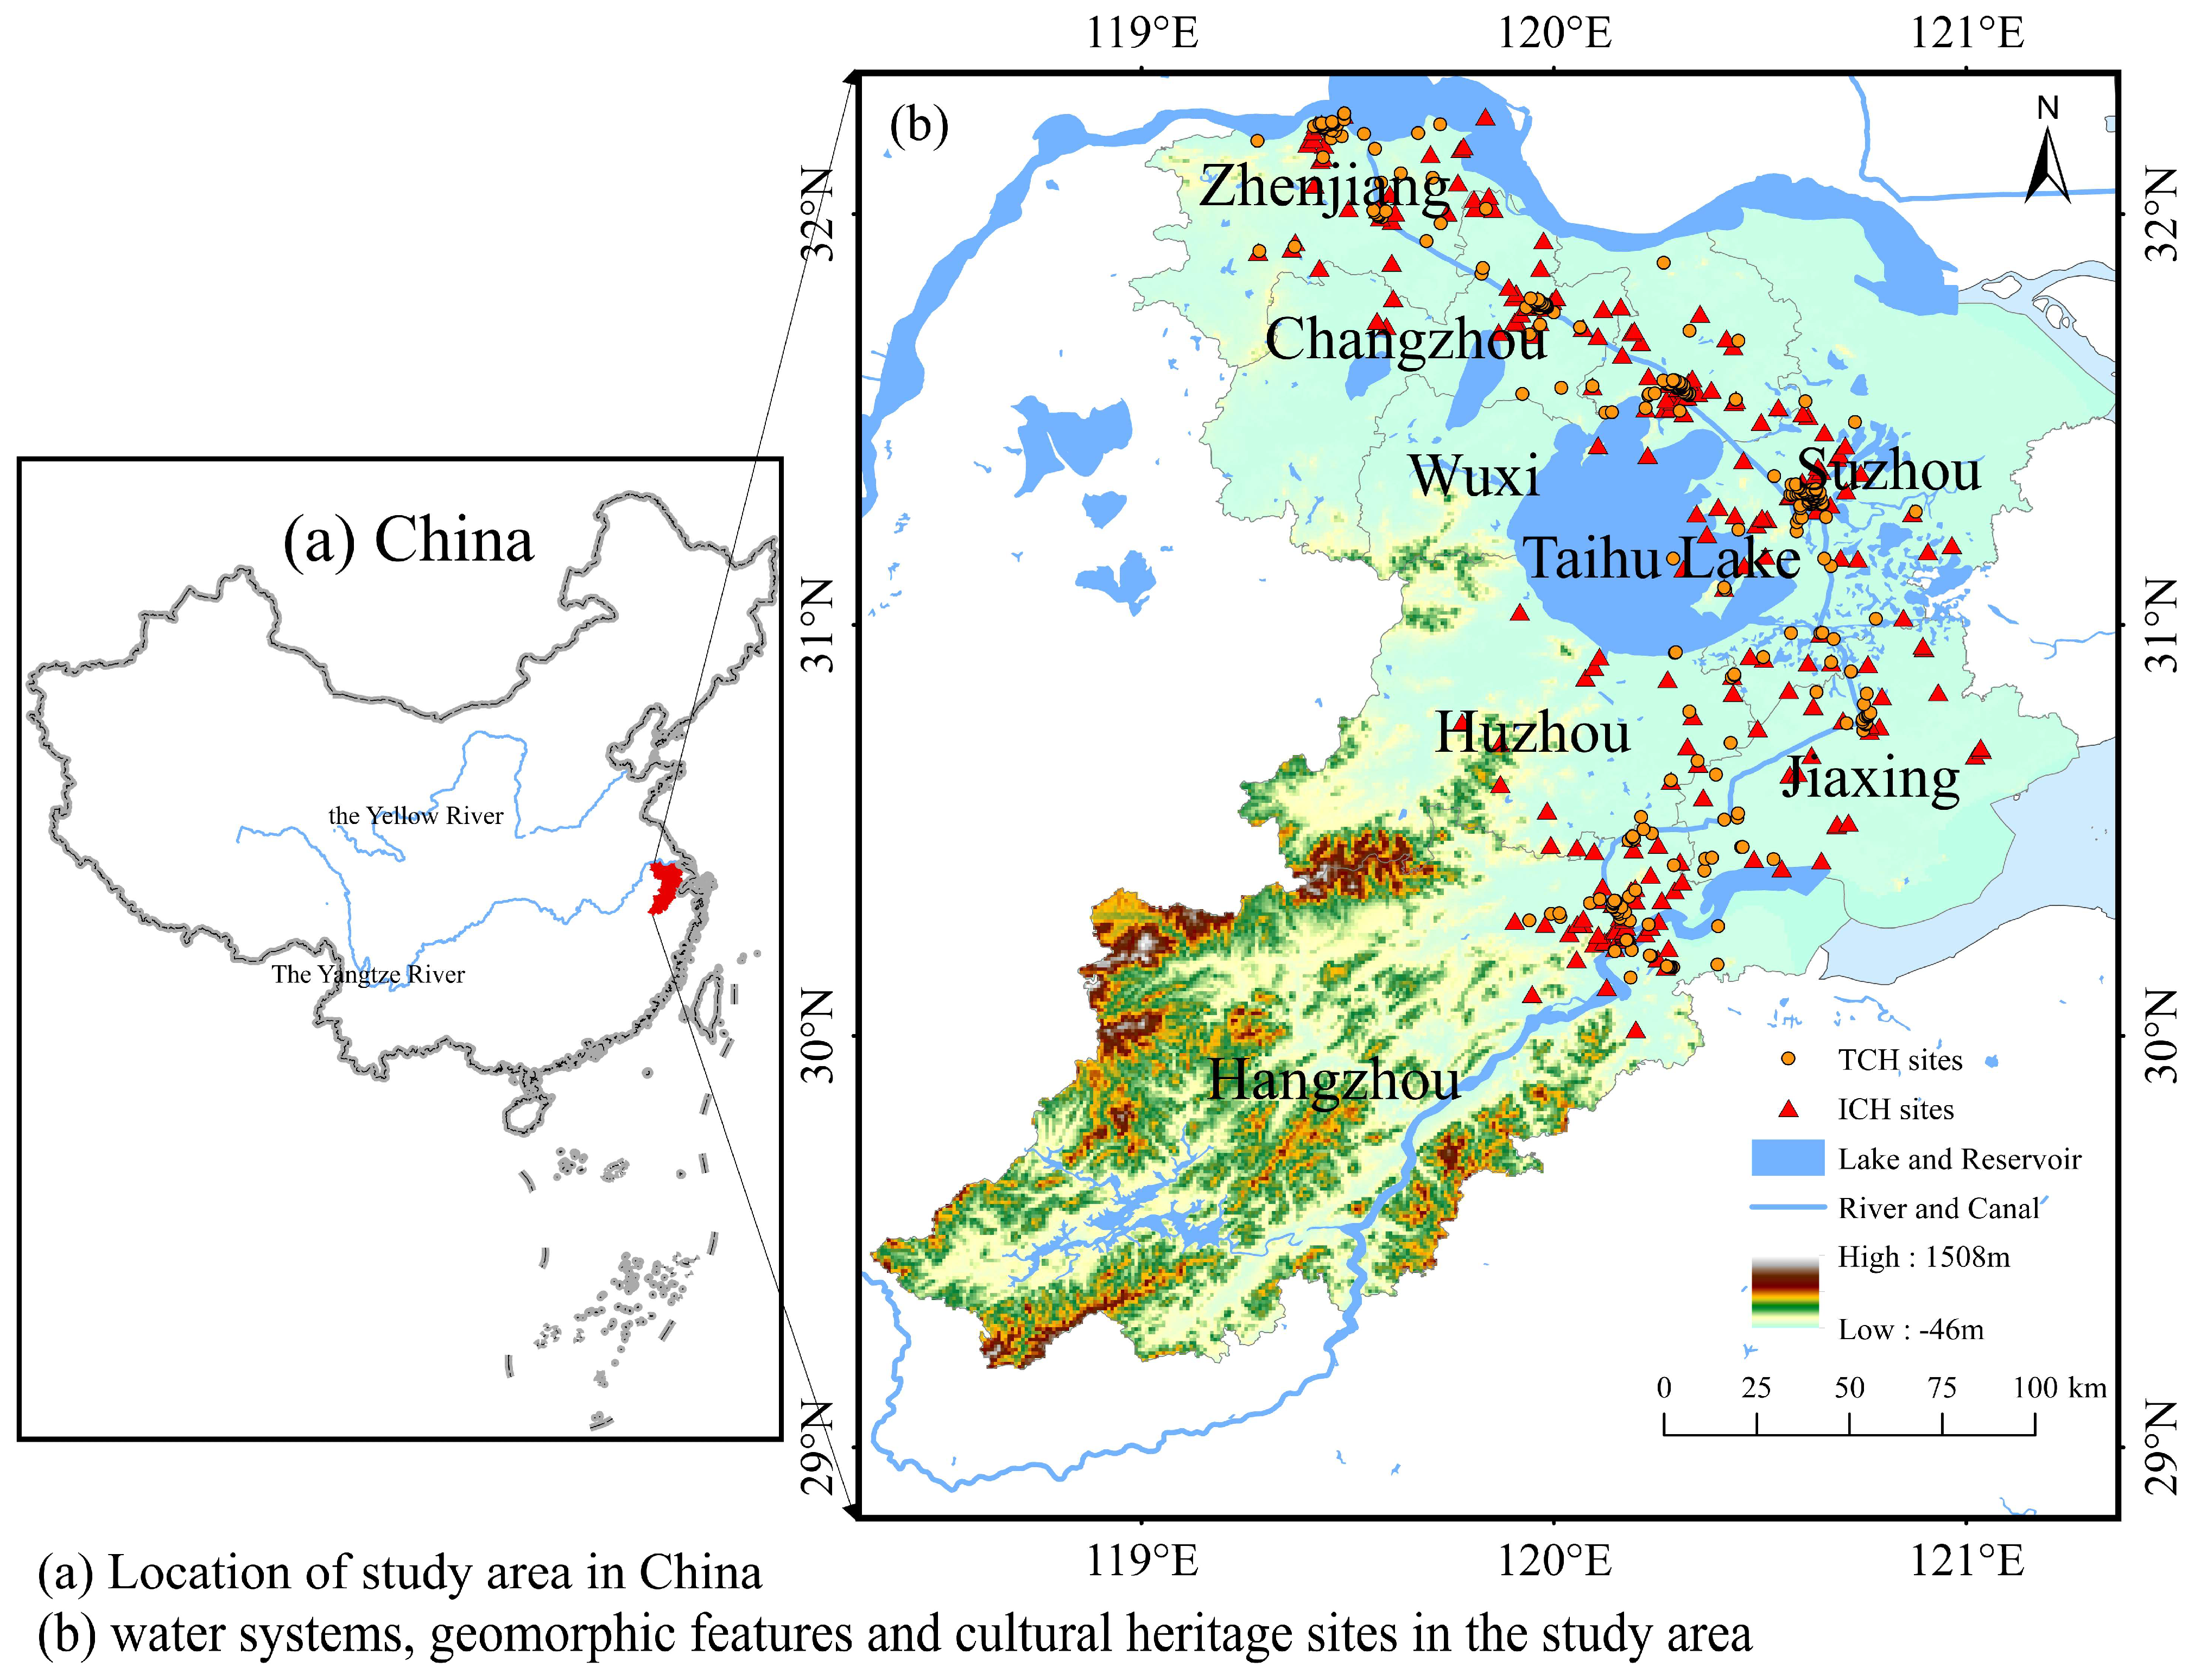
2.1. Study Area

The Beijing–Hangzhou Grand Canal stands as the world’s longest and most extensive ancient canal system, consisting of seven major segments: the Tonghui River, North Canal, South Canal, Lu Canal, Middle Canal, Li Canal, and Jiangnan Canal. Among these, the Jiangnan Canal holds the most significant cultural value within this conservancy system. Through its historical evolutions, it has had a profound and far-reaching impact on the development of regional civilizations. Originating in the Spring and Autumn Period, this ancient waterway has witnessed crucial milestones in its development. These include King Wu Fuchai’s excavation of the Xu River, Emperor Yang of the Sui Dynasty’s opening of the Jiangnan River, and the establishment of direct Beijing–Hangzhou navigation during the Yuan Dynasty. Over more than 2000 years of river management, it has gradually transformed into a vital “golden waterway” that connects the Yangtze River and the Qiantang River. Successive dynasties have dedicated efforts to its continuous dredging and management. Examples include the construction of canal ponds in the Tang Dynasty, the excavation of canal-salt rivers in the Song Dynasty, and the systematic water-conservancy maintenance in the Ming and Qing Dynasties, all of which not only ensured the proper functioning of waterway transportation but also cultivated a distinct canal-based cultural landscape through dynamic adjustments.
Maintaining a 330 km operational waterway, which is the longest extant navigable historical canal segment globally, the Jiangnan Canal meanders through seven prefecture-level cities: Zhenjiang, Changzhou, Wuxi, Suzhou, Huzhou, Jiaxing, and Hangzhou. The canal’s alignment was digitized using vector data from the National Geospatial Information Public Service Platform (https://www.tianditu.gov.cn/, accessed on 18 November 2024), clipped to our study area boundary. Collectively, these cities epitomize China’s typical hydraulic urban complexes. Historically, the Jiangnan Canal has exhibited dual-functional centrality. Economically, it served as a crucial north–south artery for the transportation of bulk commodities such as grains, silks, teas, and ceramics. Culturally, it functioned as a vehicle for the dissemination of poetic traditions, hydraulic engineering knowledge, and urban customs. The canal’s continuous operation not only promoted inter-regional cultural dissemination but also engendered a unique cultural paradigm that fuses local characteristics with universal significance. This paradigm is now acknowledged as a pivotal manifestation of hydraulic civilization within the framework of Chinese cultural identity.
Given the significant historical standing and abundant cultural implications of the Jiangnan Canal and the cities along its course, this research centers on the Jiangnan Canal segment within the Grand Canal and the adjacent cities of Zhenjiang, Changzhou, Wuxi, Suzhou, Huzhou, Jiaxing, and Hangzhou. To comprehensively explore its historical transformations and cultural lineage, the river channels of the Jiangnan Canal section in different historical periods, namely the Spring and Autumn Period (770-476 BC), Sui and Tang Dynasties (581-907 AD), Song and Yuan Dynasties (960-1368 AD), Ming and Qing Dynasties (1368-1912 AD), and the modern era (since 1919), are chosen for digitization. Through the application of digital cartography and historical GIS techniques, this study reconstructs the canal’s palimpsest-like spatial configurations across temporal strata. This process establishes a geotemporal framework for analyzing the distribution patterns of cultural heritage in the Jiangnan Canal corridor. The location of the Jiangnan Canal area and the cultural heritage sites in the area are shown in Figure 1.

2.2. Data Sources

This study targets seven core cities along the Jiangnan Canal (Zhenjiang-Hangzhou section: Zhenjiang, Changzhou, Wuxi, Suzhou, Huzhou, Jiaxing, Hangzhou), systematically collecting multi-source spatiotemporal data on TCH, ICH, and historical canal courses (Figure 1). We focus on five representative historical periods—Prehistoric to Spring and Autumn, Sui–Tang, Song–Yuan, Ming–Qing, and the Modern Era—each chosen for its distinctive developments in canal construction, socio-political organization, and cultural exchange: the Spring and Autumn period marks the canal’s earliest establishment; the Sui–Tang era reflects state-level integration and hydraulic expansion; the Song–Yuan period corresponds to peak commercial growth and cultural flourishing along the waterway; the Ming–Qing dynasties represent the canal’s zenith in both transport and heritage accumulation; and the Modern Era captures post-1919 shifts under industrialization and heritage protection initiatives. TCH data (334 items) were sourced from the Grand Canal Cultural Heritage Protection and Inheritance Plans issued by the governments of Jiangsu and Zhejiang Provinces. ICH data (420 items) were obtained from provincial-level intangible cultural heritage lists of Jiangsu and Zhejiang. Georeferencing procedures implemented in ArcGIS 10.8 transformed all heritage records into spatial point features through WGS1984 coordinate conversion. Historical canal trajectories were digitized through cartographic regression analysis using base maps from the Historical Atlas of China (1982–1988 edition), with spatial accuracy verified against contemporary hydrological data. Ancillary geospatial data, including elevation, nighttime light intensity, and population density (Table 1), were integrated to analyze the spatial distribution patterns of cultural heritage.

2.3. Research Methods

2.3.1. Multiple Ring Buffer

The multiple ring buffer (MRB) technique, a fundamental geospatial analysis tool in Geographic Information Systems, serves to investigate distance-dependent spatial relationships and distribution patterns of geographic features. This research implemented MRB analysis to quantify spatial correlations between the Jiangnan Canal’s primary channel axis and cultural heritage distributions. Using the canal’s central alignment as the baseline, buffers with radii of 10 km, 20 km, and 30 km were established, respectively. This enabled the observation and analysis of the quantity and density of cultural heritage distributed within buffers of different radii, along with the degree of their spatial association with the Jiangnan Canal.

2.3.2. Nearest Neighbor Index

The nearest neighbor index (NNI) is a statistical measure used in spatial analysis to determine whether a set of points exhibits a clustered, random, or dispersed distribution pattern. In this study, the NNI is utilized to examine the spatial distribution types of the Jiangnan Canal’s cultural heritage across different chronological phases. The calculation of the NNI is based on the mean Euclidean distances between adjacent heritage sites within each temporal stratum. This approach, following established spatial statistical methods [45,46], allows for a quantitative classification of spatial distribution patterns. Mathematically, the index is defined as:
R = d d E
d E = 1 2 A n = 1 2 D
In these formulas, d denotes the actual closest proximity, which is the average distance between the nearest cultural heritage sites. dE represents the theoretical closest proximity. A is the area of the study area, specifically the combined area of the seven cities along the Jiangnan Canal in this research. n is the total number of cultural heritage sites within the study area, and D is the number of cultural heritage sites per unit area. The proximity index, R, is computed as the ratio of the actual average closest proximity d to the theoretical closest proximity dE. When R > 1, it implies that the cultural heritage sites are spatially dispersed. When R = 1, it indicates that the cultural heritage sites are randomly distributed. When R < 1, it shows that the cultural heritage sites are spatially clustered [47].

2.3.3. Kernel Density Estimation

Kernel density estimation (KDE) is based on the principle that geographical phenomena display spatially non-uniform occurrence probabilities across different temporal intervals [45,46]. In this research, the KDE approach is employed to generate a kernel density distribution map of cultural heritage. The spatial probability density is directly proportional to the intensity of point clustering. A higher concentration implies a greater likelihood of occurrence, while dispersion indicates a lower probability. By examining the changes in density values and the distribution of high-density and low-density regions within the map, the density of cultural heritage distribution in the study area can be intuitively presented. This, in turn, reveals the impact of the Jiangnan Canal on the formation of the cultural heritage distribution pattern.
f x = 1 n h i = 1 n k x x i h
Let f x denote the kernel density estimation function. In this function, k x x i h is the kernel function, h represents the distance decay threshold, n denotes the number of cultural heritage items, and x x i reflects the distance between the estimated point x and each cultural heritage point x i . A greater value of f x corresponds to a denser distribution of cultural heritage. Mathematically, based on this formula, the kernel density distribution attains its maximum value at the center of each point x i . As the distance from the point x i grows, the density value of f x decreases. When the distance reaches the threshold h , the value of f x approaches zero.

2.3.4. Standard Deviation Ellipse Model

The standard deviation ellipse (SDE) method is employed to analyze the spatial distribution of geographical elements, with the aim of identifying their directional patterns. In this study, a comparative analysis of standard ellipses was conducted for cultural heritage points across different chronological periods. This enabled the determination of both the distribution center of gravity and orientation angle of heritage sites along the Jiangnan Canal. The results elucidate the spatiotemporal clustering trends and dispersion directions of cultural heritage along the canal corridor, as well as the historical migration trajectories of their spatial center of gravity.
S E D x = i = 1 n   x i X ¯ 2 n
S E D y = i = 1 n   y i Y ¯ 2 n
The above formulas are used to determine the location of the center of the ellipse. Here, n represents the total number of cultural heritages. x i ,   y i denotes the longitude and latitude coordinates of individual cultural heritages along the Jiangnan Canal, and X ¯ , Y ¯ is the arithmetic mean center of all cultural heritage points, namely the coordinates of the center of gravity of the cultural heritage distribution [46].
t a n   θ = A + B C
A = i = 1 n   x ~ i 2 i = 1 n   y ~ i 2
B = i = 1 n   x ~ i 2 i = 1 n   y ~ i 2 + 4 i = 1 n   x ~ i y ~ i 2 C = 2 i = 1 n   x ~ i y ~ i
C = 2 i = 1 n   x ~ i y ~ i
The above formula is used to determine the azimuth of the ellipse θ . Here, x ~ i ,   y ~ i represents the deviation between the arithmetic-mean center and the x , y coordinates. Through this determination, the primary directions of the cultural heritage distribution can be explored.
σ x = 2 i = 1 n   x i ¯ c o s   θ y i ¯ s i n   θ 2 n
σ y = 2 i = 1 n   x i ¯ s i n   θ y i ¯ c o s   θ 2 n
The above formulas are utilized to determine the lengths of the semi-major and semi-minor axes of the ellipse. In this research, the semi-major axis represents the primary directional orientation of the cultural heritage distribution, while the semi-minor axis quantifies its spatial concentration. A shorter semi-minor axis signifies stronger centripetal clustering of heritage points, reflecting a more concentrated distribution. Conversely, a longer semi-minor axis suggests a broader dispersion. The directional tendency of the distribution intensifies as the disparity between the semi-major and semi-minor axes increases, quantified by a higher flattening value of the ellipse. When the semi-major and semi-minor axes are equal (forming a perfect circle), the distribution exhibits no directional characteristics.

2.3.5. Geodetector Model

The Geodetector Model, a sophisticated statistical toolset, is capable of quantitatively evaluating spatial heterogeneity and identifying influencing factors [28,45,48]. In this study, we utilized the Geodetector Model, specifically its dissimilarity and factor—detection components [49,50], to investigate the spatial differentiation of cultural heritage sites in cities along the Jiangnan Canal. Our objective was to determine how various factors affect this spatial variation. The calculation formula for the key statistical metric, the q-statistic, within the Geodetector model is shown as follows:
q = 1 h = 1 L N h σ h 2 N σ 2
In the above formula, the q-statistic serves to measure the capacity of factor X to account for the spatial differentiation of a geographic attribute. Here, L represents the stratification of factor X. N h and N denote the number of elements in stratum h and the total number of elements in the entire area, respectively. σ h 2 is the variance within stratum h , and σ 2 is the overall variance of the entire study area. The value of the q-statistic ranges from 0 to 1. A larger q-statistic indicates a stronger ability of the factor to explain a geographic phenomenon, while a smaller value implies a weaker explanatory power [51].

3. Results and Analysis

3.1. Spatiotemporal Distribution of Jiangnan Canal Cultural Heritage

3.1.1. Spatiotemporal Distribution of TCH

The study area encompasses 334 TCH items. According to the relevant plans for heritage protection in Jiangsu and Zhejiang Province, the TCH items were classified into 144 core heritage sites directly associated with canal construction and hydraulic engineering remains; and 190 related heritage sites that include historic districts, ancient buildings, and stone inscriptions emerging alongside regional development. The distribution of Core and related TCH and corresponding rivers in the five historical periods are shown in Figure 2. Spatiotemporal overlay analysis demonstrates temporal fluctuations in the number of heritage items across different chronological phases. In contrast, spatial clustering patterns along the canal remain consistent over time.
According to the classification scheme issued by China’s State Administration of Cultural Heritage (SACH), TCHs are grouped into six typological categories based on their physical manifestation [52]. The number of TCH sites of different types in each historical period is shown in Table 2. The quantitative analysis of the six types of TCH in all periods is summarized as follows. (1) Ancient architecture (132 items): this category includes cultic structures (e.g., temples, churches), vernacular dwellings (e.g., former residences), scholarly complexes (e.g., academies), and vertical landmarks (e.g., pagodas). (2) Important historical sites and representative buildings (111 items): these comprise commemorative landmarks (e.g., revolutionary monuments), preserved urban ensembles (e.g., the Qingming bridge historical block), institutional legacies (e.g., the former site of Soochow University), and notable residences (e.g., the Sheng Xuanhuai Residence). (3) Relics of canal water conservancy projects (49 items): this group features hydraulic infrastructure remnants, such as the Suzhou Tang lock complex and Dantu Canal segments. (4) Ancient ruins (22 items): representative examples include the Helu City ruins (Changzhou) and Longshan Sluice Ruins (Hangzhou). (5) Stone carvings (13 items): notable instances are the Heart Sutra Stele (Wuxi) and Yidu Stele of the Grand Canal (Zhenjiang). (6) Ancient Tombs (7 items): these encompass tombs such as the Shen Shixing Tomb (Suzhou) and Zhao Boshen Tomb (Zhenjiang).

3.1.2. Spatiotemporal Distribution of ICH

The study area comprises 420 ICH items, which are categorized based on their scale of influence and cultural dissemination into three administrative tiers: 123 at the national level, 213 at the provincial level, and 83 at the municipal level [27,53]. The spatial distribution of ICH exhibits temporal variations across distinct historical periods (Figure 3). Notably, the Ming and Qing dynasties are characterized by the highest spatial density of ICH items (Figure 3d), reflecting intensified cultural activities during these eras.
Adopting the ten-category framework of the National Intangible Cultural Heritage Representative List and aligned with the UNESCO Convention for the Safeguarding of the Intangible Cultural Heritage [54,55], ICHs are systematically classified into ten typologies (Table 3). Systematic classification identifies ten typologies of ICH (Table 3) [47,56], categorized as follows. (1) Traditional skills (138 items): this is the largest category, exemplified by distinctive practices such as the techniques for making Suzhou ethnic musical instrument crafting and Yixing Celadon porcelain techniques. (2) Folkways (56 items): this category documents region-specific practices, such as Hangzhou Canal boatmen customs and Jingshan tea ceremony. (3) Traditional arts (45 items): iconic forms, like the Huishan clay figurines from Wuxi, are characteristic of this category. (4) Traditional dance (39 items): the Jiangtang horse-lantern dance in Changzhou serves as a prime example. (5) Folk literature (31 items): it preserves narratives such as the legend of the white snake. (6) Dramatic balladry (31 items): performance traditions like Suzhou Pingtan storytelling are included here. (7) Traditional music (28 items): it encompasses ritual repertoires, such as Wuxi Taoist music. (8) Traditional medicine (20 items): this category covers pharmaceutical systems like Zhihetang medicinal paste preparation technology. (9) Traditional drama (17 items): it sustains theatrical forms, with Kunqu opera being a prominent example. (10) Traditional sports, recreation, and acrobatics (15 items): physical traditions, exemplified by the eighteen martial arts techniques, are safeguarded.
To visually characterize the content attributes of intangible cultural heritage (ICH) along the Jiangnan Canal [57], a content analysis incorporating word cloud visualization was conducted on the study subjects. The analytical results (Figure 4) reveal that the 420 documented ICH elements are predominantly associated with two dimensions: (1) distinctive cultural expressions, and (2) adaptive livelihood patterns within the Jiangnan Canal Basin. Representative cases include legends, embroidery traditions, and operatic forms exemplifying cultural characteristics, while craftsmanship systems (e.g., bamboo weaving, tea processing) and transportation-related practices (e.g., boat-building techniques) reflect locally adapted livelihood strategies.

3.2. Analysis Results of Multiple Ring Buffer

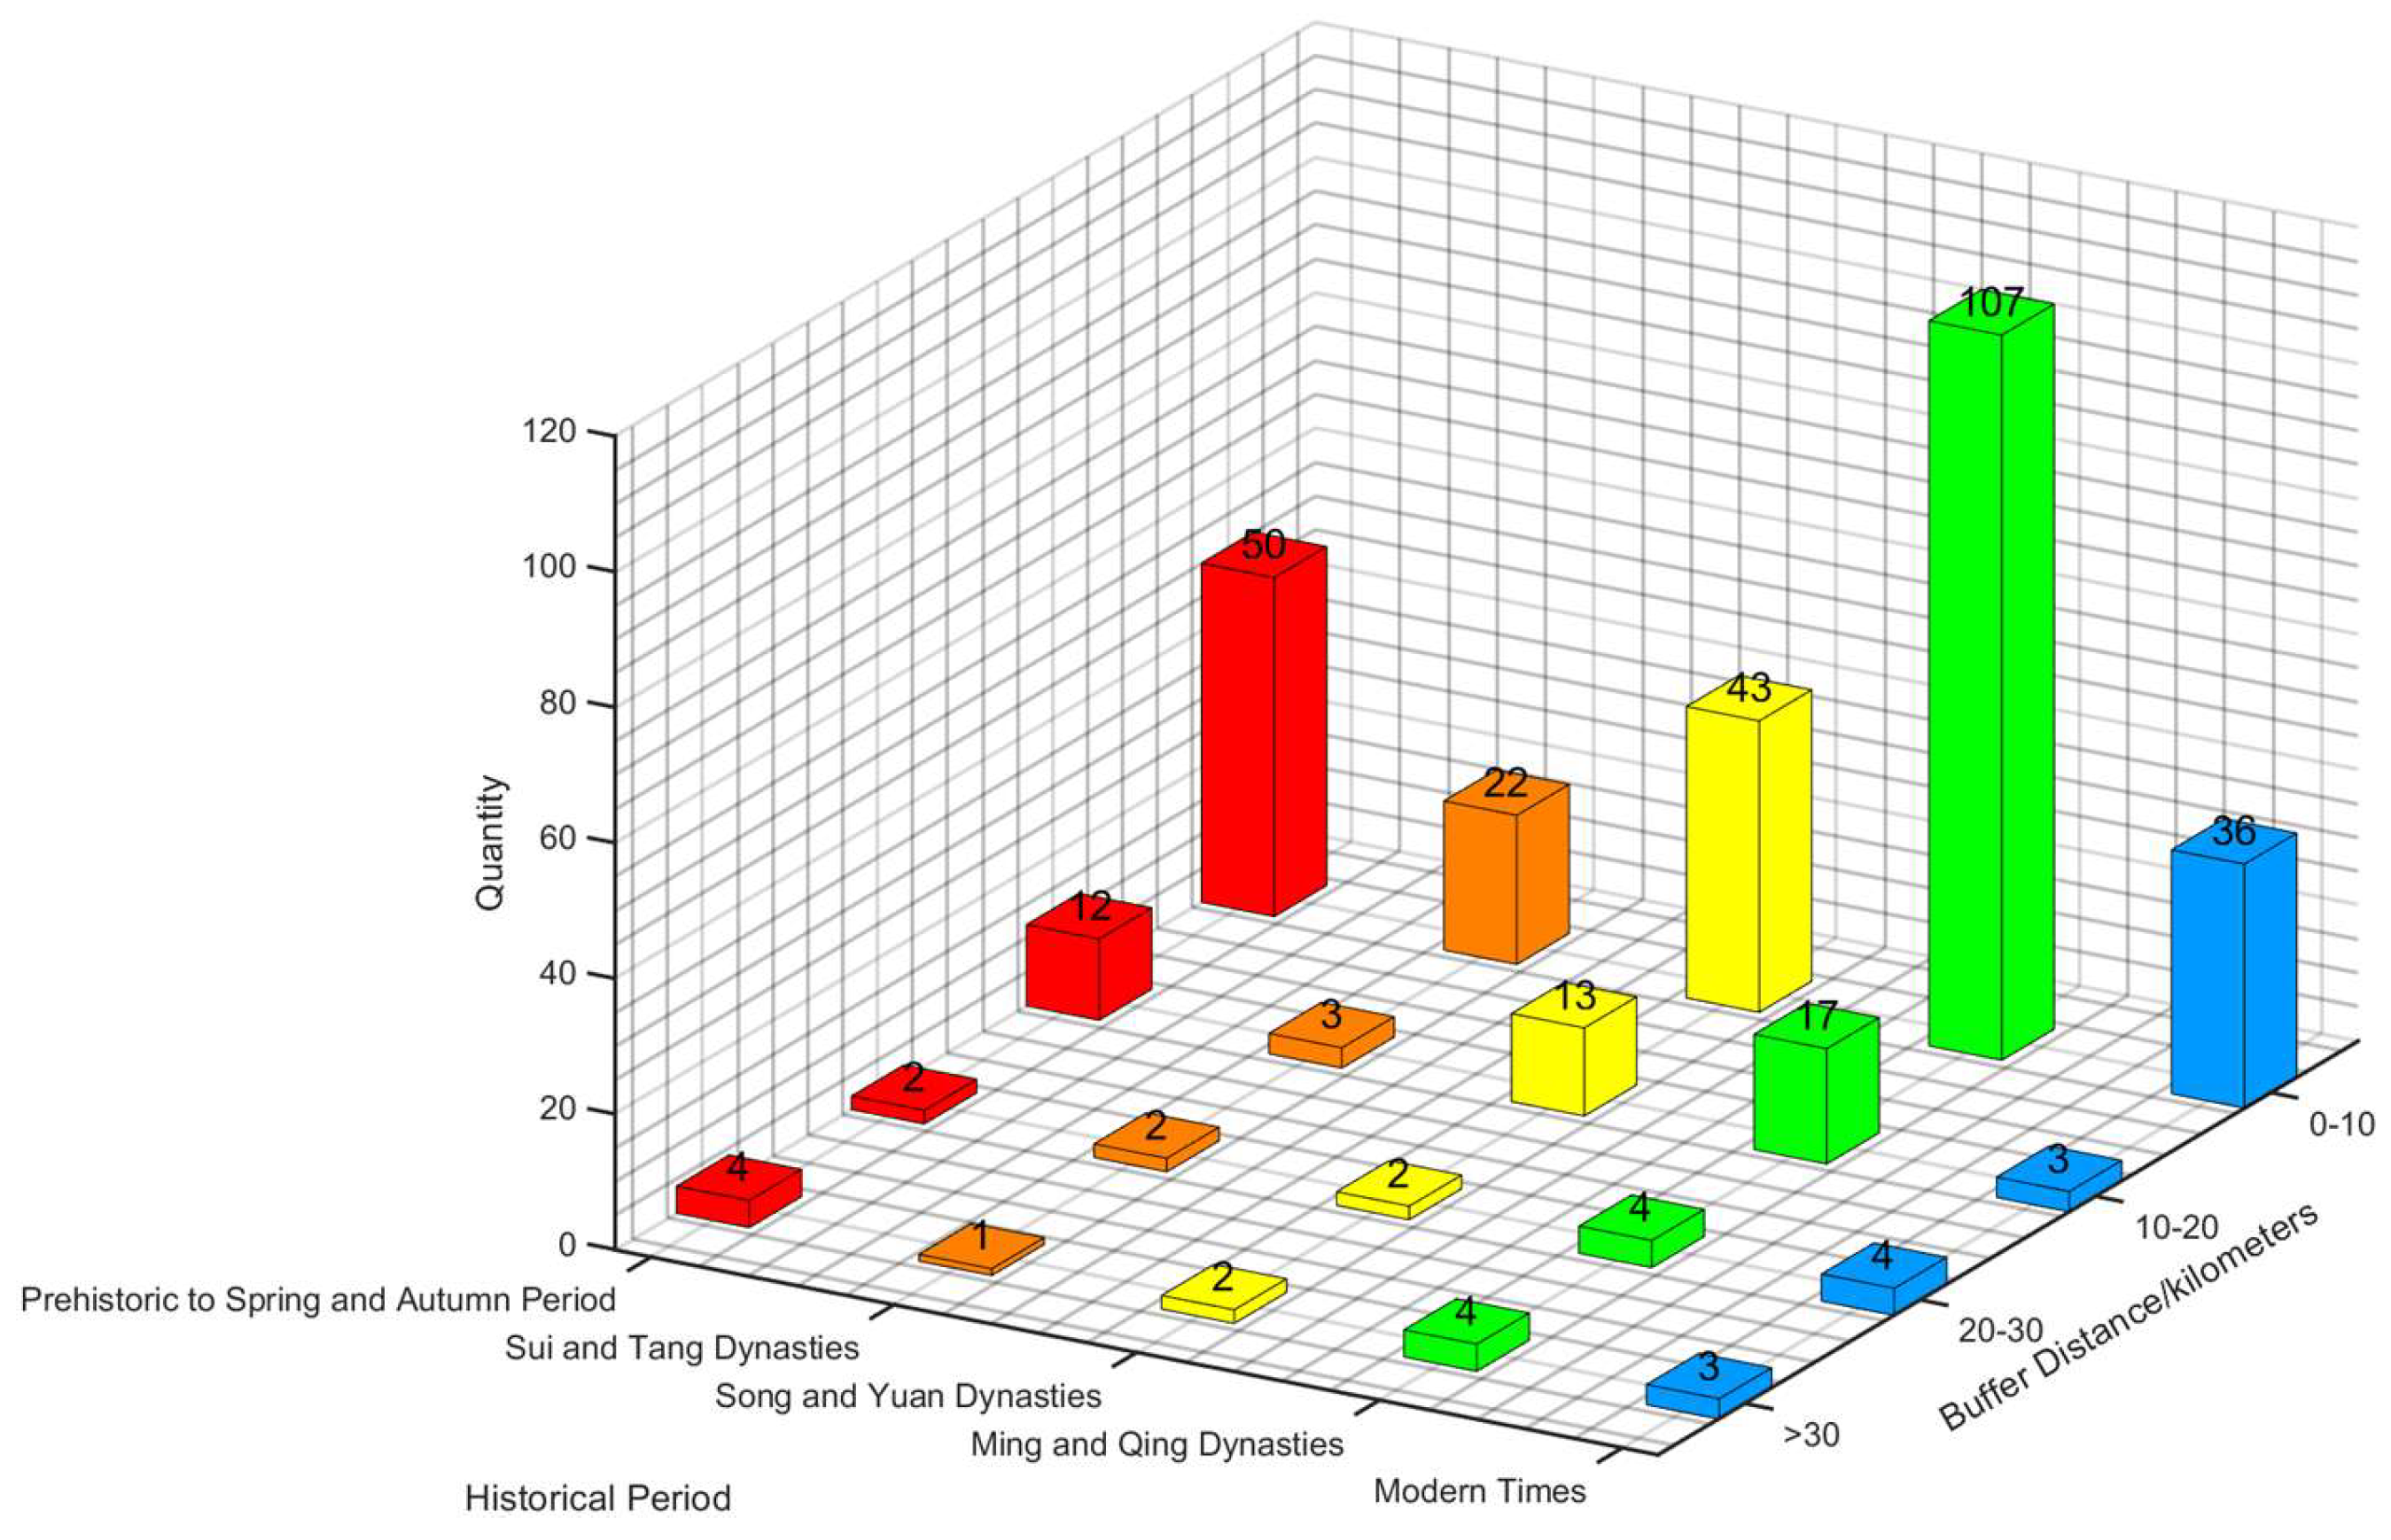
3.2.1. Results of TCH Analyzed by MRB

Spatial intersection analysis was performed between multi-ring buffers (with a 10 km interval) generated along the central axis of the Jiangnan Canal and the TCH sites across historical periods. The results revealed a distinct distance-decay pattern (Figure 5). The 0–10 km buffer zone encompassed 77.2% (258 out of 334) of all TCH, distributed as follows: 50 sites from the prehistoric to spring and autumn period, 22 from the Sui and Tang Dynasties, 43 from the Song and Yuan Dynasties, 107 from the Ming and Qing Dynasties, and 36 in modern times. In contrast, only 4.2% (14 out of 334) of TCH were located beyond 30 km, with the breakdown being four from the prehistoric to spring and autumn period, one from the Sui and Tang Dynasties, two from the Song and Yuan Dynasties, four from the Ming and Qing Dynasties, and three in modern times. Overall, in terms of spatial distribution, the TCH exhibited an obvious aggregation characteristic centered around the canal. The vast majority of TCH was concentrated within the 0–10 km buffer zone adjacent to the Jiangnan Canal. This distribution likely stems from the canal’s role as a hub for economic and cultural exchange, underscoring its enduring influence on TCH formation.

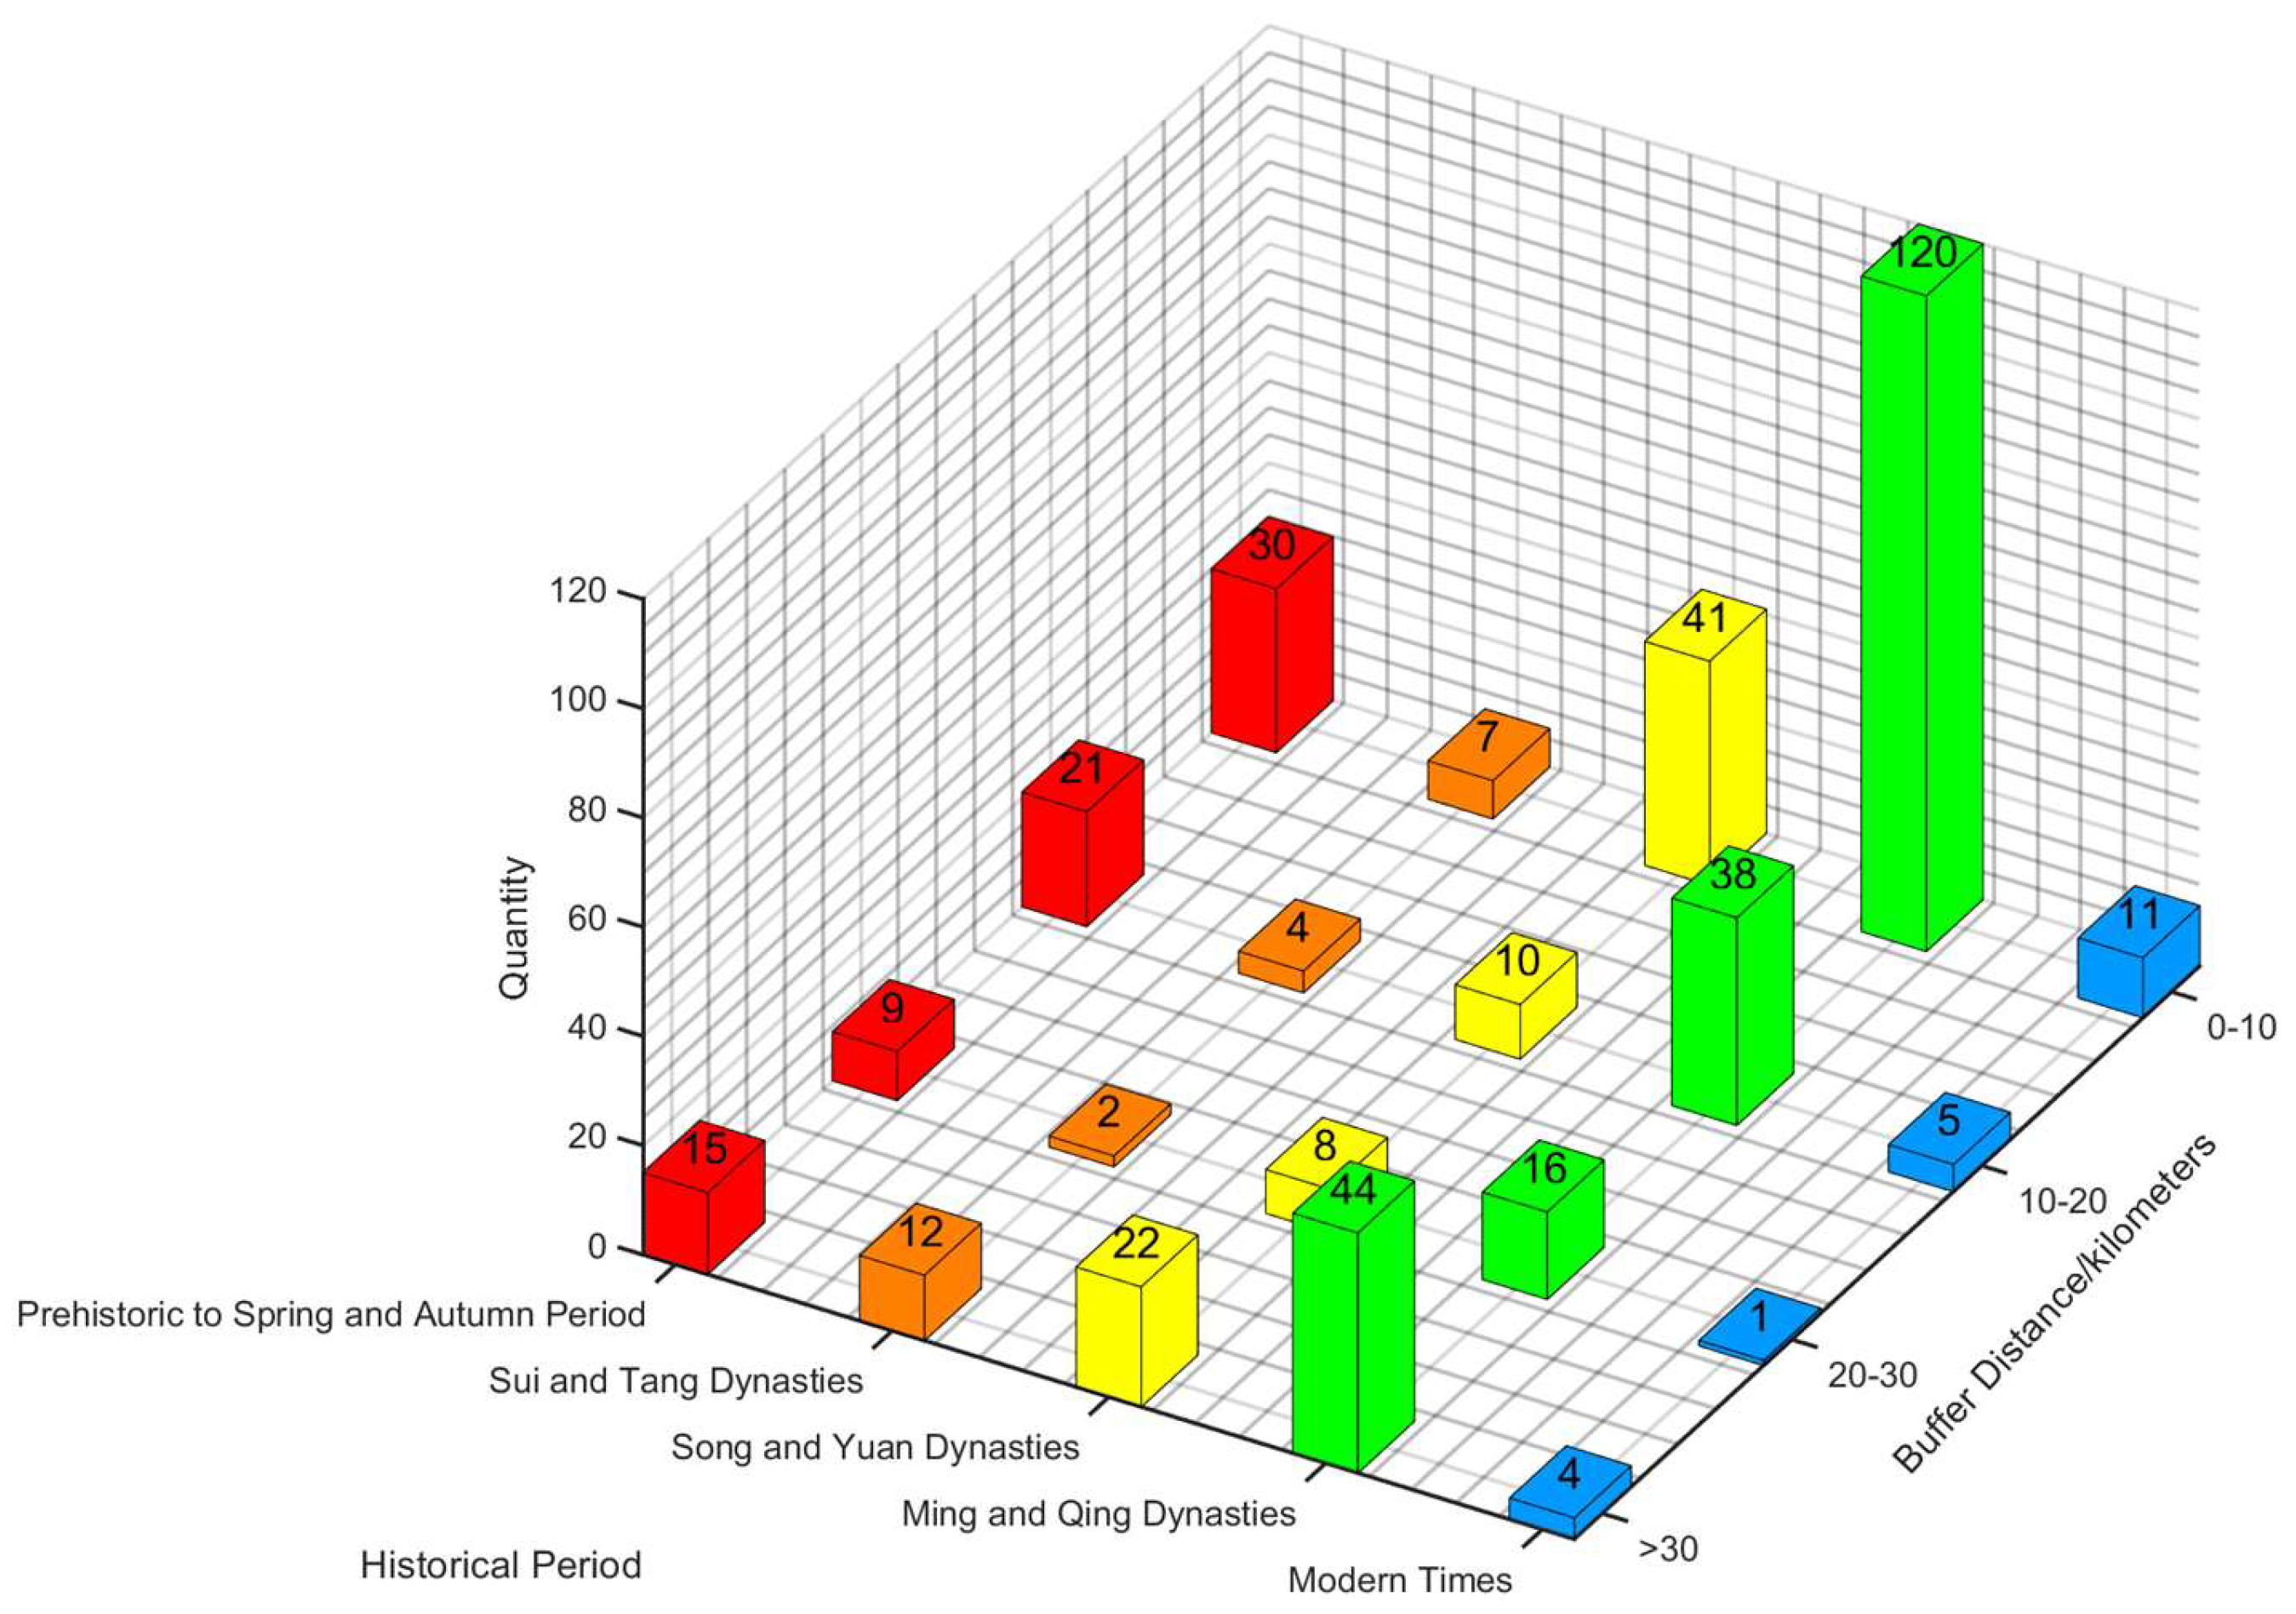
3.2.2. Results of ICH Analyzed by MRB

Spatial intersection analysis between the 10 km interval buffers along the Jiangnan Canal and ICH elements unveiled distinct spatial dynamics (Figure 6). Specifically, 49.8% (209 out of 420) of the ICH elements were clustered within a 0–10 km range from the waterway. Notably, 22.6% (95 out of 420) exhibited a non-monotonic distribution beyond 30 km, with density rebounds observed across historical periods: prehistoric to spring and autumn period (15 items beyond 30 km compared to 9 in the 20–30 km range), the Sui and Tang Dynasties (12 compared to 4 in the 10–20 km range and 2 in the 20–30 km range), the Song and Yuan Dynasties (22 compared to 10 and 8), the Ming and Qing Dynasties (44 compared to 38 and 16), and modern times (4 compared to 5 and 1). This bimodal distribution pattern implies that multiple factors drive the spatial distribution of ICH. Nevertheless, the canal’s gravitational influence remains predominant, as evidenced by 209 elements (49.8%) concentrated within the 0–10 km zone.

3.3. Analysis Results of NNI

3.3.1. Results of NNI Analysis of TCH over Time

The NNI analysis reveals clustered distributions of TCH across all historical periods, with NNI values consistently remaining below 1 (Table 4). This quantitative evidence confirms that their distribution patterns are all of the clustered type. Remarkable spatial clustering was detected in the prehistoric to spring and autumn period (NNI = 0.62, z = −5.92, p = 0), the Song and Yuan Dynasties (0.50, −7.45, 0), the Ming and Qing Dynasties (0.41, −12.93, 0), modern times (0.38, −8.00, 0), and the aggregated periods (0.39, −21.34, 0). The Sui and Tang Dynasties displayed distinct spatial dynamics: while retaining significant clustering (NNI = 0.74, z = −2.64, p = 0.008), its expansive distribution was evidenced by an increased average observed distance (10,333 m) compared to the expected values (13,997.62 m), indicating that canal development during this era facilitated the dispersion of TCH beyond core areas.

3.3.2. Results of NNI Analysis of ICH over Time

ICH exhibited uniformly clustered distributions (NNI < 1) across all historical periods, fully aligning with TCH patterns (Table 5). The strongest clustering was observed in the Ming–Qing (z = −12.44, p = 0) and aggregated periods (z = −19.63, p = 0), demonstrating statistically robust spatial concentration. Moderate clustering was identified in the prehistoric to spring and autumn period (z = −4.57, p < 0.001), Sui and Tang Dynasties (z = −3.62, p = 0.001), and Song and Yuan Dynasties (z = −3.92, p < 0.001), whereas modern times exhibited marginal significance (z = −1.08, p = 0.282). Therefore, the analysis confirms that ICH across all historical periods (excluding modern times) exhibits statistically significant clustered distribution patterns.

3.4. Analysis Results of Kernel Density Estimation

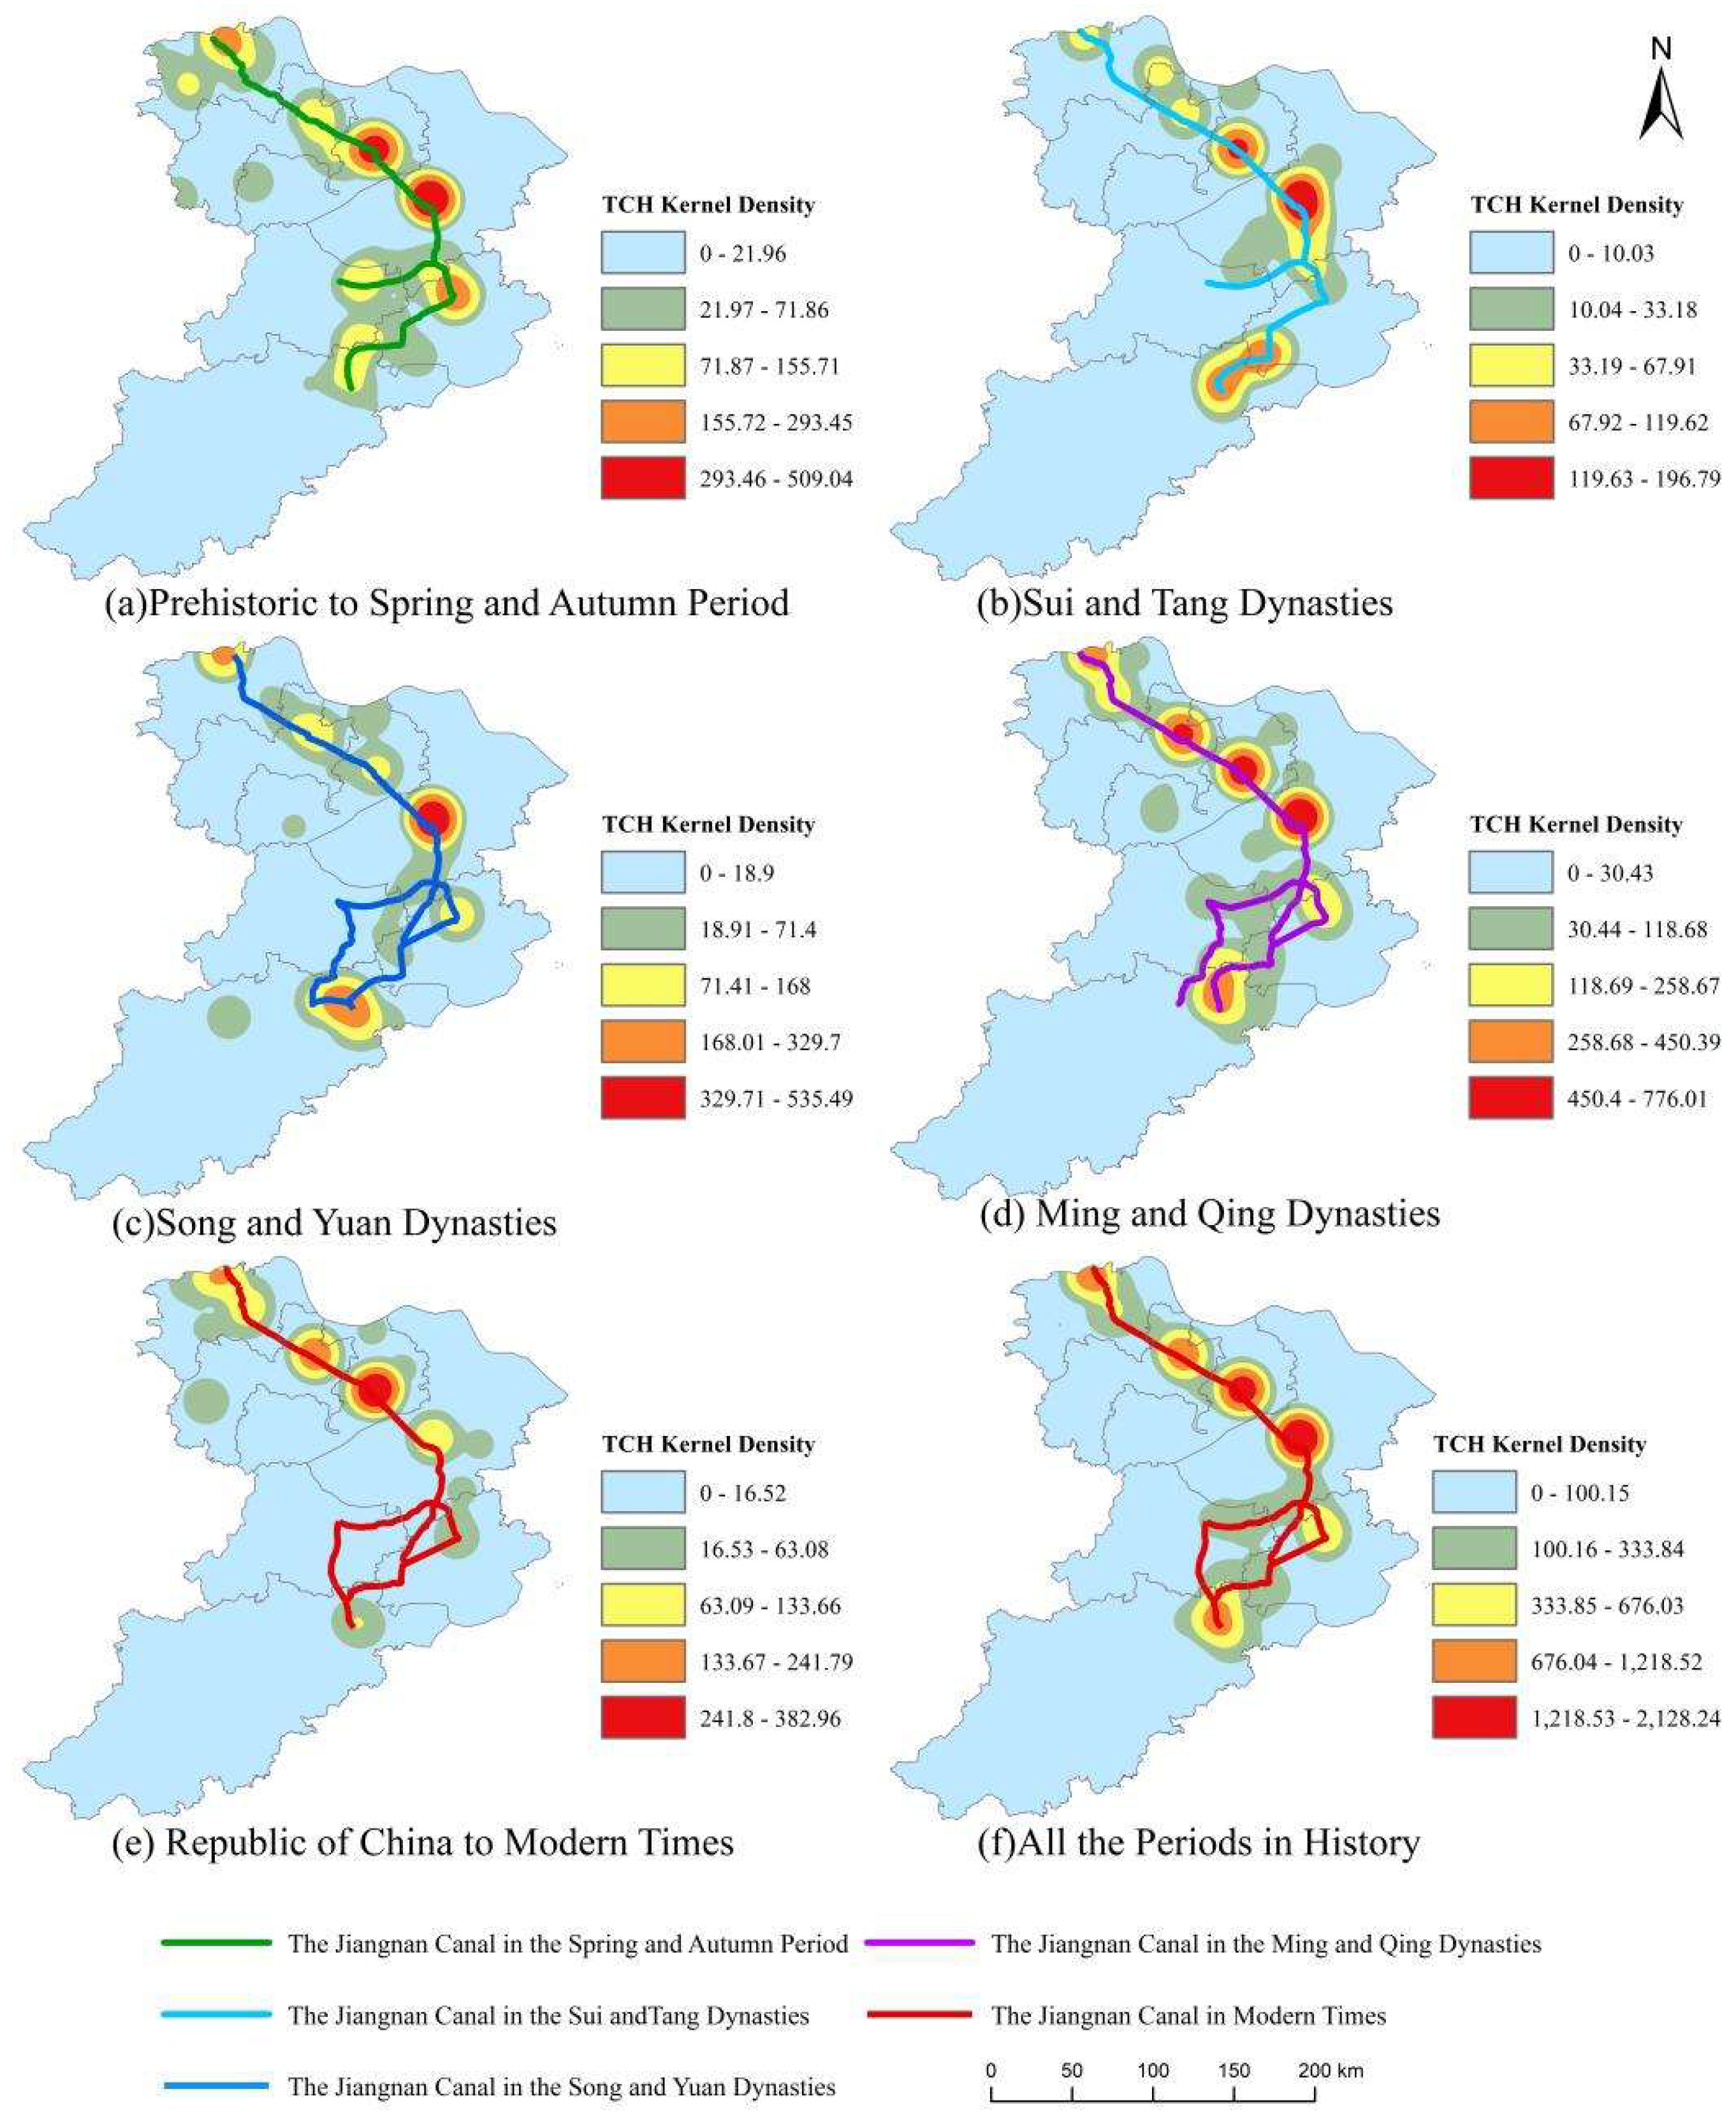
3.4.1. Results of KDE Analysis of TCH over Time

KDE analysis revealed significant spatial heterogeneity in the distribution of TCH across cities along the Jiangnan Canal cities (Figure 7). A consistent “one axis and many cores” configuration persisted throughout all historical periods, with the canal functioning as the central axis, while the quantity and density of core areas evolved temporally.
During the prehistoric to spring and autumn period, high-density cores were principally concentrated in Jingkou District (Zhenjiang), Liangxi/Huishan Districts (Wuxi), Huqiu District (Suzhou), and Nanhu District (Jiaxing). By the Sui and Tang Dynasties, the core areas migrated to Liangxi/Huishan Districts (Wuxi), Huqiu District (Suzhou), and a distinct strip-like high-density zone formed along the Jiaxing–Hangzhou municipal boundary, displaying a linear spatial configuration parallel to the canal route. In the Song and Yuan Dynasties, density cores were centered in the Liangxi/Huishan Districts (Wuxi) and Gongshu District (Hangzhou). The Ming and Qing Dynasties marked the peak of core development, with unprecedented density convergence in Jingkou (Zhenjiang), Zhonglou (Changzhou), Liangxi/Huishan (Wuxi), Huqiu (Suzhou), and Gongshu (Hangzhou), directly mirroring commercial intensification at canal lock hubs. In modern times, core contraction occurred, though density clusters persisted in Zhonglou (Changzhou) and Liangxi/Huishan (Wuxi).
As depicted in the historical development analysis (Figure 7f), the high-density TCH core areas invariably coincide with the Jiangnan Canal corridor. This spatial correlation evinces the canal’s substantial impact on both the emergence and distribution patterns of TCH. Functioning as a critical transportation artery, the waterway not only provided essential resources for TCH creation but also facilitated interregional cultural exchanges, thereby shaping the observed distribution patterns.

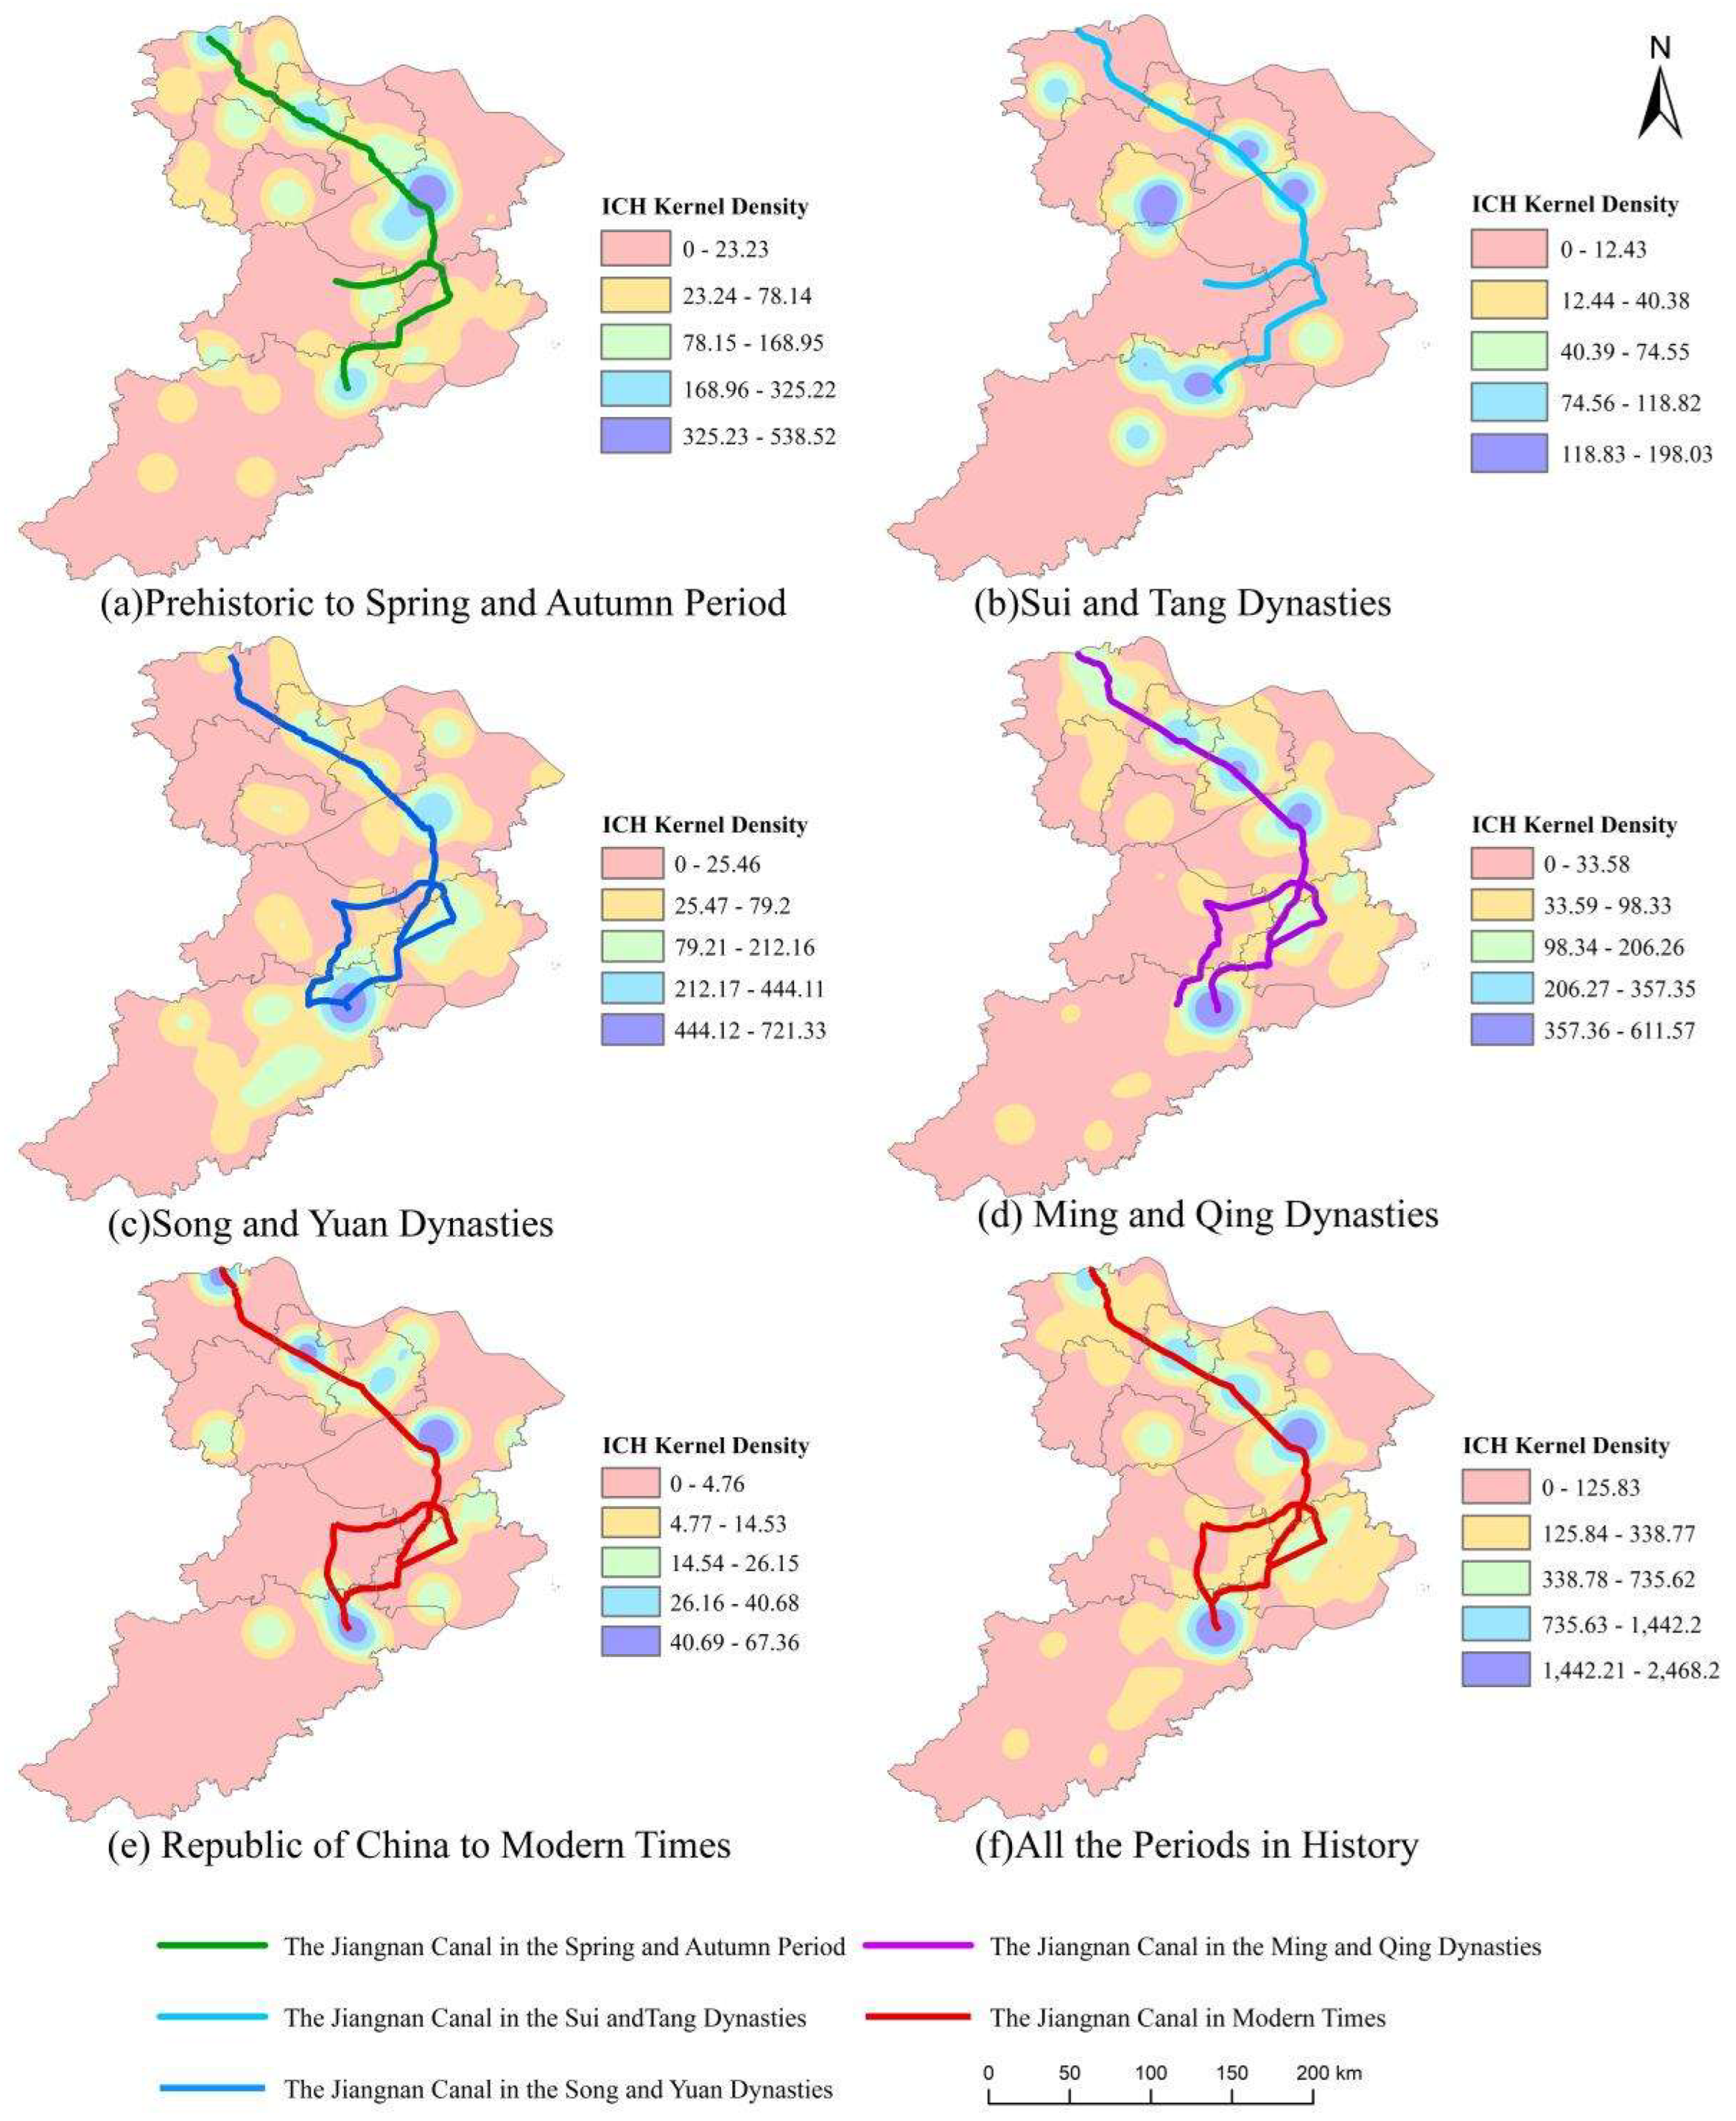
3.4.2. Results of KDE Analysis of ICH over Time

Based on the KDE-derived map of ICH (Figure 8), ICH displays diverse and complex distribution characteristics across different periods.
The KDE analysis of ICH revealed evolving spatial patterns throughout historical periods (Figure 8). During the prehistoric to spring and autumn period, ICH manifested a dispersed distribution, featuring a primary core in Huqiu District (Suzhou) and scattered sub-cores across the study area. In the Sui and Tang Dynasties, emerging clusters came into existence in Liangxi District (Wuxi), Yixing City, Huqiu District (Suzhou), and Gongshu District (Hangzhou). By the Song and Yuan Dynasties, a dominant core took shape in Gongshu District (Hangzhou), and the secondary cores exhibited belt-like distribution patterns along the canal corridor, showing axial alignment (NW-SE orientation) with the canal corridor. The Ming and Qing Dynasties witnessed spatial consolidation, establishing a “one axis and many cores” pattern along the canal axis, with high-density clusters in Huishan District (Wuxi), Huqiu District (Suzhou), and Gongshu District (Hangzhou). In Modern Times, while retaining an affinity for the canal axis, ICH clusters displayed increased dispersion compared to previous periods.
The comprehensive kernel density analysis of ICH across all historical periods (Figure 8f) yields two key findings: firstly, high-density core zones primarily cluster along the Jiangnan Canal, with remarkable concentrations in Huqiu District (Suzhou City) and Gongshu District (Hangzhou City). Secondly, the spatial configuration has evolved sequentially from dispersed distributions in the early periods to canal-aligned aggregation patterns in the later historical phases. These spatiotemporal dynamics validate the canal’s pivotal role in shaping ICH distribution. Meanwhile, the observable overlaps among high-density zones across different periods unveil the sustained spatial inheritance along this water conservancy corridor.

3.5. Analysis Results of Standard Deviation Ellipse

3.5.1. Results of TCH Analyzed by SDE

The center of gravity of TCH exhibits phased spatial shifts across historical periods (Figure 9) while maintaining a consistent distribution around Taihu Lake. During the prehistoric to spring and autumn period, the TCH center of gravity was located northeast of Taihu Lake. During the Sui and Tang Dynasties, the center of gravity migrated southeastward. In the Song and Yuan Dynasties, it shifted southwestward. By the Ming and Qing Dynasties, it had shifted further northwestward. Notably, all aforementioned TCH centers of gravity remained within Taihu Lake’s hydrological boundaries. In modern times, however, the center of gravity has undergone pronounced northwestward displacement, settling in Huishan District (Wuxi City). The composite center of gravity (derived from all historical TCH points) remains within Taihu Lake, exhibiting spatial proximity to the prehistoric spring and autumn period and Ming–Qing centers of gravity.
The SDE analysis exhibits directional alignment with the Jiangnan Canal’s northwest-southeast orientation across all periods, despite minor variations. Each period’s ellipse displays distinct geometric traits: elongated major axes, compressed minor axes, and elevated flattening rates. These metrics quantitatively reflect TCH’s linear clustering along the canal corridor. This spatial pattern underscores the canal’s dual role: beyond its transportation utility, it served as a catalyst for cultural diffusion and integration, evidenced by TCH’s linear clustering.

3.5.2. Results of ICH Analyzed by SDE

The spatial distribution center of gravity of ICH exhibited phased shifts across different historical periods while remaining anchored in the southern Taihu Lake region (Figure 10). From prehistoric times to the spring and autumn period, the center of gravity of ICH was situated in the central Taihu Lake area. During the Sui-Tang dynasties, this center of gravity migrated southwestward to the southwestern lakeshore within Huzhou territory, correlating with the emergence of Huzhou as a tea culture hub in the Tang era. The Song–Yuan period witnessed a southeastward shift toward the direction of Hangzhou, influenced by the canal construction in the Zhejiang section of the Beijing–Hangzhou Grand Canal during the Yuan dynasty, demonstrating the spatial traction effect of hydraulic engineering on cultural heritage distribution. Throughout the Ming–Qing dynasties and modern times, the center of gravity of ICH experienced a slight northward drift yet maintained its primary distribution along the eastern lakeshore. This spatial pattern correlates with two historical realities: Firstly, the Jiangnan Canal’s alignment along Taihu Lake’s eastern-southern margins formed a physical corridor for cultural transmission. Secondly, the sustained economic development and population concentration in the Jiangnan region since the Tang–Song periods provided enduring momentum for ICH creation and inheritance.
SDE analysis confirms the alignment of ICH distributions along the Jiangnan Canal across all periods. With the exception of the ellipse in the Song and Yuan Dynasties, which is oriented along the Zhejiang section of the Jiangnan Canal in a northeast–southwest direction, the ellipses in the other periods are all aligned along the Jiangsu section of the Jiangnan Canal in a northwest-southeast direction. The Song–Yuan period features the most elongated ellipses, indicating the strongest canal axis distribution patterns. In contrast, the ellipses from other periods display minimized axial differentiation, exhibiting near—circular geometries. This morphological evidence reveals that while maintaining distribution along the Jiangnan Canal’s axis, ICH elements in these epochs simultaneously exhibited substantial spatial dispersion perpendicular to the waterway. This spatiotemporal correspondence underscores the Zhejiang canal section’s exceptional role in ICH formation during the Song–Yuan period, potentially linked to new navigation channel construction. Conversely, the Jiangsu Canal segment remained the principal driver of ICH in other periods.

3.6. Analysis of Results from the Geodetector Model

KDE was utilized to quantify the spatial distribution patterns of cultural heritage. Five influencing factors were systematically selected (Figure 11): (X1) distance to Jiangnan Canal, (X2) topographic elevation, (X3) economic factor, quantified by gross domestic product (GDP), (X4) population density, and (X5) human activity intensity, indicated by nighttime light intensity [58,59].
Geodetector modeling was conducted separately for TCH and ICH, resulting in distinct explanatory patterns (Figure 12). For TCH, nighttime light intensity (q = 0.368) exhibited the strongest spatial explanatory power, followed by canal proximity (q = 0.362). Population density (q = 0.278) and economic development (q = 0.250) followed sequentially, while topographic elevation showed minimal influence (q = 0.084). ICH distribution was predominantly explained by nighttime light intensity (q = 0.384), retaining consistent primacy among drivers. Subsequent explanatory factors included population density (q = 0.318), economic development (q = 0.309), and canal proximity (q = 0.288). Topographic elevation again registered the weakest explanatory power (q = 0.092).
The Geodetector results systematically reveal that human activity intensity (measured through nighttime light intensity) exhibited the strongest explanatory power for both TCH and ICH distributions. This quantitative evidence validates anthropogenic agency as the fundamental catalyst in heritage formation processes, where sustained human–environment interactions generate cumulative cultural landscapes. Since ancient times, human settlements have mostly been built along water bodies [8], and the relatively high q-statistics value of the distance-to-Jiangnan-Canal factor also confirms this point. Socioeconomic proxies—population density and GDP—further verify the critical role of demographic and productive intensities in heritage formation processes. The Jiangnan Canal corridor predominantly consists of alluvial plains, with localized orographic variations confined to southwestern uplands. This geomorphic homogeneity accounts for topographic elevation’s marginal explanatory capacity (q < 0.10) in cultural heritage spatial patterning.

4. Discussion

Throughout the long-standing development of Chinese civilization, the cultural ideology of the Jiangnan region has held a position of paramount importance, characterized by rich and unique connotations. As a vital channel connecting the northern and southern water systems, the Jiangnan Canal has not only driven the economic prosperity of this region but also left behind an exceptionally abundant cultural heritage for future generations. This study utilizes multiple GIS analytical methods, revealing that the spatiotemporal distribution of both TCH and ICH in cities along the Jiangnan Canal is intrinsically linked to the canal’s developmental trajectory.

4.1. Spatiotemporal Dynamics and Patterns

The growth trends of cultural heritage directly correlate with the progressive opening or obstruction of the Jiangnan Canal. The peak in cultural heritage quantity during the Song–Yuan to Ming–Qing periods (Song–Yuan: 960–1368 AD; Ming–Qing: 1368–1912 AD) [21,27] temporally coincides with the canal’s peak operational capacity as a vital grain transport artery. This pattern parallels the temporal distribution of heritage along the entire Grand Canal [27] but contrasts with the sharp decline in ICH along the Ming Great Wall during the same period (Ming–Qing: 1368–1912 AD) [24], highlighting divergent evolutionary paths of cultural heritage across geographic units.
Spatially, the standard deviational Ellipses of cultural heritage across all periods exhibit strong spatial congruence with the Jiangnan Canal’s course, affirming its function as a persistent cultural corridor. Kernel density analysis delineates a “one-axis and many-core” spatial configuration defined by 77.2% of TCH and 49.8% of ICH clustering within a 10 km buffer zone along the canal. This configuration significantly diverges from other linear heritage systems: the Min River corridor exhibits a “single-axis and three-core” structure [9], while the Ming Great Wall forms a “three-core and one-belt” pattern shaped by mountainous terrain and historical defenses [24]. The Jiangnan Canal’s uniqueness stems from lowland water network dynamics—minimal elevation variation and stable hydrology [27] enabled continuous cultural landscapes, with tributaries fostering secondary cores.
This spatial divergence reflects fundamentally different formation mechanisms: TCH, as fixed material carriers, tend to concentrate around physical anchors such as hydraulic structures and architectural complexes; ICH, on the other hand, spreads through population mobility, festive events, and social networks in a more fluid “point–axis–surface” diffusion pattern, generating cultural enclaves along both the main canal and its minor branches. A notable example is the emergence of dragon boat festival venues on the outskirts of Suzhou during the Ming and Qing periods (Ming–Qing: 1368–1912 AD).
Our findings resonate with Anderson’s concept [22] of “culture as assembled effects”, whereby heritage distributions emerge from dynamic entanglements of material infrastructures and socio-political practices. Furthermore, the non-monotonic rebound of ICH clustering beyond 30 km, particularly during the Ming–Qing periods (Ming–Qing: 1368–1912 AD, echoes Simandan’s emphasis [30] on the “surprisingness” of socio-spatial change, underscoring the importance of remaining open to unanticipated cultural agglomerations in complex historical landscapes.

4.2. Human-Water Interactions as Driving Mechanisms of Cultural Heritage

Drawing on the concept of the “wise stance”, the spatial distribution of cultural heritage emerges from the dynamic interplay between natural and anthropogenic drivers [29]. Human activity intensity (proxied by nighttime light data, a widely accepted indicator of socioeconomic dynamics) exhibits the highest explanatory power (q-statistic > 0.2) for heritage distribution, with GDP and population density further validating the foundational role of socioeconomic activities. This aligns with studies in Fujian Province [21], where heritage clusters near densely populated areas and transportation corridors, despite differing definitions of “water systems” (natural rivers in Fujian vs. artificial canals here). Notably, the nationwide Grand Canal study [29] reported minimal terrain influence (lowest47 q-value), consistent with our results: the Jiangnan Canal’s flat terrain and stable hydrology weaken natural constraints, amplifying human-water interactions.
However, there is an evident coupling between human activity and natural environmental conditions: in alluvial plains, flat terrain and stable hydrology provide a foundational platform for population agglomeration and economic activities. When GDP or nighttime light intensity exceeds certain thresholds, the density of both TCH and ICH increases exponentially, suggesting a positive feedback loop between economic growth and cultural conservation capacity. In hilly or slightly undulating subregions, the cost and feasibility of maintaining TCH diminish, while ICH continues to cluster due to local festivals and tributary-centered social interaction.
Among natural factors, proximity to the Jiangnan Canal significantly influences heritage distribution (q-statistic > 0.1 for both TCH and ICH), corroborating the water-adjacent clustering mechanism observed in Fujian [23]. However, this contrasts with the national study’s conclusion of weak water system influence [52], potentially due to functional differences: natural rivers across the nation versus the Jiangnan Canal’s enduring role as a socioeconomic and cultural corridor. Unlike natural rivers, the Jiangnan Canal operates through a lock-and-dam system, creating a stable semi-natural ecological interface that simultaneously connects water and land, maintains navigability, and supports a predictable platform for urban development and cultural circulation. This “human–water–land” synergy turns the canal into both a material transport artery and a locus for multi-temporal cultural continuity, aligning with Anderson’s framing of “power intensities” [22] as the spatial expressions of socio-economic dominance. For instance, within the 0–10 km range from the canal, 77.2% of TCH and 49.8% of ICH are concentrated, reflecting the agglomerative effect driven by urbanization [27]. Hub cities like Suzhou and Hangzhou sustain this pattern through both the canal’s economic function—facilitating regional trade—and cultural flows, with the ongoing transmission of crafts and operas (e.g., Kunqu) shaping their cultural identity. Together, these economic and cultural dynamics converge along the canal to form stratified cultural landscapes.

4.3. Limitations and Future Research Directions

While this study reveals the spatiotemporal patterns and core driving factors of cultural heritage along the Jiangnan Canal, several limitations should be acknowledged. First, the analysis of TCH and ICH was conducted at a macro level without subclassification (e.g., ancient architecture/ruins under TCH; traditional craftsmanship/festivals under ICH). This broad-scale approach might obscure the unique formation mechanisms of specific heritage types. For example, the distribution patterns of traditional operas (ICH) dictated by dialects or the reliance of ancient bridges (TCH) on hydrological stability could be overlooked, thus impeding the development of targeted conservation strategies. Second, the exploration of influencing factors was limited to five variables (e.g., nighttime light, GDP), overlooking critical factors such as historical policies (e.g., canal-based grain transport), cultural networks, and local identity—omissions that constrain holistic interpretations of human–environment dynamics.
Future research should address these gaps through two critical pathways: First, conduct subclass-specific investigations for heritage categories (e.g., hydraulic facilities, folk festivals, historic villages), integrating their distinct geographical contexts (e.g., hydrological constraints governing hydraulic infrastructure) and sociocultural functions (e.g., festival-mediated community cohesion). Second, establish a dynamic database for the Jiangnan Canal cultural heritage, consolidating multi-source data (e.g., geospatial coordinates, historical archives, restoration records) to create standardized profiles for each heritage site. A visualized platform could further facilitate data sharing and real-time updates, supporting granular research and interdisciplinary collaboration.

5. Conclusions

This investigation systematically examines the cities along the Jiangnan Canal corridor, employing TCH, ICH, and the canal itself as tripartite research entities. Through integrated spatial analytical frameworks, we characterize spatiotemporal distribution patterns and elucidate their differential dynamics. Building on canal-centric influence assessment, we further integrate geomorphic, socioeconomic, and demographic determinants to deconstruct multifactorial drivers underlying heritage formation mechanisms. The main research conclusions are as follows:
(1)
The MRB Analysis revealed that 77.2% of TCH and 49.8% of ICH were concentrated within 0–10 km of the canal. TCH quantities exhibited a distance-decay trend (258 within 0–10 km vs. 14 beyond 30 km), while ICH displayed localized increases in distal zones (>30 km; e.g., 44 Ming–Qing cases, Ming–Qing: 1368–1912 AD), implying factor heterogeneity. Nevertheless, the canal’s gravitational effect on cultural heritage remained dominant.
(2)
The NNI analysis revealed that both TCH and ICH along the Jiangnan Canal exhibited statistically significant clustered distribution patterns across all historical periods (R < 1, p < 0.01). For TCH, the Sui and Tang Dynasties (Sui–Tang: 581–907 AD) showed a notable expansion in distribution range, with an average observed distance of 10,333 m and an expected distance of 13,977 m. For ICH, the Ming and Qing Dynasties exhibited the highest clustering intensity (z = −12.4390, p = 0.000), indicating non-random spatial aggregation.
(3)
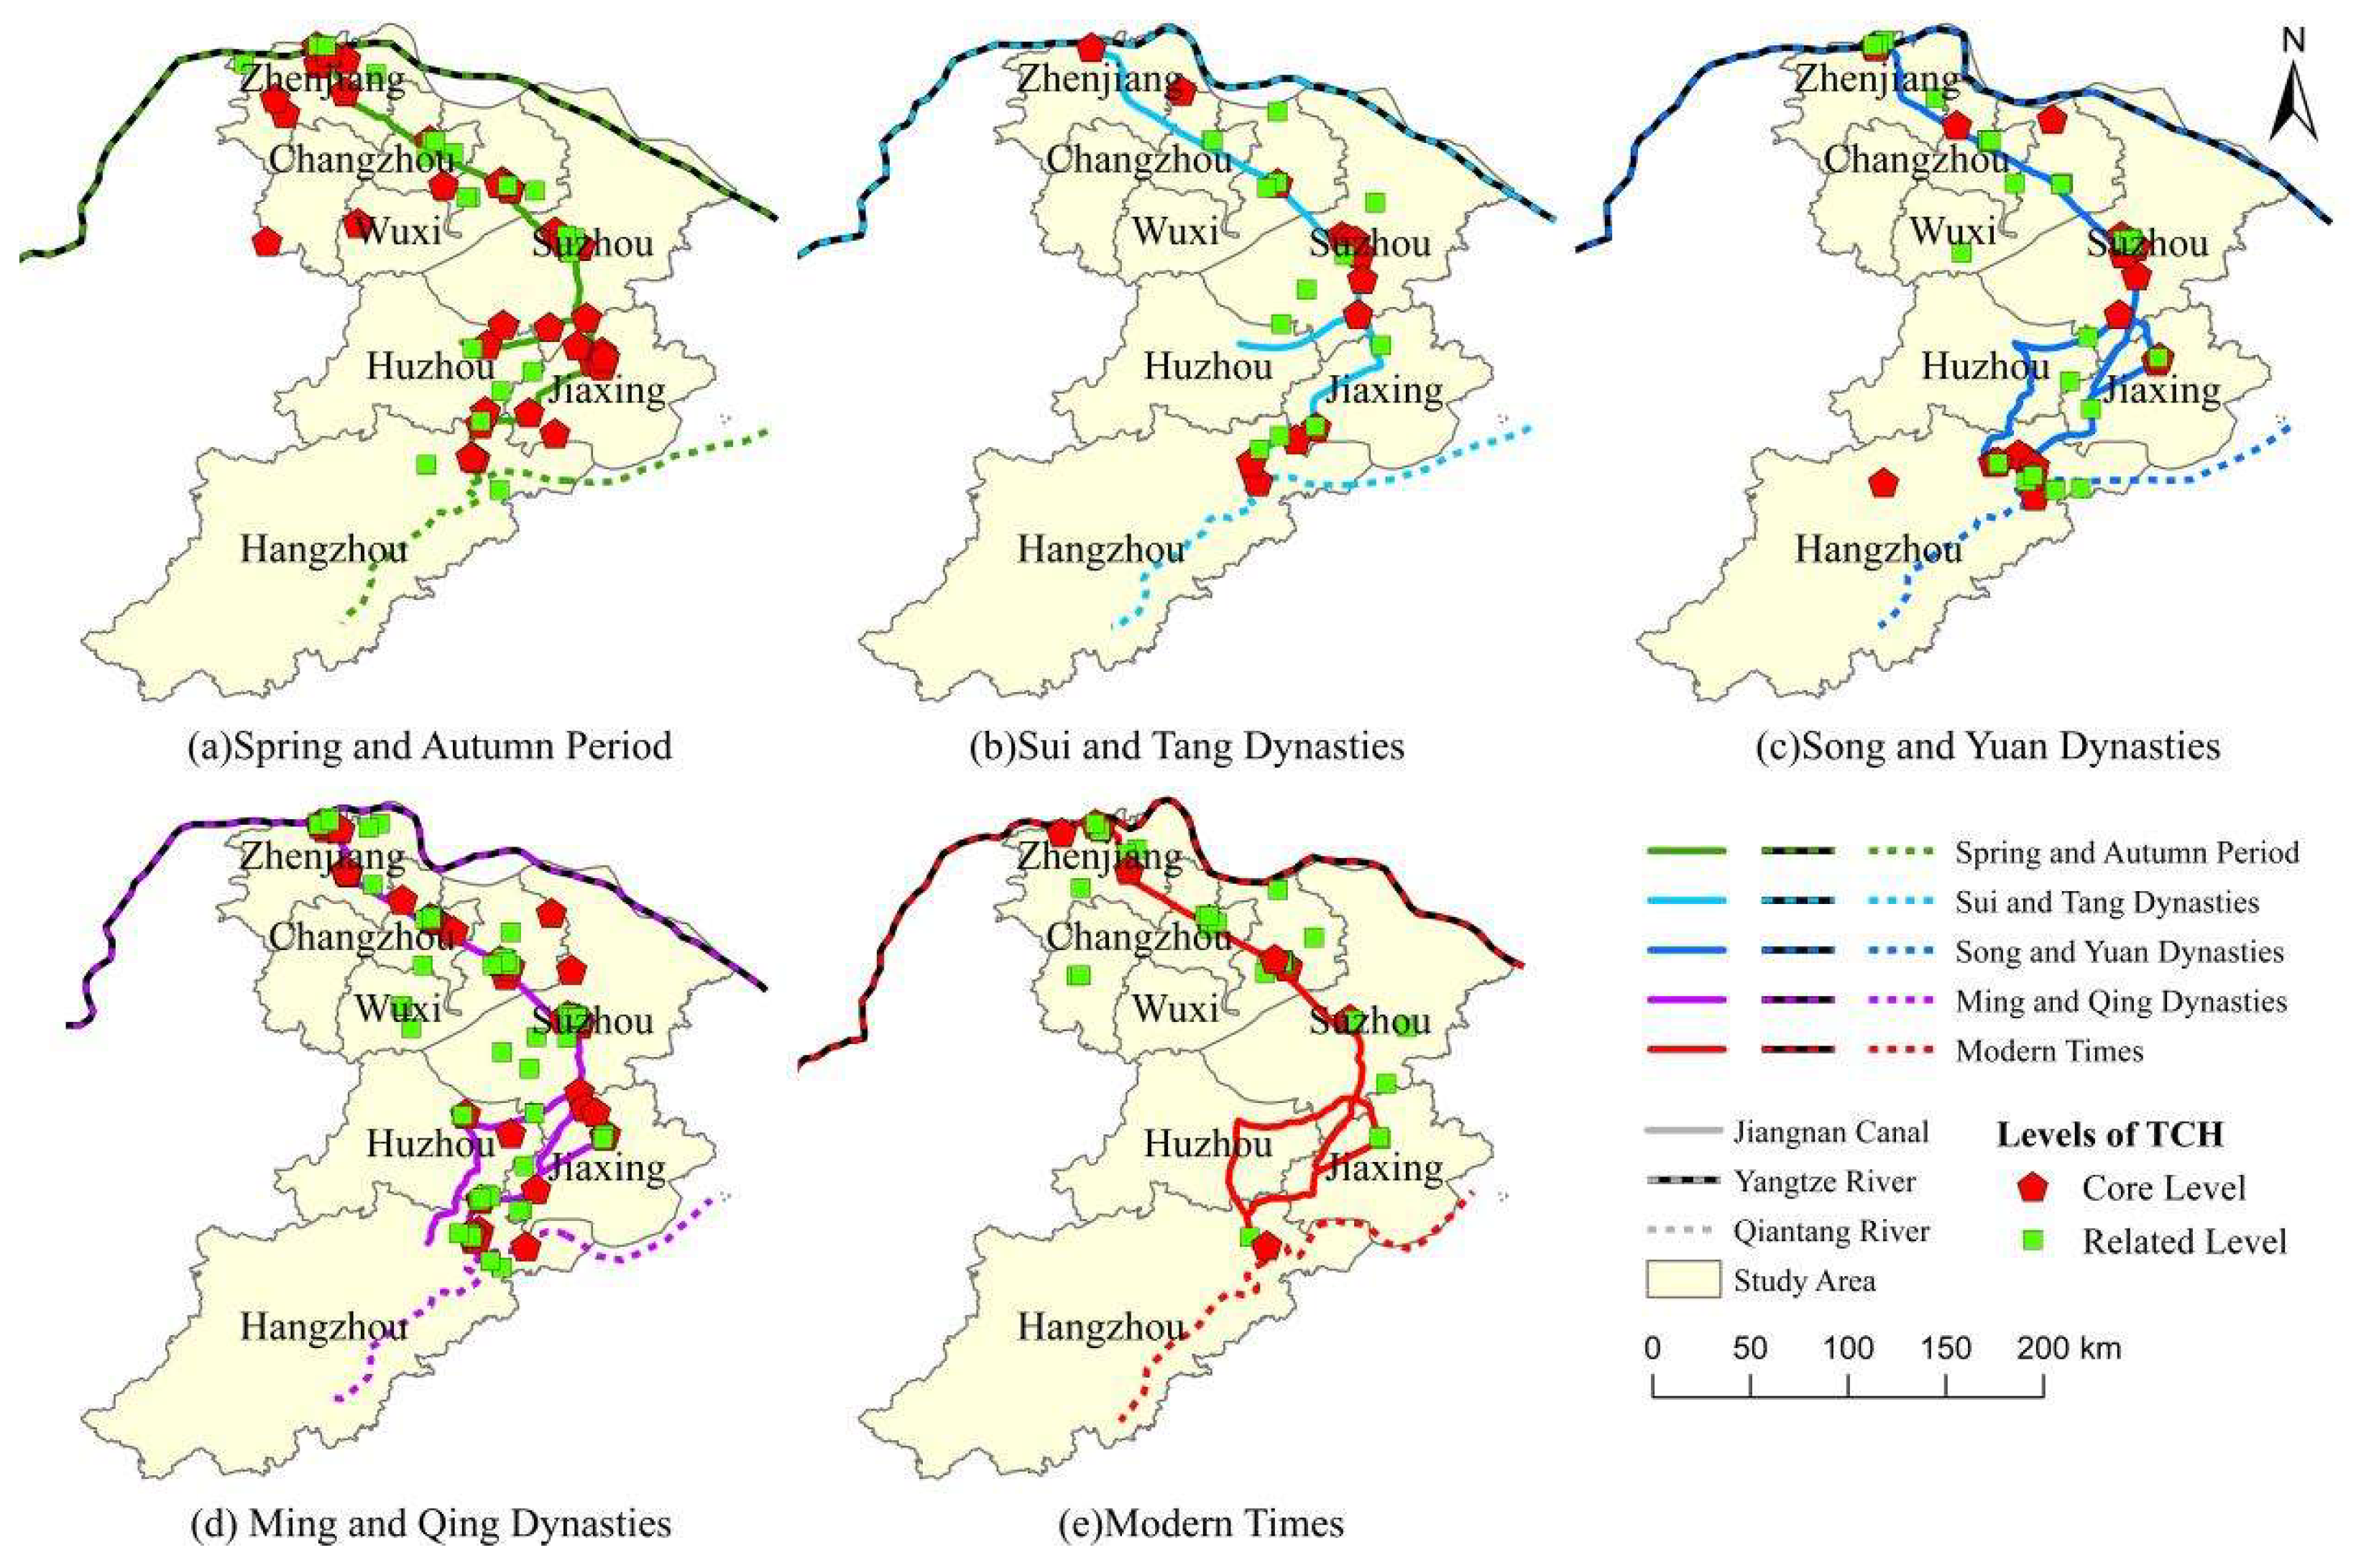
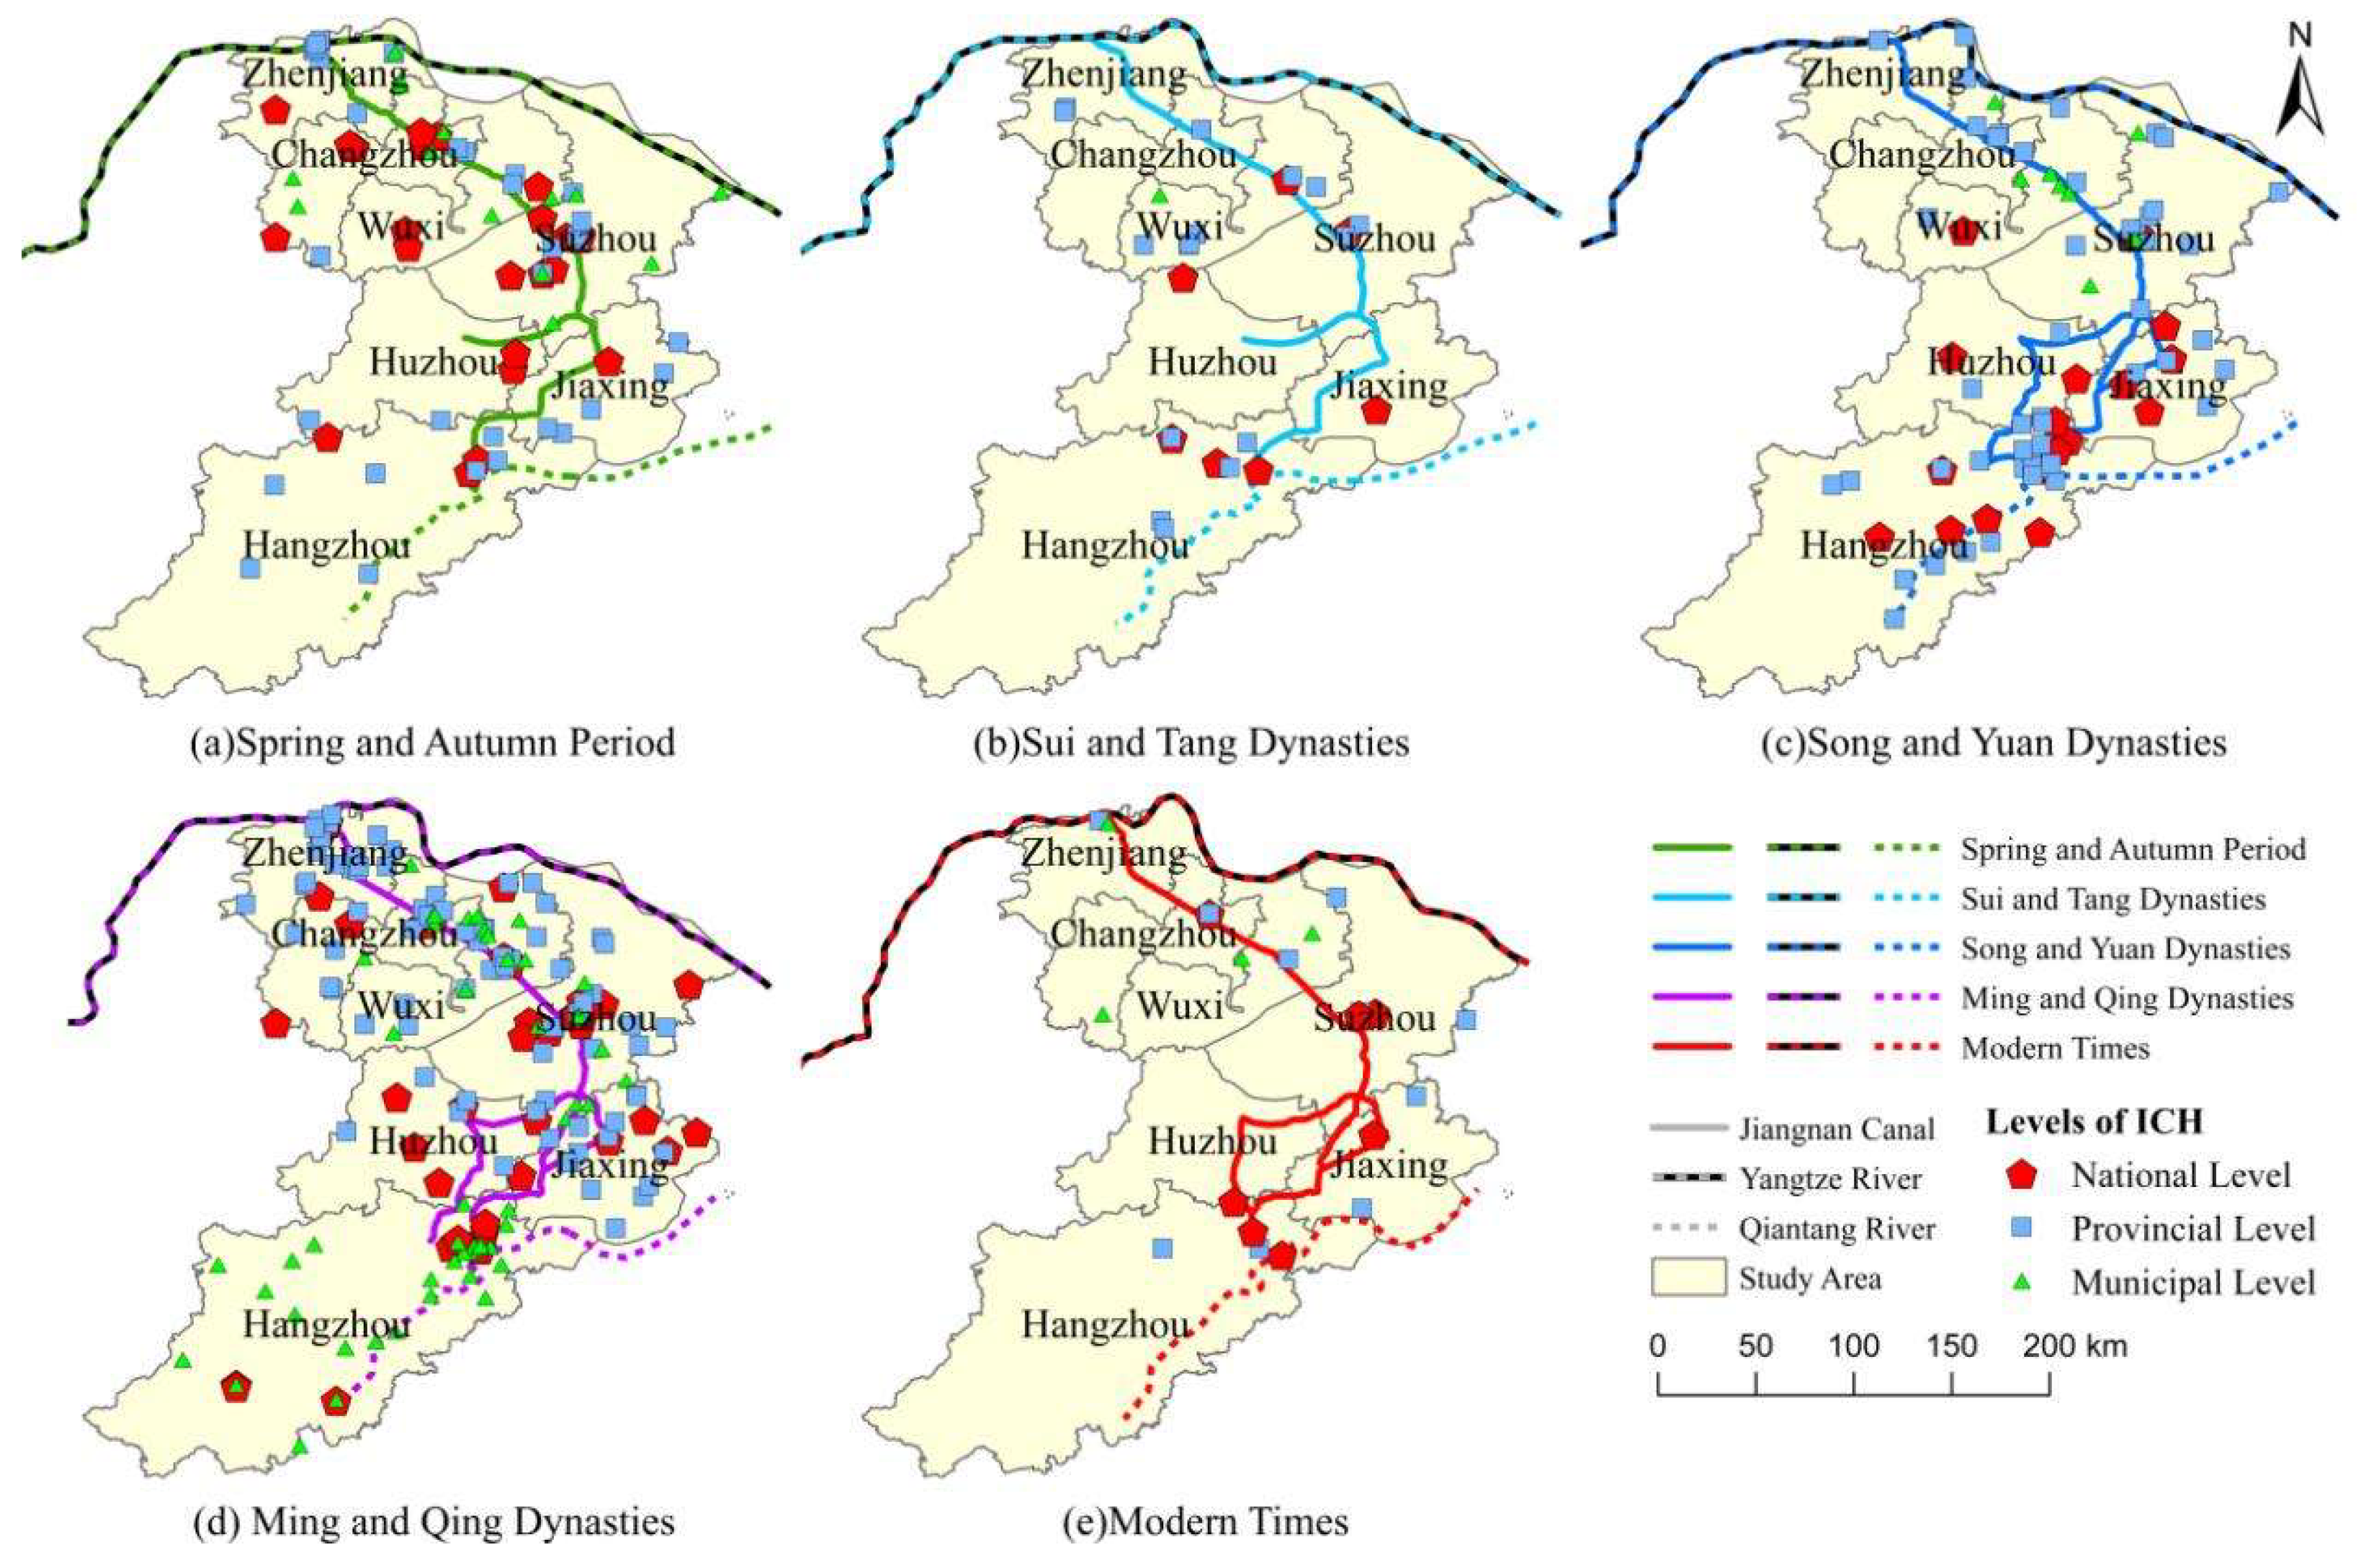
As revealed by KDE Analysis, the TCH in cities along the Jiangnan Canal shows an uneven distribution with a “one axis and many cores” pattern in different periods, all centered around the Jiangnan Canal. These high-density cores experienced spatiotemporal shifts but remained spatially coupled with the canal. ICH exhibited multifaceted distribution complexity. It gradually evolved from a scattered state to an aggregated pattern along the canal. In most periods, high-density ICH clusters were canal-proximal, confirming the canal’s structural centrality in ICH formation.
(4)
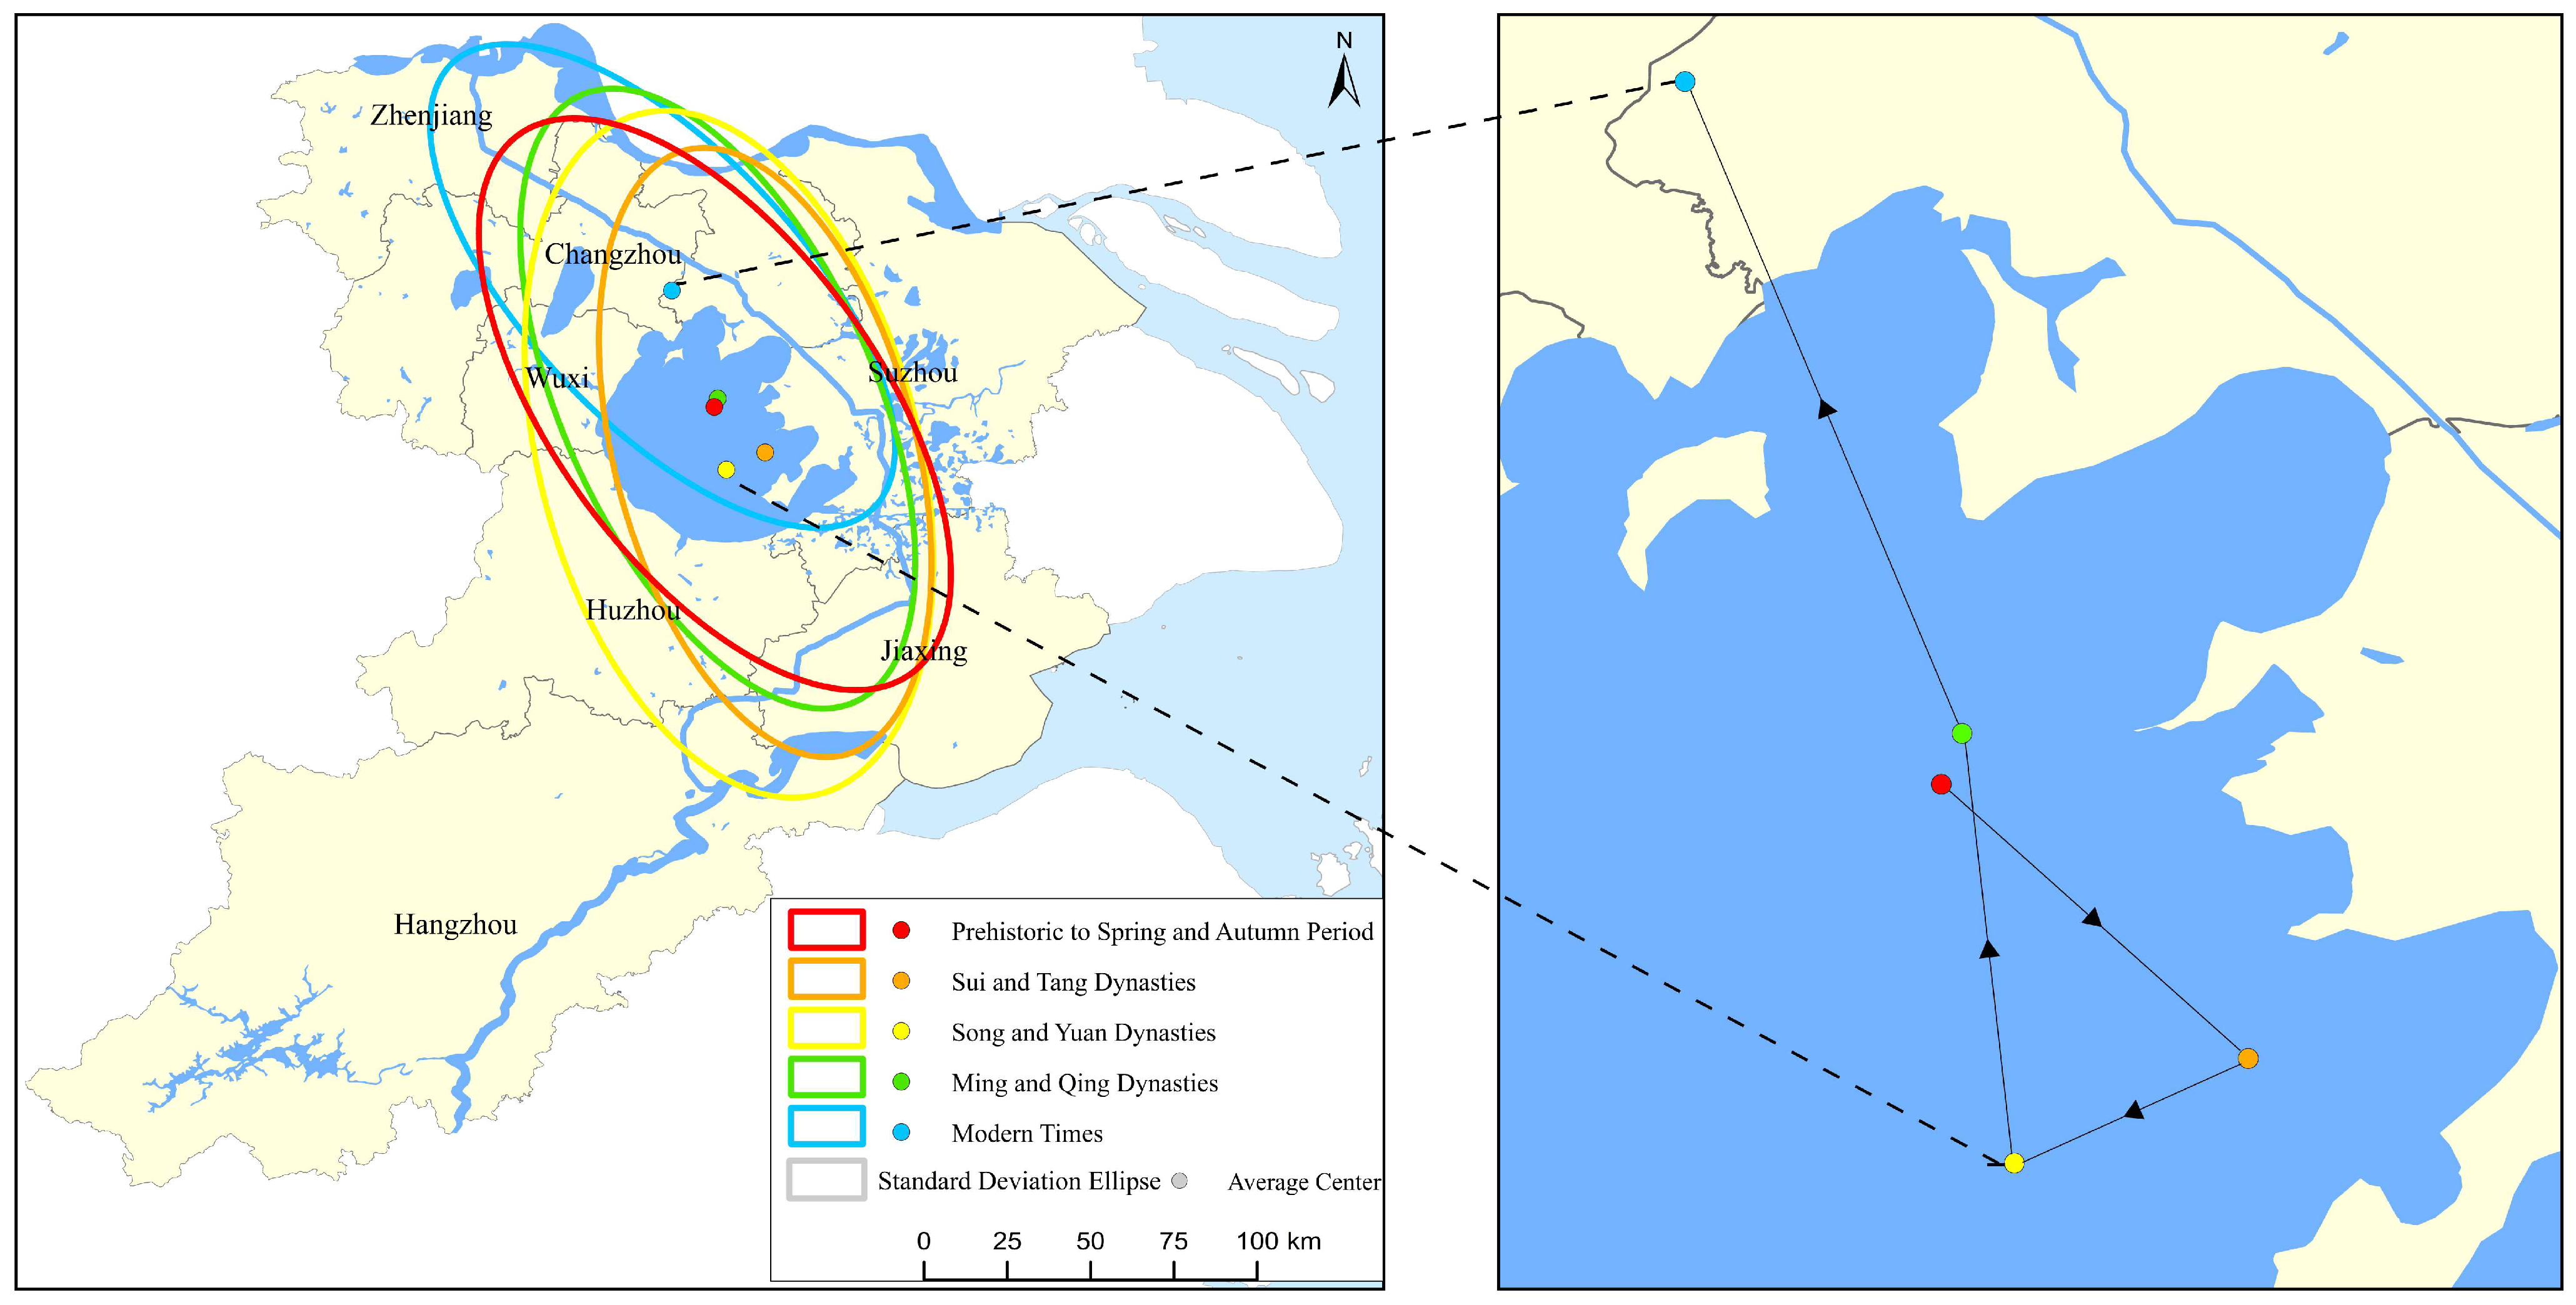
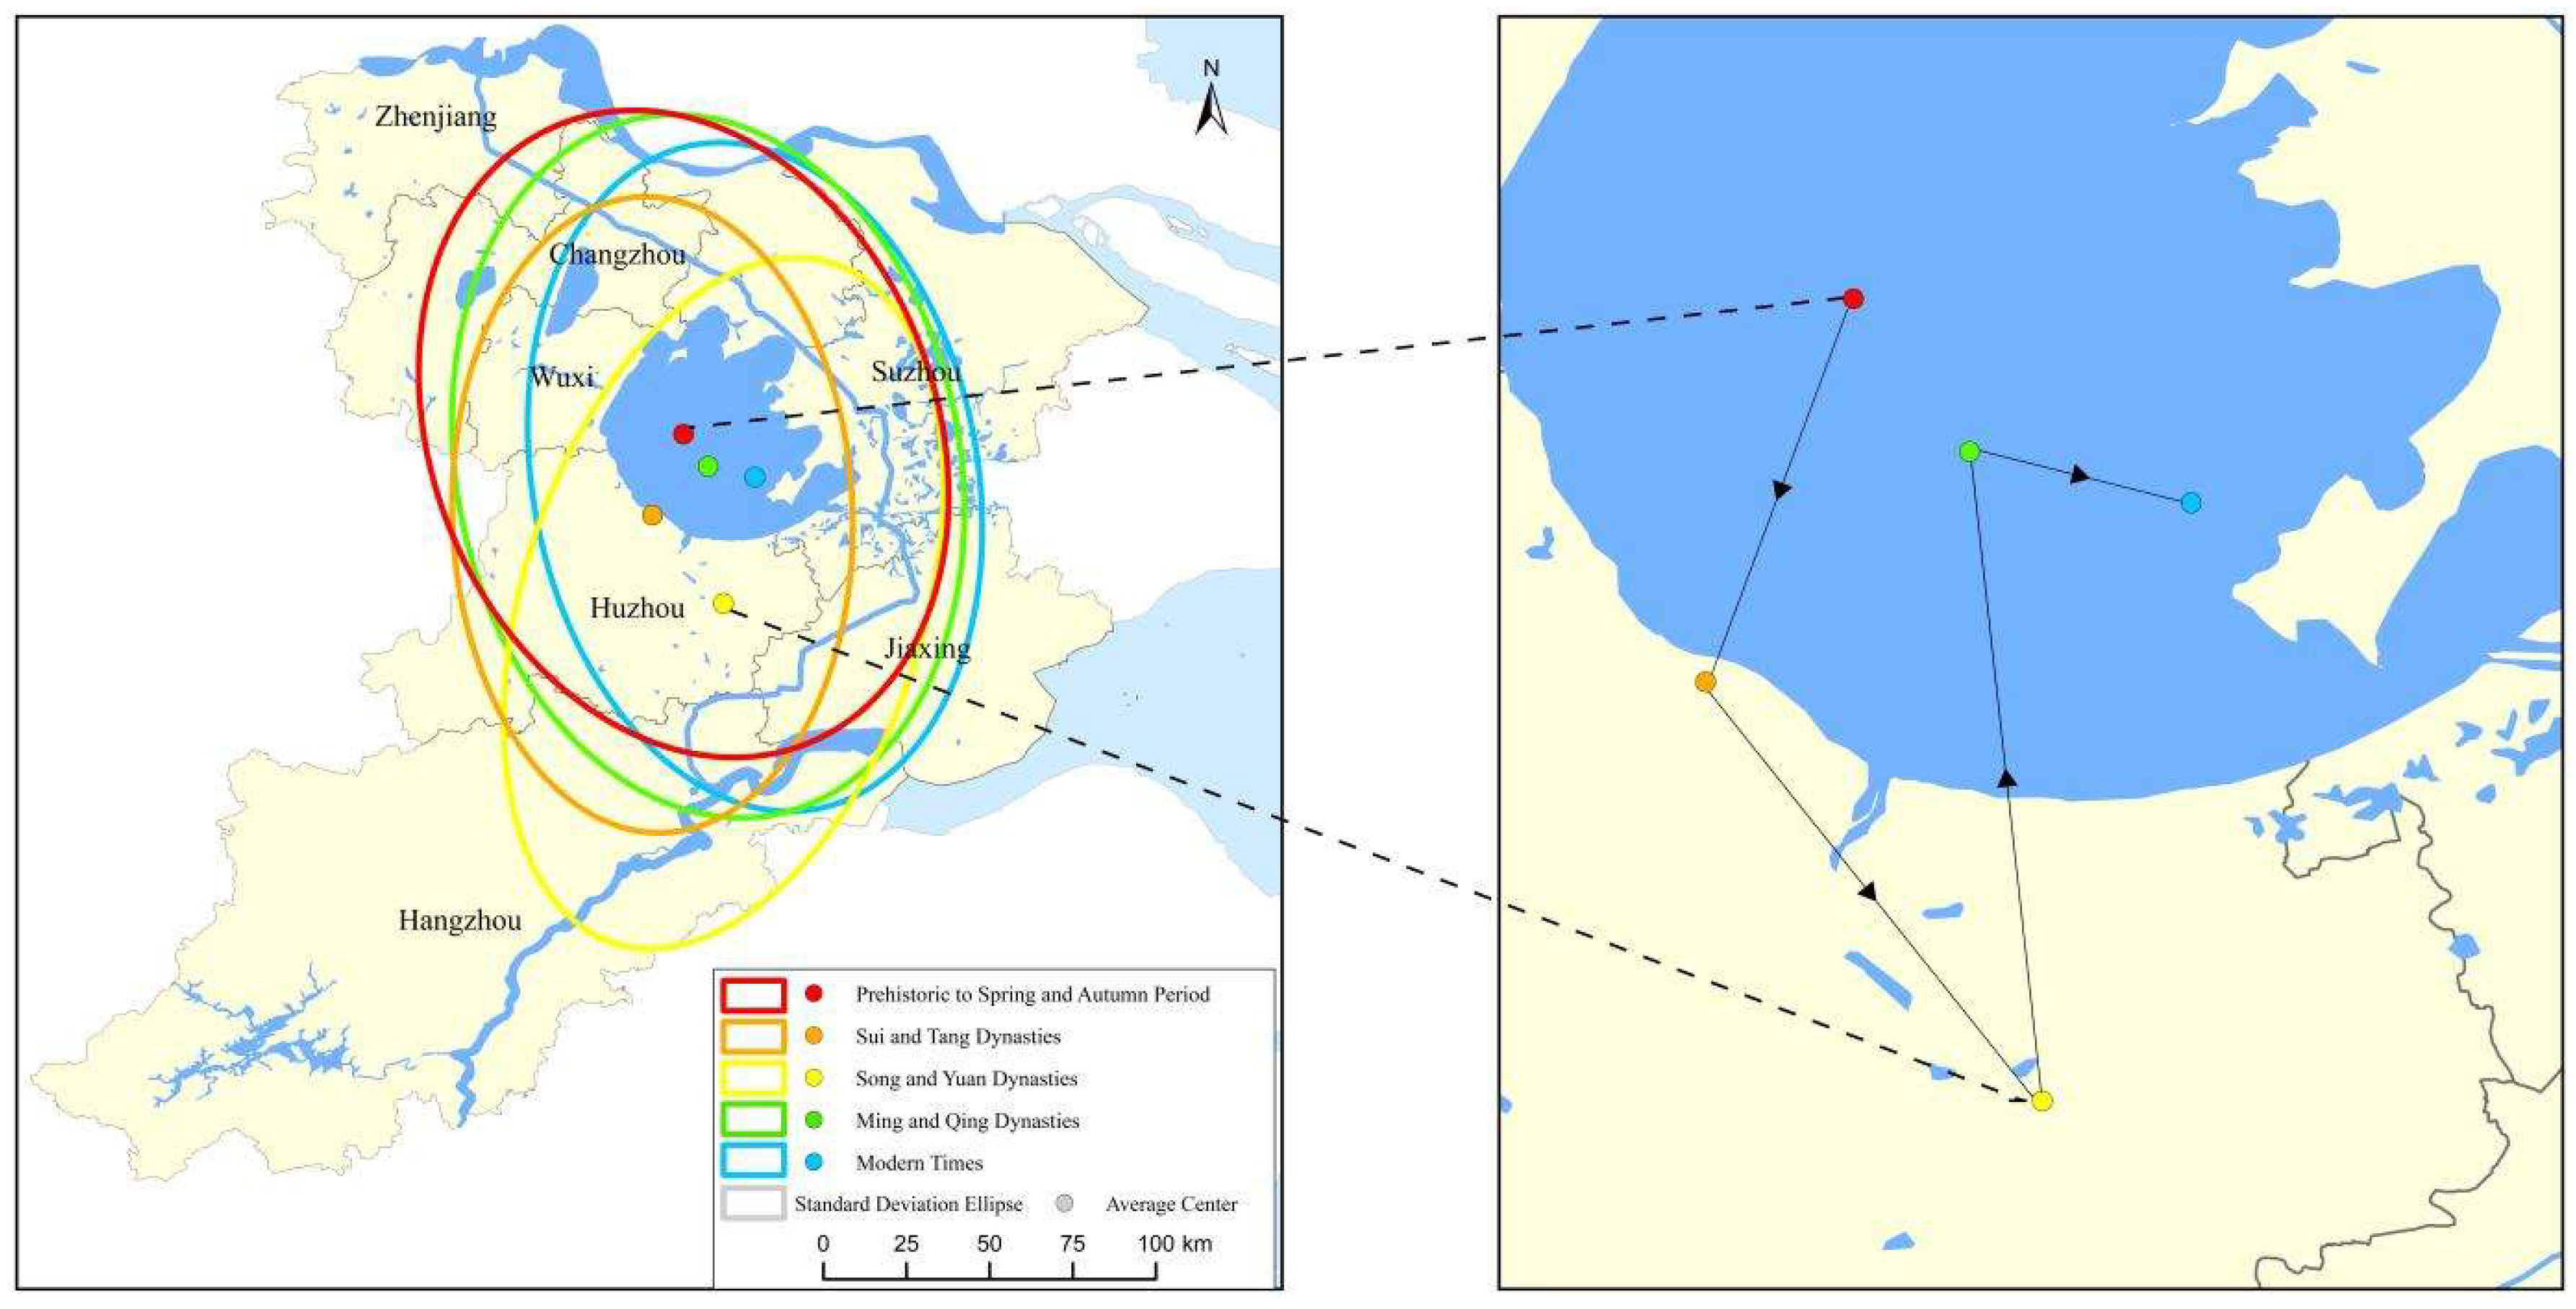
The SDE analysis revealed that the center of gravity of TCH shifted across historical periods, yet consistently clustered around Taihu Lake. The standard ellipses of different periods were highly consistent with the orientation of the Jiangnan Canal, with a relatively long major axis, short minor axis, and large flattening rate, reflecting the concentrated distribution of TCH along the canal. The center of gravity of ICH was mainly located on the south side of Taihu Lake, and its distribution direction in each period extended along the Jiangnan Canal. The difference in the major and minor axes of the ellipses in different periods indicated varying degrees of directional distribution and dispersion of ICH.
(5)
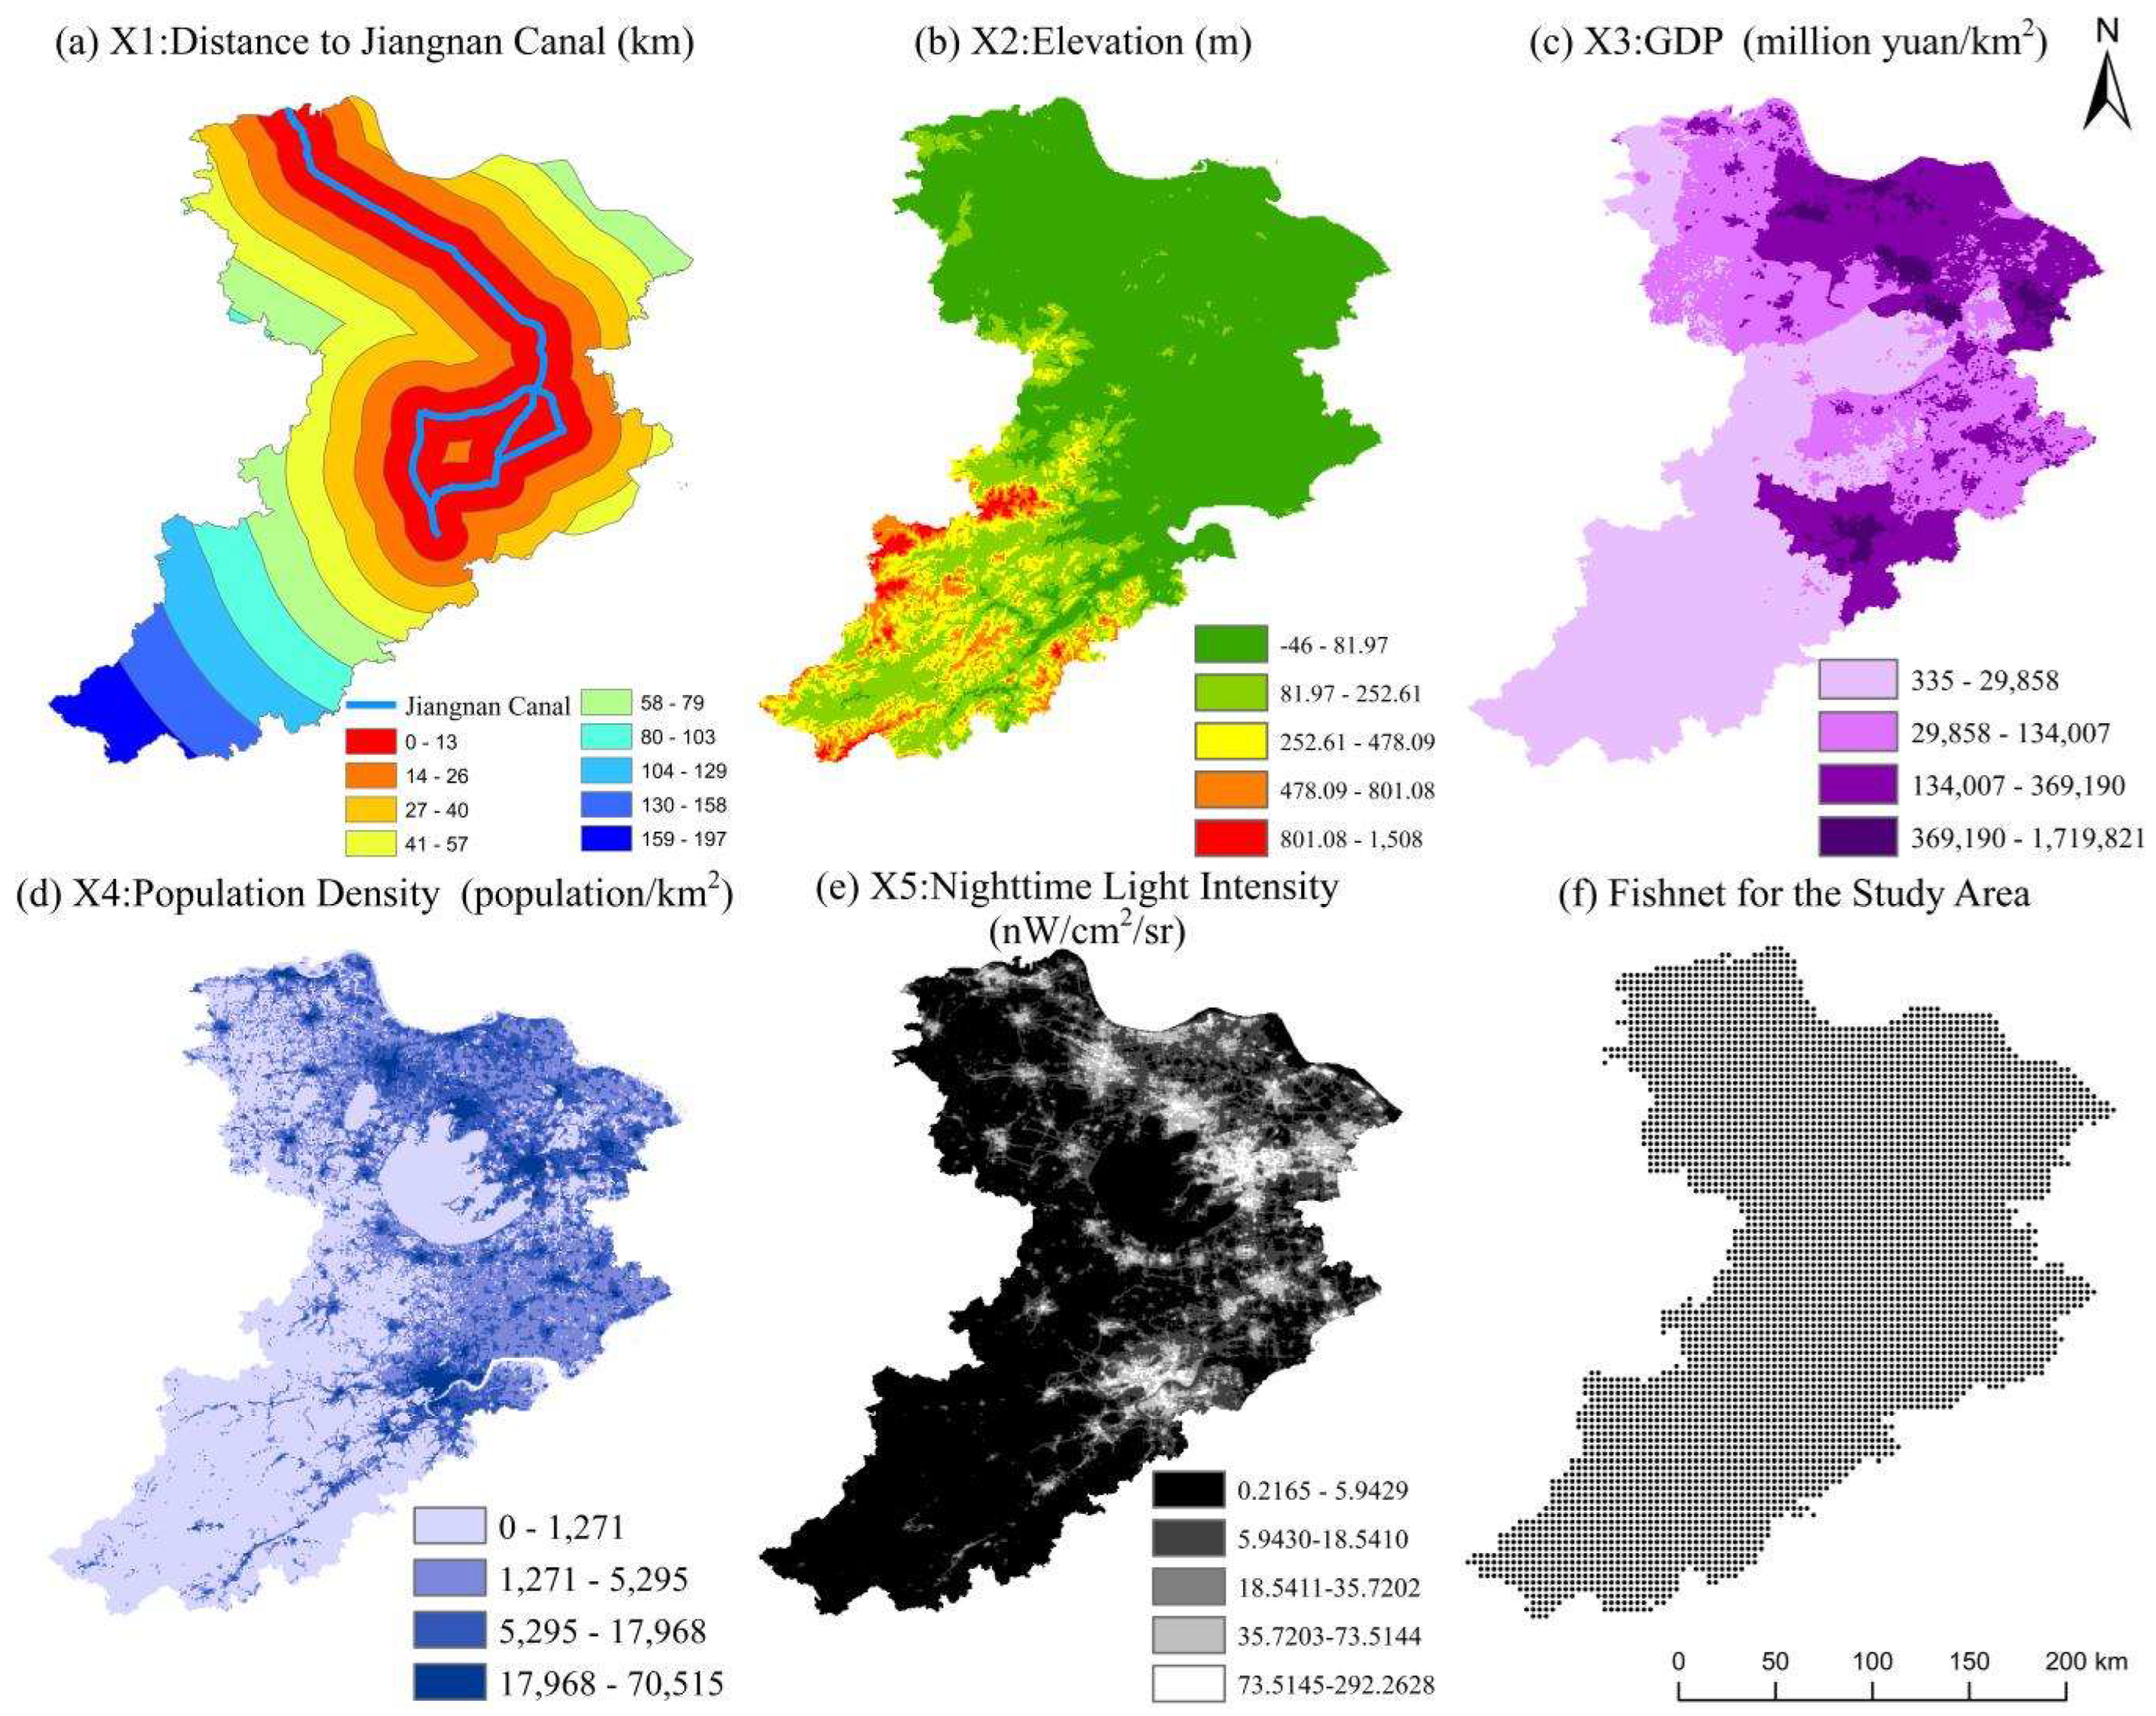
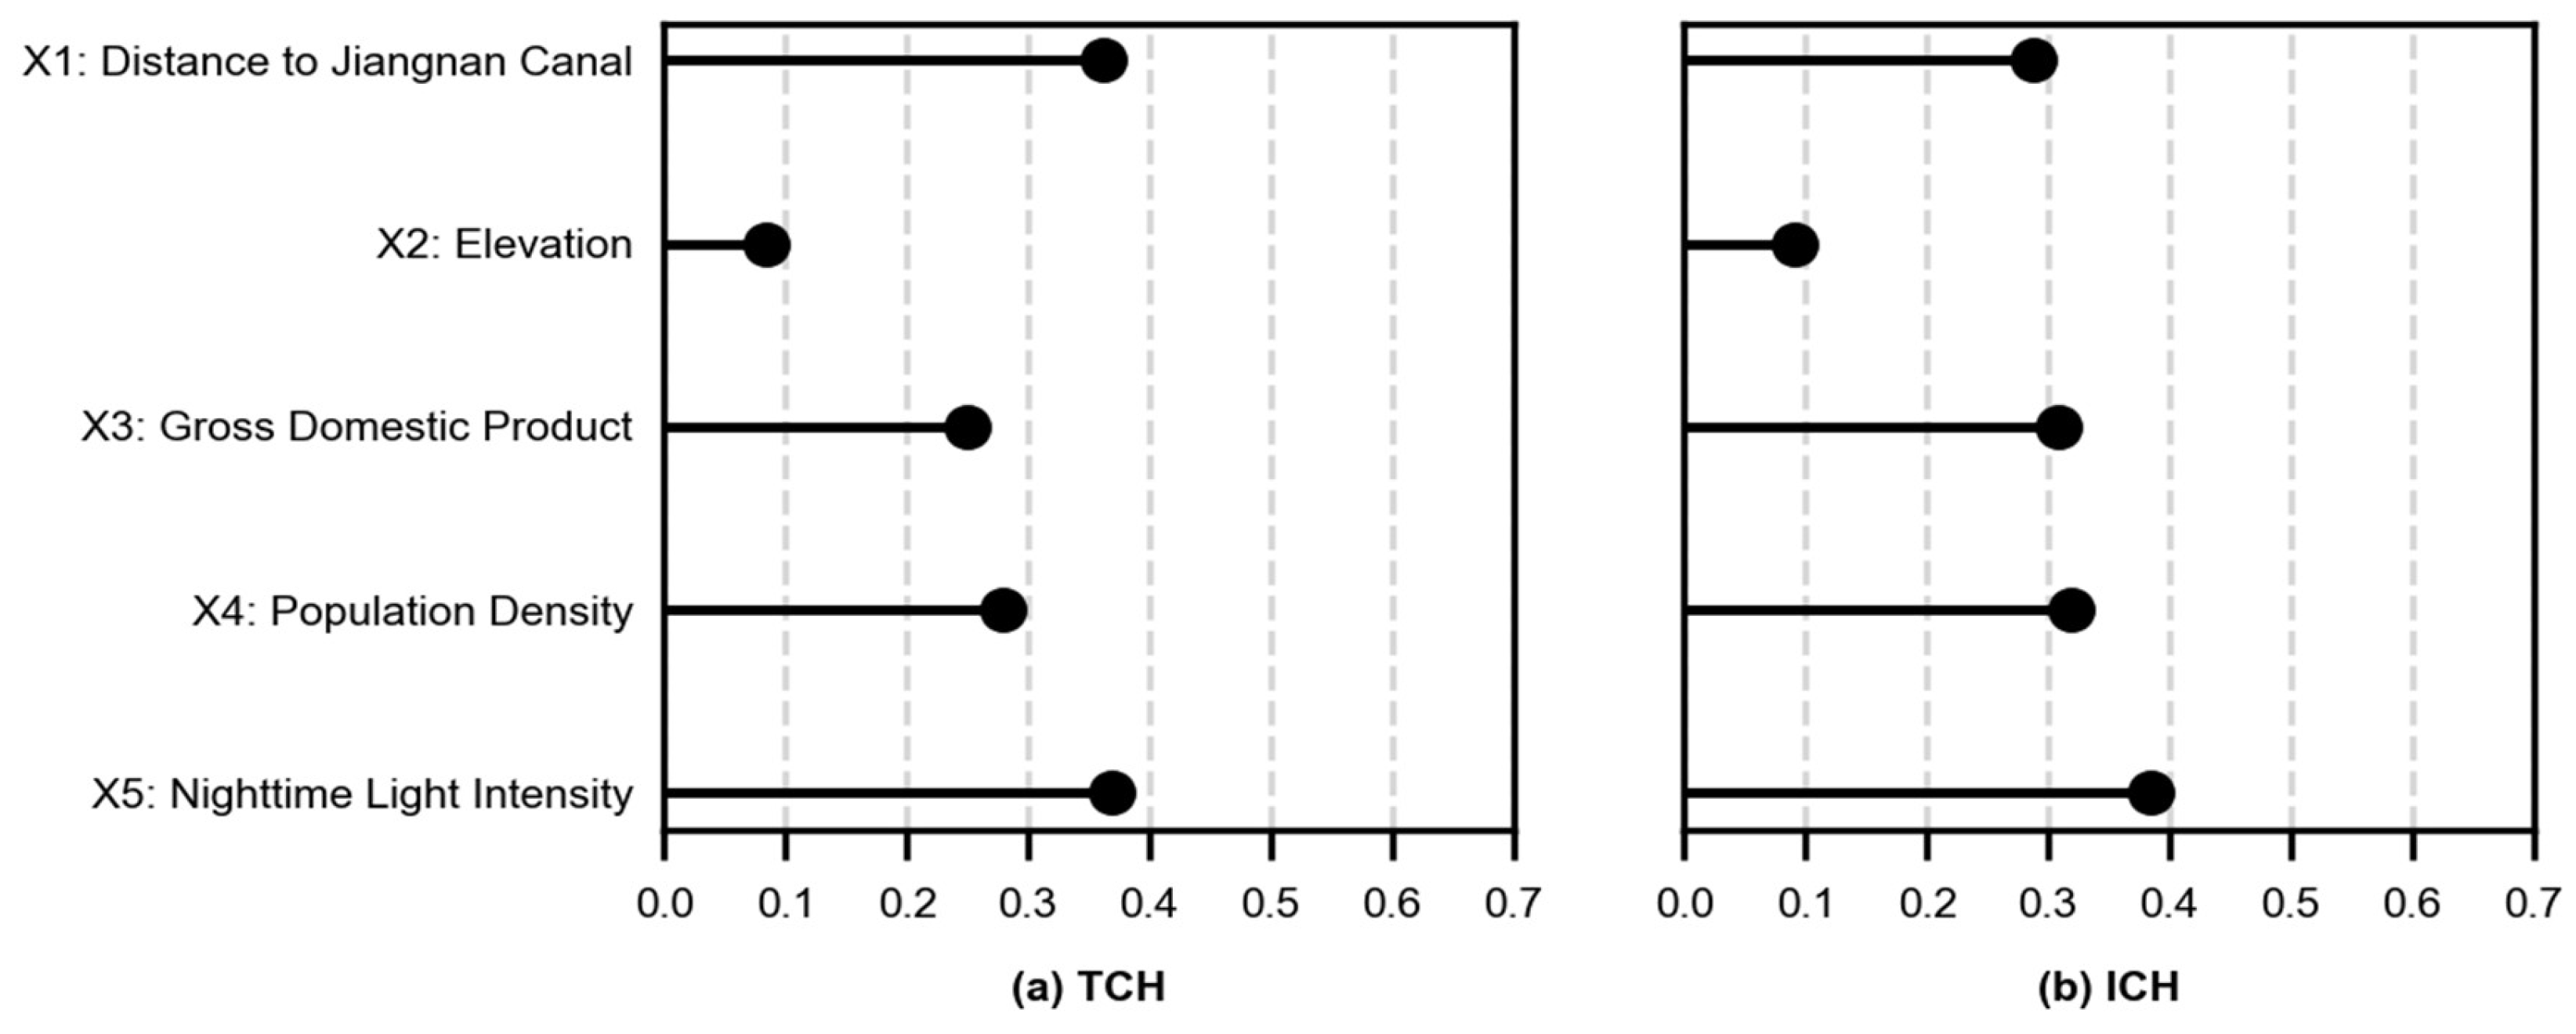
As analyzed by the Geodetector, for both TCH and ICH, nighttime light intensity exerted the strongest explanatory power for their spatial distribution, followed by factors such as the distance-to-Jiangnan-Canal, population density, and GDP. Terrain elevation exhibited the lowest explanatory power. This demonstrates that human activities are the most crucial driving factors in the spatial distribution of cultural heritage. Population density and GDP reflect the intensity of human activities from a socioeconomic perspective, and the relatively high q-statistics value of the distance-to-Jiangnan-Canal factor further validates the importance of the canal. In the study area, due to the extensive plain terrain, the elevation factor has the lowest explanatory power.

Author Contributions

R.L.: Conceptualization, Methodology, Data curation, Formal analysis, Visualization, Writing original draft, Writing review and editing. D.M.: Conceptualization, Validation, Supervision, Writing review and editing. M.W.: Investigation, Formal analysis. H.G.: Supervision. X.L.: Supervision. All authors have read and agreed to the published version of the manuscript.

Funding

This research was partially funded by the “Grand Canal Cultural Belt Comprehensive Practice” activity of Capital Normal University, and the National Natural Science Foundation of China (42271487).

Institutional Review Board Statement

Not applicable.

Informed Consent Statement

Not applicable.

Data Availability Statement

The raw datasets are publicly available as described in Section 2.2. Processed data are available from the corresponding author upon request.

Acknowledgments

We acknowledge NASA for providing the digital elevation model (DEM) data. We also acknowledge the National Earth System Science Data Center (https://www.geodata.cn, accessed on 24 February 2025) for supplying the hydrological data, and the Resource and Environmental Science Data Registration and Publishing System (http://www.resdc.cn, accessed on 24 February 2025) for sharing the China GDP Spatial Distribution Kilometer Grid Dataset and China Population Spatial Distribution Kilometer Grid Dataset. Additionally, we acknowledge the Oak Ridge National Laboratory (supported by the U.S. Department of Energy) for granting access to the nighttime light intensity data. We are especially grateful to Yinghai Ke of Capital Normal University for her insightful suggestions and guidance during the revision of this manuscript.

Conflicts of Interest

The authors declare no competing interests.

Abbreviations

TCHTangible Cultural Heritage
ICHIntangible Cultural Heritage
MRBMultiple Ring Buffer
GISGeographic Information System
NNINearest Neighbor Index
KDEKernel Density Estimation
SDEStandard Deviation Ellipse
GDPGross Domestic Product

References

  1. Chen, M.; Wang, J.; Sun, J.; Ye, F.; Zhang, H. Spatio-Temporal Distribution Characteristics of Intangible Cultural Heritage and Tourism Response in the Beijing–Hangzhou Grand Canal Basin in China. Sustainability 2023, 15, 10348. [Google Scholar] [CrossRef]
  2. Bai, Q.; Gao, M.; Lyu, H.; Zhang, L.; Zhang, J. Spatial Distribution Characteristics and Influencing Factors of Tangible Cultural Heritage in Henan Province, China: A Watershed Perspective. Sustainability 2024, 16, 8979. [Google Scholar] [CrossRef]
  3. UNESCO. The Grand Canal. 2014. Available online: https://whc.unesco.org/en/list/1443%20(2014) (accessed on 10 December 2024).
  4. Yan, H.M. The making of the Grand Canal in China: Beyond knowledge and power. Int. J. Herit. Stud. 2021, 27, 584–600. [Google Scholar] [CrossRef]
  5. UNESCO. Convention Concerning: The Protection of the World Cultural and Natural Heritage. 1972. Available online: https://whc.unesco.org/en/conventiontext/%20(1972) (accessed on 10 December 2024).
  6. UNESCO. What Is Intangible Cultural Heritage. 2004. Available online: https://ich.unesco.org/en/what-is-intangible-heritage-00003 (accessed on 10 December 2024).
  7. Bastian, O.; Walz, U.; Decker, A. Historical landscape elements: Part of our cultural heritage—A methodological study from Saxony. In The Carpathians: Integrating Nature and Society Towards Sustainability; Springer: Berlin/Heidelberg, Germany, 2013; pp. 441–459. [Google Scholar]
  8. Huang, Y.; Yang, S. Spatio-temporal evolution and distribution of cultural heritage sites along the Suzhou canal of China. Herit. Sci. 2023, 11, 188. [Google Scholar] [CrossRef]
  9. Zhang, J.; Jiang, L.; Wang, X.; Chen, Z.; Xu, S. A Study on the Spatiotemporal Aggregation and Corridor Distribution Characteristics of Cultural Heritage: The Case of Fuzhou, China. Buildings 2024, 14, 121. [Google Scholar] [CrossRef]
  10. Fang, W.; Zhuoqi, L.; Ying, D.; Leye, W. Cultural Heritage Conservation from the Perspective of River Basin. Herit. Archit. 2024, 12, 44. [Google Scholar]
  11. Zhang, T.X.; Yang, Y.L.; Fan, X.; Ou, S.Y. Corridors Construction and Development Strategies for Intangible Cultural Heritage: A Study about the Yangtze River Economic Belt. Sustainability 2023, 15, 13449. [Google Scholar] [CrossRef]
  12. Cheng, Q.; Ling, S. Geographical Distribution and Affecting Factors of the Intangible Cultural Heritage in China. Sci. Geogr. Sin. 2013, 33, 1166–1172. [Google Scholar]
  13. Zhang, S.; Zhang, X.; Liu, J. Spatial distribution and pedigree age of intangible cultural heritage along the Grand Canal of China. Herit. Sci. 2024, 12, 246. [Google Scholar] [CrossRef]
  14. Yang, J.; Wang, L.; Wei, S. Spatial Variation and Its Local Influencing Factors of Intangible Cultural Heritage Development along the Grand Canal in China. Int. J. Environ. Res. Public Health 2022, 20, 662. [Google Scholar] [CrossRef]
  15. Li, L. Cultural communication and diversity along the Grand Canal of China: A case study of folk songs in intangible cultural heritage. Herit. Sci. 2023, 11, 66. [Google Scholar] [CrossRef]
  16. Perez-Alvaro, E. Climate change and underwater cultural heritage: Impacts and challenges. J. Cult. Herit. 2016, 21, 842–848. [Google Scholar] [CrossRef]
  17. Wojcieszak, M.; Van den Brande, T.; Ligovich, G.; Boudin, M. Pretreatment Protocols Performed at the Royal Institute for Cultural Heritage (Rich) Prior to AMS 14C Measurements. Radiocarbon 2020, 62, E14–E24. [Google Scholar] [CrossRef]
  18. Morel, H.; Ammerveld, J.O. From Climate Crisis to Climate Action: Exploring the Entanglement of Changing Heritage in the Anthropocene. Hist. Environ.-Policy Pract. 2021, 12, 271–291. [Google Scholar] [CrossRef]
  19. Ciski, M.; Rzasa, K.; Ogryzek, M. Use of GIS Tools in Sustainable Heritage Management—The Importance of Data Generalization in Spatial Modeling. Sustainability 2019, 11, 5616. [Google Scholar] [CrossRef]
  20. Agapiou, A.; Lysandrou, V.; Alexakis, D.D.; Themistocleous, K.; Cuca, B.; Argyriou, A.; Sarris, A.; Hadjimitsis, D.G. Cultural heritage management and monitoring using remote sensing data and GIS: The case study of Paphos area, Cyprus. Comput. Environ. Urban Syst. 2015, 54, 230–239. [Google Scholar] [CrossRef]
  21. Fu, J.; Mao, H. Study on the spatiotemporal distribution patterns and influencing factors of cultural heritage: A case study of Fujian Province. Herit. Sci. 2024, 12, 324. [Google Scholar] [CrossRef]
  22. Anderson, B. Cultural geography 1: Intensities and forms of power. Prog. Hum. Geogr. 2017, 41, 501–511. [Google Scholar] [CrossRef]
  23. Timothy, D.J. Contemporary Cultural Heritage and Tourism: Development Issues and Emerging Trends. Public Archaeol. 2014, 13, 30–47. [Google Scholar] [CrossRef]
  24. Lin, F.Y.; Zhang, X.; Ma, Z.Y.; Zhang, Y.F. Spatial Structure and Corridor Construction of Intangible Cultural Heritage: A Case Study of the Ming Great Wall. Land 2022, 11, 1478. [Google Scholar] [CrossRef]
  25. Yu, K.; Xi, X. The Definition of the Grand Canal Heritage Corridor Based on the Genesis Perspectives. Prog. Geogr. 2010, 29, 975–986. [Google Scholar]
  26. Zhang, S.Y.; Liu, J.M.; Pei, T.; Chan, C.S.; Wang, M.D.; Meng, B. Tourism value assessment of linear cultural heritage: The case of the Beijing-Hangzhou Grand Canal in China. Curr. Issues Tour. 2023, 26, 47–69. [Google Scholar] [CrossRef]
  27. Shi, G.; Feng, Z.; Zhang, J.; Xu, J.; Chen, Y.; Liu, J.; Wang, Y. An Analysis of the Spatiotemporal Distribution and Influencing Factors of National Intangible Cultural Heritage Along the Grand Canal of China. Sustainability 2024, 16, 9138. [Google Scholar] [CrossRef]
  28. Nie, X.; Xie, Y.; Xie, X.X.; Zheng, L.X. The characteristics and influencing factors of the spatial distribution of intangible cultural heritage in the Yellow River Basin of China. Herit. Sci. 2022, 10, 121. [Google Scholar] [CrossRef]
  29. Simandan, D. The wise stance in human geography. Trans. Inst. Br. Geogr. 2011, 36, 188–192. [Google Scholar] [CrossRef]
  30. Simandan, D. Being surprised and surprising ourselves: A geography of personal and social change. Prog. Hum. Geogr. 2020, 44, 99–118. [Google Scholar] [CrossRef]
  31. Anderson, B. Cultural geography III: The concept of ‘culture’. Prog. Hum. Geogr. 2020, 44, 608–617. [Google Scholar] [CrossRef]
  32. Dai, Q.; Wei, Y.; Hu, Y.; Chen, T.; Yan, Y.; Gu, Y.; Wang, Q. Research on the Value of Water-Related Cultural Heritage Architecture from Historical Environmental Records: Evidence from the Li River Basin in China. Land 2024, 13, 838. [Google Scholar] [CrossRef]
  33. Tan, Q. Zhongguo Lishi Ditu Ji [The Historical Atlas of China]; SinoMaps Press: Beijing, China, 1982. [Google Scholar]
  34. Google Maps. Available online: https://www.google.com/maps (accessed on 3 December 2024).
  35. Hangzhou Development and Reform Commission. Program for the Protection, Inheritance and Utilization of the Grand Canal Culture in Hangzhou and the Construction of the National Cultural Park; Hangzhou Development and Reform Commission: Hangzhou, China, 2022.
  36. Jiangsu Provincial Department Of Culture And Tourism. Jiangsu Province Grand Canal Cultural Heritage Protection and Inheritance Plan; Jiangsu Provincial Department of Culture and Tourism: Nanjing, China, 2021.
  37. China Intangible Cultural Heritage Digital Museum. Available online: https://www.ihchina.cn/ (accessed on 22 September 2024).
  38. Jiangsu Provincial People’s Government. Notice of the Provincial Government on the Announcement of Batch of Provincial Intangible Cultural Heritage List; Jiangsu Provincial People’s Government: Nanjing, China, 2007.
  39. Government of Jiangsu. The Intangible Cultural Heritage in Jiangsu. Available online: https://www.jsfybh.cn/#/homePage (accessed on 22 September 2024).
  40. NASA. National DEM 1km, 500m and 250m Data (SRTM 90m). Available online: https://www.resdc.cn/data.aspx?DATAID=123 (accessed on 24 February 2025).
  41. 41. National Earth System Science Data Center National Science & Technology Infrastructure of China. China 1:250,000 Level 3 Watershed Sub-Area Water System Distribution Dataset (2012); National Earth System Science Data Center: Beijing, China, 2012. [Google Scholar] [CrossRef]
  42. Institute of Geographic Sciences and Resources Chinese Academy of Science. China GDP Spatial Distribution Kilometer Grid Dataset; Institute of Geographic Sciences and Resources: Beijing, China, 2020. [Google Scholar] [CrossRef]
  43. Institute of Geographic Sciences and Resources Chinese Academy of Science. Kilometer Grid Dataset for Spatial Distribution of Population in China; Institute of Geographic Sciences and Resources: Beijing, China, 2020. [Google Scholar] [CrossRef]
  44. Oak Ridge National Laboratory. Nighttime Lighting Data. Available online: https://landscan.ornl.gov/ (accessed on 24 February 2025).
  45. Liu, W.X.; Xue, Y.; Shang, C. Spatial distribution analysis and driving factors of traditional villages in Henan province: A comprehensive approach via geospatial techniques and statistical models. Herit. Sci. 2023, 11, 185. [Google Scholar] [CrossRef]
  46. Liu, Y.; Chen, M.; Tian, Y.G. Temporal and spatial patterns and influencing factors of intangible cultural heritage: Ancient Qin-Shu roads, Western China. Herit. Sci. 2022, 10, 201. [Google Scholar] [CrossRef]
  47. Kint, V.; Van Meirvenne, M.; Nachtergale, L.; Geudens, G.; Lust, N. Spatial methods for quantifying forest stand structure development: A comparison between nearest-neighbor indices and variogram analysis. For. Sci. 2003, 49, 36–49. [Google Scholar] [CrossRef]
  48. Zhang, X.Y.; Xiang, H.; Liu, R. Spatial pattern and influencing factors of intangible cultural heritage of music in Xiangxi, central China. Herit. Sci. 2022, 10, 39. [Google Scholar] [CrossRef]
  49. Wang, J.; Xu, C. Geodetector: Principle and prospective. Acta Geogr. Sin. 2017, 72, 116–134. [Google Scholar]
  50. Wang, J.F.; Li, X.H.; Christakos, G.; Liao, Y.L.; Zhang, T.; Gu, X.; Zheng, X.Y. Geographical Detectors-Based Health Risk Assessment and its Application in the Neural Tube Defects Study of the Heshun Region, China. Int. J. Geogr. Inf. Sci. 2010, 24, 107–127. [Google Scholar] [CrossRef]
  51. Wang, J.F.; Zhang, T.L.; Fu, B.J. A measure of spatial stratified heterogeneity. Ecol. Indic. 2016, 67, 250–256. [Google Scholar] [CrossRef]
  52. State Administration of Cultural Heritage. Measures for the Accreditation of National Key Cultural Relics Protection Units; China State Administration of Cultural Heritage: Beijing, China, 2006.
  53. Shen, W.; Chen, Y.; Cao, W.; Yu, R.; Rong, P.; Cheng, J. Spatial pattern and its influencing factors of national-level cultural heritage in China. Herit. Sci. 2024, 12, 384. [Google Scholar] [CrossRef]
  54. State Council of the People’s Republic of China. Regulations on the Protection of Intangible Cultural Heritage. Decree No. 403; State Council: Beijing, China, 2006.
  55. UNESCO. Convention for the Safeguarding of the Intangible Cultural Heritage; UNESCO: Paris, France, 2003. [Google Scholar]
  56. Wang, C.; Zan, M.; Shi, G.; Zhou, L. Spatial distribution and cause of cultural resources in Xinjiang: Taking intangible cultural heritage as an example. Arid Land Geogr. 2021, 44, 584–593. [Google Scholar]
  57. Wang, L.; Li, T.; Liu, Z. Distribution Characteristics and Protection of National Intangible Cultural Heritages in the Yellow River Basin. Econ. Geogr. 2023, 43, 229–237. [Google Scholar]
  58. Li, D.; Li, X. An Overview on Data Mining of Nighttime Light Remote Sensing. Acta Geod. Cartogr. Sin. 2015, 44, 591–601. [Google Scholar]
  59. Zhao, M.; Zhou, Y.Y.; Li, X.C.; Cao, W.T.; He, C.Y.; Yu, B.L.; Li, X.; Elvidge, C.D.; Cheng, W.M.; Zhou, C.H. Applications of Satellite Remote Sensing of Nighttime Light Observations: Advances, Challenges, and Perspectives. Remote Sens. 2019, 11, 1971. [Google Scholar] [CrossRef]
Figure 1. Location of the Jiangnan Canal area in China and cultural heritage sites in the study area. Source: Authors’ elaboration.
Sustainability 17 05026 g001
Figure 2. Spatiotemporal distribution of core and related ICH and corresponding river course changes in the Jiangnan Canal Basin. Source: Authors’ elaboration.
Sustainability 17 05026 g002
Figure 3. Spatiotemporal distribution of national, provincial and municipal ICH and corresponding river course changes in the Jiangnan Canal Basin. Source: Authors’ elaboration.
Sustainability 17 05026 g003
Figure 4. Word cloud of ICH elements. Source: Authors’ elaboration.
Sustainability 17 05026 g004
Figure 5. Quantity distribution of TCH across historical periods and buffer distance intervals. Source: Authors’ elaboration.
Sustainability 17 05026 g005
Figure 6. Quantity distribution of ICH across historical periods and buffer distance intervals. Source: Authors’ elaboration.
Sustainability 17 05026 g006
Figure 7. Kernel density distribution of TCH across historical periods. Source: Authors’ elaboration.
Sustainability 17 05026 g007
Figure 8. Kernel density distribution of ICH across historical periods. Source: Authors’ elaboration.
Sustainability 17 05026 g008
Figure 9. Standard deviation ellipse analysis results of TCH across historical periods. Source: Authors’ elaboration.
Sustainability 17 05026 g009
Figure 10. Standard Deviation Ellipse Analysis Results of ICH Across Historical Periods. Source: Authors’ elaboration.
Sustainability 17 05026 g010
Figure 11. Distribution of influencing factors in the Geodetector model. Source: Authors’ elaboration.
Sustainability 17 05026 g011
Figure 12. Factors influencing spatial distribution of TCH and ICH and their q-statistics. Source: Authors’ elaboration.
Sustainability 17 05026 g012
Table 1. Sources of research data.
ContentSource
Jiangnan Canal channel dataHistorical Atlas of China [33]
Yangtze River channel dataHistorical Atlas of China [33]
https://www.google.com/maps [34] (accessed on 3 December 2024)
Qiantang River channel dataHistorical Atlas of China [33]
https://www.google.com/maps [34] (accessed on 3 December 2024)
Tangible cultural heritage datahttps://drc.hangzhou.gov.cn/art/2022/2/8/art_1229145709_1840880.html [35] (accessed on 22 September 2024)
https://wlt.jiangsu.gov.cn/art/2021/5/25/art_48956_10187654.html [36]
(accessed on 22 September 2024)
Intangible cultural heritage datahttps://www.ihchina.cn/ [37] (accessed on 22 September 2024)
https://www.jiangsu.gov.cn/art/2007/3/24/art_46143_2543689.html [38]
(accessed on 22 September 2024)
https://www.jsfybh.cn/#/homePage [39] (accessed on 22 September 2024)
Elevation datahttps://www.resdc.cn/data.aspx?DATAID=123 [40] (accessed on 24 February 2025)
Water system datahttps://www.geodata.cn [41] (accessed on 24 February 2025)
Gross Domestic Product datahttps://www.resdc.cn/DOI/DOI.aspx?DOIID=33 [42] (accessed on 24 February 2025)
Population density datahttps://www.resdc.cn/DOI/DOI.aspx?DOIID=32 [43]
Nighttime light intensity datahttps://landscan.ornl.gov/ [44]
Table 2. The number distribution table of TCH types in each historical period in the study area.
CategoryPrehistoric to Spring and Autumn PeriodSui and Tang DynastiesSong and Yuan DynastiesMing and Qing DynastiesModern TimesTotal
Ancient Architecture191035644132
Important Historical Sites and Representative Buildings56114841111
Relics of Canal Water Conservancy Projects34933049
Ancient Ruins9067022
Stone Carvings1354013
Ancient Tombs000617
Total68286013246334
Table 3. The number distribution table of ICH types in each historical period in the study area.
CategoryPrehistoric to Spring and Autumn PeriodSui and Tang DynastiesSong and Yuan DynastiesMing and Qing DynastiesModern TimesTotal
Traditional skills181430697138
Folkways1341720256
Traditional art121623345
Traditional dance31926039
Folk literature15455231
Dramatic balladry10324331
Traditional music93312128
Traditional medicine00119020
Traditional drama00114217
Traditional sports, recreation & acrobatics4046115
Total75277921821420
Table 4. Nearest neighbor index of TCH categories.
Historical PeriodAverage Observation
Distance/Meters
Expected Average
Distance/Metes
Nearest Neighbor RatioZ-Scorep-ValuePattern
Prehistoric to Spring and Autumn Period6357.1710,180.84 0.6244 −5.9249 0Cluster
Sui and Tang Dynasties10,333.2213,977.620.7393 −2.63940.008306Cluster
Song and Yuan Dynasties5450.0610,963.120.4971−7.45190Cluster
Ming and Qing Dynasties2589.416291.740.4116 −12.93370Cluster
Modern Times4508.2111,754.940.3835 −7.99890Cluster
All the Periods in History2078.315333.710.3897−21.33930Cluster
Table 5. Nearest neighbor index of ICH categories.
Historical PeriodAverage Observation
Distance/Meters
Expected Average
Distance/Metes
Nearest Neighbor RatioZ-Scorep-ValuePattern
Prehistoric to Spring and Autumn Period9693.4313,388.960.7240−4.57290.000005Cluster
Sui and Tang Dynasties9895.9415,925.740.6214−3.62160.000293Cluster
Song and Yuan Dynasties10,039.3213,001.380.7722−3.92260.000088Cluster
Ming and Qing Dynasties4931.898812.930.5596−12.43900Cluster
Modern Times18,083.9420,614.270.8773−1.07610.281885Cluster
All the Periods in History3203.866416.600.4993−19.63030Cluster
Disclaimer/Publisher’s Note: The statements, opinions and data contained in all publications are solely those of the individual author(s) and contributor(s) and not of MDPI and/or the editor(s). MDPI and/or the editor(s) disclaim responsibility for any injury to people or property resulting from any ideas, methods, instructions or products referred to in the content.

