Abstract
As China steadily advances its “dual carbon” strategy, understanding the factors influencing carbon emission efficiency (CEE) is crucial for promoting high-quality urban development. This study examines Western Valley cities (WVCs), which play a key role in regional development and exhibit a distinct spatial structure. Using a super-efficiency slacks-based measure (SBM) model and economic and social panel data, we measured CEE and analyzed its spatiotemporal evolution. A geographically and temporally weighted regression (GTWR) was then applied to assess the spatiotemporal heterogeneity of influencing factors. Our findings revealed that the overall CEE of these cities remains relatively low, with a complex pattern of change. While efficiency levels in northern, southern, and central cities have gradually increased, there are notable differences in the quantity and spatial distribution of cities with high, relatively high, relatively low, and low efficiency over time. Additionally, the positive effects of technological investment, road density, population density, and per capita gross domestic product on CEE follow an increasing trend, whereas the negative impacts of energy intensity, green space ratio, secondary industry proportion, land use scale, and gas consumption gradually weaken. Additionally, the magnitude and direction of these effects vary significantly across northern, central, and southern cities. These findings provide important theoretical and practical insights for region-specific strategies aimed at reducing emissions and improving efficiency in WVCs.
1. Introduction
Scientific assessment and effective enhancement of urban CEE are essential for achieving China’s green and low-carbon development goals, including carbon peaking, by 2030 [1,2]. As the primary source of regional carbon emissions, urban CEE plays a crucial role in meeting the national “dual carbon” targets and is vital for promoting new quality productive forces, high-quality development, and urbanization [3,4]. Within the Western City System, River Valley cities such as Lanzhou, Xining, Nanning, and Guiyang play a crucial role in implementing national strategies and driving regional economic and social development. In the context of advancing national initiatives such as new urbanization, ecological urbanization, and carbon neutrality, a scientific understanding of the spatiotemporal evolution of CEE in WVCs and its influencing factors is of great theoretical and practical significance. Such an understanding is key to fostering high-quality development, promoting green and low-carbon pathways, and ensuring coordinated urbanization efforts.
In recent years, urban CEE has garnered increasing academic interest. Studies on its quantitative measurement, spatiotemporal characteristics, and influencing factors have yielded valuable insights. Quantitative assessments of CEE generally follow two main approaches. The first involves single-factor measurement methods based on data such as carbon emissions, gross domestic product (GDP), and energy consumption intensity, leading to the development of indicators such as carbon emission intensity [5,6,7], carbon productivity [8], and energy efficiency [9]. The second approach, which has gained traction in recent studies, employs total-factor measurement methods that incorporate variables such as carbon emissions, fixed asset investment, electricity consumption, and year-end employment. These studies utilize input–output perspectives, including data envelopment analysis [10], the stochastic frontier method [11,12,13], and the super-efficiency SBM model [14,15,16], offering a more comprehensive and integrated evaluation of CEE. Regarding spatiotemporal evolution characteristics, scholars commonly apply methods such as the Theil index [17,18], Gini coefficient [19], kernel density estimation [20,21], spatial Markov chain analysis [14,22], and exploratory spatial analyses [1,23]. These studies typically examine regional differences [24,25], spatial spillover effects [19,26], convergence trends [25,27], and spatial correlations [28,29], consistently finding significant spatial and temporal disparities in urban CEE.
Regarding the analysis of factors influencing CEE, scholars have primarily employed quantitative methodologies including index decomposition analysis [24,30], panel regression models [31], and machine learning approaches [22], yielding diverse conclusions that reveal significant variations in the directional impacts of driving factors. Scholars such as Sun Xiumei, Xiao Guoan, and Quan Tianshu generally identify positive influences from an economic development level [10,32], urbanization [33,34], population density [11], openness [11], green technological innovation [29,30], foreign direct investment [1], clean energy efficiency [24], transportation integration [32], environmental regulation technology [32], capital endowment [32], environmental protection [24], and technological support [24]. These factors enhance CEE through mechanisms like technology spillover effects, resource allocation optimization, and environmental governance synergies. Conversely, Wang Zhaofeng, Sun Yixuan, and Wei Lili argue that land intensive use [35,36], energy consumption structure [20,37], energy intensity [10,24], and foreign investment intensity [15] exhibit negative impacts. Notably, industrial structure factors exhibit divergent effects depending on the specific indicators selected. For instance, the proportion of secondary industry employment [24] demonstrates a negative impact, whereas the share of secondary industry output value [15] and tertiary industry output value [10] show positive effects. This reflects the crucial moderating role of technological advancement and factor allocation efficiency within industrial sectors. In terms of research subjects, existing studies display a dual characteristic of “extensive regional coverage” and “typological exploration”. Scholars have not only investigated the spatiotemporal differentiation patterns of urban CEE at the national [38], provincial [39,40,41], and urban agglomeration [18,42] levels, but also paid attention to cities of specific types such as low-carbon pilot cities [15,43] and resource-based cities [29,44].
Overall, there has been limited research on urban CEE in western China, with a particular lack of comprehensive attention to WVCs that hold significant socio-economic development status and possess distinctive spatial structures. Furthermore, most existing studies on urban CEE are based on administrative regions with significant internal variations, few studies have been conducted at the scale of city districts, which better align with the general definition of urban, are more representative of physical urban areas, and have a higher population density and concentrated construction land. To address this gap, this study employs a super-efficiency SBM model incorporating undesirable outputs to measure the CEE of 33 WVCs from 2005 to 2022 at the urban scale, focusing on areas where the main urban centers are located. After analyzing the spatiotemporal evolution characteristics, a GTWR model was applied to examine the heterogeneity of factors influencing CEE across three dimensions: economic development, urban construction, and energy use. Collectively, our findings provide a theoretical foundation and decision-making reference for the steady advancement of the national “dual carbon” strategy, the enhancement of emission reduction efficiency in WVCs, and the promotion of low-carbon development.
2. Research Objects, Methods, and Data Sources
2.1. Research Objects
Valley cities are urban settlements primarily developed within river valleys, where their expansion is constrained by surrounding mountainous or hilly terrain [45]. Predominantly located in western China, these cities exhibit distinct spatial characteristics, often adopting cluster-based configurations due to topographical limitations [46]. More than 30 prefecture-level cities, including Lanzhou, Xining, Baoji, Chongqing, Guiyang, and Guangyuan, along with numerous county-level settlements such as Zhouqu, Yongdeng, Wenchuan, Beichuan, Lushan, and Wangmo, are geographically dispersed across western provinces and municipalities [47]. Over the past two decades since the implementation of the Western Development Strategy, WVCs have undergone rapid economic and social development, accompanied by continuous population growth, industrial agglomeration, and urban land expansion. This large-scale, long-term transformation has had profound environmental consequences, including extensive resource consumption, ecological degradation, and increasing carbon emissions from economic and social activities [48]. Taking Lanzhou as an example, data from the China City Statistical Yearbook [49] reveal that by the end of 2022, the city’s GDP had reached 334.4 billion yuan, and its urban population had grown to 4.415 million, representing 10.8-fold and 1.5-fold increases, respectively, compared to 2000. In the city’s four main urban districts (Chengguan, Qilihe, Anning, and Xigu), GDP stood at 244.92 billion yuan, the permanent population at 3.108 million, and the built-up area at 254.0 km2, marking increases of 9.8 times, 1.8 times, and 1.6 times, respectively, over the same period. In 2022, Lanzhou’s total water consumption and the comprehensive energy consumption of large-scale industrial enterprises reached 1.04 billion cubic meters and 14.698 million tons of standard coal, respectively, 3.4 times and 2.5 times the levels recorded in 2000. These changes have also intensified the urban heat island effect, with high- and sub-high-temperature zones expanding into surrounding suburban counties [50].
To analyze the spatiotemporal differentiation of CEE and its influencing factors, this study categorizes WVCs into three groups—northern, central, and southern—based on their provincial (regional) geographic locations. These groups consist of 11, 9, and 13 cities, respectively (Figure 1).
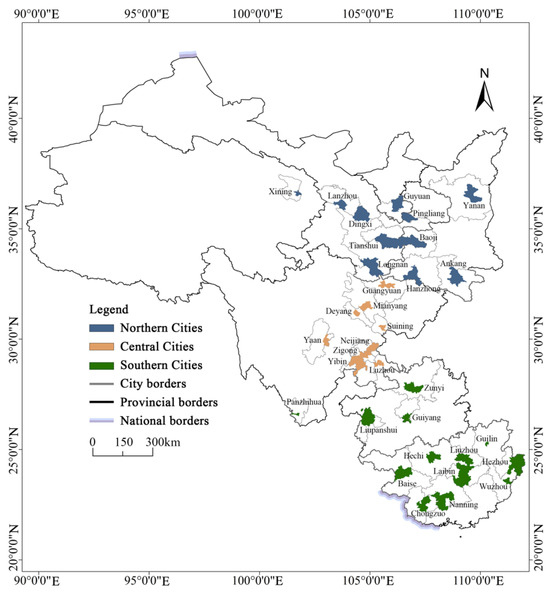
Figure 1.
Distribution and classification of research objects.
2.2. Research Methods
2.2.1. Super-Efficiency SBM Model with Undesirable Outputs
The super-efficiency SBM model incorporates undesirable outputs and re-evaluates decision-making units that initially achieve an efficiency value of 1, thereby enhancing the accuracy and practicality of efficiency assessments [51]. Considering both model characteristics and data availability, this study employs the super-efficiency SBM model incorporating undesirable outputs, as proposed by Tone [52]. The final urban CEE measurement index system (Table 1) is constructed using “total fixed asset investment” as capital input, “number of employees at year-end” as labor input, “total electricity consumption” as energy input, “GDP” as the desired output, and “CO2 emissions” as the undesirable output. CEE measurements were conducted using MATLAB R2022a software.

Table 1.
CEE measurement indicators.
2.2.2. Geographically and Temporally Weighted Regression
To examine the spatiotemporal heterogeneity of factors influencing CEE, this study compares the simulation results of four regression models: ordinary least squares regression (OLS), geographically weighted regression (GWR), temporally weighted regression (TWR), and geographically and GTWR. The GTWR model was ultimately selected due to its ability to introduce a temporal dimension into GWR, effectively addressing both spatial and temporal non-stationarity while reducing parameter estimation bias and model errors [53]. This model is well-suited for analyzing the complex spatiotemporal data in this study and was implemented using the Geographically and Temporally Weighted Regression tool in ArcGIS 10.6 software.
Building on existing research [15] and considering the developmental characteristics and data availability of WVCs, this study identifies key factors influencing CEE across three dimensions: economic development, urban construction, and energy use. The detailed indicator system is presented in Table 2.

Table 2.
Indicators of influencing factors.
2.3. Data Sources
2.3.1. Carbon Emission Data
This study utilizes data from the Emissions Database for Global Atmospheric Research (EDGAR), which provides carbon emission estimates for 214 countries and regions worldwide, including China. The dataset covers emissions from energy activities, selected industrial processes, partial non-energy sources, and fuel combustion [54]. Specifically, this study employs county-level carbon emission data from EDGAR V8.0, spanning the period from 2005 to 2022 [55].
2.3.2. Socio-Economic Data
The dataset includes both indicators used to calculate CEE, such as total fixed asset investment, number of employees at year-end, total electricity consumption, and GDP, as well as variables influencing CEE, including permanent population, science and technology expenditure, total urban road area at year-end, and green space area. All data were sourced from the China Urban Statistical Yearbook [49] and statistical yearbooks of relevant provinces and cities. Missing data were estimated using linear interpolation or trend interpolation methods. For regression analysis, both dependent and independent variables were logarithmically transformed to ensure statistical robustness.
3. Spatiotemporal Evolution of CEE
3.1. Temporal Changes
The trend of CEE in WVCs from 2005 to 2022 is complex. Before 2011, efficiency generally exhibited a fluctuating upward trend, followed by a gradual decline over multiple years. After a notable improvement in 2015, efficiency levels remained relatively stable (Figure 2). In terms of efficiency value distribution, most WVCs had efficiency values close to 1.00, indicating an overall low level of CEE.
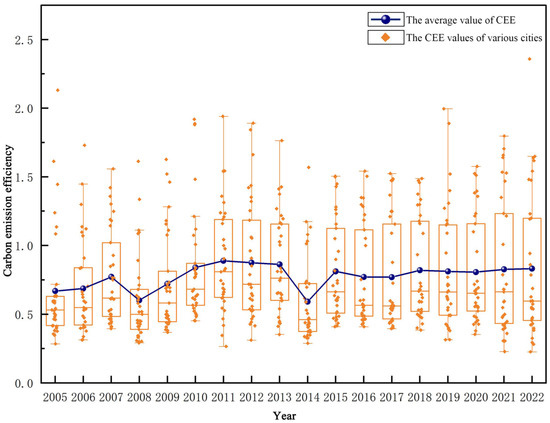
Figure 2.
Box plot of CEE.
Referring to previous research [56], the 33 cities were categorized based on their initial CEE levels and annual average change rates. Using the average efficiency value of all cities in 2005 (0.49) as a benchmark, cities with an initial efficiency above this value were classified as “high-efficiency”, while those below were labeled “low-efficiency”. Additionally, cities with an annual average change rate exceeding 1% were classified as “high-potential”, those with a rate below −1% as “low-potential”, and those between −1% and 1% as “stable”. As shown in Table 3, the largest group of cities (17) fell into the “low-efficiency, high-potential” category, including Lanzhou, Baoji, Deyang, and Liuzhou. The second-largest group, “low-efficiency, stable”, comprised six cities, including Hanzhong, Guangyuan, and Guiyang. The “low-efficiency, low-potential” and “high-efficiency, low-potential” categories each contained four cities; the former included Nanning, Ankang, Tianshui, and Dingxi, while the latter included Wuzhou, Yan’an, Hezhou, and Zigong. Only one city was classified as “high-efficiency, high-potential” (Guilin) and another as “high-efficiency, stable” (Longnan). Notably, 27 of the 33 cities fell into the low-efficiency categories, while 18 exhibited high potential for improvement, reinforcing the conclusion that CEE in WVCs remains relatively low.

Table 3.
Classification of CEE temporal change.
3.2. Spatial Differentiation
Figure 3 illustrates the fluctuations in average CEE across northern, central, and southern cities, revealing notable regional differences. Among these regions, central cities experienced the most significant overall increase in efficiency, rising from 0.63 in 2005 to 1.07 in 2022, surpassing the national average increase from 0.67 to 0.83. In contrast, southern and northern cities showed more modest gains, with efficiency values rising from 0.69 to 0.79 and 0.68 to 0.69, respectively. These disparities may be attributed to differences in economic development levels, industrial structures, land use scales, technological investment, and innovation capacities among cities in different regions.
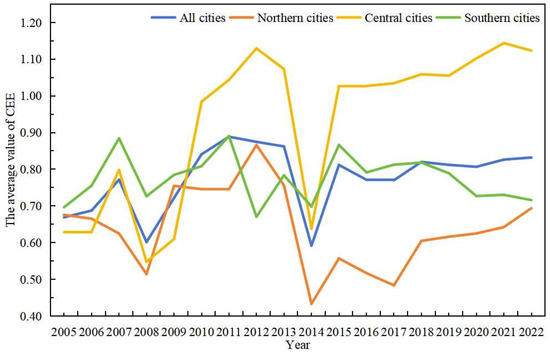
Figure 3.
Line graph of CEE average value.
Using an equal-interval classification method, urban CEE was categorized into four levels: high (1.81–2.40), relatively high (1.21–1.80), relatively low (0.61–1.20), and low (0.00–0.60). Figure 4 highlights the evolving spatial distribution of cities within these categories over time. In 2005, most valley cities in the northern and southern regions were classified as low-efficiency, while central cities exhibited a mix of low and relatively low efficiency. By 2010, the number of low-efficiency cities decreased overall, with many northern and southern cities transitioning to relatively low efficiency. Central cities predominantly fell into the relatively low-efficiency category, with two cities advancing to high and relatively high efficiency. In 2015, there was a slight increase in low-efficiency cities, primarily in the northern region. While central cities saw little change, losing one high-efficiency city but gaining one relatively high-efficiency city, the southern region saw an increase of four relatively high-efficiency cities, alongside a decrease of one city each in the low and high-efficiency categories. In 2020, the number of low-efficiency cities rose again, particularly in the southern region, whereas central and northern cities experienced minimal changes. In 2022, all three regions underwent notable efficiency shifts. In the north, two relatively low-efficiency cities downgraded to low efficiency, while one low-efficiency city improved to relatively low efficiency, and one relatively high-efficiency city advanced to high efficiency. Similar trends were observed in the southern region, whereas central cities exhibited fewer changes.
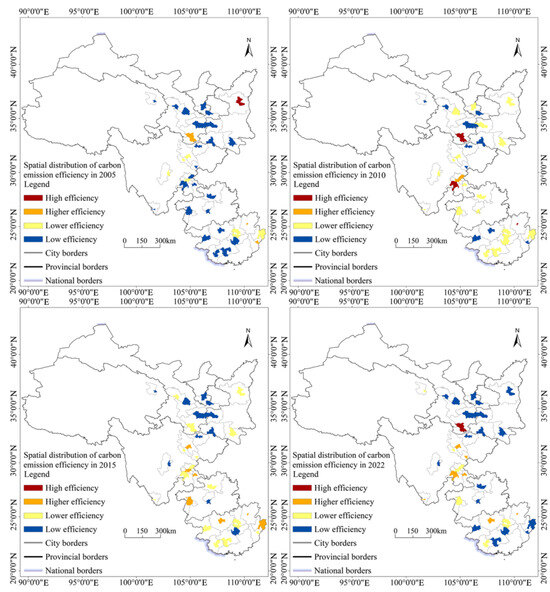
Figure 4.
Spatial distribution of CEE.
4. Spatiotemporal Heterogeneity of Influencing Factors
4.1. Variable Testing and Model Selection
To prevent multicollinearity among the nine influencing factor variables, the variance inflation factor (VIF) method was applied [57]. The results showed that all VIF values were below 10 and tolerance values exceeded 0.1 (Table 4), confirming the absence of multicollinearity.

Table 4.
Multicollinearity test.
The OLS regression results (Table 5) indicate that three of the nine independent variables (scientific and technological investment, road density, and green space ratio) did not pass the significance test for their effects on the dependent variable (p > 0.05). This outcome may stem from the inherent limitations of traditional global regression models, which assume constant variable relationships across spatial and temporal dimensions while neglecting potential spatial heterogeneity and temporal dynamics; this could result in statistically insignificant findings.

Table 5.
OLS regression model results.
Therefore, utilizing the GTWR plugin in ArcGIS 10.6, with the bandwidth automatically set and the spatiotemporal distance parameter ratio fixed at 1, a GTWR analysis was conducted to evaluate the influencing factors. The corrected Akaike Information Criterion (AICc) and goodness-of-fit R2 were selected as model confidence evaluation metrics [58]. By comparing the fitting results of different models [59], the findings (Table 6) demonstrate that the GTWR model achieved an AICc value of 400.88, which is 23.93, 255.11, and 298.19 lower than those of the TWR, GWR, and OLS models, respectively. The R2 of the GTWR model reached 0.997, outperforming the GWR, TWR, and OLS models. Given its incorporation of spatiotemporal dimensions, the GTWR model exhibited superior accuracy. Hence, the GTWR model was adopted to better elucidate the impacts of variables on CEE in WVCs.

Table 6.
Comparison of Regression Attributes of Influencing Factors in OLS, GWR, TWR, and GTWR Models.
4.2. Temporal Variation of Influencing Factors
GTWR analysis revealed significant temporal variations in the direction, magnitude, and trends of the nine variables across different dimensions affecting CEE.
4.2.1. Economic Development Dimension
Among the three economic development variables (Figure 5), per capita GDP and technological investment generally promoted CEE, whereas the proportion of secondary industry had a suppressive effect. Per capita GDP had the strongest positive impact, with an average regression coefficient of 0.33. Its effect initially declined before increasing again, with relatively minor fluctuations in the dispersion of regression coefficients, suggesting a stable influence of economic development on CEE across cities. Technological investment, with an average regression coefficient of 0.02, was the weakest among the four promoting variables. Its impact transitioned from negative to positive over time, gradually strengthening. The dispersion of regression coefficients first decreased and then increased, suggesting that while technological investment became a more significant driver of CEE, inter-city disparities widened due to differences in urban development, technological resources, and funding. The proportion of secondary industry, with an average regression coefficient of −0.06, exhibited a fluctuating downward trend, alternating between positive and negative values before ultimately becoming a strong inhibitory factor. This pattern suggests that WVCs continue to face challenges such as outdated industrial technology and insufficient progress in improving industrial quality and efficiency. Additionally, the dispersion of regression coefficients initially narrowed before widening, reflecting significant inter-city differences in industrial structure, energy use, and technological development.
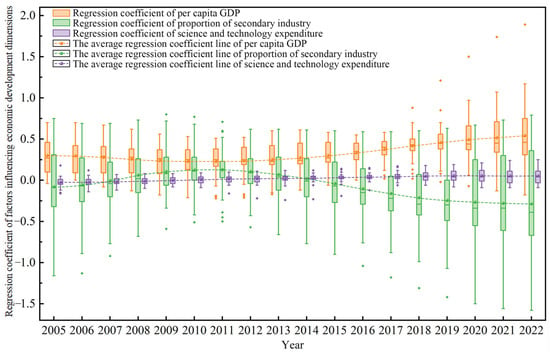
Figure 5.
Temporal change box plot of regression coefficient for economic development dimension.
4.2.2. Urban Construction Dimension
The four urban construction variables exhibited complex influences on CEE, with varying overall trends and significant annual fluctuations (Figure 6). Population density and road density generally promoted CEE, with average regression coefficients of 0.13 and 0.03, respectively. However, while the impact of population density gradually declined, road density shifted from a negative to a positive effect, showing an upward trend. This suggests that in valley cities with constrained spatial capacity and intricate road networks, continuous population concentration may not necessarily contribute to emission reduction and efficiency improvement. In contrast, optimizing urban road networks and increasing road density can enhance CEE. The dispersion of regression coefficients indicates that inter-city differences in the impact of population density increased over time, whereas those of road density decreased, reflecting the diverse urbanization processes in WVCs over the past two decades. Green space ratio and land use scale had inhibitory effects on CEE, with average regression coefficients of −0.10 and −0.05, respectively. The green space ratio consistently exhibited a negative impact, which further intensified over time. Meanwhile, land use scale initially contributed positively but later turned negative, continuing to decline. This pattern suggests that, in the early stages of development, the expansion of land use in WVCs supported improvements in CEE. However, ongoing expansion, particularly large-scale idle or inefficient land use, eventually led to efficiency reductions.
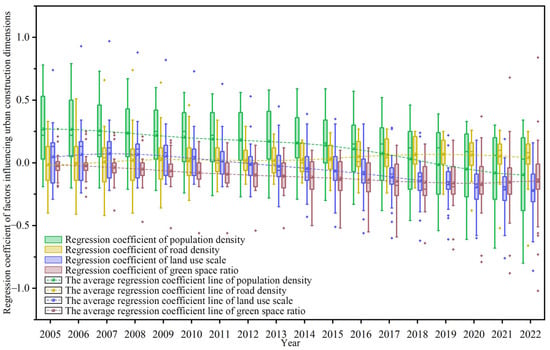
Figure 6.
Temporal change box plot of regression coefficient for urban construction dimension.
4.2.3. Energy Use Dimension
Both energy use variables had inhibitory effects on CEE, though their degrees and trends differed significantly (Figure 7). Energy intensity exerted the strongest inhibitory effect among all five suppressive variables, with an average regression coefficient of −0.24. Its impact and inter-city disparities initially declined before rising again, a trend closely linked to national and regional economic restructuring and development shifts in western areas. Gas usage had the weakest inhibitory effect, with an average regression coefficient of −0.02. Its impact and inter-city variations showed a fluctuating upward trend, suggesting that while the negative effect of gas usage on CEE intensified over time, significant disparities emerged among cities due to differences in gas types and consumption levels, particularly in natural gas usage.
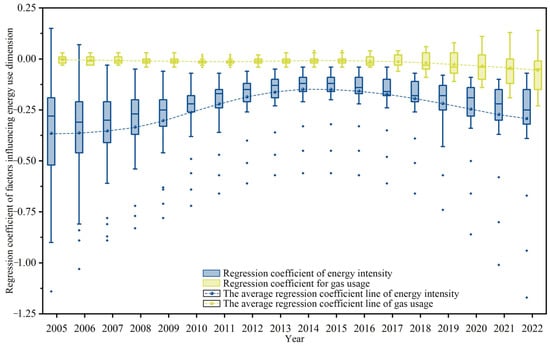
Figure 7.
Temporal change box plot of regression coefficient for energy use dimension.
4.3. Spatial Variation of Influencing Factors
Using ArcGIS 10.6, the average regression coefficients of the nine variables from 2005 to 2022 were categorized into four levels. If all cities exhibited either positive or negative average values, they were divided into four equal intervals. Otherwise, the values were first separated into two categories based on whether they were positive or negative, and then each category was further divided into two equal levels.
4.3.1. Economic Development Dimension
As shown in Figure 8, the positive effect of per capita GDP on CEE increased from south to north. This effect was particularly strong in 24 cities, including Xining in the north, Deyang in the central region, and Zunyi in the south. However, three southern cities, Guilin, Hezhou, and Wuzhou, showed inhibitory effects. The impact of the proportion of secondary industry on CEE exhibited an irregular spatial pattern. Cities with positive effects were mainly concentrated in the border region between the central and southern areas, with the strongest effects observed in Zigong, Yibin, Luzhou, Liupanshui, and Zunyi. Conversely, cities with inhibitory effects were primarily located in the northern region and parts of the south, with Hezhou, Wuzhou, and Guilin experiencing the strongest negative impacts. The positive effect of technological investment on CEE was highest in the central region and lower in both the northern and southern areas. It positively influenced 27 cities, with the strongest effects in Longnan, Hanzhong, Ankang, Mianyang, and Guangyuan. Only six cities exhibited inhibitory effects, which were scattered across different regions, with the strongest negative impacts observed in Wuzhou, Hezhou, and Panzhihua. Overall, the effects of the three influencing factors on CEE align with the findings of Sun Xiumei and Wang Xinping et al. in their studies on CEE determinants in resource-based cities and basin cities [10,26]. This demonstrates that, regardless of the region (northern, central, or southern), economic development and technological investment have played varying degrees of positive roles in enhancing urban CEE. However, the inhibitory effect of the secondary industry proportion exhibits minor discrepancies in southern regions compared to existing studies, likely due to differences in industrial structure or technological upgrading. These variations may be closely tied to regional disparities in economic development levels, industrial foundations, and innovation entities centered on universities and research institutes.
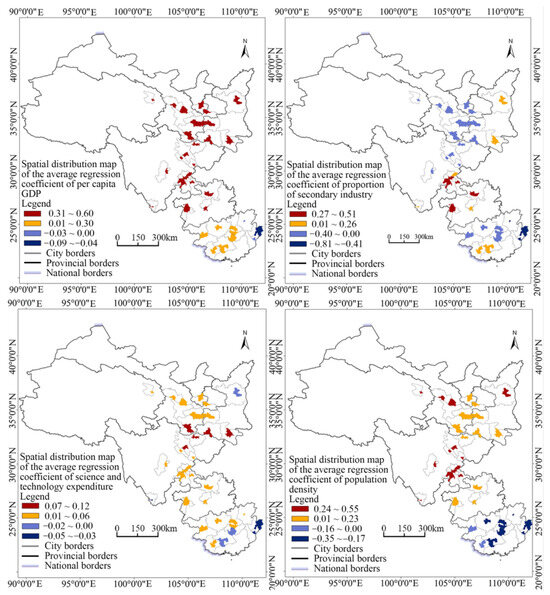
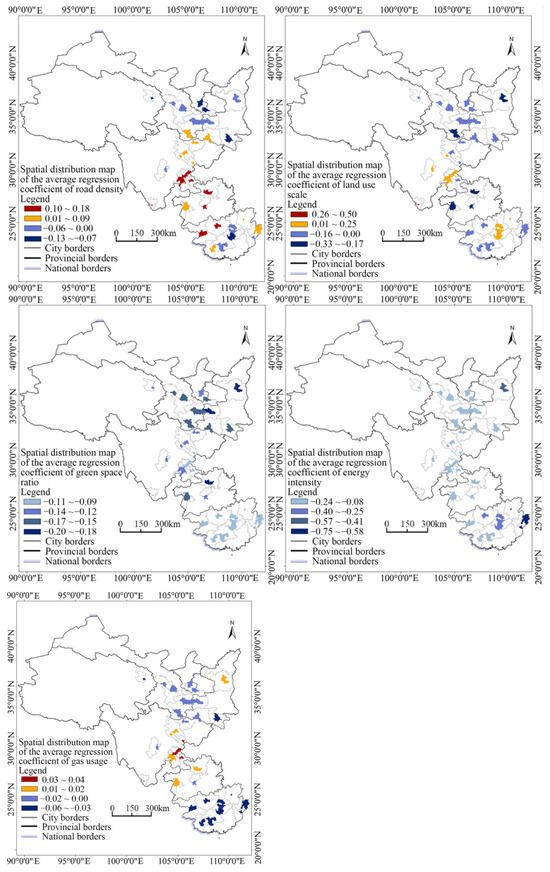
Figure 8.
Spatial distribution diagram of the average regression coefficient of GTWR influencing factors.
4.3.2. Urban Construction Dimension
The impact of population density on CEE varied spatially, shifting from an inhibitory effect in the south to a promotional effect in the north. It strongly promoted efficiency in 24 cities, including Lanzhou in the north, Ya’an in the central region, and Panzhihua in the south. However, nine southern cities, such as Guilin, Liuzhou, and Hezhou, exhibited inhibitory effects. The influence of road density on CEE did not follow a clear spatial pattern. It enhanced efficiency in 19 cities, with the strongest effects observed in Zigong, Yibin, Luzhou, Liupanshui, and Zunyi. In contrast, inhibitory effects were primarily concentrated in northern cities and a few southern cities, with Xining, Guyuan, Pingliang, Ankang, and Laibin experiencing the strongest negative impacts. Land use scale predominantly exerted an inhibitory effect, with 24 cities across all three regions displaying negative impacts, particularly in Zunyi, Liupanshui, Guiyang, Longnan, and Yan’an. Only a few central and southern cities, such as Ya’an, Panzhihua, and Guilin, exhibited positive effects, with Panzhihua showing the strongest positive impact. Green space ratio consistently demonstrated an inhibitory effect, following a spatial pattern of increasing from south to north, then decreasing, and increasing again. The strongest inhibitory effects were observed in Yan’an, Baoji, and Zunyi. Overall, these four factors did not exhibit uniform effects on CEE across different city types. While the positive impact of population density aligns with existing research, the effects of road density and green space ratio differ from previous findings [26,32]. These discrepancies may stem from variations in geographical environments, historical development, demographic conditions, and policy frameworks in WVCs. For instance, compared to southern regions, northern cities generally have larger land areas with lower population densities. In such areas, an increase in population density can promote compact urban development and more efficient resource utilization, thereby reducing carbon emissions from energy consumption and improving CEE.
4.3.3. Energy Use Dimension
Energy consumption intensity had a clear inhibitory effect on CEE, with the strength of this effect increasing from north to south. The strongest inhibitory impacts were observed in Hezhou and Wuzhou. In contrast, the effect of gas usage varied across cities, following a spatial pattern in which central regions generally experienced positive effects, while northern and southern regions exhibited inhibitory effects. Specifically, gas usage promoted CEE in 10 cities, with the strongest effects observed in Suining, Neijiang, Zigong, and Luzhou. Conversely, 23 cities showed inhibitory effects, with the most pronounced impacts in Nanning, Laibin, Ankang, and 12 other cities. Overall, energy consumption intensity and gas usage exhibited distinct influences on CEE, differing not only in their mechanisms but also in the spatial distribution of their impact magnitudes. The observed inhibitory effect of energy consumption intensity aligns with existing research, although regional variations were identified in this study [1,34]. These discrepancies may be attributed to differences in the share of clean energy sources, such as solar and wind power, in local energy consumption structures. Additionally, most central cities, characterized by high gas usage, have developed efficient and intensive utilization mechanisms. In contrast, northern and southern cities have yet to demonstrate similar efficiencies, likely due to significant inter-city variations in energy infrastructure and consumption patterns.
5. Discussion
To provide a novel perspective for understanding urban low-carbon development pathways under geographical environmental constraints, this paper addresses the limited attention to CEE in WVCs within existing research and employs the super-efficiency SBM model and GTWR model to reveal the spatiotemporal characteristics of CEE in WVCs and the complexity of their influencing factors. The conclusions align with existing research while highlighting the uniqueness of WVCs. Their spatiotemporal differentiation characteristics and policy implications merit further exploration.
5.1. Discussion on Spatiotemporal Differentiation Characteristics
Consistent with prior studies, the significant positive effects of economic development level and technological investment on CEE reaffirm the pivotal role of “economic quality enhancement” and “technological empowerment” in low-carbon transitions [10,29]. However, the geographical constraints of WVCs amplify the spatiotemporal heterogeneity of these factors. For instance, in northern cities, due to topographical constraints and reliance on traditional fossil fuels in their energy structure, the emission reduction effects of per capita GDP are weaker compared to central and southern cities. In contrast, central cities exhibit an “innovation dividend” driven by technological investments, which is more prone to agglomeration and diffusion within valley spaces, differing from the technology spillover patterns observed in plain cities [32]. Furthermore, the inhibitory effect of the proportion of secondary industries is less pronounced in southern cities, likely attributable to their abundant hydropower resources and faster transition of energy-intensive industries toward cleaner practices. This finding challenges the generalized conclusion in traditional studies that “the proportion of secondary industries is negatively correlated with CEE” [26], suggesting that industrial structure optimization should be regionally tailored based on resource endowments.
Impact mechanisms in the urban construction dimension reveal the spatial morphological particularities of valley cities. The contrasting effects of population density—enhancing CEE in northern cities while inhibiting it in southern cities—are closely tied to land resource scarcity in valley environments. In northern cities, population agglomeration facilitates intensive development, reducing per capita infrastructure-related carbon emissions. Conversely, in southern valley cities constrained by spatial saturation, excessive agglomeration may exacerbate traffic congestion and energy consumption, leading to “scale diseconomies”. Similarly, the stronger positive effect of road density in southern cities highlights the optimized role of road network improvement in reducing transportation carbon emissions within mountainous terrains. This finding contrasts with conclusions from plain-city studies where “road expansion may induce incremental emissions” [30], emphasizing the dual-edged effect of infrastructure development under topographic constraints.
Spatiotemporal heterogeneity in the energy usage dimension reflects regional disparities in energy transition progress. The pronounced inhibitory effect of energy consumption intensity in northern cities correlates with their heavy industry-dominated energy structures, while the promoting effect of gas utilization in central cities benefits from effective implementation of coal-to-gas conversion policies. Notably, the inhibitory role of gas usage in some southern cities may be attributed to excessive reliance on liquefied petroleum gas (LPG) and insufficient clean energy substitution. This suggests that “gas type” rather than “gas penetration rate” serves as the critical variable influencing CEE, necessitating finer-grained energy category data in future research.
5.2. Discussion of Policy Recommendations
This study offers dual implications for policy design. On the one hand, common strategies such as increasing investment in science and technology and optimizing industrial structure remain foundational for emission reduction and efficiency improvement. On the other hand, differentiated measures tailored to the geographic characteristics of valley cities are imperative. For instance: Northern cities should prioritize promoting clean energy transitions by introducing wind and solar energy through cross-regional power transmission projects. Southern cities need to align spatial planning with population carrying capacity and develop multi-dimensional transportation networks to mitigate topographic constraints. Central cities can leverage their innovation advantages to explore an integrated chain model of “low-carbon technology incubation–industrial application–regional diffusion”. Furthermore, establishing ecological compensation mechanisms among valley cities and balancing regional efficiency disparities through carbon sink trading may emerge as innovative pathways to transcend geographic limitations.
6. Conclusions, Policy Recommendations, and Limitations
6.1. Conclusions
The key conclusions of this paper are as follows:
- (1)
- The overall CEE in WVCs is relatively low, with a complex trend of change. Central cities have the highest average efficiency, followed by southern cities, and northern cities show the lowest efficiency. Significant differences exist in the quantity and spatial distribution of cities across the four efficiency grades (high, relatively high, relatively low, and low) over time.
- (2)
- The directions and magnitudes of the influencing factors on CEE show notable spatiotemporal variations. The promotional effects of technological investment, road density, population density, and per capita GDP on CEE increased in that order, while the inhibitory effects of energy consumption intensity, green space ratio, proportion of secondary industry, land use scale, and gas usage decreased sequentially. These impacts exhibited fluctuating trends with various patterns. Particularly, Northern River Valley cities showed stronger promotional effects from per capita GDP and population density, and stronger inhibitory effects from land use scale and green space ratio. Central River Valley cities experienced stronger positive effects from per capita GDP, technological investment, and population density, with stronger inhibitory effects from green space ratio and energy consumption intensity. Southern River Valley cities demonstrated stronger positive effects from per capita GDP and road density, along with stronger inhibitory effects from population density, energy consumption intensity, and gas usage.
6.2. Policy Recommendations
Based on the findings of this study, we propose the following recommendations:
- (1)
- Promote the application of low-carbon technologies as a core strategy by prioritizing scientific and technological innovation and energy transformation. To achieve this, a regional special fund should be established to support the development of clean energy technologies, such as photovoltaic and wind energy, especially in northern and central cities. Additionally, collaboration among industries, universities, and research institutes should be encouraged to foster innovation. Smart city management systems should be promoted, utilizing the Internet of Things and big data to enable real-time monitoring of industrial and transportation carbon emissions, alongside the implementation of dynamic control mechanisms. To further accelerate the transformation of the energy structure, the use of natural gas and renewable energy for heating should be promoted in northern cities, while developing distributed photovoltaic and energy storage systems based on hydropower resources in southern cities.
- (2)
- Optimize industrial and spatial structures for green and intensive development. To this end, a categorization approach can be adopted to guide the green upgrading of industries. For example, northern cities should focus on the low-carbon transformation of traditional industries, exploring hybrid models like “coal power + new energy”. Central cities should leverage technological advantages to develop high-end manufacturing and productive service industries, reducing the negative impact of the secondary industry’s proportion on CEE. Southern cities should prioritize eco-tourism and green agriculture, while strictly controlling the expansion of energy-intensive industries. Additionally, strict control of unregulated land expansion is necessary. Revitalizing existing land through urban renewal initiatives and promoting three-dimensional development could further improve urban infrastructure. Road density and public transport coverage should also be improved, in addition to optimizing the layout of green spaces. At the same time, strengthening regional synergy and social participation would ensure a more integrated and sustainable urban development approach.
- (3)
- Regional synergy and social participation should be strengthened to build a long-term guarantee mechanism. Establish platforms for technology sharing, ecological compensation, and carbon trading among northern, central, and southern cities to bridge efficiency gaps. Promote low-carbon concepts through community outreach, media campaigns, and educational programs. Encourage green travel and waste classification to integrate the “dual carbon” goal with the objective of high-quality urban development.
6.3. Limitations
This study utilized the GTWR model to analyze the influencing factors and spatiotemporal heterogeneity of CEE in WVCs, providing both theoretical insights and practical implications. However, to address current limitations, future research could simulate CEE under various development scenarios, taking into account regional disparities in urban development environments, economic levels, and planning contexts. Additionally, given the complexity of the factors affecting CEE (e.g., urban spatial form, economic functions, low-carbon city pilot policies), future studies should incorporate additional variables to provide more targeted theoretical support for formulating effective emission reduction strategies and achieving the “dual carbon” goals.
Author Contributions
Conceptualization, X.Z. and N.Z.; data curation, N.Z.; formal analysis, S.W. and J.D.; investigation, N.Z., S.W. and X.P.; methodology, X.Z., N.Z. and J.D.; project administration, X.Z.; resources, S.W.; software, N.Z., S.W. and J.D.; supervision, X.Z.; validation, X.Z., N.Z., and S.W.; visualization, N.Z., J.D. and X.P.; writing—original draft, N.Z.; writing—review and editing, X.Z. All authors have read and agreed to the published version of the manuscript.
Funding
This research was supported by the National Natural Science Foundation of China (Nos. 42261034), and the Innovation Foundation of Education Bureau of Gansu Province of China (Nos. 2025A-036).
Institutional Review Board Statement
Not applicable.
Informed Consent Statement
Not applicable.
Data Availability Statement
The original contributions presented in this study are included in the article. Further inquiries can be directed to the corresponding author.
Acknowledgments
All authors sincerely thank the editors and reviewers for their constructive comments and valuable suggestions on this article.
Conflicts of Interest
The authors declare no conflicts of interest.
Abbreviations
The following abbreviations are used in this manuscript:
| CEE | Carbon emission efficiency |
| WVCs | Western Valley cities |
| SBM | Slacks-based measure |
| GTWR | Geographically and temporally weighted regression |
| GDP | Gross domestic product |
References
- Song, Q.; Li, C.; Chen, J. Spatio-temporal evolution and influencing factors of carbon emission efficiency in the Yangtze River Delta Region at the city scale. J. Nanjing For. Univ. (Nat. Sci. Ed.) 2023, 47, 251–262. [Google Scholar]
- Liu, F.; Tang, L.; Liao, K.; Ruan, L.; Liu, P. Spatial distribution and regional difference of carbon emissions efficiency of industrial energy in China. Sci. Rep. 2021, 11, 19419. [Google Scholar] [CrossRef] [PubMed]
- Cai, B.; Cui, C.; Zhang, D.; Cao, L.; Wu, P.; Pang, L.; Zhang, J.; Dai, C. China city-level greenhouse gas emissions inventory in 2015 and uncertainty analysis. Appl. Energy 2019, 253, 113579. [Google Scholar] [CrossRef]
- Wang, F.; Wang, R.; Nan, X. Marginal cost of CO2 emission reduction in China its influencing factors. J. World Econ. 2014, 37, 115–141. [Google Scholar]
- Lin, B.Q.; Liu, X.Y. Carbon emissions in China’s urbanization stage: Influencing factors emission reduction strategies. Econ. Res. J. 2010, 45, 66–78. [Google Scholar]
- Cheng, Y.; Wang, Z.; Zhang, S.; Ye, X.; Jiang, H. Spatial econometric analysis of carbon emission intensity and its driving factors from energy consumption in China. Acta Geogr. Sin. 2013, 68, 1418–1431. [Google Scholar]
- Zhang, Z.Q.; Zhang, T.; Feng, D.F. Study on regional differences dynamic evolution convergence of carbon emission intensity in China. J. Quant. Tech. Econ. 2022, 39, 67–87. [Google Scholar]
- Jiao, G.; Yan, M. Measurement of coupling degree of China’s urbanization level and carbon productivity. Urban Probl. 2016, 8, 32–38. [Google Scholar] [CrossRef]
- Shi, D. Regional differences in China’s energy efficiency and conservation potentials. China Ind. Econ. 2006, 15, 49–58. [Google Scholar]
- Sun, X.; Wang, G.; Dong, H.; Zhang, H. Research on efficiency of carbon emission of resource-based cities based on DEA model and SE-SBM model: A case study on 106 level of China mutual ground and above resource-based cities. Sci. Technol. Manag. Res. 2013, 36, 78–84. [Google Scholar]
- Sun, X.; Liu, X. Spatiotemporal evolution and influencing factors of urban carbon emission efficiency in China: Based on a heterogeneous spatial stochastic frontier model. Geogr. Res. 2023, 42, 3182–3201. [Google Scholar]
- Zhang, H.; Qiao, Z.; Xu, K.; Gao, D.F. Study on temporal and spatial differences of carbon emission efficiency: Based on cities in six provinces of central China. J. Ind. Technol. Econ. 2018, 37, 86–93. [Google Scholar]
- Sun, H.; Zhang, Z.; Zhou, R. Evaluation of carbon emission efficiency for west of China based on stochastic frontier analysis. J. Ind. Technol. Econ. 2013, 43, 71–77. [Google Scholar]
- Wang, S.; Gao, S.; Huang, Y.; Shi, C. Spatiotemporal evolution pattern and prediction of carbon emission performance of Chinese cities based on super-efficient SBM model. Acta Geogr. Sin. 2020, 75, 1316–1330. [Google Scholar]
- Xu, Y.; Cheng, Y.; Wang, J. Spatio-temporal evolution influencing factors of carbon emission efficiency in low carbon city of China. J. Nat. Resour. 2022, 37, 1261–1276. [Google Scholar] [CrossRef]
- Li, W.; Dong, F.; Ji, Z. Evaluation of carbon emission efficiency and reduction potential of 336 cities in China. J. Clean. Prod. 2023, 428, 139372. [Google Scholar] [CrossRef]
- Song, M.; Zou, S. Regional differences, convergence and influencing factors of carbon emissions efficiency in the Yellow River Basin. Yellow River 2022, 44, 6–12+56. [Google Scholar]
- Zhang, N.; Sun, F.; Hu, Y. Spatio-temporal evolution, regional differences, and influencing factors of carbon emission efficiency in the Yangtze River Economic Belt. Resour. Environ. Yangtze Basin 2024, 33, 1325–1339. [Google Scholar]
- Yang, Q.K.; Wang, L.; Lü, L.G.; Li, P.X.; Fan, Y.T.; Zhu, G.L.; Wang, Y.Z. Regional differences and spatial spillover effects of urban carbon emission efficiency in the Yangtze River Delta. Environ. Sci. 2024, 46, 19–29. [Google Scholar] [CrossRef]
- Ping, Z.; Wu, X.; Wu, X. Spatial-temporal differences and its influencing factors of carbon emission efficiency in the Yangtze River Economic Belt. Ecol. Econ. 2020, 36, 31–37. [Google Scholar]
- Peng, W.; Cao, X.; Su, C.; Kuang, C.E. Spatio-temporal evolutionary characteristics of carbon efficiency in the middle reaches of the Yangtze River urban agglomeration based on a three-stage SBM-DEA model. Acta Ecol. Sin. 2023, 43, 3532–3545. [Google Scholar] [CrossRef]
- Wang, Y.; Yuan, D. Research on the temporal and spatial evolution pattern of carbon efficiency in Chinese cities and optimization. Ecol. Econ. 2022, 38, 93–100. [Google Scholar]
- Li, J.; Huang, X.; Chuai, X.; Sun, S.C. Spatio-temporal characteristics and influencing factors of carbon emissions efficiency in the Yangtze River Delta Region. Resour. Environ. Yangtze Basin 2020, 29, 1486–1496. [Google Scholar]
- Wei, L.; Hou, Y.; Cao, H. Urban carbon emission performance in China: Dynamic decomposition spatial difference influencing factors. J. Stat. Inf. 2024, 39, 69–83. [Google Scholar]
- Zhang, Y. Dynamic evolution, regional differences, and spatial convergence of carbon emission efficiency in Chinese Cities. Urban Probl. 2023, 336, 33–42+83. [Google Scholar] [CrossRef]
- Wang, X.; Shen, Y.; Su, C. Spatial and temporal heterogeneity of urban carbon emission efficiency and spillover effect in the Yellow River Basin. Ecol. Econ. 2023, 39, 26–34. [Google Scholar]
- Du, K.; Zou, C. Regional disparity, affecting factors and convergence analysis of carbon dioxide emission efficiency in China: On Stochastic Frontier Model and Panel Unit Root. Zhejiang Soc. Sci. 2011, 11, 32–43. [Google Scholar]
- Fang, D.; Wang, L. Network characteristics and influencing factors of spatial correlation of carbon emissions in China. Resour. Environ. Yangtze Basin 2023, 32, 571–581. [Google Scholar]
- Xu, Y.; Cheng, Y.; Wang, J. Spatiotemporal evolution of carbon emission efficiency and the impact of green technology innovation in resource based cities in China. Geogr. Res. 2023, 42, 878–894. [Google Scholar]
- Quan, T.; Zhang, H.; Xu, Y. The spatial correlation network influencing factors of carbon emission efficiency in the Yangtze River Delta urban agglomeration. J. Nanjing For. Univ. (Nat. Sci. Ed.) 2024, 48, 217–228. [Google Scholar] [CrossRef]
- Dong, K.; Yang, S. Research on the impact of low-carbon energy technology innovation on carbon emission efficiency-Aspatial spillover perspective. J. Ind. Technol. Econ. 2024, 43, 26–36. [Google Scholar]
- Xiao, G.; Chen, C.; Gao, Y. Analysis of dynamic evolution characteristics and influencing factors of carbon emission efficiency in China’s five major urban agglomerations. Stat. Decis. 2023, 39, 159–163. [Google Scholar]
- Li, G.; Zhu, H. Research on the performance of industrial carbon emission in the Yangtze River Economic Belt based on Three-stage SM-DEA-Malmquist. Oper. Res. Manag. Sci. 2022, 31, 161–167. [Google Scholar]
- Wu, X.; Guan, W.; Zhang, H.; Wu, L.X. Spatiotemporal coupling characteristics and influencing factors of carbon emission efficiency and high-quality development in the Yangtze River Delta urban agglomeration. Resour. Environ. Yangtze Basin 2023, 32, 2273–2284. [Google Scholar]
- Wang, Z.; Du, Y. Spatial-temporal differences and influencing factors of carbon emission efficiency in Hunan Province based on SBM-DEA model. Sci. Geogr. Sin. 2019, 39, 797–806. [Google Scholar]
- Sun, Y.; Cheng, Y.; Zhang, H. Study on the impact of intensive use of urban industrial land on carbon emission efficiency in China’s 15 sub-provincial cities. Resour. Environ. Yangtze Basin 2020, 29, 1703–1712. [Google Scholar]
- Li, F.; He, L. Research on total factor energy efficiency measurement and its influential factors in China under the constraint of carbon. Emiss. Ecol. Econ. 2017, 33, 35–41. [Google Scholar]
- Wang, S.; Wang, Z.; Fang, C. Evolution characteristics and driving factors of carbon emission performance in Chinese cities. Sci. China Earth Sci. 2022, 52, 1613–1626. [Google Scholar] [CrossRef]
- Cheng, Y.; Qiao, G.; Mei, S.; Ning, A.F. Spatial-temporal differences of carbon emission efficiency in Zhejiang Province based on SBM-DEA model. Resour. Dev. Mark. 2022, 38, 272–279. [Google Scholar] [CrossRef]
- Li, W.; Liang, W.; Zhang, R.; Zhao, G. Evaluation of carbon emission efficiency for Shanxi using stochastic frontier analysis. Resour. Sci. 2012, 34, 1965–1971. [Google Scholar]
- Sun, X.; Zhang, H.; Wang, G. Evaluation of regional carbon emissions performance based on SE-SBM model: Taking Shandong province as an example. Ecol. Econ. 2016, 32, 68–73. [Google Scholar]
- Zhang, J.; Wang, H. Spatio-temporal evolution and drivers of carbon emission efficiency in Underdeveloped Regions under the “Dual-Carbon” Goal-Heterogeneity analysis of Super-efficient SBM and GTWR Models. Commer. Res. 2024, 2, 93–103. [Google Scholar] [CrossRef]
- Guo, P.; Liang, D. Does the low-carbon pilot policy improve the efficiency of urban carbon emissions: Quasi-natural experimental research based on low-carbon pilot cities. J. Nat. Resour. 2022, 37, 1876–1892. [Google Scholar] [CrossRef]
- Zhang, M.; Xi, S. Evaluation of carbon emission efficiency of resource-based cities its policy enlightenment. J. Nat. Resour. 2023, 38, 220–237. [Google Scholar] [CrossRef]
- Yang, Y.; Wang, Y. The research on territory structure of valley-city in the western China. Areal Res. Dev. 2000, 19, 58–61. [Google Scholar]
- Yang, Y. On the Urban Development and Urban Spatial Structure of Valley Cities in the Western China. Ph.D. Thesis, Nanjing University, Nanjing, China, 2003. [Google Scholar]
- Zhang, X.; Lei, C.; Li, H.; Chen, Q. Exploration of Urban Planning for Western River Valley Cities to Address Climate Change. In Proceedings of the 8th Urban Development and Planning Conference, Zhuhai, China, 17–19 October 2013. [Google Scholar]
- Zhang, X.; Wang, S.; Dong, J.; Zhang, N.; Li, J. Influences of Urban Spatial Structure on Carbon Emissions for the Western Valley Cities. Econ. Geogr. 2025, 45, 80–90. [Google Scholar]
- China National Tourism Administration. The Year Book of China City Statistics; China Statistics Press: Beijing, China, 2022. [Google Scholar]
- Li, J.; Huang, K. Characteristics of urban heat island based on MODlS daily land surfacetemperature product in Lanzhou. Arid Land Geogr. 2017, 40, 1235–1240. [Google Scholar]
- Lu, X.; Yang, X.; Chen, Z. Measurement and temporal-spatial evolution characteristics of urban land green use efficiency in China. China Popul. Resour. Environ. 2020, 30, 83–91. [Google Scholar]
- Tone, K. A slacks-based measure of super-efficiency in data envelopment analysis. Eur. J. Oper. Res. 2002, 143, 32–41. [Google Scholar] [CrossRef]
- Ma, J.; Sun, Y.; Guo, Z.; He, Y.; Fan, M.Y. Research on heterogeneity of the impact of influencing factors on carbon emission in Hebei Province based on GTWR Model. Ecol. Econ. 2023, 39, 23–29+49. [Google Scholar]
- Wu, Z.; Wang, D.; Su, Y. Study on spatial-temporal variation and influencing factors of urban carbon emissions in Guangdong Province based on EDGAR data. Areal Res. Dev. 2020, 39, 127–132+151. [Google Scholar]
- Crippa, M.; Guizzardi, D.; Pagani, F.; Banja, M.; Muntean, M.; Schaaf, E.; Becker, W.; Monforti-Ferrario, F.; Quadrelli, R.; Risquez Martin, A.; et al. GHG Emissions of All World Countries; Publications Office of the European Union: Luxembourg, 2023. [Google Scholar]
- Wu, H.Y.; Meng, Y.; Huang, H.J.; Chen, W.K. Estimation and spatio-temporal divergence of the low-carbon performance of cropland use in China. J. Nat. Resour. 2022, 37, 1148–1163. [Google Scholar] [CrossRef]
- Zhang, Z.; Yu, B.; Guo, X.; Hu, M.S.; He, L.X. Analysis of spatial and temporal heterogeneity of carbon emissions in Middle Yangtze River city cluster based on GTWR model. J. Cent. China Norm. Univ. (Nat. Sci.) 2024, 58, 324–338. [Google Scholar]
- Zhao, W.; Luo, S.; Yuan, X.; Zhang, Q.; Yang, F.; Liu, Y.; Xie, W. Spatiotemporal pattern and influencing factors of carbon emissions at county level in Shanxi Province. Environ. Sci. Technol. 2022, 45, 226–236. [Google Scholar]
- Tian, L.; Zhang, S.; Tian, Q. Spatio-temporal evolutionary characteristics and driving factors of China’s rural financial inclusion from perspective of virtual agglomeration. Sci. Geogr. Sin. 2024, 44, 1005–1015. [Google Scholar]
Disclaimer/Publisher’s Note: The statements, opinions and data contained in all publications are solely those of the individual author(s) and contributor(s) and not of MDPI and/or the editor(s). MDPI and/or the editor(s) disclaim responsibility for any injury to people or property resulting from any ideas, methods, instructions or products referred to in the content. |
© 2025 by the authors. Licensee MDPI, Basel, Switzerland. This article is an open access article distributed under the terms and conditions of the Creative Commons Attribution (CC BY) license (https://creativecommons.org/licenses/by/4.0/).