Article

The Impact of Smart City Construction on the Spatial Distribution of Urban Carbon Emissions Based on the Panel Data Analysis of 277 Prefecture-Level Cities in China

1
Institute of Social Governance, Hebei University of Economics and Business, Shijiazhuang 050061, China
2
School of Public Administration, Hebei University of Economics and Business, Shijiazhuang 050061, China
3
School of Business, University of Wollongong Malaysia, Shah Alam 40150, Malaysia
4
Urban Development Research Center, Yangtze Delta Region Institute of Tsinghua University, Jiaxing 314006, China
*
Author to whom correspondence should be addressed.
Sustainability 2025, 17(11), 4934; https://doi.org/10.3390/su17114934
Submission received: 1 April 2025 / Revised: 17 May 2025 / Accepted: 22 May 2025 / Published: 27 May 2025

Abstract

:
The construction of smart cities, as a key driving force for the low-carbon transformation of the economy, urgently needs a systematic assessment of its carbon emission reduction potential. Based on the panel data of 277 cities in China from 2007 to 2021, this study adopts innovative methods, integrates bibliometric analysis, and employs empirical models to deeply explore the impact of smart city construction on carbon emissions and its regional heterogeneity and resource endowment heterogeneity. The main findings are as follows: (1) The research on smart cities and carbon emissions present knowledge synergy, focusing on innovation and green development strategies. (2) A series of robustness tests show that smart city construction can significantly reduce urban carbon emissions. (3) Heterogeneity analysis reveals that the carbon emission reduction effect varies between regions (more significant in the northern region) and with resource endowments (non-resource-based cities are more advantageous). The important contribution of this study lies in its quantitative assessment of the carbon emission reduction effect of smart city construction, as well as its heterogeneity; this study also provides a solid empirical basis for formulating more targeted regional smart city development policies.

1. Introduction

1.1. Research Background

With the expansion of human activities and the acceleration of economic development, global warming and climate change are becoming increasingly severe [1,2,3,4]. In the context of the accelerated development of global urbanization, cities contribute about 75% of global carbon emissions (CEs) [5], and spatial distribution research and low-carbon governance paths have become the key to achieving climate goals. Therefore, in the pursuit of high-quality economic growth, encouraging green and low-carbon transformations, lessening energy use, and pushing for sustainable urban development have become particularly key goals [6,7,8,9]. As a responsible global power [10,11,12], at the United Nations Climate Conference held in September 2020, China proposed the targets of achieving “carbon peak” by 2030 and “carbon neutrality” by 2060 [13]. In its dual role as the world’s largest carbon emitter and a smart city construction (SC) pioneer, China has to deal with the dual challenges of the “twin goals” and digital transformation. The construction of smart cities is the result of the deep integration of digital technology and urban governance, and there is a complex interaction mechanism between their development and CEs. As things stand, the multi-dimensional conduction path of this interaction mechanism has not been fully deconstructed, and there are still theoretical gaps. Therefore, it holds great importance in investigating SCs, the geographical variation in CEs, and the interaction between emission sources, all of which play a vital role in promoting China’s sustainable development and achieving its carbon reduction targets.

1.2. Research Gaps

The concept of a “smart city” was first proposed in the United States in the 1990s [14]. Since the 1990s, starting from the “Information Highway(NII)” plan of the United States [15], countries and regions like Singapore and the European Union have joined in SC construction, facilitating the shift and enhancement in urban management and services and setting off a wave of digital reconstruction of global urban governance models. This trend not only reflects the evolution from industrial civilization to digital information civilization, but also reveals the deep integration of information technology and urban governance modernization. In 2010, IBM formally elaborated the concept of a “smart city”. Its vision [16] not only provides new ideas for urban development for the international community, but also has a positive impact on China’s green sustainable development and long-term social stability. The construction of smart cities has emerged as a vital policy practice in reducing urban CEs and fostering sustainable economic development [17]. The concept of a “smart city” aims to optimize the city’s management and service level in an all-round way through cutting-edge technology. Its core concept [18] emphasizes the use of big data, the Internet of Things (IoT), cloud computing, and other information and communication technologies to build an efficient and transparent urban ecosystem, so as to realize the rational allocation of resources, efficient coordinating operations, and significant improvements in residents’ quality of life. Under the guidance of this core concept, cities are improving their urban operation efficiency, optimizing the quality of their public services, and accelerating their low-carbon environmentally friendly development with the supports of a full range of information perception, stable and efficient information transmission, and accurate scientific information processing. This innovative urban development model not only attaches great importance to the in-depth application of advanced information technology, but also elaborately creates a new urban environment that is livable, intelligent, and eco-friendly from the grand perspective of sustainable development. Under this background, China launched the “smart city” pilot policy in 2012 [19], marking an important step in improving urban management, enhancing its public service capacity, and promoting sustainable economic development. These pilot cities have explored a series of innovative practices through information technology integration and urban governance, including the use of data sharing platforms, intelligent transportation systems, environmental monitoring networks, and smart medical services, covering multiple fields of urban management. These experiences not only provide a valuable reference for smart city construction, but also offer a model for the sustainable development of other cities.
Over the past few years, a great deal of research has been carried out by many scholars on different aspects of green low-carbon and sustainable development, mainly covering climate change, ecological economy, and the relationship between economic development and the ecological environment. The research of Yan et al. [20] shows that countries with higher levels of ecological security perform better in energy efficiency than other countries. In addition, scholars have also conducted various studies on the relationship between SCs and CEs. In terms of SCs, they mainly focus on theoretical studies, practical explorations, and methodological investigations. The theoretical research has mainly studied the conceptual connotations, theoretical framework, and function of smart cities [2]. Practical research has mainly focused on the digital economy [21,22], information and green innovation, and communication technology [23]. And the research methods that are used mainly include case studies and policy evaluation. In regard to CEs, the existing investigations concentrate on important factors in carbon emission reduction (CER) [24] and CEs [25,26,27], technological development, coordinated development of the economy and ecology [28], and sustainable development [29]. Although the existing research has laid a foundation for the discussion of the connection between SCs and urban CEs, there are still some obvious shortcomings and difficulties in this field. From one perspective, when analyzing the influence of SC development on CEs, existing studies often lack in-depth consideration of regional differences and different resource endowments among cities, which limits the universality and accuracy of their research conclusions. On the other hand, there is relatively insufficient heterogeneity analysis of the impact of SCs on the CEs in different regions, which is integral to fully revealing the particularity and difference of each region in the process of SC construction. In addition, some studies have not applied bibliometric analysis and other methods to visualize the link between smart city construction and CEs, which leaves the depth and breadth of the existing research to be further expanded. Therefore, based on the panel data of 277 prefecture-level cities, this study constructs a difference-in-difference (DID) model to systematically analyze the spatial differentiation effect of SCs on urban CEs, and tries to answer two key questions: Do SCs change the spatial distribution pattern of urban CEs? What are the heterogeneous characteristics of this effect in regions with different resource endowments? By answering the above questions, this study aims to make up for the shortcomings of the existing research and provide a solid empirical basis for more targeted smart city policy formulation.

1.3. Research Contribution

As the world faces global climate change and aims for CER, deeply exploring the link between smart city development and urban CEs is of great practical significance and theoretical value. Based on analysis of the panel data from 2006 to 2021 of 277 Chinese cities, this study seeks to comprehensively and accurately show the effect of SCs on urban CEs. The combination of bibliometric analysis and our empirical econometric model can systematically capture the development trend of smart cities and, thus, show a more diverse impact path with large-scale data. Specifically, visualizing the relationship between smart city construction and carbon emissions through bibliometric analysis software can identify the research hotspots and future development trends in this field, enrich the research methods and research contents that are used, and help to guide the direction of smart city-related research. In terms of research methods, this study groups cities according to their regional differences and resource endowments to deeply analyze the heterogeneity of policy influence. Through heterogeneity analysis, we can formulate corresponding development strategies according to local conditions to strengthen the effectiveness of CER. Based on bibliometric analysis, this paper identifies various and forward-looking influencing variables. In terms of the time dimension, this study uses big data sets spanning multiple years to capture the dynamic effects of smart city development on carbon emissions, and these data sets are much better than those used in previous studies, which were mostly static or cross-sectional data. Through the above method, we can make up for the shortcomings of the traditional single model in terms of the time sequence, heterogeneity and dynamic adjustment, so as to provide a richer and more comprehensive analysis framework, which not only provides a new method and perspective for the impact evaluation of smart city construction on carbon emissions, but also offers theoretical guidance for smart city construction and helps their effective combination.
The remainder of this paper is set out in this manner: Section 2 features the bibliometric analysis. Section 3 and Section 4 show the research design and variable selection. Section 5 shows the benchmark analysis of SCs’ impact on CEs. Then, Section 6 details the robustness tests. Section 7 includes a study of the heterogeneity of smart cities’ effect on cutting CEs. Section 8 focuses on the above research content and summarizes the conclusions. Finally, Section 9 proposes targeted policy implications based on the conclusions obtained in this study.

2. Bibliometric Analysis on SC and CE

2.1. Data Sources and Methods

This investigation employs scientometric analysis tools to examine the evolving nexus between intelligent urban development and CEs. Through the comparative visualization of knowledge domains across dual repositories (China National Knowledge Infrastructure and Web of Science), this study systematically maps conceptual architectures and the temporal evolution patterns within this interdisciplinary field. The analytical framework integrates co-word clustering with timeline analysis to decode divergent research priorities in Eastern and Western academic contexts.
CNKI is one of the largest literature databases in China, and brings together a wealth of information from different disciplines. The author searched the CNKI on 21 January 2025, with the following search strategy: (theme: “carbon emission” + “emission reduction” + “carbon dioxide” + “greenhouse gas” + “low carbon” + “green development”) AND (theme: “smart city” + “intelligent city” + “digital city” + “big data” + “Internet of things” + “urban intelligence”). Then, the author selected the literature from SCI, EI, the Peking University Core Periodical Catalogue, CSSCI, CSCD, and AMI. A total of 710 articles published from 2007 to 2024 were initially retrieved. After removing the data through screening, a total of 629 articles were obtained.
WOS is a well-known academic database which mainly provides interdisciplinary literature and citation indices, and which is widely used in science, the humanities, art, and other disciplines. The author searched WOS on 21 January 2025, by refining the search to the WOSCC database and applying following search strategy: (TS = (“carbon emission” OR “carbon emissions” OR “carbon dioxide emissions” OR “carbon dioxide emission” OR “emission-reduction” OR “greenhouse gas” OR “energy consumption”)) AND TS = (“smart city” OR “intelligent city” OR “digital city” OR “urban intelligent transformation” OR “big data” OR “internet of things”). 589 articles records were initially retrieved. “Article or Review article” was selected as the “article type”. “PEOPLES R CHINA” was selected as the “country or region”, and the time period was chosen as 2014–2024. Finally, a total of 253 articles were obtained. The research path is shown in Figure 1.

2.2. Research Hotspots and Trend

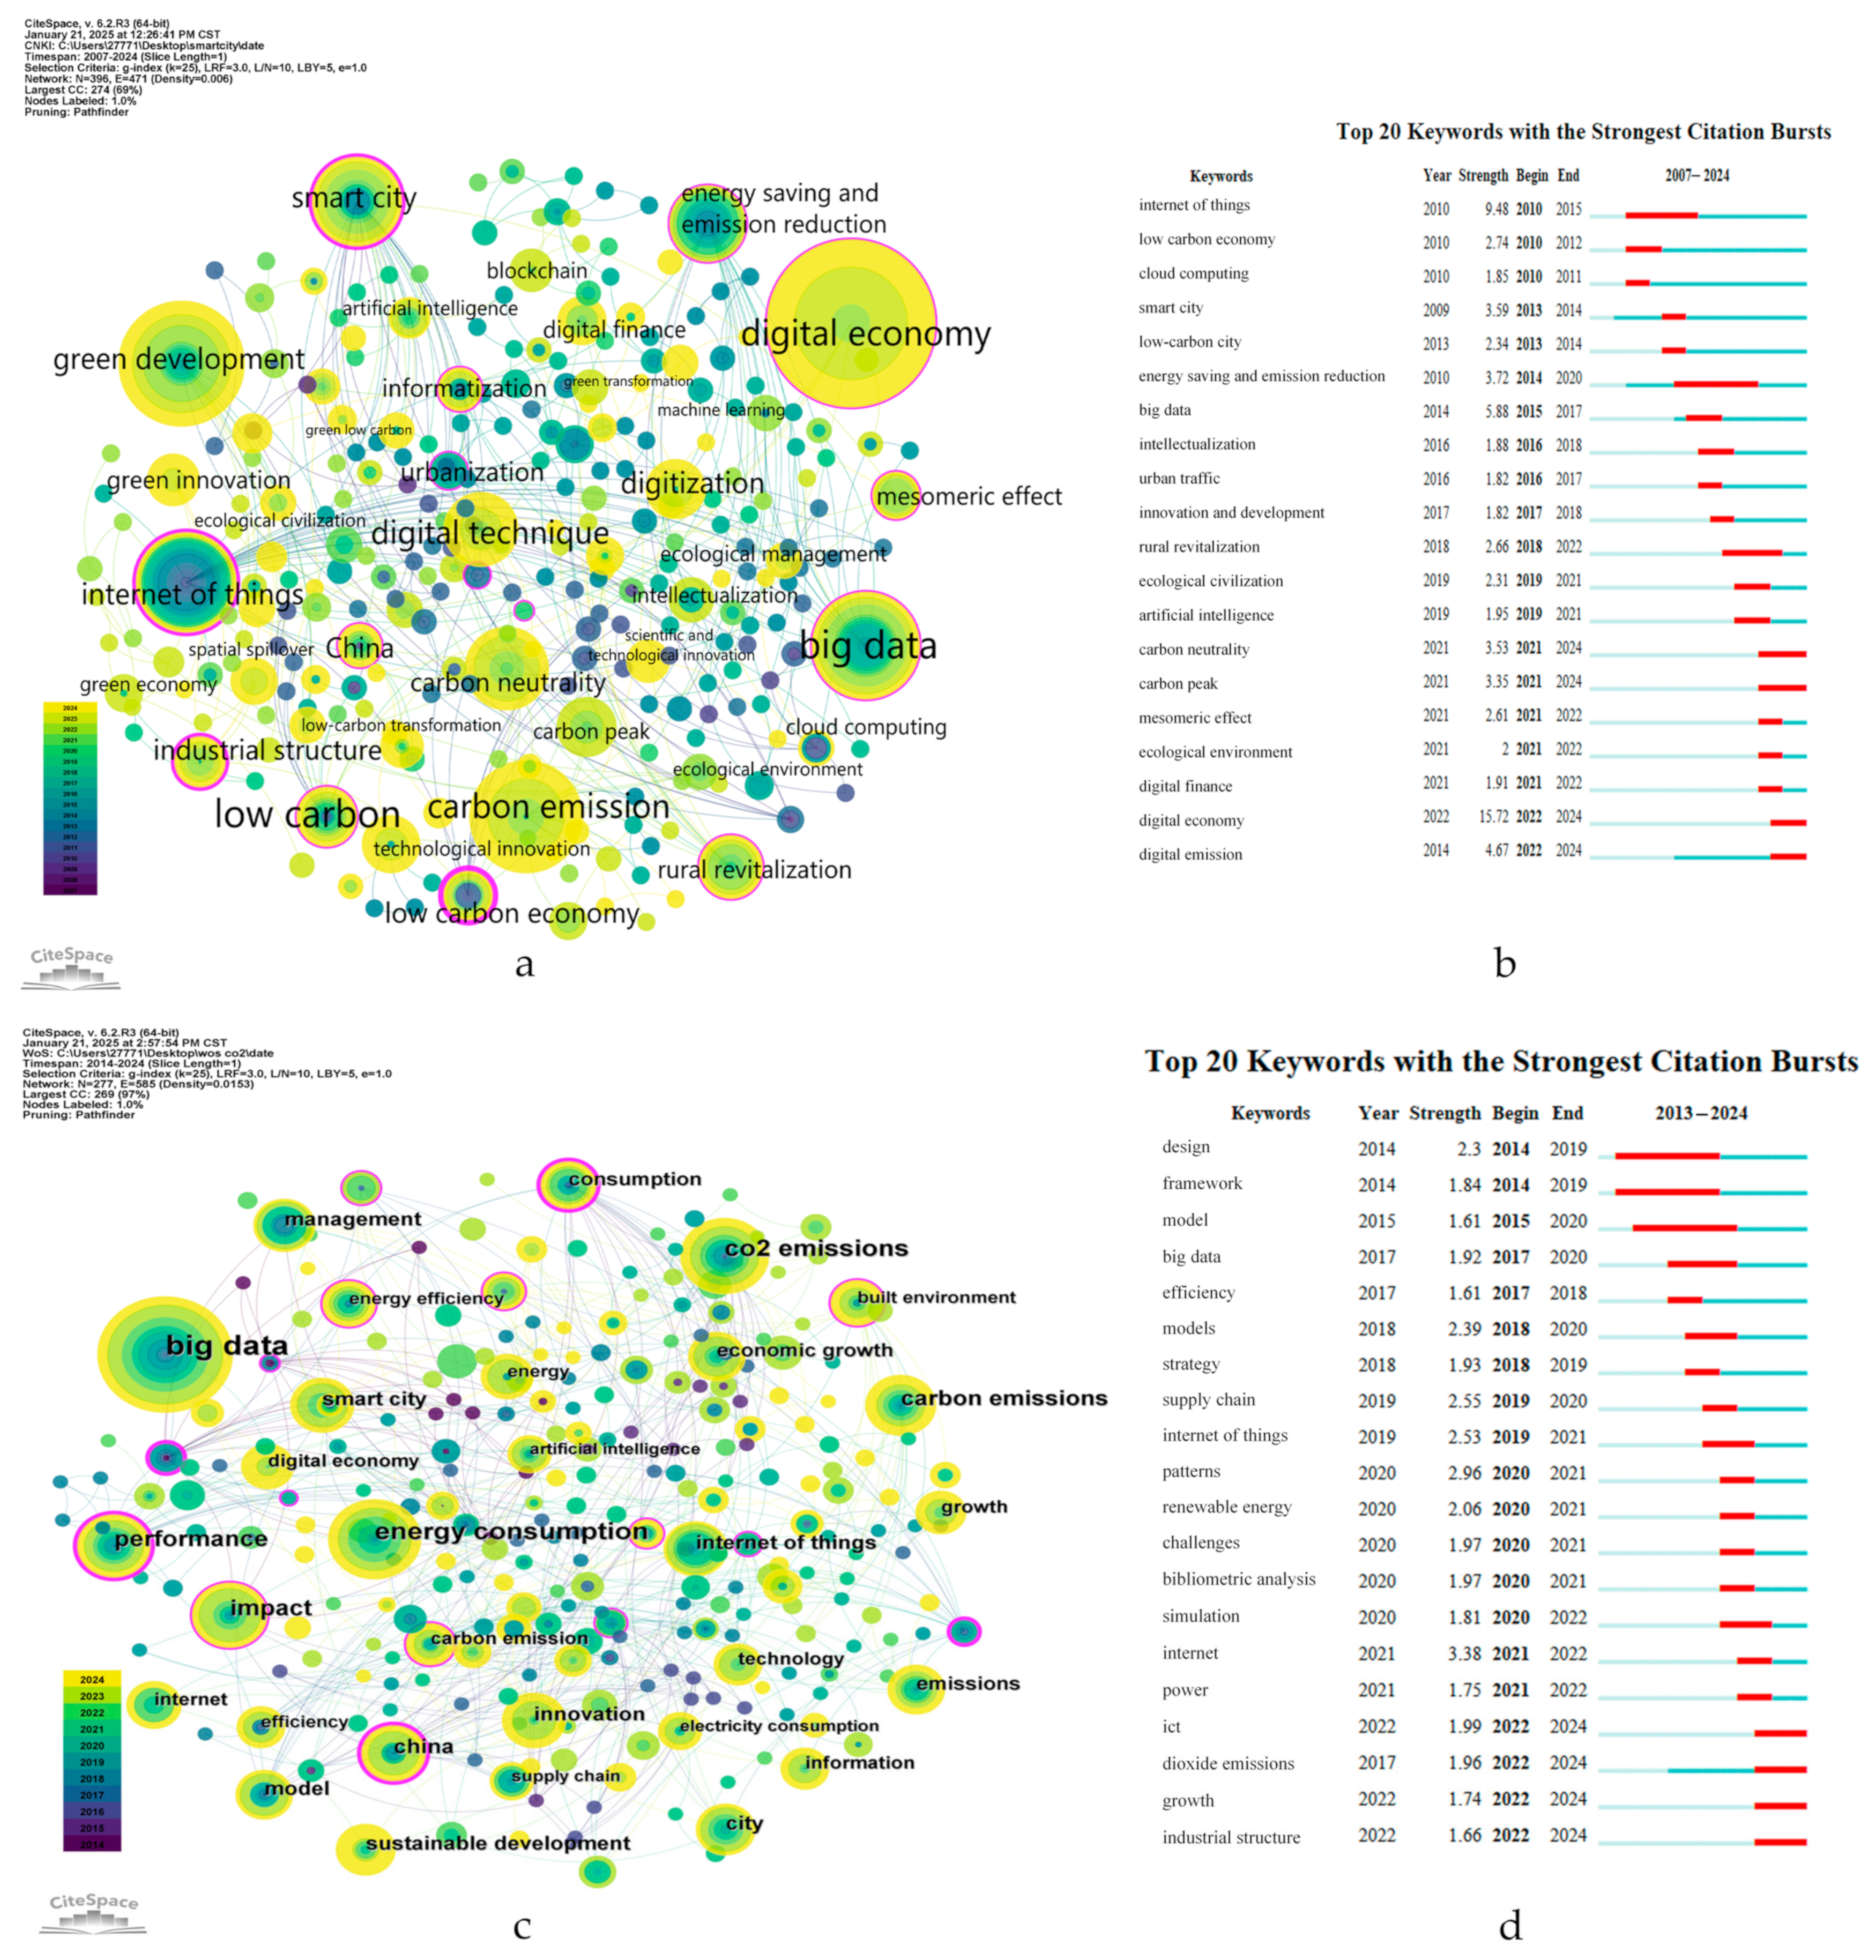
2.2.1. Keywords Co-Occurrence and Keywords Burst Analysis

Through a review and analysis of the literature, we can summarize the current research’s main findings, find unsolved problems, and grasp the development direction of the field, which is conducive to further in-depth exploration [30] and tangible advancement in one domain. In order to highlight the important keywords in this field, network nodes are selected based on keywords in the selected articles, and the time interval is defined as one year. The keywords’ co-occurrence in articles about smart cities and CEs were obtained by running the literature analysis software Citespace 6.2.R3, as shown in Figure 2.
Figure 2a has a total of 396 nodes, 471 connections, and a network density of 0.006. A total of 277 nodes and 585 connections are obtained in Figure 2c, and the network density is 0.0153. The node size presents the frequency of keywords, and the larger the node, the greater the frequency of keywords; the purple circle indicates their centrality. The connections between the nodes present their correlation. The thicker the connection, the stronger the relationship between the nodes. The keywords in CNKI mainly focus on “digital economy”, “green development”, “carbon emissions”, “big data”, “energy conservation and emission reduction” [31], and “rural revitalization”, as shown in Table 1. The main keywords in WOS are “big data” [32,33], “energy consumption” [34,35], “carbon dioxide emissions” [36], “performance” [37,38], “impact”, “carbon emission reduction” [39], “innovation”, etc., as shown in Table 2. After removing the keywords retrieved in this paper, we can see from the timeline that, since 2022, the main keywords in the CNKI literature have gradually shifted to “carbon neutrality”, “carbon peak”, “energy conservation and emission reduction”, and “green economy” and the research focus has been on how to achieve green economic development and rural revitalization by reducing CEs, with key points being the coordination of the economy and environment. In the WOS, the focus has gradually shifted to keywords such as “innovation” [40,41], “growth” [42,43], and “impact” [41], which indicate a focus on how to reduce CEs and their impact as well as energy consumption through technological innovation.
In addition, determining the keywords burst can allow better analysis of the research hotspots and trends by depicting the first occurrence time, end time, and citation intensity of specific keywords. It can be seen from Figure 2b that “carbon neutrality” and “carbon peak” first appeared in 2021, and are still the focus of current research. “Carbon emissions” first appeared in 2014, and its citations surged from 2022 to 2024, with an intensity of 4.67. The citation intensity of “digital economy” is 15.72, proving the previous conjecture. The keyword bursts in the WOS can be generally divided into three stages: the initial growth stage (2013–2019), the rapid development stage (2020–2021), and the continuous innovation stage (2022–2024). From the third stage, it can be seen that some keywords such as “ICT” [42,44] (information and communication technology), “carbon dioxide emissions”, and “growth” have begun to receive more attention, indicating that technology has played an increasingly important role in environmental protection and economic development. In addition, some new keywords appeared in this stage, such as “industrial structure”, showing that the academic community was exploring new application fields and development directions, which also confirms the previous conjecture.

2.2.2. Keywords Timeline View Analysis

The keywords timeline view can analyze the key research content of a study subject during a defined timespan. It is closely related to the keyword burst and keyword co-occurrence metrics. It takes “time” as the horizontal axis, sorts the keywords into chronological order, reflects the research trends in a period of time, and shows the co-occurrence relationship between keywords, as well their evolution process, in a timeline through the use of connections and nodes. In the timeline view, the label on the right represents the different clusters formed by keywords, the node size in the timeline indicates the frequency of the keyword, and the time corresponding to the node shows when the node appeared. In this study, Citespace is used to generate the keyword timeline views with a time slice of one year, as shown in Figure 3.
In Figure 3a, with the development of time and technology, some fields such as “digital economy” [45,46,47], “lean management”, and “ecological economy” have gradually emerged, receiving more attention over the past few years. The research focus has gradually shifted from the traditional field to the emerging field, and from the exploration of a single field to the integration of multiple fields. At the same time, a transformation from technical practice application to deep theoretical exploration has been realized. In Figure 3b, we can see that, from 2014 to 2024, keywords such as “smart cities” [48] and “green buildings” gradually emerged and gained more attention, while fields like “heavy trucks” and “energy consumption” might face the challenge of transformation and upgrading. The importance of smart cities and green buildings in energy conservation, emission reduction, and environmental protection has become increasingly prominent; the heavy trucks and transportation industries will accelerate the transition to being low carbon and green, and the internet and IoT technology will continue to promote intelligent and efficient urban management.

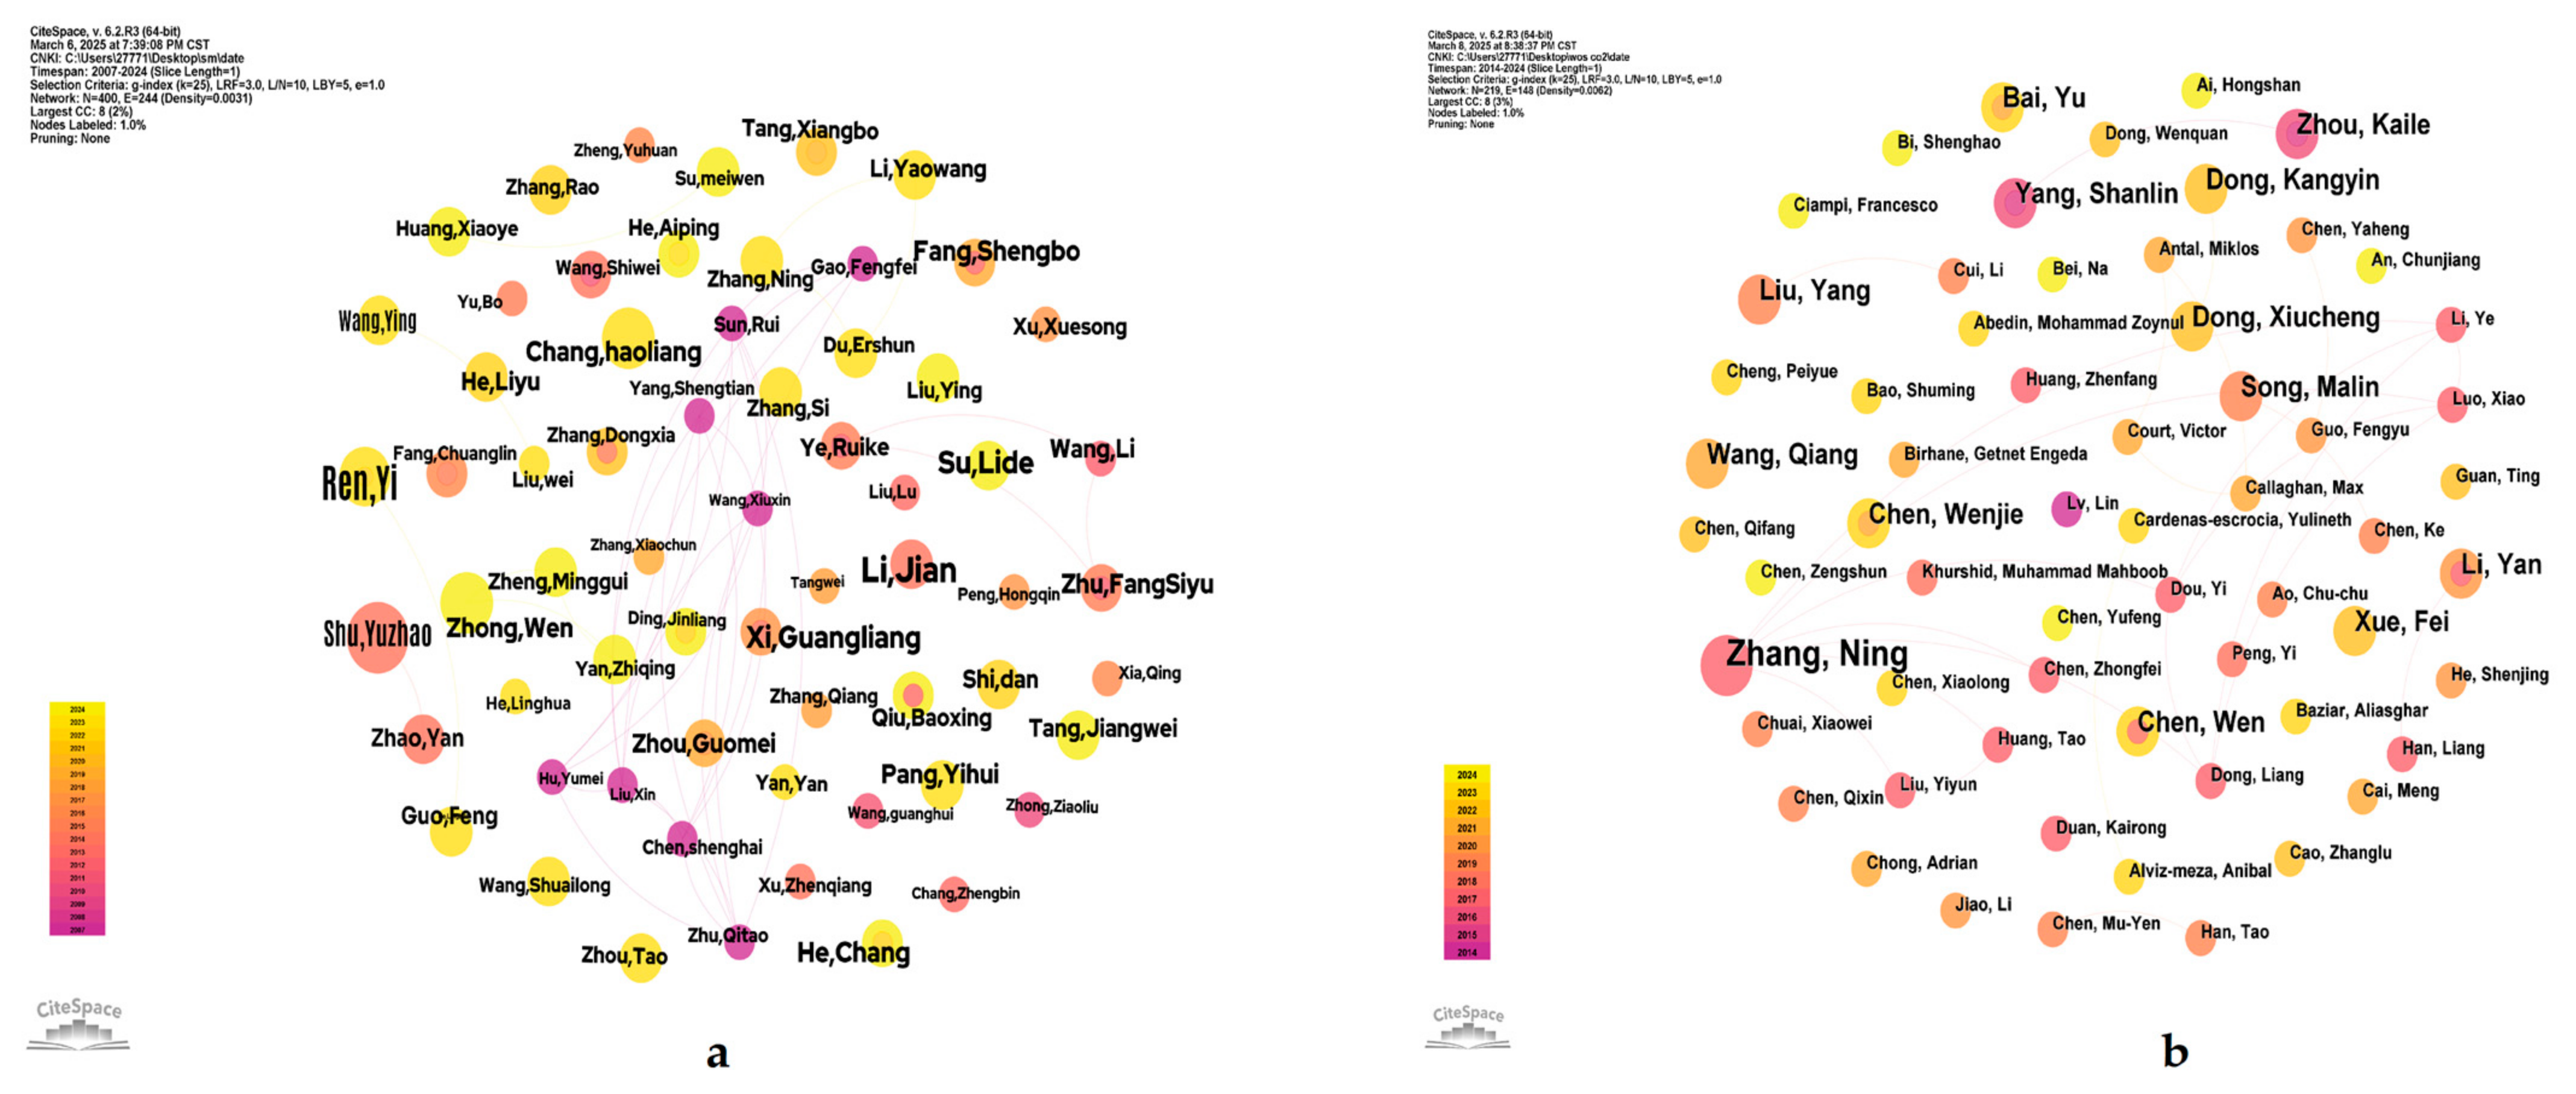
2.2.3. Co-Author Network Analysis

Co-authorship can be used to pinpoint influential authors and is chiefly analyzed to investigate the cooperation among authors in the published literature [49]. The author is the main body of scientific research activities [50]. By analyzing the author co-occurrence network, we can identify the cooperation relationship among authors and which authors have high influence. In the author cooperation network, various authors are signified by different nodes, the relationship between nodes indicates their cooperative relationship, and the node size indicates each author’s publication volume, as shown in Figure 4.
In Figure 4a, the authors with high influence mainly include Su Yuzhao, Zhong Wen, Chang Haoliang, Ren Yi, Pang Yihui, etc. In addition to the authors with larger nodes, it should be noted that some other authors like Sun Rui, Yang Shengtian, and Liu Xin, who have extensive cooperative relationships with other authors, can also be regarded as highly influential authors. In Figure 4b, authors such as Zhang Ning, Liu Yang, and Yang Shanlin have a higher publication volume, and there is extensive cooperation shown between Zhang Ning and other authors. Furthermore, in Figure 4, it is evident that the distribution of authors is relatively decentralized, with individual authors being independent of each other and only a small number of authors having collaborative relationships.
To summarize, the research focuses of the publications in CNKI and WOS have shown different trends and internal associations in recent years. Since 2022, the literature in CNKI has gradually shifted its focus to “carbon neutrality”, “carbon peak”, “energy conservation and emission reduction”, and “green economy”, mainly discussing the coordinated development of the economy and environment by reducing CEs, especially in the application of rural revitalization. Meanwhile, the literature in WOS has focused on keywords such as “innovation”, “growth” [51], and “impact”, emphasizing the important role of technological innovation in reducing CEs and energy consumption.
The keywords burst analysis further reveals the development process of research hotspots. For example, “carbon neutrality” and “carbon peak” have become important research topics since they first appeared in 2021, while the citation frequency of “carbon emission” increased significantly from 2022 to 2024, showing that it was getting more and more attention. At the same time, the keywords evolution in the WOS is divided into three stages, and this demonstrates the increasing influence of technology on environmental sustainability and economic development, especially the emergence of the new keyword “industrial structure”, exhibiting the academic community’s exploration of new application fields.
In all, the comparative analysis of knowledge maps shows that, although the literature in CNKI and WOS has differences in academic interests and specific research contents in the field of smart city research, it jointly reveals the deep logic of the synergy between innovation-driven and green development. Both knowledge systems have explored the path of smart cities to achieve carbon emission governance and sustainable development through digital technology innovation, green technology penetration, and intelligent governance transformation from a multi-dimensional perspective, and jointly outline the evolution path of the deep integration of innovation-driven technology and green low-carbon development. This cross-database research consensus not only confirms the important value of smart cities in the complicated technology–economy–environment system, but also highlights the continuous exploration of the relationship between digitization and CEs in the global academic community. However, literature analysis alone can only provide information about the research hotspots, research trends, and influential authors in SCs and CEs, while, from bibliometric analysis to empirical research, we can further explore the actual impact of SCs on CER. Bibliometric analysis, while revealing macro-level research trends and hotspots, cannot explore specific mechanisms or effects. It cannot directly establish causality between SCs and CEs. In contrast, empirical analysis, using concrete data and models, can validate this relationship. Therefore, based on these methods, this paper explores the relationship between SCs and CEs.

2.3. Research on the Impact of SCs on CEs

The connection between urbanization and CEs is split into three different schools of thought in the current literature. Some scholars believe that urbanization can effectively reduce urban CEs by promoting transformation of the industrial structure, upgrading, and technological progress. Shi Daqian et al. [52] believe that SCs have a technical effect, configuration effect, and structural effect that, in turn, reduce urban environmental pollution; Pei Chunwei and Yan Chunhong [53] consider that new infrastructure, technological innovation, digital economy, and industrial empowerment can reduce urban CEs; Zhang Bingbing et al. [54] use the DID method to evaluate the influence of SC pilot policies on urban CEs, and, furthermore, examine the internal mechanism of SCs to promote CER; Zhang et al. [55] find that smart cities and technological progress can effectively reduce CEs based on China’s provincial panel data. Another segment of the scholars in this field believe that urbanization will increase the CEs of cities. Zhang Xiaoqing et al. [56] analyze various environmental data by applying grey relational analysis, and find that urbanization will exacerbate the deterioration of the urban environment, which will bring about “city disease”; through an autoregressive distributed lag model (ARDL) and vector error correction model (VECM), Liu and Bea [57] observe that, with the development of urbanization, urban CEs will increase. A 1% rise in the urbanization level is associated with a corresponding 1% increase in CEs. In addition, Mu et al. [58] revealed the nonlinear relationship between urbanization and CEs by analyzing the panel data of 27 countries. Against the backdrop of continuous urbanization growth, the degree of environmental pollution will first increase and then decrease. Wang Di et al. [59] think that there is a U-curve relationship between the land urbanization rate and the ecological quality of that land on a per capita basis. All of the above studies have researched the impact of urbanization on CEs.
Bibliometric analysis reveals the growing correlation between smart cities and carbon emissions. CNKI focuses on keywords such as “digital economy” and “green development”, while WOS emphasizes “energy consumption” and “carbon dioxide emissions”. These research hotspots all point to the potential of smart cities in promoting low-carbon development. After further reading of the relevant literature, it is found that smart cities can effectively reduce the intensity of urban carbon emissions by optimizing resource allocation, improving energy utilization efficiency, and strengthening ecological construction. The promotion of green buildings and the application of renewable energy can significantly reduce energy consumption and carbon emissions. In addition, the concepts of “carbon neutrality” and “carbon peak” have risen rapidly in prominence since 2021, indicating that the research in this field is driven by multiple factors such as policy, technology, and the economy and showing a dynamic evolution trend. CiteSpace analysis further shows that the research focus is shifting from traditional fields to emerging directions such as digital economy and green development, highlighting the importance of smart cities in low-carbon transformation. Although the author collaboration in this field is relatively scattered, influential research teams have emerged, laying the academic foundation of this field.
Based on the in-depth bibliometric analysis, we further explore the impact of smart cities on carbon emissions. Through detailed reading and research on papers with high-frequency keywords, we find that smart city construction may reduce the urban carbon emission intensity through various mechanisms. And we propose the following theoretical assumptions: (1) smart city construction can significantly reduce urban carbon emissions through green development and the optimal allocation of resources; (2) this emission reduction effect is heterogeneous in different regions with different resource endowments.
Figure 5 shows the intensity of carbon emissions in Chinese cities, which decreases with time, but the relationship between smart city construction and spatial distribution of carbon emissions cannot be judged by pictures alone. In order to verify these hypotheses, we use the empirical analysis method to construct a difference-in-difference (DID) model using the panel data of 277 prefecture-level cities in China from 2006 to 2021. The model aims to verify the findings from the bibliometric analysis and explore the impact mechanism of smart cities on carbon emissions. Specifically, the model will test whether smart city construction can significantly reduce urban carbon emissions, and whether this reduction effect varies due to regional and resource endowment differences.

3. Theoretical Analysis and Research Hypothesis

3.1. SC Can Reduce CE

Based on the pilot policy theory and policy implementation theory [60], this paper analyzes the influence of smart city pilots on the reduction of urban CEs. As a typical representative of the development of new cities, smart cities can not only effectively stimulate urban innovation [61,62], improve urban resilience [63,64], and promote the transformation and upgrading of industrial structures [65,66], but also have significant impacts on urban energy transformation, thus reducing urban CEs. On the industrial level, SCs can promote industrial transformation and upgrading by improving industrial production efficiency and reducing energy consumption efficiency, reduce urban CEs by reducing energy-intensive tertiary industries, and vigorously develop high-tech industries. As for resource allocation, smart cities focus on the employment of data and platforms in urban communal services. In the context of cloud platforms being constructed, smart applications like smart logistics being deepened, smart transportation, and smart medical care, a cluster advantage with high integration and the unification of multiple types of information has been formed to better realize resource allocation and create resource-saving cities [67]. Based on this hypothesis
Hypothesis 1.
Smart city construction can reduce urban CEs.

3.2. Smart City Pilot Policy Presents Regional Heterogeneity in CER Effect

The influence of SCs on CEs shows substantial variation between various regions. This heterogeneity is mainly due to differences in the regional economic development level, industrial structure, policy support, technical basis, resource endowment, and urbanization stage of different regions.
The impact of SCs on reductions in CEs varies from city to city and region to region due to differences in geographical placement, resource possession, environmental protection efforts, and industrial bases. The northern region is cold, so smart cities can reduce urban CEs by employing smart heating systems and promoting smart cleaning systems, which can cut the use of coal for heating. Moreover, the northern region lags behind in digital infrastructure development, and it can promote its technological development and industrial structure upgrading through the construction of SCs so that the CER effect can be more significant. The digital infrastructure in the southern region is developing rapidly, and the industrial structure in this region is more inclined to the service industry and information technology industry, so the CER effect is not significant in this region compared to that of the northern region. In regard to regions, there are some differences in cities’ economic development level that are due to their location. Therefore,
Hypothesis 2.
Smart city pilots present regional heterogeneity in their CER effect.

3.3. Smart City Pilot Policy Shows Resource Differences in Reducing CE

In terms of resource endowments, resource-based cities (hereinafter referred to as RBCs) may be over-reliant on natural resources, relying on high-carbon industries such as energy extraction and heavy industry, with strong “path dependence”. Such cities have a single economic structure and struggle to get rid of their energy dependence. Thus, the CER of SC pilot policies will face some constraints, whereas non-resource-based cities have more flexible industrial structures and find it easier to achieve emission reduction through intelligent means. Smart cities need to rely on intelligent infrastructure, for instance the Internet, 5G, and big data, whereas non-resource-based cities (hereinafter referred to as NRCs) have a high level of informatization, meaning that they can achieve faster construction in intelligent transportation, intelligent buildings, intelligent government affairs, and intelligent medical care and so better reduce their urban CEs. On this basis,
Hypothesis 3.
Smart city pilot policy shows resource differences in reducing CEs.

4. Model Design

The Ministry of Housing and Urban-Rural Development published smart city construction lists in 2012, 2013, and 2014, respectively. This smart city construction policy can be regarded as an exogenous policy impact. Since smart cities are not built in the same way at the same time, whether and how they are implemented is influenced by various factors such as economic conditions, political will, technological capabilities, and development strategies, and their construction is not randomly assigned, so this conscious construction process makes smart city construction itself an “intervention” behavior. For this reason, this paper regards the construction of smart cities as a quasi-natural experiment, which has the following advantages: on the one hand, this approach can allow us to visually observe the differences brought about by the construction of smart cities by comparing the cities that have implemented smart city policy with the cities that have not; on the other hand, it can allow us to deeply analyze the actual effects of the construction of SCs by comparing the development of and changes in the same city before and after the implementation of the smart city project, and then provide a more targeted and practical reference for the subsequent decision-making on urban development. Since the policy for smart cities is rolled out in three phases, a several-stages DID model is constructed to measure the impact of SCs on CEs. The benchmark model is set as Formula (1):
C I i t = 0 + 1 s m a r t c i t y i t + γ c o n t r o l i t + μ i + λ t + ε i t
where i and t represent cities and years, respectively. C I i t is the explained variable in this paper, that is, the carbon emission intensity. s m a r t c i t y i t is the core explanatory variable. c o n t r o l i t represents the control variable at urban level that affects the carbon intensity and which changes with i and t. μ i and λ t , respectively, represent the individual fixed effect and time fixed effect. ε i t is the random error term.
The model in Formula (1) can only explain whether SCs can affect CEs, but it does not clarify when this effect happens. Thus, with the aim of testing the dynamic effect of SCs’ impact on CEs, this paper introduces a dynamic benefit model to answer this question and verify the parallel trend hypothesis. Using the event research method of Beck et al. [68], we examine the effect of SCs on CER timing. Therefore, the benchmark regression model in Formula (1) is extended to the following dynamic model, Formula (2):
C I i t = 0 + k = 5 , k 1 k = 0 δ k p r e i t k + k = 5 k = 1 φ k p r e i t k + θ X i t + μ i + λ t + ε i t

4.1. Variables Selection

4.1.1. Explained Variable

Urban CE intensity (CI) is the variable to be explained in this research. Referring to the relevant research methods of Qian [69] and Qin Bingtao [70], the logarithm of the urban CEs/regional GDP ratio serves as a measure of the urban CE. Carbon emissions data are an important indicator in the measurement of local economic development and environmental sustainability. CE data usually include carbon dioxide emissions, and the sources include energy consumption and emissions from industries, transportation, construction, and some other fields.

4.1.2. Core Explanatory Variables

The SC pilot policy, which is a virtual policy variable, serves as the core explanatory variable. It is coded as 1 in the year when the smart city pilot policy is implemented and in the following years, while it is coded as 0 in other years.

4.1.3. Control Variable

In order to more accurately analyze the impact of smart cities on carbon emission efficiency, the authors refer to previous studies and select important factors that may affect urban carbon emission efficiency as control variables. (1) Urban economic development (X1) is measured by the logarithm of per capita GDP. Since regional economic development depends on energy consumption, there is a strong correlation between CO2 emissions and economic growth. (2) The population density (X2) is measured by the logarithm of the ratio of the permanent population/the urban area [71]. (3) The industrial structure (X3) is measured by the added value of the tertiary industry/regional GDP. (4) The financial development level (X4) is measured by year-end deposits and the loans balance of financial institutions/regional GDP.

4.2. Data Sources of Empirical Analysis and Descriptive Statistics

To ensure the scientific integrity and availability of our results, the data are processed by eliminating extreme outliers and shrinking tails. With regard to sample selection, the basic data are drawn from the panel data of 277 prefecture-level cities in China for the period 2006–2021. The information about the pilot smart cities comes from the smart city pilot list issued by the Ministry of Housing and Urban-Rural Development of China and the carbon emission data are from EDGAR [72] and CEADs [73]. The EDGAR database not only provides national-level total emissions data, but also shows the specific emissions of each city through high-resolution grid data. The carbon emission data in this paper are mainly extracted from the EDGAR database, and the CEADs database is used to check the numerical differences. The raw data of other control variables are derived from the China City Statistical Yearbook and the statistical announcements of every prefecture-level city. Some of the missing values are filled in according to the statistical announcements, and the rest of the missing values are calculated after using the linear difference method to complete the raw data. Table 3 presents the descriptive statistical results of the main variables.

5. Results

5.1. Benchmark Regression Analysis

Column (1) in Table 4 presents the benchmark regression results of the benchmark model of SCs’ impact on CEs under the control of the time and individuals. Column (1) does not consider the control variables, but the control variables were gradually added to columns (2)–(5). Each column is fixed in both the individual and time vectors. To eradicate the effect of heteroscedasticity, the robustness standard error was used in the regression. From Table 4, it can be seen that the coefficient of the impact of SCs on CEs shows a pronounced negative correlation, and passes the significance test at the 1% level whether or not the addition of control variables is considered. Not considering the control variables, the effect is approximately 3.25%. After eliminating the city, time, and other confounding factors and using all control variables in Column (5) as the final analysis basis, the estimated coefficient for SCs shows statistical significance at the 1% threshold, with a value of −0.0351. Economically speaking, SCs reduce CEs by 3.51% compared to non-pilot cities, demonstrating their strong impact on and the robust effect of urban CEs. Therefore, smart city construction can significantly reduce CEs. Hypothesis 1 is valid.

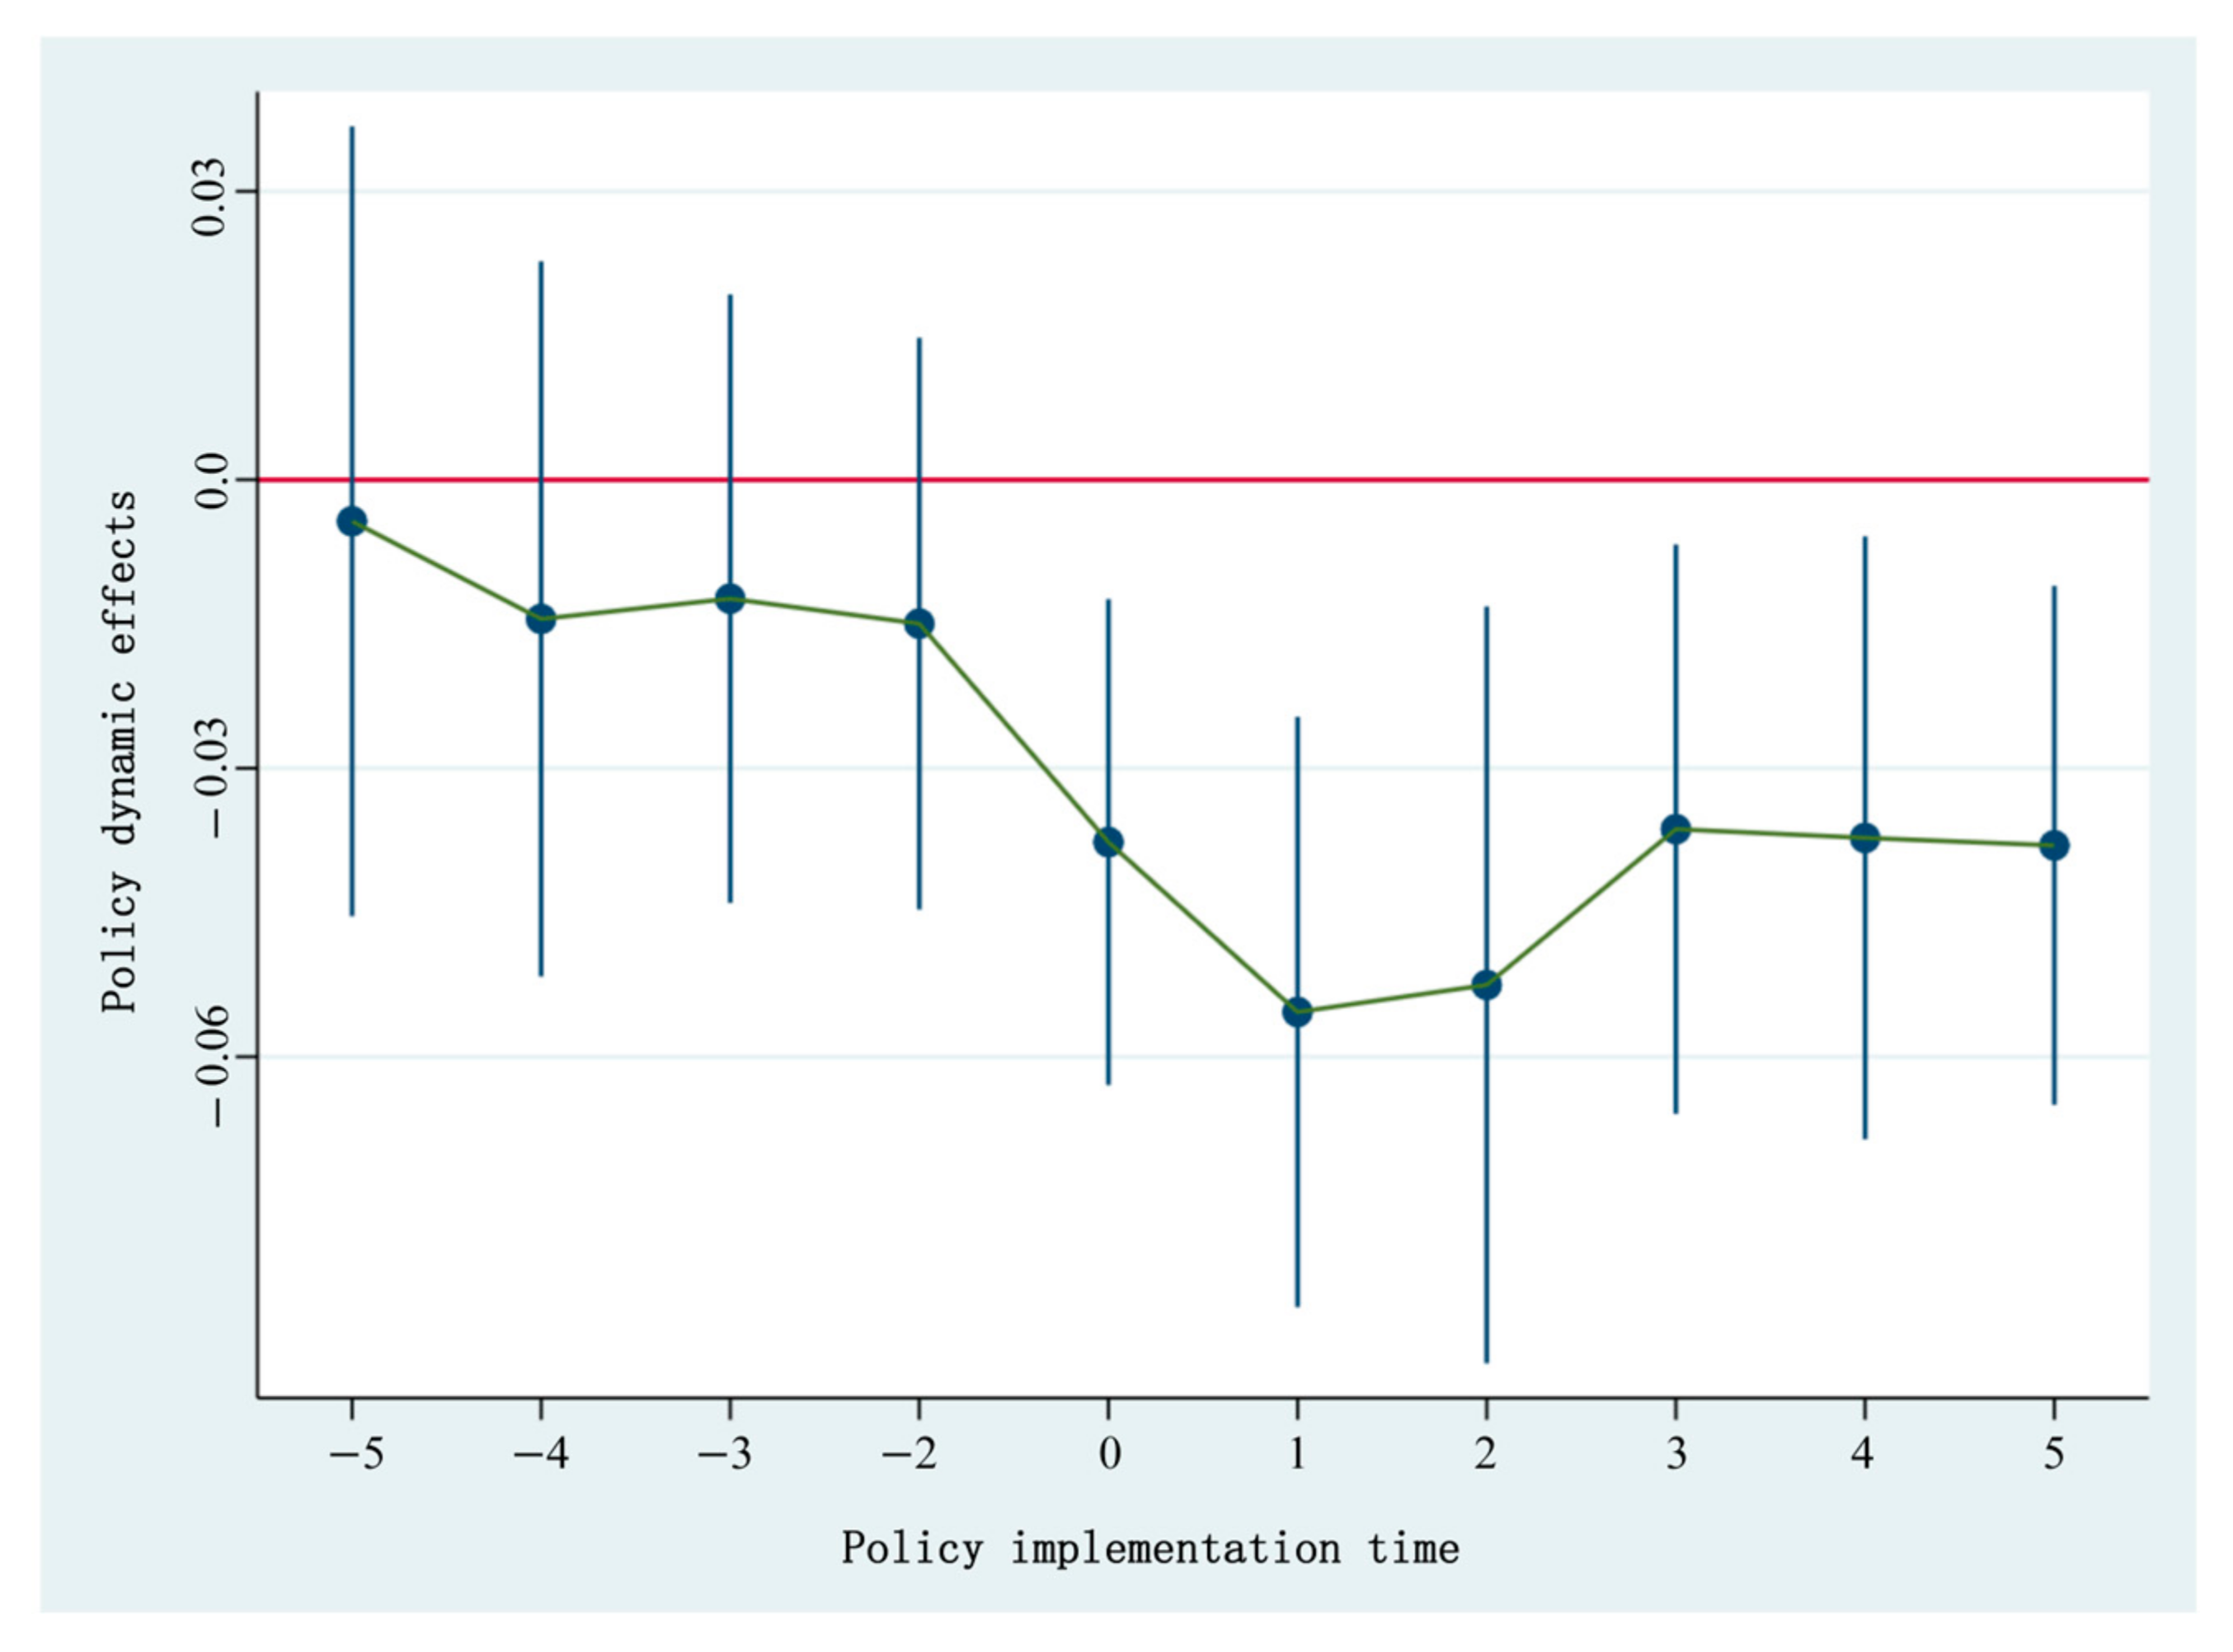
5.2. Parallel Trend Test

Before the policy is implemented, the experiment group and the control group need to meet the assumption of the parallel trend test. To put it another way, the CEs of the experiment group and the parallel group need to maintain a relatively stable trend during the pre-policy period. This paper takes the policy implementation time as the base period, and uses the event research method to test the parallel trend. The results are shown in Figure 6, from which we can know that the coefficients of the experiment group and the control group are close before the policy is implemented. This aligns with the hypothesis of the parallel trend test. The coefficient estimates for each variable have been significantly negative from the first year of the implementation of the policy, indicating that smart city construction can significantly reduce CEs. Thus, it is suitable to utilize the DID model to analyze the effect of SCs.

6. Robustness Test

6.1. Placebo Test

To verify whether the smart city policy reduces CEs instead of CEs being affected by other unrelated factors, this paper implements a placebo test with randomly chosen treatment and control groups to evaluate the benchmark regression results’ reliability. The following will elaborate on the specific methods of this study: The original sample has 100 prefecture-level cities in the treatment group and 177 in the control group. To verify the robustness of the smart city policy effect, this paper conducts 500 placebo tests, in which 100 cities are randomly selected from the control group as the pseudo-treatment group each time, and their policy time points are randomly assigned using variables that are in agreement with the benchmark regression. As shown in Figure 7, the regression coefficients with the pseudo-smart city as the core explanatory variable are close to 0, are in the shape of a normal distribution, and are significantly different from −0.351, and the p-values are also mostly greater than 10%. Therefore, the results indicate that CER is the result of the continuous advancement of SCs, and it is not caused by other cities’ characteristic factors.

6.2. Other Robustness Tests

For the purpose of improving the credibility and reliability of this research, this paper designs four other robustness tests: (1) In the first test, special municipalities such as Beijing, Shanghai, Tianjin, and Chongqing are excluded. (2) In order to improve the accuracy and reliability of the model’s estimation and to control the potential policy lag effect and endogenous problems, this study adopts the lag period model and puts the core explanatory variables into the regression equation with a one-period lag and a two-period lag, respectively, so as to more accurately evaluate the real impact of the policy on the dependent variables in different lag periods. (3) To avoid the influence of the COVID-19 pandemic on CEs, the year 2020 is excluded. The findings of the four robustness tests above are displayed in Table 5. The estimated coefficients are basically in agreement with the original benchmark model with regard to their direction and significance. Therefore, the model in this paper is robust.

6.3. PSM-DID

In this paper, the PSM-DID method is used to effectively reduce the non-random selection bias and ensure the comparability of the treatment group and the control group in the urban construction environment. By comparing the characteristic variables of the treatment group and the control group, calculating the propensity score matching, and constructing a new treatment group accordingly, the selection bias is significantly reduced. If the covariates are not statistically significant after matching, it indicates that the matching was successful and the two covariates are balanced, meeting the balance hypothesis, which lays a foundation for PSM-DID analysis. As for the matching method, this paper refers to the research of Zhang Mingdou et al. [74], selecting the control variables as the matching features variables and applying the kernel matching and caliper matching methods for PSM-DID estimation. The results are shown in Table 6. Although the coefficients of the main explanatory variables slightly decrease, the symbols and significance are consistent with the results of multi-period DID regression, indicating that the regression results are robust and reliable. Therefore, the robustness of the policy effect estimation is validated and the credibility of the research conclusions is ensured.

6.4. DDML Causal Identification

To more accurately describe the causal relationship between smart city construction and carbon emission reduction, this paper adds the first-order, second-order, and third-order terms of the control variables to the model in turn, and introduces random forest and gradient boosting to optimize the part linear regression model. The specific results are shown in Table 7.
Judging from the results, the impact of smart city construction (smart city) on carbon emissions intensity (CI) presents a significant negative effect in each model, with the coefficients ranging from −0.239 to −0.076 and most of them reaching a significant level of 5% or 1%, indicating that the causal relationship between smart city construction and carbon emission reduction is still robust after incorporating different high-order control variables and using machine learning algorithm optimization. This not only validates the core conclusions of this paper, but also highlights that the combination of refined model setting and advanced algorithms can further strengthen the scientific integrity and accuracy of causal identification.

7. Heterogeneity Analysis

7.1. Regional Heterogeneity

Regarding the division of the north and south positions, the authors refer to the research of Ou Xiangjun [75] and Zhou Xiaobo [76], taking the 35° north latitude line of the middle line of China’s national geography as the boundary, where the north is the northern region. There are 15 provinces (autonomous regions and municipalities directly under the central government) in northeast, northwest, and northern China, constituting the northern region, and the remaining 16 provinces (autonomous regions and municipalities directly under the central government) in the eastern region, central-southern China, and the southwest constitute the southern region. Columns (1) and (2) in Table 8 conduct group regression to test the effect of SCs on the CEs in the southern and northern regions respectively. The outcomes indicate that SCs have a more significant effect on CER in the northern region, and this outcome passes the significance test at a 1% level. The effect coefficient is −0.0604, which indicates that SC pilot policy can lead to a 6.04% CER in the northern region. This is closely related to the backward digital infrastructure and the industrial structure dominated by heavy industry in the northern region. Smart city construction helps to address the high energy consumption of the industrial structure in the northern region by improving digital infrastructure and optimizing energy management and resource allocation, and thus significantly improves carbon emission reduction. Meanwhile, smart approaches can promote the green transformation of heavy industry, improve energy efficiency, and achieve a significant carbon emission reduction effect. Conversely, SCs have not yet resulted in significant emission reductions in the southern region. The reason for this may be that it has relatively high-quality economic development, and its advanced service industry and high-tech industry account for a large proportion of their economy, which results in lower carbon emissions; therefore, the smart cities in this region produce a relatively limited effect on carbon emissions. This study finds that the construction of smart cities has significantly inhibited carbon emissions in the northern region, while it has not shown a prominent emission reduction effect in the southern region. Although existing studies have initially revealed these north–south differences, more in-depth spatial analysis is needed to clarify whether there are spatial spillover effects or spatial gradient differences. Future research can consider using spatial econometric models to more rigorously assess the spatial impact of smart city construction on carbon emission reduction in different regions. According to the results, Hypothesis 2 is valid.

7.2. Resource Endowment Heterogeneity

The resource dependence theory reveals that the direction and path of China’s economic development depend largely on the resources it has. These resources include both material resources, such as land and energy, and non-material resources, such as human resources and technology. There is a close relationship between economic growth and carbon dioxide emissions, because economic growth often leads to an increase in carbon dioxide emissions. Therefore, the amount of resources that a region has may have impacts on its CO2 emissions. In Table 8 columns (3) and (4), the RBCs and NRCs are grouped and regressed, respectively. The State Council’s “National Sustainable Development Plan for Resource-based Cities” (2013–2020) defines RBCs as cities based on the extraction and processing of natural resources like minerals and forests [68]. According to the results of the following table, in NRCs, the development of smart cities can result in a 4.80% decrease in CEs, and this result is significant at the 1% level, while smart city construction in RBCs has no significant inhibitory effect on CEs. This result corresponds to the study findings of Yu et al. [77]. The reason for this may be that, in RBCs, the leading industries are usually the mining and processing of high-carbon resources including oil, coal, and natural gas; these industries have a large capacity for emissions and energy consumption, and it is difficult for these cities to achieve industrial transformation due to is the large costs that are required. While this model leads to resource consumption, RBCs will fall into the so-called “resource trap” [36]. The “Resource Curse”, first proposed by Richard Auty in 1993, suggests that countries which are rich in natural resources usually exhibit weaker economic performance than countries with scarce resources [78]. In addition, RBCs lack corresponding funds for environmental governance, environmental protection policies are not in place, and their technological innovation capabilities are insufficient, which means that SC policy can not really have an impact on CER in these cities. Therefore, Hypothesis 3 is valid.

8. Discussion, Conclusions, and Implications

Through bibliometrics, this paper uses knowledge map visualization to systematically analyze the association between smart cities and CEs, aiming to reveal the structural characteristics and development of the evolution law of knowledge production in this field and systematically identify the author groups with core influence as well as high-frequency keywords and their development and evolution process. The results show that the density of the author cooperation network in this field is only 0.0031, indicating that there is relatively little cooperation among authors, and that a core academic community with a significant agglomeration effect has not yet been formed. The maximum connected component includes only eight nodes, accounting for 2% of the overall author cooperation network and reflecting that there are some small-scale author cooperation groups but that the authors scattered on the whole. The academic community should strengthen its interdisciplinary cooperation, form interdisciplinary research teams, and jointly explore the complex relation between smart cities and carbon emissions. Through interdisciplinary cooperation, it can promote the exchange and integration of knowledge in different disciplines, break down disciplinary barriers, and broaden research horizons. For example, when researching the carbon emission reduction effect of smart city construction, we can combine the carbon emission monitoring technology in the field of environmental science with the policy evaluation method in economics to deeply analyze the impact mechanism of smart city construction on carbon emissions, so as to provide a more comprehensive and scientific basis for policy formulation. WOS covers the research results on a global scale, and Chinese scholars can learn from the advanced experience and technologies of foreign research on smart cities and carbon emissions through cooperation with their international peers. For example, developed countries in Europe and the United States have accumulated rich experience in smart city planning, intelligent transportation systems, and renewable energy utilization and, through cooperation, these experience can be introduced into China for localized application and innovation in accordance with China’s actual national conditions.
By comparing and analyzing the knowledge maps in two databases, this study reveals that, although there are some differences in the research content about smart cities and CEs between CNKI and WOS, they show significant convergence in their core research. The knowledge networks of both show the coordinated development of digital technology and green innovation technology, focusing on how SCs can cope with challenges faced in CER and sustainable development through innovation and green development strategies. CNKI emphasizes keywords like “carbon neutrality”, “carbon peak”, “energy conservation and emission reduction”, and “green economy”, suggesting that policies should focus on achieving coordinated economic and environmental development through smart city construction. Especially in rural revitalization, policy formulation should attach importance to the application and promotion of smart technology in rural areas to help rural energy structure optimization and industrial development, such as utilizing smart agricultural systems to improve production efficiency and reduce carbon emissions from agricultural production. WOS focuses on “innovation”, “growth”, and “impact”, highlighting the importance of technological innovation to carbon emission reduction and less energy consumption. Policies should encourage enterprises and scientific research institutions to increase their R&D investment in smart city-related technologies, such as intelligent energy management systems and low-carbon intelligent transportation technology, and provide supports like tax incentives and financial subsidies for innovative enterprises to accelerate the transformation and application of technological innovation results in the construction of smart cities.
In terms of empirical research, this paper takes the smart city pilot policy implemented in three batches since 2012 as a quasi-natural experiment, and uses the DID model to identify smart city construction’s net policy effect on China’s urban CER. Through the research and analysis of SCs and CEs, it is found that the development of smart cities is capable of effectively decreasing CEs, which is still valid after a placebo test and a range of other robustness tests, and that SCs produce a more significant CER effect on northern regions and NRCs than on southern regions and RBCs. The results of the heterogeneity analysis are mainly reflected in system optimization and comprehensive management. By introducing a decision-making mechanism system of data-driven and information technology, smart cities can effectively integrate and manage resources in smart transportation, smart energy, smart government affairs, smart buildings, and smart garbage disposal, so as to improve their urban operation efficiency and reduce their CEs. For example, smart grids can realize the efficient and rational use of renewable resources and reduce dependence on fossil fuels that necessitate heavy pollution and high energy consumption. Intelligent transportation can coordinate transportation resources and reduce traffic congestion. The use of electric energy in smart electric buses can reduce the consumption of petroleum fuels, thereby reducing CEs to a certain extent. In addition, NRCs face fewer restrictions on their industrial structure, can be more flexible in adapting to the application of smart technology, and can better complete the construction of smart cities, so as to achieve low-carbon transformation. In terms of the sample range, this study does have data limitations. Due to the limitation of data availability, this study only included data from 277 prefecture-level cities. For remote areas where data are difficult to obtain, there may be some deviations in the relevant conclusions. These regions may be significantly different from other regions in terms of their economic development and energy structure, which means that the impact of smart city construction on carbon emissions may present different characteristics. Future research should strive to overcome data bottlenecks, for example obtaining data through various channels such as satellite remote sensing and network big data or using more complex models to deal with missing values, so as to improve the universality and accuracy of research conclusions.
In addition, this study also has the following limitation. Bibliometric analysis can only analyze the published and easily available literature, so, in this study, it ignores the unpublished or difficult-to-obtain literature, such as conference papers, government reports, industry reports, dissertations, and so on. Such literature often contains the latest research progress, policy practice experience, or regional data, which may provide a valuable supplementary perspective for the comprehensive understanding of the relationship between smart cities and carbon emissions. Therefore, in future research, more databases and resource platforms should be searched, including government department websites, industry association websites, etc., to collect the relevant literature as comprehensively as possible. Through the above methods, future research can more roundly and deeply explore the relationship between smart cities and carbon emissions, and provide more effective support for relevant policy formulation and practice.

9. Policy Implications

From these findings, we observe the following implications for further promoting smart city pilot construction and reducing carbon dioxide emissions.

9.1. Social Governance

(1) Improve the pilot policy and strengthen smart government affairs construction: We should actively promote the construction of smart government affairs, with the transformation of government functions at the core, and deeply implement reforms to “streamline administration, delegate power, improve regulation, and upgrade services”, effectively improving the efficiency of government services. Furthermore, we should vigorously promote the service mode of “one visit at most”, innovate the supply mode of government services, widely apply modern information technology [79], significantly enhance the government’s capacity for supervision, build a credit-based intelligent government system, and comprehensively improve the efficiency of government services to provide solid support for reducing urban carbon emissions. We should further promote the deep integration of digital economy and real economy [80], make full use of advanced technologies such as big data, the internet of things, artificial intelligence, and 5G to accurately pinpoint carbon emission sources, and realize intelligent monitoring and early warning, so as to improve the efficiency and scientific integrity of carbon emission management and promote the coordinated achievement of high-quality economic advancement and green low-carbon development. In the process of policy formulation, it is necessary to fully consider a regions’ actual economic development level, industrial structure, and resource endowment, and to develop targeted and appropriate policy measures. It is suggested that, in regions with higher levels of economic development and better information technology infrastructure, a north–south regional cooperation mechanism should be established, the application of smart transportation and smart building technology should be promoted in the northern region, and the level of smart city construction should be jointly improved. In areas with a lower economic development level and weaker information technology infrastructure, the focus should be on strengthening digital infrastructure construction, improving smart government affairs platforms, and optimizing government service processes through big data analysis and artificial intelligence-assisted decision-making to reduce energy consumption and carbon emissions.
(2) Promote regional cooperation and coordinated development in light of actual conditions: Given the significant heterogeneity of the carbon emission reduction effect from the smart city pilot policy in different regions and under different resource endowment conditions, timely policy adjustments should be made in regions with unsatisfactory carbon emission reduction effects to optimize their resource allocation, strengthen their infrastructure construction, and actively guide and promote the transformation and upgrading of their industrial structure, so as to effectively improve the effect of policy implementation. At the same time, pragmatic cooperation and efficient coordination among regions should be strengthened to facilitate the optimal allocation and sharing of resources in a wider range. A north–south regional cooperation mechanism should be established, the transfer of advanced technologies such as smart transportation and smart buildings from the southern region to the northern region should be encouraged, and smart cities’ construction level should be jointly improved in order to achieve coordinated regional development, to achieve complementary and win-win results, and to jointly enhance the overall effect of carbon emission reduction. In addition, on the basis of full assessment, the pilot scope should be reasonably expanded to make sure the policy dividend can benefit all regions [81], which would greatly improve the overall emission reduction effect and promote coordinated development among regions.
(3) Build a collaborative mechanism for multiple participation: Enterprises, the public, and other subjects should be encouraged to actively participate in the construction of smart cities, the corresponding incentive and reward mechanism should be established and improved, and forces from universities, markets, society, and the government should be effectively integrated to form a multi-subject cooperation, governance, and advancement status of “government-society-university alliance” [82]. Smart city construction should not only adopt the “top-down” model [83], but should combine the “top-down” model as top-level design with the “down-top” model as grassroots innovation, fully mobilizing and activating forces from all parties to jointly promote smart city construction, achieve the win-win goal of economic development, energy conservation, and emission reduction, and build a sustainable urban ecology.

9.2. Urban Infrastructure

(1) Strengthen smart infrastructure construction and consolidate the urban development foundation: In the northern region, we can vigorously increase investment in smart transportation. In light of the cold winters and frequent icy and snowy weather in the north, we can build a smart traffic management system, promote new energy vehicle charging facilities, optimize the public transportation network system, and improve the traffic operation efficiency to alleviate traffic congestion and reduce energy consumption and carbon emissions. In addition, we suggest building a smart energy management system, strengthening real-time monitoring and dynamic regulation of the whole process of energy production, transmission, distribution, and consumption, improving the comprehensive utilization efficiency of energy, and reducing the dependence on heavy-pollution and high-energy-consuming fossil fuels. For industrial cities with high energy consumption, both in the northern and in the southern regions, efforts should be focused on promoting the construction of smart energy management systems to greatly improve energy efficiency; in regions with relatively abundant renewable energy resources, their development and utilization should be strengthened in order to gradually realize the green transformation of urban energy structure.
(2) Improve the adaptability and flexibility of infrastructure and enhance urban resilience: It is essential to continue to strengthen the urban risk-resistant design and construction of infrastructure, and to comprehensively improve its ability to cope with natural disasters and climate change. In the south, we can vigorously promote the construction of sponge cities and enhance the resilience of urban drainage systems and flood control facilities, thereby reducing the impact from disasters such as urban waterlogging on the normal operation of cities. Further, we can focus on promoting the northern area’s intelligent transformation of traditional infrastructure in order to realize the interconnection of infrastructure and the efficient sharing of information. For example, we can widely use intelligent lighting technology in urban lighting systems, and install intelligent water meters and real-time monitoring equipment in urban water supply systems to improve the utilization efficiency of water resources and upgrade the intelligent level of urban operation and management.

9.3. Industry Development

(1) Promote the upgrading and transformation of industrial structure and achieve green development: In the northern region or RBCs, we should accelerate the low-carbon technological innovation and upgrading pace in traditional high-energy-consuming and heavy-polluting industries, and actively popularize intelligent clean technology equipment and low-carbon energy-saving production concepts, so as to push the upgrading and transformation of industrial structures and support the continuous improvement of technological processes. In high-energy-consuming industries such as the steel, cement, and chemical industries, the popularization and application of advanced energy-saving and emission reduction technologies and equipment can effectively reduce the energy consumption and carbon emission intensity of unit production. Non-resource-based cities can make full use of their flexible industrial structure, vigorously develop high-tech industries and modern service industries, and achieve low-carbon economic transformation. In addition, we should also strive to cultivate and develop low-carbon strategic emerging industries with broad prospects, such as big data, cloud computing, artificial intelligence, biomedicine, new energy vehicles, etc. These emerging industries have high added value, low energy consumption, and create less pollution, which can highly reduce urban carbon emissions and promote the sustainable development of the urban economy.
(2) Promote inter-industry collaboration and build a green industrial chain: It is helpful to encourage industries’ collaborative cooperation and integrated development. Through resource optimization and sharing, in-depth technical exchanges, and close business cooperation among industries, synergistic emission reduction effects may be achieved in the upstream and downstream of the industrial chain. In the manufacturing-based developed cities, we can promote the deep integration of manufacturing and service industries and widely develop producer services to enhance the level of intelligent and green manufacturing. In RBCs, through promoting the integration and innovation of the energy industry and the information and communication industry and through building a smart energy system, the efficient use and optimal allocation of energy may be achieved. Meanwhile, we should also actively explore the establishment of an inter-industry carbon emission trading market to guide the flow of resources to low-carbon and efficient industries and enterprises through market mechanisms and encourage enterprises to continuously reduce their carbon emissions in order to improve the overall carbon emission reduction efficiency and form a carbon emission reduction system with the participation of the whole of society.

Author Contributions

Conceptualization, D.L. and A.D.L.; methodology, X.Z. and Y.G.; software, X.Z.; data curation, X.Z.; investigation, D.L. and Y.G.; writing—original draft preparation, D.L. and X.Z.; writing—review and editing, D.L., X.Z., A.D.L. and Y.G.; supervision and submission, D.L. and Y.G. All authors have read and agreed to the published version of the manuscript.

Funding

This paper is supported by the 2025 Annual Social Science Development Research Project of Hebei Province (20250602004).

Institutional Review Board Statement

Not applicable.

Informed Consent Statement

Not applicable.

Data Availability Statement

The original contributions presented in this study are included in the article. Further inquiries can be directed to the corresponding author.

Conflicts of Interest

The authors declare no conflicts of interest.

References

  1. Fan, X.; Gu, X.C.; Yu, H.R.; Long, A.H.; Tiando, D.S.; Ou, S.Y.; Li, J.F.; Rong, Y.J.; Tang, G.L.; Zheng, Y.J.; et al. The Spatial and Temporal Evolution and Drivers of Habitat Quality in the Hung River Valley. Land 2021, 10, 1369. [Google Scholar] [CrossRef]
  2. Bandh, S.A.; Shafi, S.; Peerzada, M.; Rehman, T.; Bashir, S.; Wani, S.A.; Dar, R. Multidimensional analysis of global climate change: A review. Environ. Sci. Pollut. Res. 2021, 28, 24872–24888. [Google Scholar] [CrossRef] [PubMed]
  3. Helbling, M.; Meierrieks, D. Global warming and urbanization. J. Popul. Econ. 2023, 36, 1187–1223. [Google Scholar] [CrossRef]
  4. Klein, T.; Anderegg, W.R.L. A vast increase in heat exposure in the 21st century is driven by global warming and urban population growth. Sustain. Cities Soc. 2021, 73, 103098. [Google Scholar] [CrossRef]
  5. Institute for Sustainable Development Goals, Tsinghua University. Available online: https://thusdg.tsinghua.edu.cn/info/1141/3964.htm (accessed on 28 December 2024).
  6. Ma, L.; Li, D.N. Would macro policy promote green and low-carbon transformation of energy companies? Int. Rev. Financ. Anal. 2024, 96, 103791. [Google Scholar] [CrossRef]
  7. Jiang, M.H.; Suo, C.; Wu, L.P.; Berrill, P. Consumption structure optimization for reducing energy footprint. Econ. Syst. Res. 2023, 35, 458–477. [Google Scholar] [CrossRef]
  8. Vollebregt, M.; Mugge, R.; Thuerridl, C.; van Dolen, W. Reducing without losing: Reduced consumption and its implications for well-being. Sustain. Prod. Consum. 2024, 45, 91–103. [Google Scholar] [CrossRef]
  9. Miles, V.; Esau, I.; Pettersson, L. Using web GIS to promote stakeholder understanding of scientific results in sustainable urban development: A case study in Bergen, Norway. Sustain. Dev. 2024, 32, 2517–2529. [Google Scholar] [CrossRef]
  10. Li, H.M. A Responsible Major Power in the International Community: China’s Identity Claims and Practical Construction in Contemporary Times. J. Univ. Int. Relat. 2008, 25–31. [Google Scholar]
  11. Wu, Y.; Shi, L.; Ruan, G.C. Construction and Recognition of National Identity: An Analysis and Reflection on China’s Image as a Responsible Major Power. J. Shanghai Jiaotong Univ. (Philos. Soc. Sci.) 2021, 29, 130–147. [Google Scholar] [CrossRef]
  12. Sun, M. A Bigger Bang for a Bigger Buck: What China’s Changing Attitude Toward UN Peacekeeping Says About Its Evolving Approach to International Institutions. Foreign Policy Anal. 2017, 13, 338–360. [Google Scholar] [CrossRef]
  13. People’s Daily. Implement the “Double Carbon” Action to Build a Beautiful China. Available online: https://www.gov.cn/yaowen/liebiao/202404/content_6948005.htm (accessed on 28 December 2024).
  14. Angelidou, M. Smart cities: A conjuncture of four forces. Cities 2015, 47, 95–106. [Google Scholar] [CrossRef]
  15. U.S. Government Accountability Office (U.S. GAO). AIMD-95-23 Information Superhighway: An Overview of Technology Challenges. Available online: https://www.gao.gov/products/aimd-95-23 (accessed on 28 December 2024).
  16. IBM. Available online: https://public.dhe.ibm.com/software/info/television/advertising/thesmartercity/GBE03227USEN.PDF (accessed on 28 December 2024).
  17. Blasi, S.; Ganzaroli, A.; De Noni, I. Smartening sustainable development in cities: Strengthening the theoretical linkage between smart cities and SDGs. Sustain. Cities Soc. 2022, 80, 10379. [Google Scholar] [CrossRef]
  18. Gomstyn, A.; Jonker, A. What is a Smart City? 2023. Available online: https://www.ibm.com/think/topics/smart-city (accessed on 28 December 2024).
  19. Ministry of Housing and Urban-Rural Development of the People’s Republic of China. The Ministry of Housing and Urban-Rural Development Issued a Notice to Carry out the National Smart City Pilot. Available online: https://www.mohurd.gov.cn/gongkai/zc/wjk/art/2012/art_17339_212182.html (accessed on 28 December 2024).
  20. Yan, D.; Liu, H.; Yao, P. Assessing Energy Efficiency for Economic and Sustainable Development in the Region of European Union Countries. Front. Environ. Sci. 2021, 9, 779163. [Google Scholar] [CrossRef]
  21. Zhang, Y.; Liu, X.; Yang, J. Digital Economy, Green Dual Innovation and Carbon Emissions. Sustainability 2024, 16, 7291. [Google Scholar] [CrossRef]
  22. Zhong, J.; Duan, Y.; Sun, C.; Wang, H. Analysis of the Impact of the Digital Economy on Carbon Emission Reduction and Its Spatial Spillover Effect—The Case of Eastern Coastal Cities in China. ISPRS Int. J. Geo-Inf. 2024, 13, 293. [Google Scholar] [CrossRef]
  23. Liu, K.; Meng, C.; Tan, J.; Zhang, G. Do smart cities promote a green economy? Evidence from a quasi-experiment of 253 cities in China. Environ. Impact Assess. Rev. 2023, 99, 107009. [Google Scholar] [CrossRef]
  24. Yi, M.; Liu, Y.F.; Sheng, M.S.; Wen, L. Effects of digital economy on carbon emission reduction: New evidence from China. Energy Policy 2022, 171, 113271. [Google Scholar] [CrossRef]
  25. He, Y.Z.; Song, W. Analysis of the Impact of Carbon Trading Policies on Carbon Emission and Carbon Emission Efficiency. Sustainability 2022, 14, 10216. [Google Scholar] [CrossRef]
  26. Wu, Y.Y.; Qi, J.; Xian, Q.; Chen, J.D. The Carbon Emission Reduction Effect of China’s Carbon Market—From the Perspective of the Coordination between Market Mechanism and Administrative Intervention. China Ind. Econ. 2021, 8, 114–132. [Google Scholar] [CrossRef]
  27. Li, Y.T.; Xu, Y.M. Impact of green finance on China’s pollution reduction and carbon efficiency: Based on the spatial panel model. Int. Rev. Econ. Financ. 2024, 94, 103382. [Google Scholar] [CrossRef]
  28. Chen, W. Digital economy development, corporate social responsibility and low-carbon innovation. Corp. Soc. Responsib. Environ. Manag. 2023, 30, 1664–1679. [Google Scholar] [CrossRef]
  29. Mills, D.; Pudney, S.; Pevcin, P.; Dvorak, J. Evidence-Based Public Policy Decision-Making in Smart Cities: Does Extant Theory Support Achievement of City Sustainability Objectives? Sustainability 2022, 14, 3. [Google Scholar] [CrossRef]
  30. Li, Y.; Zhao, X.; Liu, C.; Zhang, Z. Applications of Digital Technologies in Promoting Sustainable Construction Practices: A Literature Review. Sustainability 2025, 17, 487. [Google Scholar] [CrossRef]
  31. Liu, Y.; Liu, H.Y.; Xu, L.; Gu, Y. Smart Technology on Energy Conservation and Emission Reduction in Transportation System: A Case Study of Beijing. Urban Transp. China 2016, 14, 88–94. [Google Scholar] [CrossRef]
  32. Wang, Y.; Chen, Q.X.; Hong, T.; Kang, C.Q. Review of Smart Meter Data Analytics: Applications, Methodologies, and Challenges. IEEE Trans. Smart Grid 2019, 10, 3125–3148. [Google Scholar] [CrossRef]
  33. Cui, L.B.; Song, M.; Zhu, L. Economic evaluation of the trilateral FTA among China, Japan, and South Korea with big data analytics. Comput. Ind. Eng. 2019, 128, 1040–1051. [Google Scholar] [CrossRef]
  34. Zhou, X.; Zhang, M.; Zhou, M.H.; Zhou, M. A comparative study on decoupling relationship and influence factors between China’s regional economic development and industrial energy–related carbon emissions. J. Clean. Prod. 2016, 142, 783–800. [Google Scholar] [CrossRef]
  35. Chen, J.D.; Wu, Y.Y.; Wen, J.; Cheng, S.L.; Wang, J.L. Regional differences in China’s fossil energy consumption: An analysis for the period 1997–2013. J. Clean. Prod. 2016, 142, 578–588. [Google Scholar] [CrossRef]
  36. Li, S.S.; Liu, Y.B.; Elahi, E.; Meng, X.; Deng, W.F. A new type of urbanization policy and transition of low-carbon society: A “local- neighborhood” perspective. Land Use Policy 2023, 131, 106709. [Google Scholar] [CrossRef]
  37. Zhao, R.; Liu, Y.Y.; Zhang, N.; Huang, T. An optimization model for green supply chain management by using a big data analytic approach. J. Clean. Prod. 2016, 142, 1085–1097. [Google Scholar] [CrossRef]
  38. An, Q.X.; Wen, Y.; Xiong, B.B.; Yang, M.; Chen, X.H. Allocation of carbon dioxide emission permits with the minimum cost for Chinese provinces in big data environment. J. Clean. Prod. 2017, 142, 886–893. [Google Scholar] [CrossRef]
  39. Liu, P. Pricing policies and coordination of low-carbon supply chain considering targeted advertisement and carbon emission reduction costs in the big data environment. J. Clean. Prod. 2019, 210, 343–357. [Google Scholar] [CrossRef]
  40. Nazir, H.; Fan, J. Revolutionizing Retail: Examining the Influence of Blockchain-Enabled IoT Capabilities on Sustainable Firm Performance. Sustainability 2024, 16, 3534. [Google Scholar] [CrossRef]
  41. Wang, M.R.; Li, X.R.; Wang, S.Y. Discovering research trends and opportunities of green finance and energy policy: A data-driven scientometric analysis. Energy Policy 2021, 154, 112295. [Google Scholar] [CrossRef]
  42. Wang, J.D.; Wang, B.; Dong, K.Y.; Dong, X.C. How does the digital economy improve high-quality energy development? The case of China. Technol. Forecast. Soc. Change 2022, 184, 121960. [Google Scholar] [CrossRef]
  43. Fan, J.H.; Yan, L.; Chen, H.C. The Impact of the Digital Economy on Provincial Carbon Productivity: Empirical Evidence from China. Sage Open 2024, 14. [Google Scholar] [CrossRef]
  44. Zheng, R.J.; Wu, G.; Cheng, Y.; Liu, H.M.; Wang, Y.P.; Wang, X.Y. How does digitalization drive carbon emissions? The inverted U-shaped effect in China. Environ. Impact Assess. Rev. 2023, 102, 107203. [Google Scholar] [CrossRef]
  45. Zhang, Z.H.; Zhong, R.Y. Digital Economy, Green Technology Innovation, and Urban Low-Carbon Transformation. China Bus. Mark. 2023, 37, 60–70. [Google Scholar] [CrossRef]
  46. Xu, W.X.; Zhou, J.P.; Liu, C.J. The impact of digital economy on urban carbon emissions: Based on the analysis of spatial effects. Geogr. Res. 2022, 41, 111–129. [Google Scholar]
  47. Jiang, S.L.; Jia, F. How Can the Digital Economy Promote Carbon Emission Reduction-An Investigation Based on Urban Carbon Emission Intensity and Carbon Emission Efficiency. World Surv. Res. 2023, 14–21. [Google Scholar] [CrossRef]
  48. Tang, W.J.; Huang, Y.F.; Wang, P.; Sun, D.L. The Impact of Smart City Construction on the Achievement of “Dual Carbon” Goals-An empirical analysis based on provincial panel data using mediating effects. Price Theory Pract. 2023, 10, 174–179. [Google Scholar] [CrossRef]
  49. Hu, L.; Chen, Q.; Yang, T.; Yi, C.; Chen, J. Visualization and Analysis of Hotspots and Trends in Seafood Cold Chain Logistics Based on CiteSpace, VOSviewer, and RStudio Bibliometrix. Sustainability 2024, 16, 6502. [Google Scholar] [CrossRef]
  50. Liu, Y.; Wei, F. Analysis and Visualization of Authors and Social Networks of Educational Policy--Empirical Study on Authors of Articles of Educational Policy from 2005 to 2015 using CiteSpace. Int. Comp. Educ. 2017, 39, 56–62. [Google Scholar] [CrossRef]
  51. Chen, Y.F.; Chen, S.H.; Miao, J.F. Does smart city pilot improve urban green economic efficiency: Accelerator or inhibitor. Environ. Impact Assess. Rev. 2024, 104, 107328. [Google Scholar] [CrossRef]
  52. Shi, D.Q.; Ding, H.; Wei, P.; Liu, J.J. Can Smart City Construction Reduce Environmental Pollution. China Ind. Econ. 2018, 117–135. [Google Scholar] [CrossRef]
  53. Pei, C.W.; Yan, C.H. Logic and Suggestions for New Infrastructure to Promote the Achievement of the “Double Carbon” Goal. Price Theory Pract. 2022, 4, 5–8+52. [Google Scholar] [CrossRef]
  54. Zhang, B.B.; Chen, S.Q.; Cao, L.J. Is the City Low Carbon Because of “Smart”? Exploration from the Pilot Policy of Smart City. Econ. Rev. 2022, 6, 132–149. [Google Scholar] [CrossRef]
  55. Zhang, S.; Li, Z.; Ning, X.; Li, L. Gauging the Impacts of Urbanization on CO2 Emissions from the Construction Industry: Evidence from China. J. Environ. Manag. 2021, 288, 112440. [Google Scholar] [CrossRef]
  56. Zhang, X.Q.; Mao, K.Z. Analysis of the Correlation between Urbanization and Environmental Impact in Our Country. Jiangxi Soc. Sci. 2014, 34, 51–54. [Google Scholar]
  57. Liu, X.; Bae, J. Urbanization and Industrialization Impact of CO2 Emissions in China. J. Clean. Prod. 2018, 172, 178–186. [Google Scholar] [CrossRef]
  58. Mu, H.Z.; Fan, H.M. Influence of urbanization on the quality of environment: An analysis based on 27 national panel data. Urban Probl. 2016, 73–79. [Google Scholar] [CrossRef]
  59. Wang, D.; Tang, M.G. How Does Land Urbanization Affect Ecological Environment Quality? Analysis Based on Dynamic Optimization and Spatially Adaptive Semi-parametric Model. Econ. Res. J. 2019, 54, 72–85. [Google Scholar]
  60. Montjoy, R.S.; O’Toole, L.J. Toward a Theory of Policy Implementation: An Organizational Perspective. Public Adm. Rev. 1979, 39, 465. [Google Scholar] [CrossRef]
  61. Wang, H.Y.; Koblianska, I.I.; Yan, X. Research on Collaborative Innovation Path of Data Resources for Sustainable Development of Smart City. Int. J. Ecol. Dev. 2022, 37, 26–43. [Google Scholar]
  62. Ma, J.; Wu, L.H. Study on the impact of Smart City pilot on urban green innovation: Analysis based on TOE framework. Urban Probl. 2022, 66–76. [Google Scholar] [CrossRef]
  63. Shan, Z.G.; Shi, L.; Li, B.; Zhang, Y.Q.; Zhang, X.T.; Chen, W. Empowering smart city situational awareness via big mobile data. Front. Inf. Technol. Electron. Eng. 2024, 25, 286–308. [Google Scholar] [CrossRef]
  64. Xiao, C.M.; Huang, G.X. Is the Digital Economy Making Cities more Resilient?—Empirical Evidence from 285 Chinese Cities. Reg. Econ. Rev. 2023, 117–125. [Google Scholar] [CrossRef]
  65. Xie, S.; Fang, L.K.; He, J. Can smart city construction promote digital-reality integration? Causal inference based on double machine learning. Ind. Econ. Res. 2024, 100–113. [Google Scholar] [CrossRef]
  66. Zhou, L.; Gong, Z.M. The Impact of Digital Economy Level on Green High-quality Development in Chinese Cities. Econ. Geogr. 2022, 42, 133–141. [Google Scholar] [CrossRef]
  67. Lu, X.Y.; Zhao, Y.Y. Research on the Impact of Smart City Construction on Carbon Emission Efficiency Under the Green Development Goals. Inq. Into Econ. Issues 2024, 155–171. [Google Scholar]
  68. Beck, T.; Levine, R.; Levkov, A. Big bad banks? The winners and losers from bank deregulation in the United States. J. Financ. 2010, 65, 1637–1667. [Google Scholar] [CrossRef]
  69. Qian, L.; Xu, X.; Zhou, Y.; Sun, Y.; Ma, D. Carbon Emission Reduction Effects of the Smart City Pilot Policy in China. Sustainability 2023, 15, 5085. [Google Scholar] [CrossRef]
  70. Qin, B.T.; Yu, Y.W.; Ge, L.M.; Guo, Y.G. Smart Carbon Reduction: The Effect and Mechanism of Digital Economy Development on Urban Carbon Emissions. J. Guangdong Univ. Financ. Econ. 2023, 38, 4–32. [Google Scholar]
  71. Bian, Z.Q. Research on the Impact of Smart City Construction on Collaborative Governance of Pollution Reduction and Carbon Reduction. J. Ind. Technol. Econ. 2024, 43, 102–111. [Google Scholar]
  72. EDGAR—Emissions Database for Global Atmospheric Research. Available online: https://edgar.jrc.ec.europa.eu/ (accessed on 28 December 2024).
  73. CEADs-China Emission Accounts and Datasets. Available online: https://www.ceads.net.cn/data/ (accessed on 28 December 2024).
  74. Zhang, M.D.; Yang, Y.X. The Impact and Mechanism of Low-Carbon City Construction on Ecological Resilience: A Quasi-Natural Experiment Based on the Low-Carbon City Pilot Policy. East China Econ. Manag. 2025, 39, 69–81. [Google Scholar] [CrossRef]
  75. Ou, X.J.; Shen, Z.P.; Wang, R.C. Spatial Structure Evolution of Regional Economic Growth and Its Inequality in China since 1978. Geogr. Sci. 2006, 26, 641–648. [Google Scholar] [CrossRef]
  76. Zhou, X.B.; Chen, Z.; Wang, J.Y. The Current Situation, Causes and Countermeasures of the Economic Divide between the South and North in China. J. Hebei Univ. Econ. Bus. 2019, 40, 1–9+39. [Google Scholar] [CrossRef]
  77. Yu, Y.T.; Zhang, N. Does smart city policy improve energy efficiency? Evidence from a quasi-natural experiment in China. J. Clean. Prod. 2019, 229, 501–512. [Google Scholar] [CrossRef]
  78. Auty, R. Sustaining Development in Mineral Economies: The Resource Curse Thesis, 1st ed.; Routledge: London, UK, 1993. [Google Scholar] [CrossRef]
  79. Guo, M.J.; Yu, S.Y.; An, X.M.; Wang, J.D. Connection and Utilization of Government Data and Social Data: Connotation, Model and Verification of “Three Spirals” Operation Mechanism. China Soft Sci. 2021, 55–65. [Google Scholar] [CrossRef]
  80. Ren, B.P. Deep Integration of Digital Economy and Entity Economy to Promote “Progress” Vitality of China’s Economic Development. Frontiers 2024, 47–56. [Google Scholar] [CrossRef]
  81. Wang, J.T.; Wang, X.Y. The Impact Assessment of Smart City Pilot Policy on Urban Low-Carbon Economic Development: Evidence from Chinese Prefecture-level Cities. Shanghai Urban Manag. 2023, 32, 16–26. [Google Scholar]
  82. Guedes, A.L.A.; Alvarenga, J.C.; Goulart, M.D.S.; Rodriguez, M.V.R.Y.; Soares, C.A.P. Smart Cities: The Main Drivers for Increasing the Intelligence of Cities. Sustainability 2018, 10, 3121. [Google Scholar] [CrossRef]
  83. Burns, R.; Welker, P. Interstitiality in the smart city: More than top-down and bottom-up smartness. Urban Stud. 2023, 60, 308–324. [Google Scholar] [CrossRef]
Figure 1. Research path diagram.
Sustainability 17 04934 g001
Figure 2. (a) Keywords co-occurrence in CNKI literature; (b) keywords burst in CNKI literature; (c) keywords co-occurrence in WOS literature; (d) keywords burst in WOS literature.
Sustainability 17 04934 g002
Figure 3. (a) CNKI keywords timeline view; (b) WOS keywords timeline view.
Sustainability 17 04934 g003
Figure 4. (a) CNKI author cooperation network; (b) WOS author cooperation network.
Sustainability 17 04934 g004
Figure 5. China’s urban carbon emission intensity map.
Sustainability 17 04934 g005
Figure 6. Parallel trend test.
Sustainability 17 04934 g006
Figure 7. Placebo test.
Sustainability 17 04934 g007
Table 1. Top ten keywords in CNKI.
No.CountCentralityYearKeyword
1880.112022digital economy
2520.082013green development
3410.072014carbon emission
4400.112014big data
5370.392010internet of things
6310.322009smart city
7230.012021carbon neutrality
8210.112010energy conservation and emission reduction
9190.092021digital technology
10140.112018rural revitalization
Table 2. Top ten keywords in WOS.
No.CountCentralityYearKeyword
1850.032017big data
2420.062017energy consumption
3380.082015co2 emissions
4290.332017performance
5290.162014impact
6260.082017carbon emissions
7210.242016china
82002019internet of things
9190.042021smart city
10190.032021innovation
Table 3. Descriptive statistics of main variables.
VariableObsMeanStd. Dev.MinMax
CI41200.0170440.936223−2.310482.093797
smartcity41200.1968450.39766201
X1412010.49290.7047598.7615511.97025
X241205.7396980.8858372.9030697.20406
X341200.4040580.0929480.1945330.661696
X441202.3021181.067660.8951336.441953
Table 4. Benchmark regression results.
(1)
CI
(2)
CI
(3)
CI
(4)
CI
(5)
CI
VARIABLES
smartcity−0.0325 ***−0.0343 ***−0.0343 ***−0.0350 ***−0.0351 ***
(0.0103)(0.0103)(0.0103)(0.0103)(0.0103)
X1 0.0565 ***0.0564 ***0.0445 ***0.0284
(0.0156)(0.0157)(0.0166)(0.0191)
X2 0.001250.004510.00391
(0.0207)(0.0207)(0.0207)
X3 −0.191 **−0.175 **
(0.0766)(0.0769)
X4 −0.0135 **
(0.00624)
Constant0.0234 ***−0.569 ***−0.575 ***−0.392 **−0.194
(0.00305)(0.163)(0.185)(0.199)(0.219)
CityYesYesYesYesYes
YearYesYesYesYesYes
Observations41204120412041204120
R-squared0.9740.9740.9740.9740.974
(Robust standard errors in parentheses, *** p < 0.01, ** p < 0.05).
Table 5. Four robustness test results.
(1)
CI
(2)
CI
(3)
CI
(4)
CI
VARIABLES
smartcity−0.0351 *** −0.0348 ***
(0.0103) (0.0103)
X10.02840.02380.0380 **0.0294
(0.0191)(0.0185)(0.0185)(0.0206)
X20.003910.000491−0.004950.00242
(0.0207)(0.0193)(0.0191)(0.0260)
X3−0.175 **−0.201 ***−0.214 ***−0.160 *
(0.0769)(0.0747)(0.0723)(0.0864)
X4−0.0135 **−0.0129 **−0.00852−0.0138 **
(0.00624)(0.00617)(0.00608)(0.00663)
L1_smartcity −0.0405 ***
(0.0105)
L2_smartcity −0.0321 ***
(0.0102)
Constant−0.194−0.158−0.331−0.188
(0.219)(0.206)(0.205)(0.246)
CityYesYesYesYes
YearYesYesYesYes
Observations4120374234433862
R-squared0.9740.9770.9800.975
(Robust standard errors in parentheses, *** p < 0.01, ** p < 0.05, * p < 0.1).
Table 6. PSM-DID test results.
(1)(2)
VARIABLESpsmpsm
smartcity−0.0253 **−0.0257 **
(−2.5146)(−2.5455)
X10.01890.0206
(1.0574)(1.1415)
X20.00160.0015
(0.0797)(0.0754)
X3−0.1696 **−0.1648 **
(−2.2969)(−2.2108)
X4−0.0153 ***−0.0148 **
(−2.5872)(−2.5057)
X5−0.0000 *−0.0000 *
(−1.6689)(−1.6717)
Constant−0.0624−0.0835
(−0.3028)(−0.4022)
CityYesYes
YearYesYes
Observations39823978
R-squared0.9780.978
(Robust standard errors in parentheses *** p < 0.01, ** p < 0.05, * p < 0.1).
Table 7. DDML results.
(1)(2)(3)(4)(5)(6)
A1A2A3A4A5A6
VARIABLESCICICICICICI
smartcity−0.239 ***−0.179 ***−0.124 ***−0.100 ***−0.070 **−0.076 **
(0.035)(0.035)(0.034)(0.034)(0.032)(0.032)
Constant0.0020.0010.0070.005−0.002−0.000
(0.017)(0.013)(0.011)(0.010)(0.008)(0.008)
Observations412041204120412041204120
YearYESYESYESYESYESYES
CityYESYESYESYESYESYES
(Robust standard errors in parentheses, *** p < 0.01, ** p < 0.05).
Table 8. Results of regional heterogeneity and resource endowment heterogeneity.
(1)
CI
(2)
CI
(3)
CI
(4)
CI
VARIABLES
smartcity−0.0137−0.0604 ***−0.0175−0.0480 ***
(0.0147)(0.0143)(0.0152)(0.0137)
X10.0287−0.00734−0.0497 **0.0680 **
(0.0272)(0.0297)(0.0249)(0.0285)
X2−0.08990.009960.106 **−0.0395
(0.109)(0.0175)(0.0433)(0.0316)
X3−0.171 *−0.157−0.250 **−0.147
(0.103)(0.112)(0.120)(0.101)
X40.0261 **−0.0326 ***−0.0211 **−0.0148 *
(0.0115)(0.00813)(0.00867)(0.00882)
Constant0.1440.3470.0504−0.324
(0.706)(0.327)(0.304)(0.354)
CityYesYesYesYes
YearYesYesYesYes
Observations2261185916342486
R-squared0.9710.9780.9810.970
(Robust standard errors in parentheses, *** p < 0.01, ** p < 0.05, * p < 0.1).
Disclaimer/Publisher’s Note: The statements, opinions and data contained in all publications are solely those of the individual author(s) and contributor(s) and not of MDPI and/or the editor(s). MDPI and/or the editor(s) disclaim responsibility for any injury to people or property resulting from any ideas, methods, instructions or products referred to in the content.

