Article

Mapping the Distribution and Discharge of Plastic Pollution in the Ganga River

1
Wildlife Institute of India, Chandrabani, Dehradun 248001, India
2
Forest Research Institute, Kaulagarh Road, Dehradun 248195, India
3
Zoological Society of London, Regent’s Park, London NW1 4RY, UK
4
Centre for Ecology & Conservation, Penryn Campus, University of Exeter, Penryn TR10 9FE, UK
*
Author to whom correspondence should be addressed.
Sustainability 2025, 17(11), 4932; https://doi.org/10.3390/su17114932
Submission received: 8 January 2025 / Revised: 6 March 2025 / Accepted: 12 March 2025 / Published: 27 May 2025

Abstract

:
The Ganga River, a lifeline for millions and a critical freshwater ecosystem, is under threat from escalating plastic pollution driven by widespread usage and inadequate disposal practices. While marine ecosystems have garnered extensive research attention, freshwater systems—particularly in the Global South—remain underexplored, leaving critical gaps in understanding plastic pollution’s sources and pathways. Addressing these gaps, the study documents the prevalence and typology of plastic debris in urban and underexplored rural communities along the Ganga River, India, aiming to suggest mechanisms for a reduction in source-based pollution. A stratified random sampling approach was used to select survey sites and plastic debris was quantified and categorised through transect surveys. A total of 37,730 debris items were retrieved, dominated by packaging debris (52.46%), fragments (23.38%), tobacco-related debris (5.03%), and disposables (single-use plastic cutleries) (4.73%) along the surveyed segments with varying abundance trends. Floodplains displayed litter densities nearly 28 times higher than river shorelines (6.95 items/m2 vs. 0.25 items/m2), with minor variations between high- and low-population-density areas (7.14 items/m vs. 6.7 items/m2). No significant difference was found between rural and urban areas (V = 41, p = 0.19), with mean densities of 0.87 items/m2 and 0.81 items/m2, respectively. Seasonal variations were insignificant (V = 13, p = 0.30), but treatment sites displayed significant variance (Chi2 = 10.667, p = 0.004) due to flood impacts. The findings underscore the urgent need for tailored waste management strategies integrating industrial reforms, decentralised governance, and community-driven efforts. Enhanced baseline information and coordinated multi-sectoral efforts, including Extended Producer Responsibility (EPR), are crucial for mitigating plastic pollution and protecting freshwater ecosystems, given rivers’ significant contribution to ocean pollution.

1. Introduction

Plastic, a versatile polymer, has revolutionised various industries, becoming one of the most ubiquitous materials in modern society due to its durability, flexibility, cost-effectiveness, and persistent usage [1]. Over the decades, the modification of plastic polymers has increased its acceptance and use, leading to the global circulation of plastic litter, including in remote regions [2,3,4,5]. Plastic waste accumulation was first observed in marine ecosystems in 1972 [6], which attracted the focus of the scientific community and resulted in extensive studies on the characterisation, transportation, and accumulation patterns of marine plastics [7,8,9,10]. However, mismanaged plastics from rivers serve as critical conduits for transporting plastic pollution to marine environments, hence gaining more research attention [11,12,13,14,15]. On entering aquatic environments, macroplastics degrade into microplastics, disrupting habitat quality [16] and posing risks to biodiversity through entanglement and ingestion. About 206 freshwater species were documented to ingest plastics [17], leading to the transfer of harmful substances through the food chain, thereby affecting wildlife and humans [18,19,20,21,22]. The presence of toxins, heavy metals, and persistent organic pollutants (POPs) in plastics further raises concerns for human health as humans are top consumers in the food chain, and bioaccumulation in fishes and other aquatic species leads to the supply of toxins to humans [18,20]. Moreover, plastics act as vectors for chemical contaminants, heightening toxic exposure risks [19,22]. As these pollutants enter the human body, they may disrupt endocrine systems, contribute to chronic diseases, and cause neurological or developmental issues [21]. Compounding these threats, an estimated 1.15 to 2.41 million tonnes of plastic are annually transported to oceans via rivers, predominantly during the monsoon periods from May to October [13].
In India, the challenge of managing plastic waste is acute, reflecting broader issues faced by densely populated regions [23,24]. The country annually generates about 9.4 million tonnes of plastic waste, of which approximately 3.8 million tonnes remain uncollected [25]. The impact of plastic waste in rural areas, where 68% of the nation’s population resides [26], is not well understood [27], due to a lack of information, hindering effective interventions [28,29,30].
The Ganga River, a critical freshwater ecosystem, exemplifies the severe impacts of plastic pollution. Ranked among the top ten rivers globally contributing to marine plastic pollution, the Ganga annually contributes an estimated 0.12 million tonnes of plastic to marine pollution [13,15,19]. This problem is exacerbated by monsoon floods that flush accumulated terrestrial plastic waste into the river, further polluting the waterway [31,32,33]. Additionally, differences in population densities and the higher rate of litter generation in floodplain settlements compared to river shorelines contribute to the complexity of the pollution dynamics [34,35].
This study investigates plastic waste contributions across urban and rural domains along the Ganga River shorelines and floodplains in India, evaluating the influence of geography and demography, as well as the role of floods, in modulating plastic discharge and accumulation. This baseline information is essential for developing informed policies and strategizing issue- and site-specific mechanisms for reducing plastic usage, optimising waste management, and mitigating pollution impacts on the Ganga River basin and similar freshwater ecosystems.

2. Study Area

The Ganga River, India’s most extensive fluvial system, encapsulates the nation’s largest river basin, occupying approximately 26.3% of India’s geographical expanse. This basin is the world’s most densely populated, supporting nearly half of India’s populace [36]. Originating from the Gangotri glacier in Himalaya and running to the Bay of Bengal, the Ganga covers 1.01 million km2 [37] and traverses five states, Uttarakhand, Uttar Pradesh, Bihar, Jharkhand, and West Bengal, over its 2525 km course. The extended monsoon season between June to September delivers about 84% of annual precipitation, inducing significant seasonal variations and complex challenges in land and water resource management [38].
This study focuses on a 76 km segment of the Ganga from Lal Bathani to Radhanagar in Sahibganj district of Jharkhand state (Figure 1). The study area also includes a critical 34 km stretch of the Ganga River, designated as a High-Biodiversity Zone (HBZ) by the Wildlife Institute of India, using an indicator species approach and focusing on ecologically significant fauna such as the Gangetic dolphin (Platanista gangetica) and smooth-coated otter (Lutrogale perspicillata) [39,40]. Key criteria include the presence of species critical for biodiversity, the uniqueness and sensitivity of habitats, and ecological features that represent the overall health of the ecosystem. This method integrates multiple factors such as habitat cover, species attributes, species richness, geographic range, and species abundance to create a robust framework for conservation planning. This ecologically critical zone harbours key aquatic species such as the Gangetic dolphin and smooth-coated otter, along with 89 fish species, 182 phytoplankton, and 40 zooplankton species [40].
Beyond its geographical and ecological significance, the Ganga River is vital for the communities of Sahibganj district, where pervasive plastic usage and inadequate waste disposal practices severely impact the river’s ecological integrity. Sahibganj is categorised as a Tier 3 city, characterised by its smaller population, limited infrastructure, and lower levels of economic development and urbanisation. Sahibganj exemplifies rural regions with a predominantly agrarian economy, traditional communal practices, and minimal industrialisation, characterised by villages and agricultural expanses. The absence of extensive urban infrastructure and the prevalence of a rural lifestyle are prominent features [44].

3. Methods

The study’s methodology was adapted from the National Oceanic and Atmospheric Administration (NOAA) Marine Debris Shoreline Survey Field Guide [45] and the river debris assessment methodology [14]. We modified the survey design to address the unique characteristics of our study area and enhance data accuracy and relevance.
While the NOAA guide focuses on marine shorelines, we included river shorelines and floodplain settlements. To ensure consistent datasets across different settings, transect dimensions were adjusted as detailed below. Surveys were timed to capture seasonal variations, particularly pre- and post-monsoon, to understand flood impacts on debris patterns. We also extended debris categorisation to include local waste types like disposable cutleries, packaging, personal care and cosmetic products (PCCPs), and fishing gear.

3.1. Site Selection

The transect sites for intensive data collection along the Ganga River shoreline were selected using a stratified random sampling approach with the aid of the Geospatial software ArcMap 10.7 [46] and ground truthing. These sites were located in the Sahibganj district covering the Ganga River stretch, upstream of the Farakka Barrage, Murshidabad, and downstream to the Vikramshila Gangetic Dolphin Sanctuary in Bhagalpur. Transect sites were categorised into two categories: river shorelines (situated along the river) and flood plains (situated in the region prone to floods). The river shoreline transects (n = 20) covered an area of 100 m × 10 m, distributed at intervals of 5 km along the river stretch, resulting in a total sampling area of 1000 m2 (Figure 2). Transects were laid to document the distribution and prevalence of plastic waste in the selected sites. The selection of these sampling sites was strategic, encompassing seventeen sites in villages/rural areas and three (Site 4, 5, and 14) in urban areas, which also included four adjacent canals (Site 1,4, 18, and 19) linking Sahibganj city and Udhwa wetland to the Ganga River.
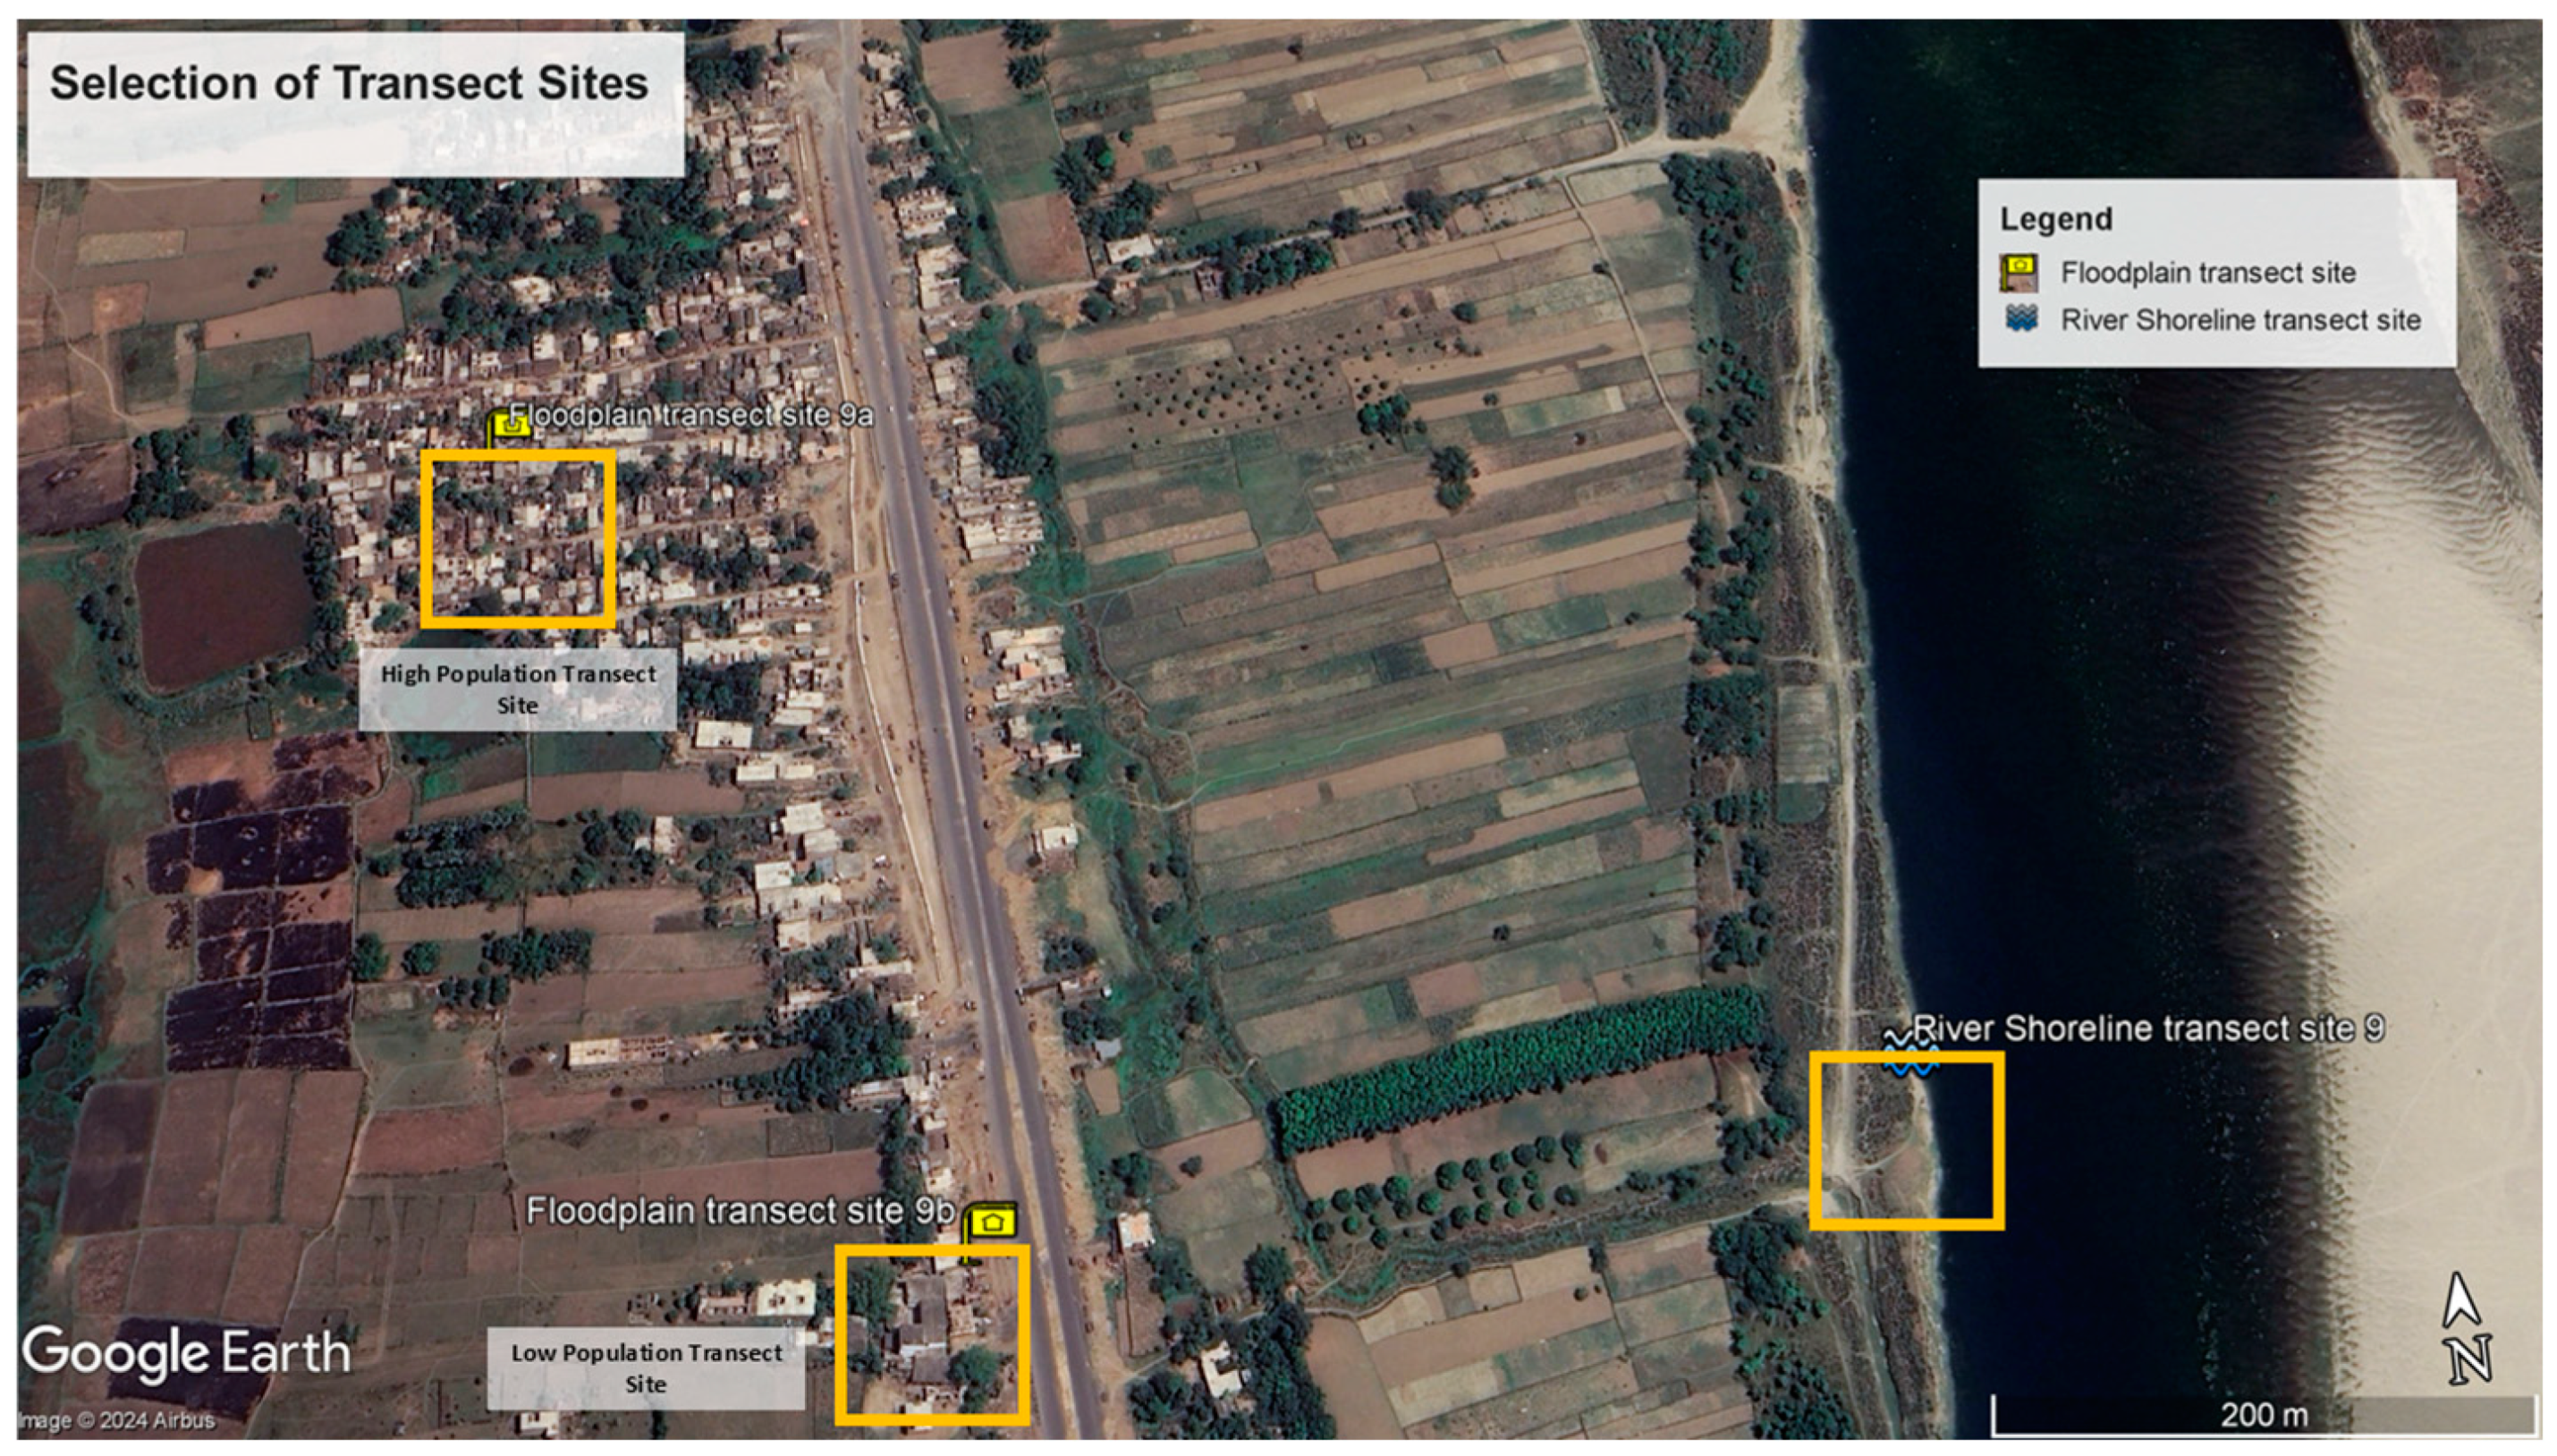
In floodplains, the transect sites adjacent to the river transects were identified using stratified sampling facilitated by Google Earth, with a grid overlay based on population data [26] for the study area. Grids with built-up areas below 50% were classified as low-density population zones, while those with more than 80% built-up areas were designated as high-density population zones. Transect sites (n = 40), including low population density (n = 20) and high population density (n = 20) sites, were randomly selected from the grids, which had dimensions of 100 × 100 m2, according to the proportion of built-up area. To investigate the dispersion of plastic waste from regions characterised by high and low population density along riverine ecosystems, two transects were laid within proximate floodplains of each river shoreline transect. The methodology of data collection followed for shoreline transects was replicated in village transects, with a width of 1 m and a length of 100 m, resulting in a total sampling area of 100 m2 (Figure 2). In each transect (both in shorelines and floodplains), GPS coordinates of the start and end points of the transects and litter item type and weight were recorded.
Selection criteria included factors like accessibility and continuity, ensuring a uniform 100 m segment along the riverbank while avoiding obstacles such as walls, private properties, or inaccessible terrain.
To evaluate the influence of flooding on waste transportation and accumulation dynamics, accumulated waste was selectively extracted from four randomly designated sampling sites (Sites 1, 5, 12, 17), referred to as treated sites, and subsequently deposited into municipal garbage bins.

3.2. Data Collection

Data collection was carried out from October 2022 to April 2024. For river shorelines, the data were collected for two distinct seasons, pre-monsoon and post-monsoon, to understand the seasonal pattern of debris accumulation along the Ganga River. The study covered a length of about 76 km of river stretch, resulting in a total shoreline length of approximately 152 km when considering both shores. For the floodplains, the transects were laid for only one season, pre-monsoon, into low-population-density areas and high-population-density areas to understand the distribution and composition of plastic in both rural and urban areas.
The collection activities were predominantly conducted during the morning, between 6:00 a.m. and 11:00 a.m. IST. The researcher and three local volunteers collected all visible debris (surface and semi-buried debris) attributed to human activities along the riverbank, covering the entire designated area. The collected debris was then counted, weighed, and categorised. Data sheets were adapted from Owens and Kamil [14], and Opfer et al. [45].

3.3. Data Analysis

Statistical analysis was conducted using PAST 2.17c, R Studio 2024.04.1, and Datatab software (https://datatab.net/). The Shapiro–Wilk test was performed to evaluate the normality of data distributions for shorelines and floodplains. Non-parametric tests were applied to examine seasonal and spatial variations in debris densities.
The analysis of nightlight intensity data from 2012 to 2020 was also conducted to assess urbanisation trends in the studied areas. The Visible Infrared Imaging Radiometer Suite (VIIRS) nighttime data were used as a proxy for urbanisation [47]. The nighttime illumination data provides a measure of artificial light accessibility, which serves as an indirect indicator of urban development and expansion. The temporal evolution of nocturnal artificial light in Jharkhand was mapped, highlighting the rise in urban centres, the expansion of road networks, and the transformation of rural landscapes into urban areas over a span of less than a decade [48].

4. Results

Over the two survey periods, including pre-monsoon (May–June 2022) and post-monsoon (January–February 2023), a cumulative total of 9904 litter counts, equivalent to 126.8 kg, was collected from the river shorelines. For the floodplains, data were collected during one season (March–April 2024) from two different geographical settings, resulting in 27,826 items, equivalent to 75.93 kg. Plastic debris emerged as the predominant category, representing 99.8% of the total quantity from the river shorelines and 90.6% from the floodplain regions. An analysis of the primary sources of debris identified substantial contributions from household waste (87%) (shampoo, single-use cosmetic and detergent sachets, plastic bags, food wrappers, single-use plastic (SUP) fragments, cloth pieces, tobacco wrappers, etc.), religious waste (2.6%) (incense stick packaging, plastic frames, etc.), and discarded fishing gear (4.5%) (discarded nets, Styrofoam pieces, etc.).

4.1. River Shorelines and Floodplains

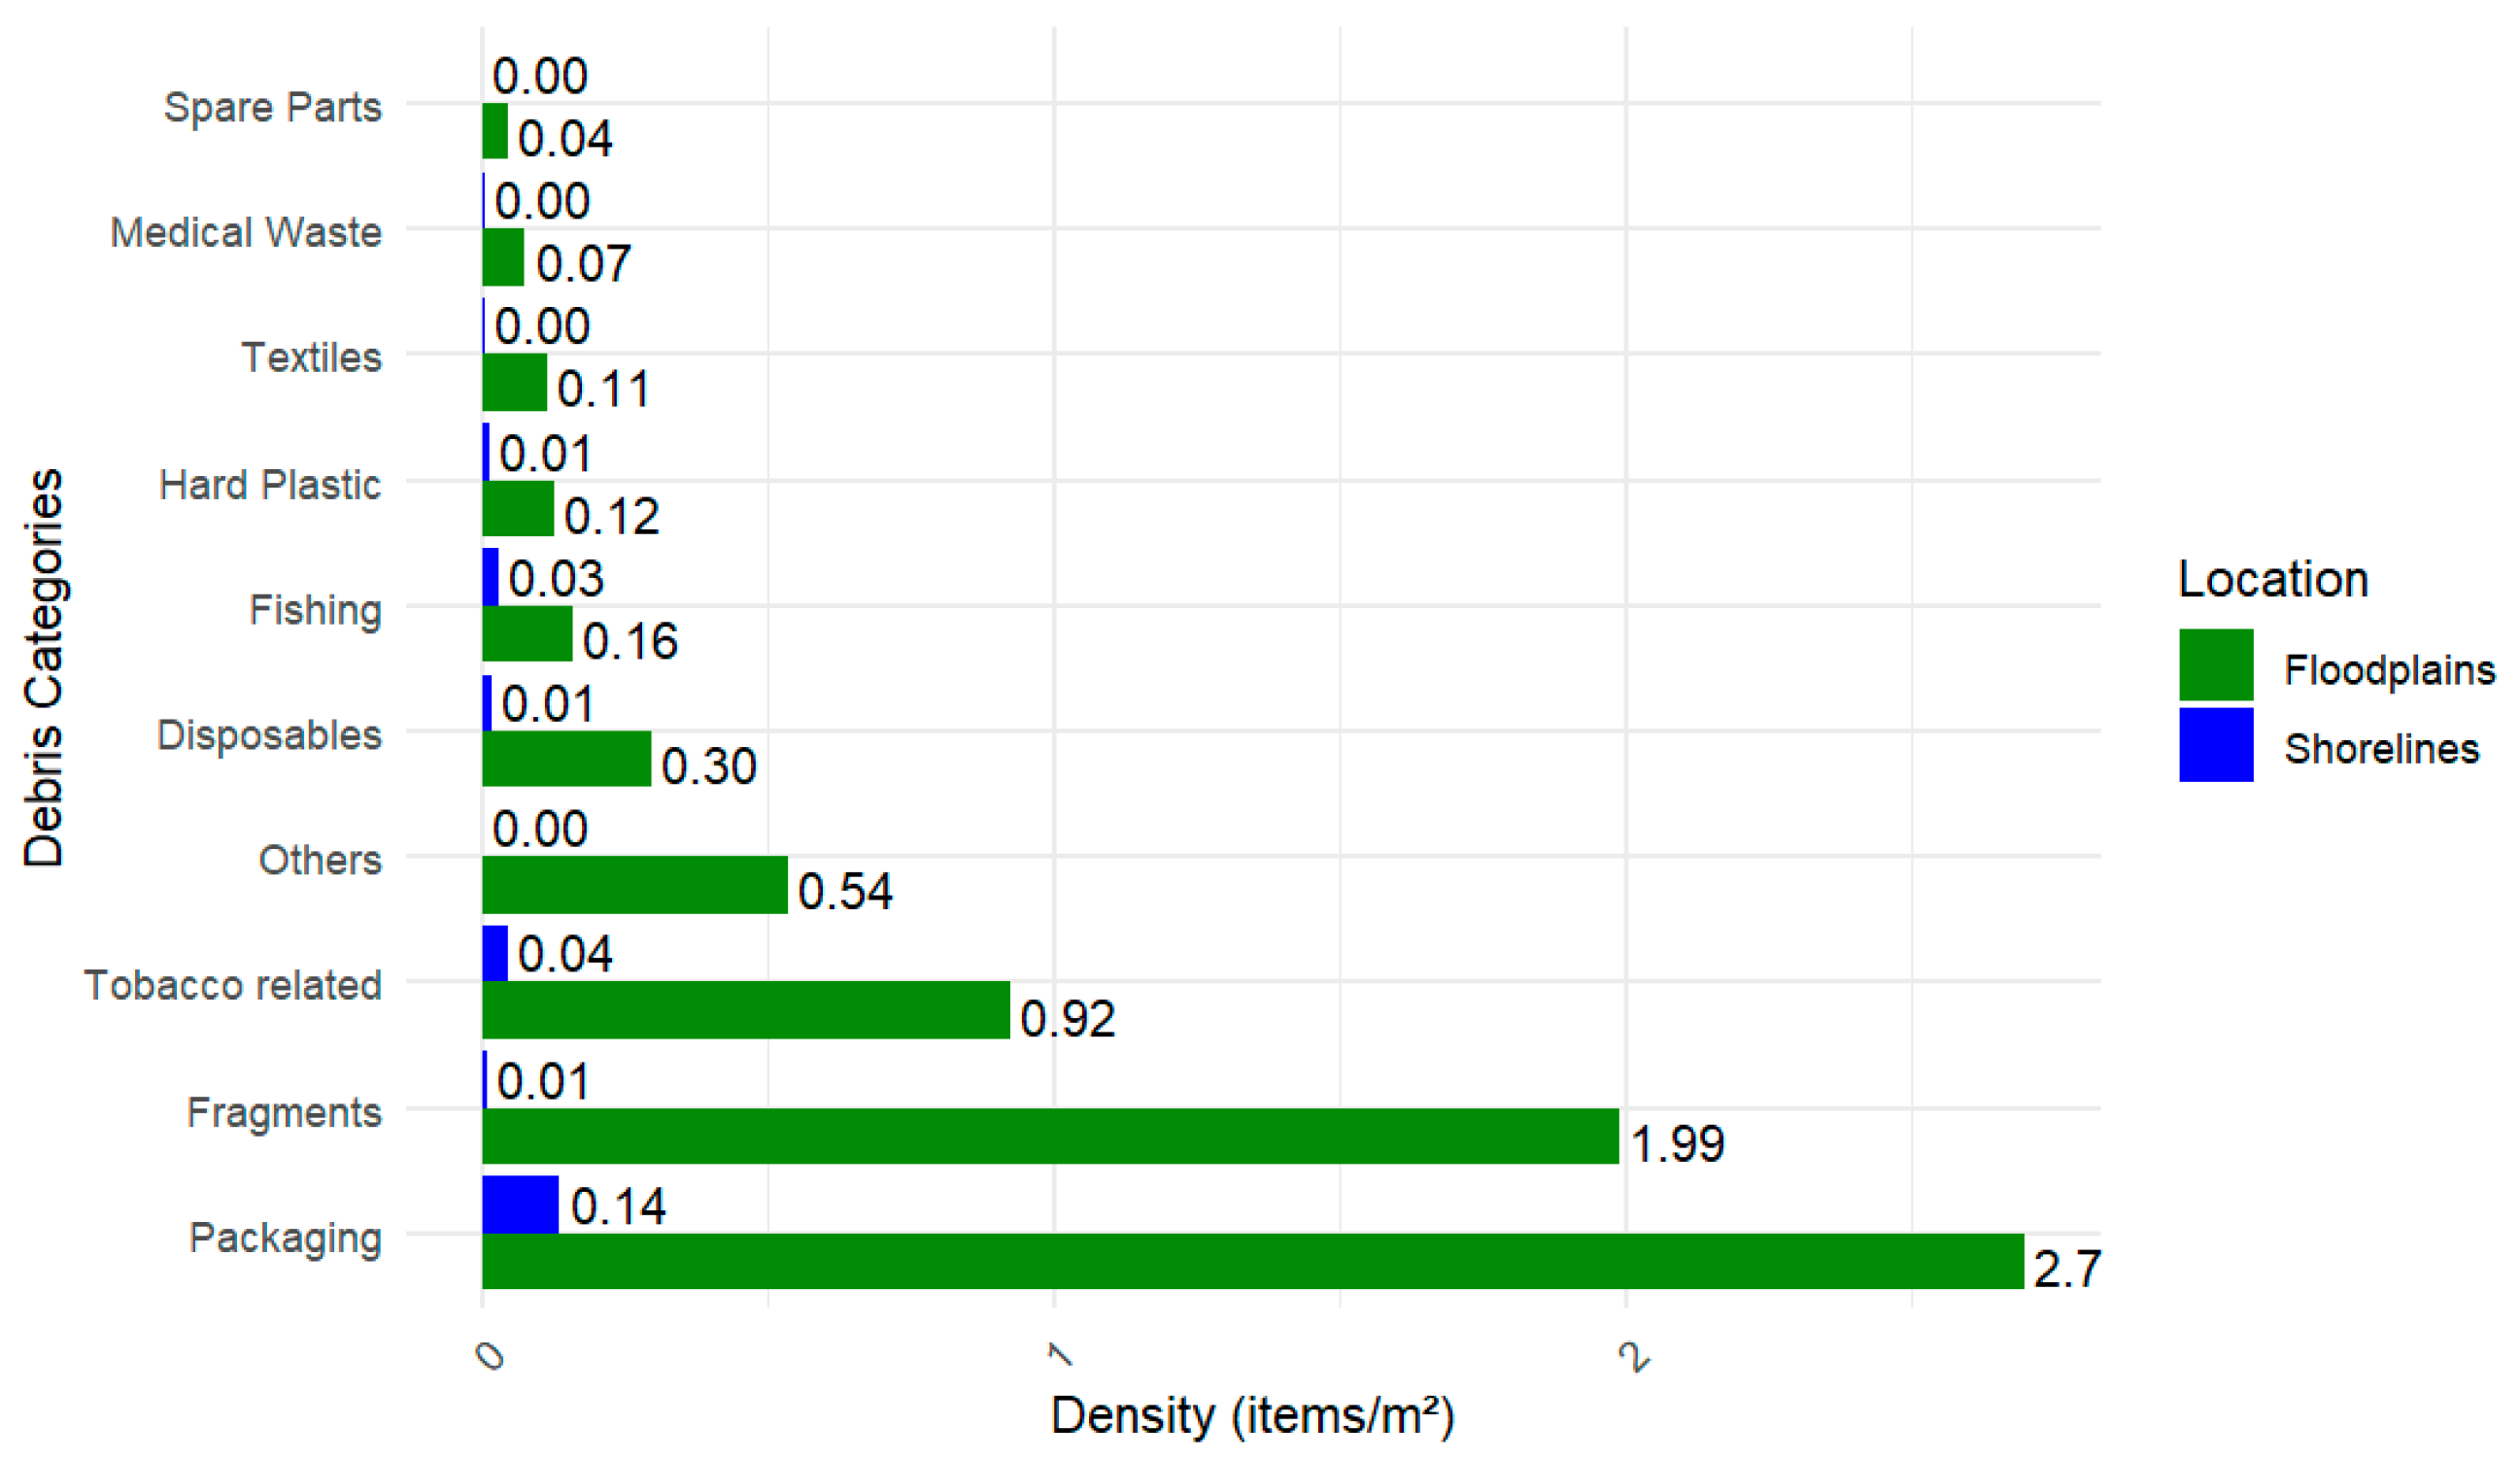
A Wilcoxon rank-sum exact test revealed a significant difference (W = 4, p = 0.0001) in debris densities between river shorelines and floodplains. Transects within floodplains displayed litter densities significantly higher than those observed along river shorelines (6.95 ± 0.036 items m−2 vs. 0.25 ± 0.01 items m−2).
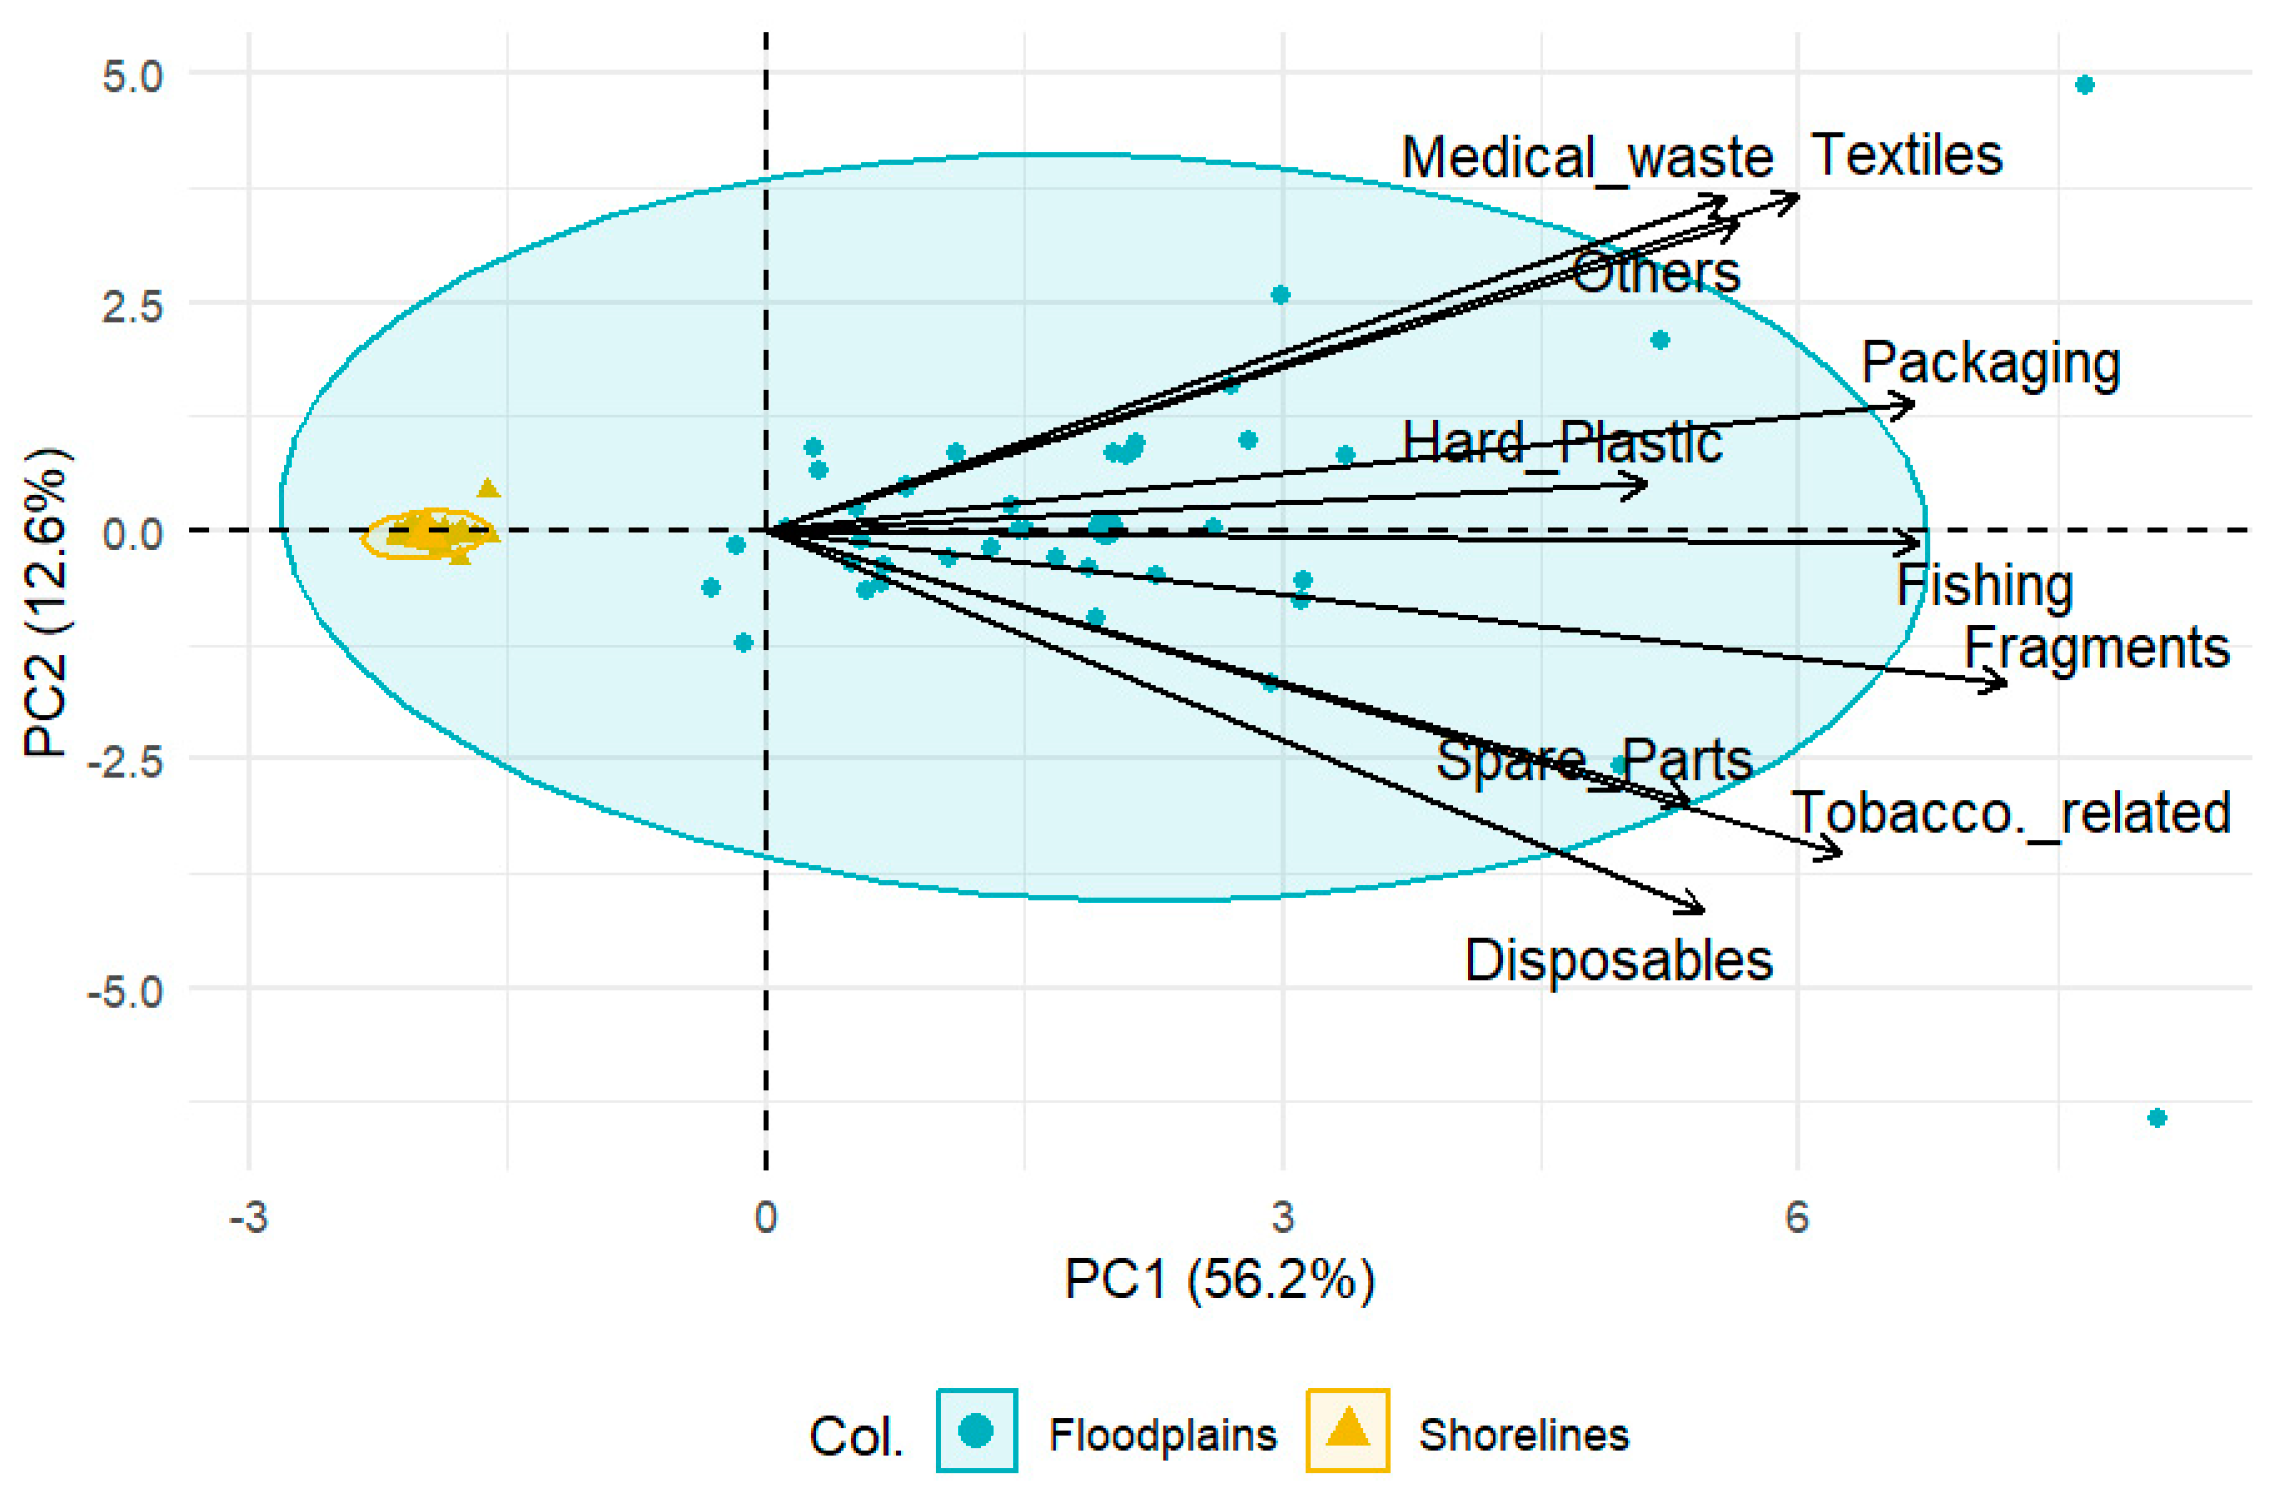
The principal component analysis (PCA) biplot showed packaging as the dominant debris type, with the highest variance along PC1 (56.2%). Floodplains exhibited a greater diversity of debris, especially in medical waste, textiles, and others, contributing to PC2 (12.6%) and totalling 68.8% of the variance explained. Shoreline debris was more consistent in composition, with less variability and closer clustering, indicating differences in debris characteristics between floodplains and shorelines (Figure 3).
Packaging debris was a prevalent category recorded for floodplains, constituting 38.79% of the total, with 10,793 items and a debris density of 2.7 ± 1.3 items m−2 (Figure 4). Candy wrappers (33.76%), food wrappers (33.41%), and plastic bags (21.75%) formed the major constituents of the packaging debris. The data also highlights that along with packaging, fragments and tobacco-related debris were also dominant categories recorded from floodplain transects. Fragments accounted for 28.61% of the debris, with 7962 items and a density of 1.99 ± 1.08 items m−2, primarily composed of single-use plastic fragments (89.4%), hard plastic fragments (9.57%), and foam (0.78%). Tobacco-related debris made up 13.26% of the total, with 3689 items and a density of 0.92 ± 0.74 items m−2, predominantly composed of tobacco wrappers (97.24%) (Table S1). Additionally, debris related to spare parts was exclusively observed in floodplain transects and was absent from shoreline sites, indicating localised sources and accumulation patterns.
Among the various categories of debris collected from river shorelines, as with floodplains, packaging debris emerged as prevalent, with a total count of 5415 items (mean 0.14 ± 0.07 items m−2), accounting for 54.67% of the total debris. Within this category, food wrappers (26.19%), personal care and cosmetic products (PCCPs) wrappers (34.83%), and plastic bags (27.65%) were the most frequently encountered subcategories. Tobacco-related debris totalled 1796 items (mean 0.04 ± 0.08 items m−2), comprising 18.13% of the total debris and dominated by tobacco wrappers (99.94%). Fishing-related debris was also substantial, with a total count of 1063 items (0.03 ± 0.21 items m−2), representing 10.73% of the total shoreline debris (Figure 3; Table S2).

4.2. Rural vs. Urban

Similar quantities of litter between urban and rural settings were recorded, with means of 0.81 items m−2 and 0.87 items m−2 across all transect sites. Packaging debris constituted the predominant litter category in both rural and urban areas, comprising 52.00% and 55.31% of total quantities, respectively. Mean densities of packaging litter were recorded at 0.45 ± 0.12 items m−2 in rural areas and 0.45 ± 0.03 items m−2 in urban areas. Fragments accounted for 23.27% and 24.08% of total quantities, with mean densities of 0.20 ± 0.09 items m−2 and 0.19 ± 0.08 items m−2, respectively. Tobacco-related debris predominated after fragments in rural areas, comprising 5.46% of total quantities with a mean density of 0.05 ± 0.08 items m−2, while disposables cutleries (SUP cups, spoons, and plates) ranked among the top three categories in urban areas, constituting 6.05% of total quantities with a mean density of 0.05 ± 0.04 items m−2 (Table S3).
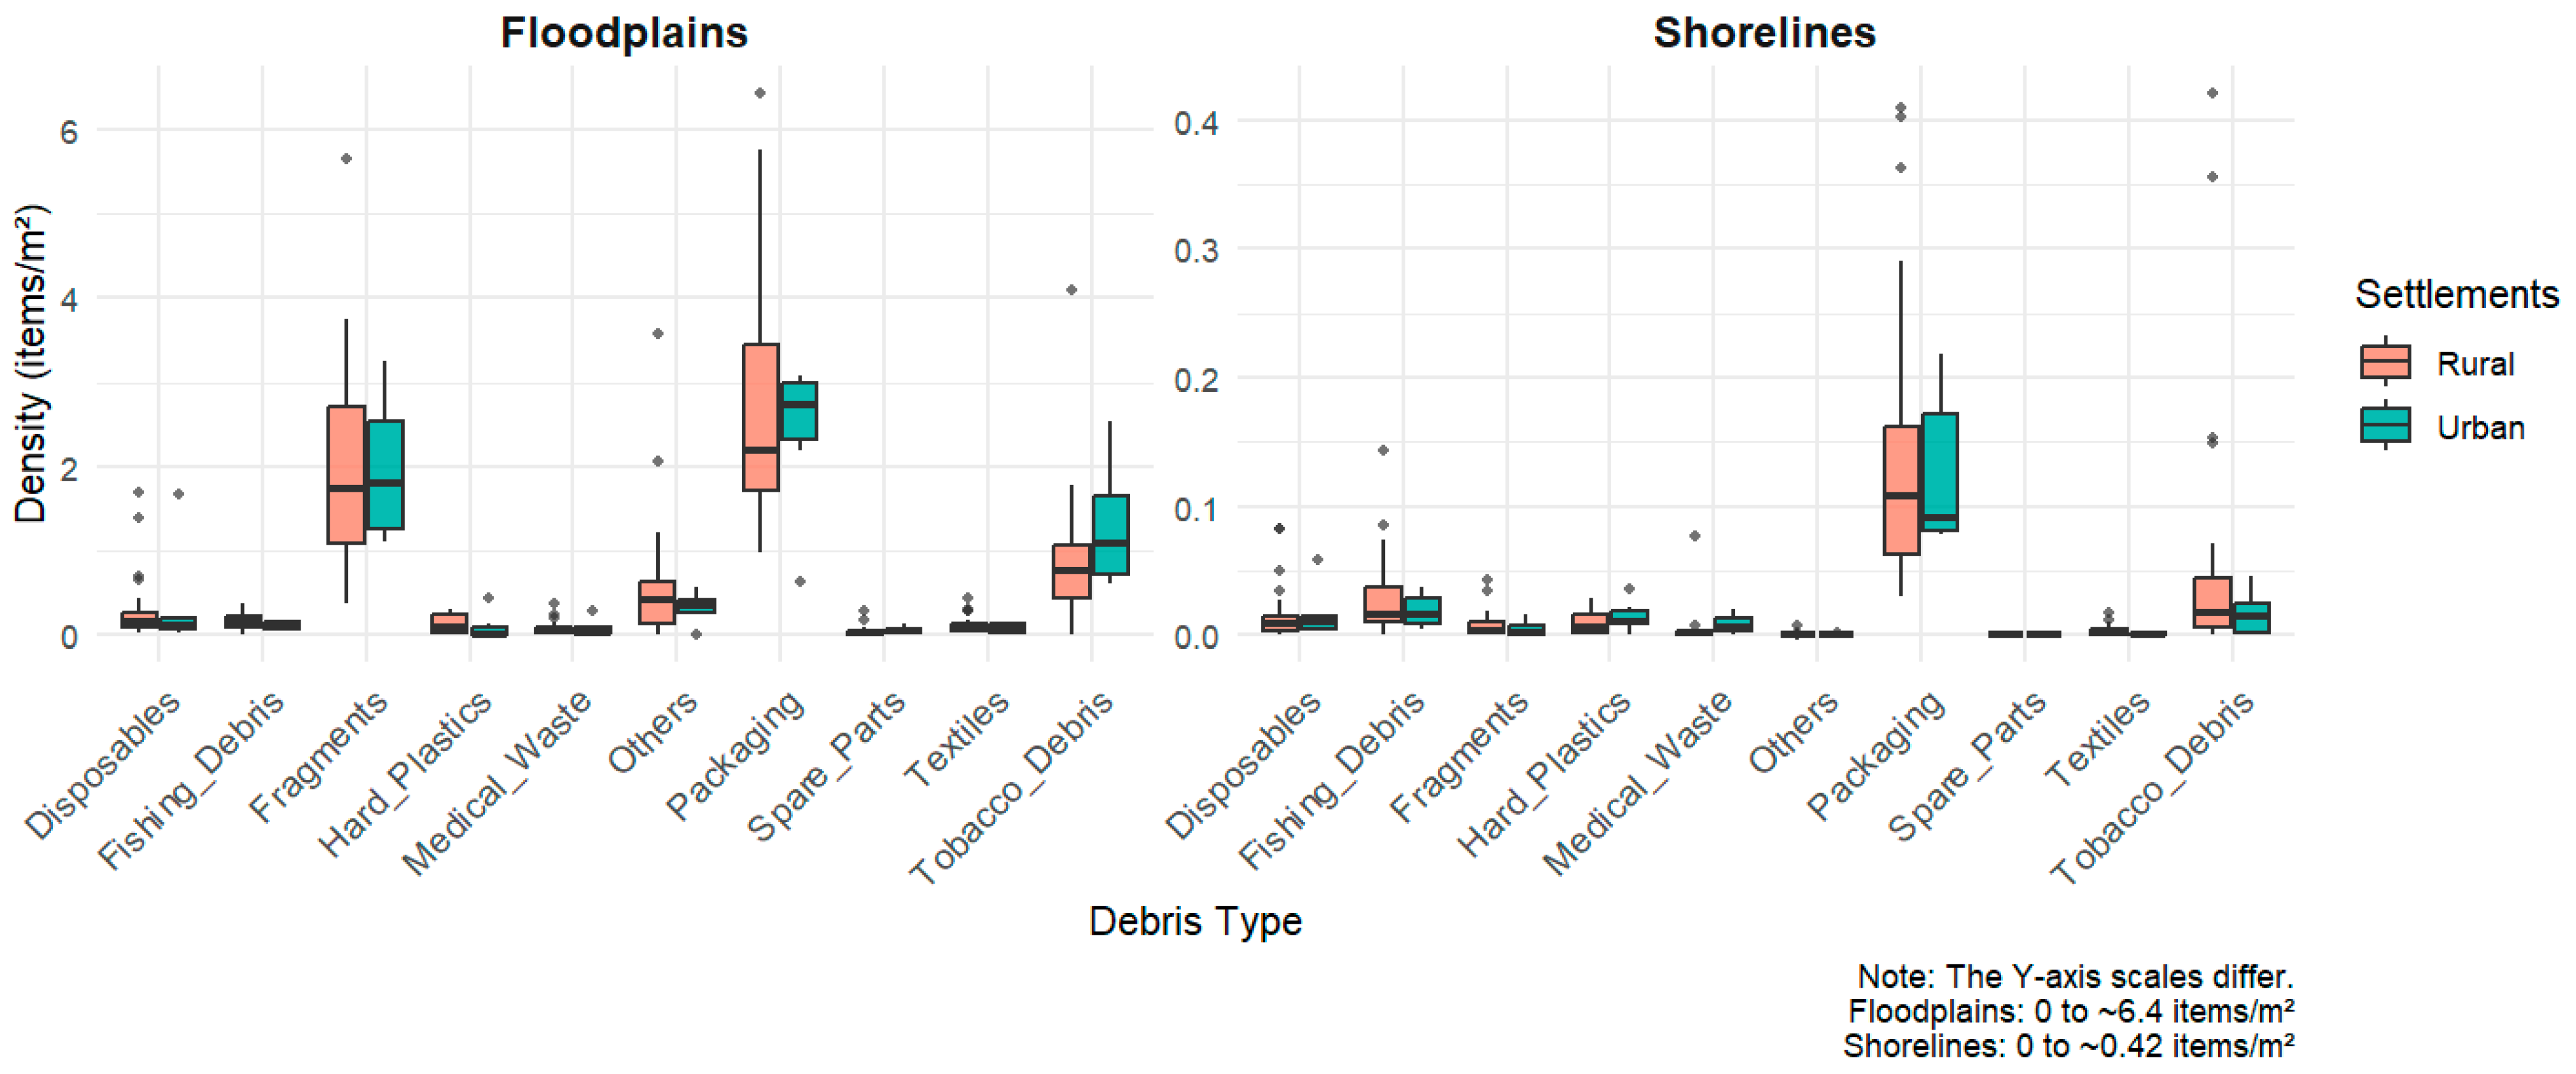
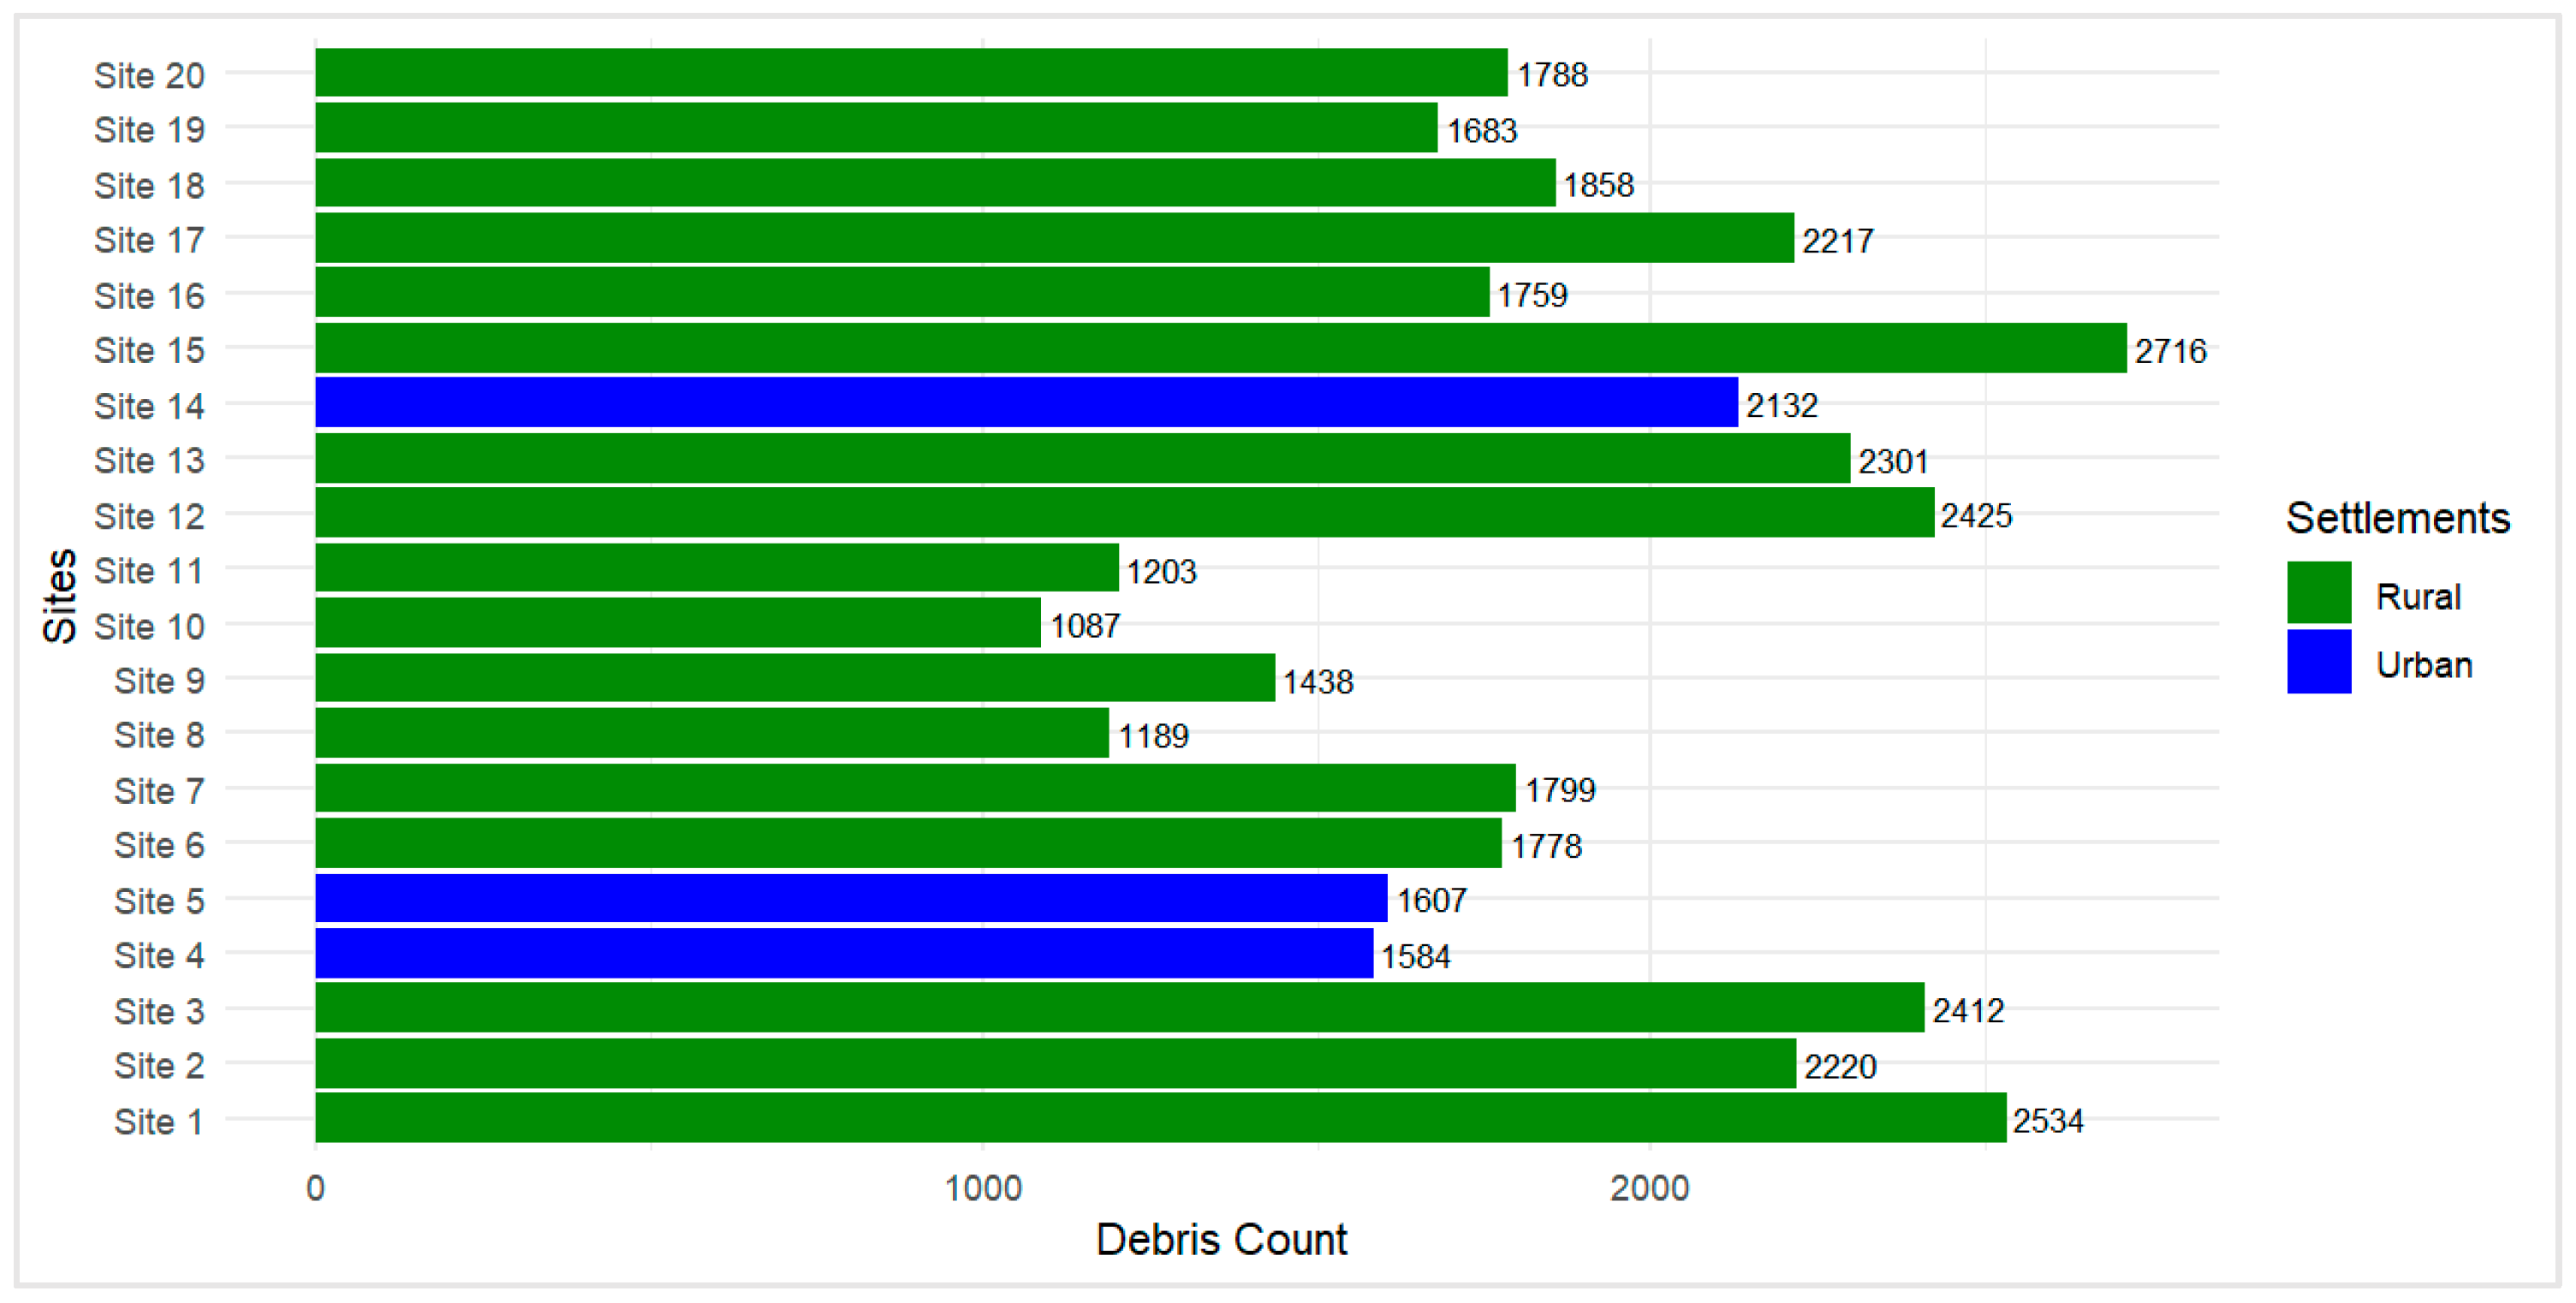
Disposable cutleries and tobacco-related debris showed notable differences between rural and urban areas, suggesting varying sources and disposal behaviours (Figure 5). Some floodplain transects of rural areas exhibited a prevalence of plastic comparable to or exceeding that of urban areas (Figure 6). The data revealed that Sites 1, 12, and 15 had the most significant contribution to plastic pollution. The identification of the three primary hotspots with the highest debris contribution revealed that all these sites were located in rural areas (Figure 6). There was no statistically significant difference found between rural and urban areas (V = 41, p = 0.19).
The boxplot analysis showed significant variations in the debris densities of rural and urban areas across floodplains and shorelines. Rural floodplains had higher densities of disposable cutleries, fragments, and packaging compared to urban floodplains. In contrast, shorelines exhibited consistent but lower densities, with rural shorelines showing higher densities of fishing debris and urban shorelines showing relatively higher densities of packaging and tobacco-related debris (Figure 5).

4.3. Correlation Between Urbanisation and Plastic-Packaged Product Availability in the Ganga River Basin Using Geospatial Technology

The analysis of nightlight intensity data from 2012 to 2020 shows significant urbanisation, with increased nightlight intensity indicating the growth of urban centres, expanded road networks, and rural areas transforming into urban and peri-urban landscapes.
An analysis revealed that the maximum radiance values increased significantly from 6.2 Nw/cm2/Sr in 2012 to 24.9 Nw/cm2/Sr in 2020. Concurrently, the spatial extent of highly illuminated regions, indicative of urban centres [49], expanded from 5.07 km2 to 23.6 km2, while medium- and low-lit areas, representing peri-urban and rural zones, grew from 6.8 km2 to 50.2 km2 and 17 km2 to 148 km2, respectively. This reflects an over 80% increase in artificial nighttime lighting, corresponding with substantial landscape changes and urbanisation trends. Newly illuminated areas in 2020, particularly along riverbanks, highlight evolving dynamics at the rural–urban interface (Figure 7). Interestingly, most of this urbanisation has happened along the river length. This also highlights the vulnerability of river floodplains to urbanisation and, thereby, the threats associated with it.

4.4. Variations Depend on Population Density

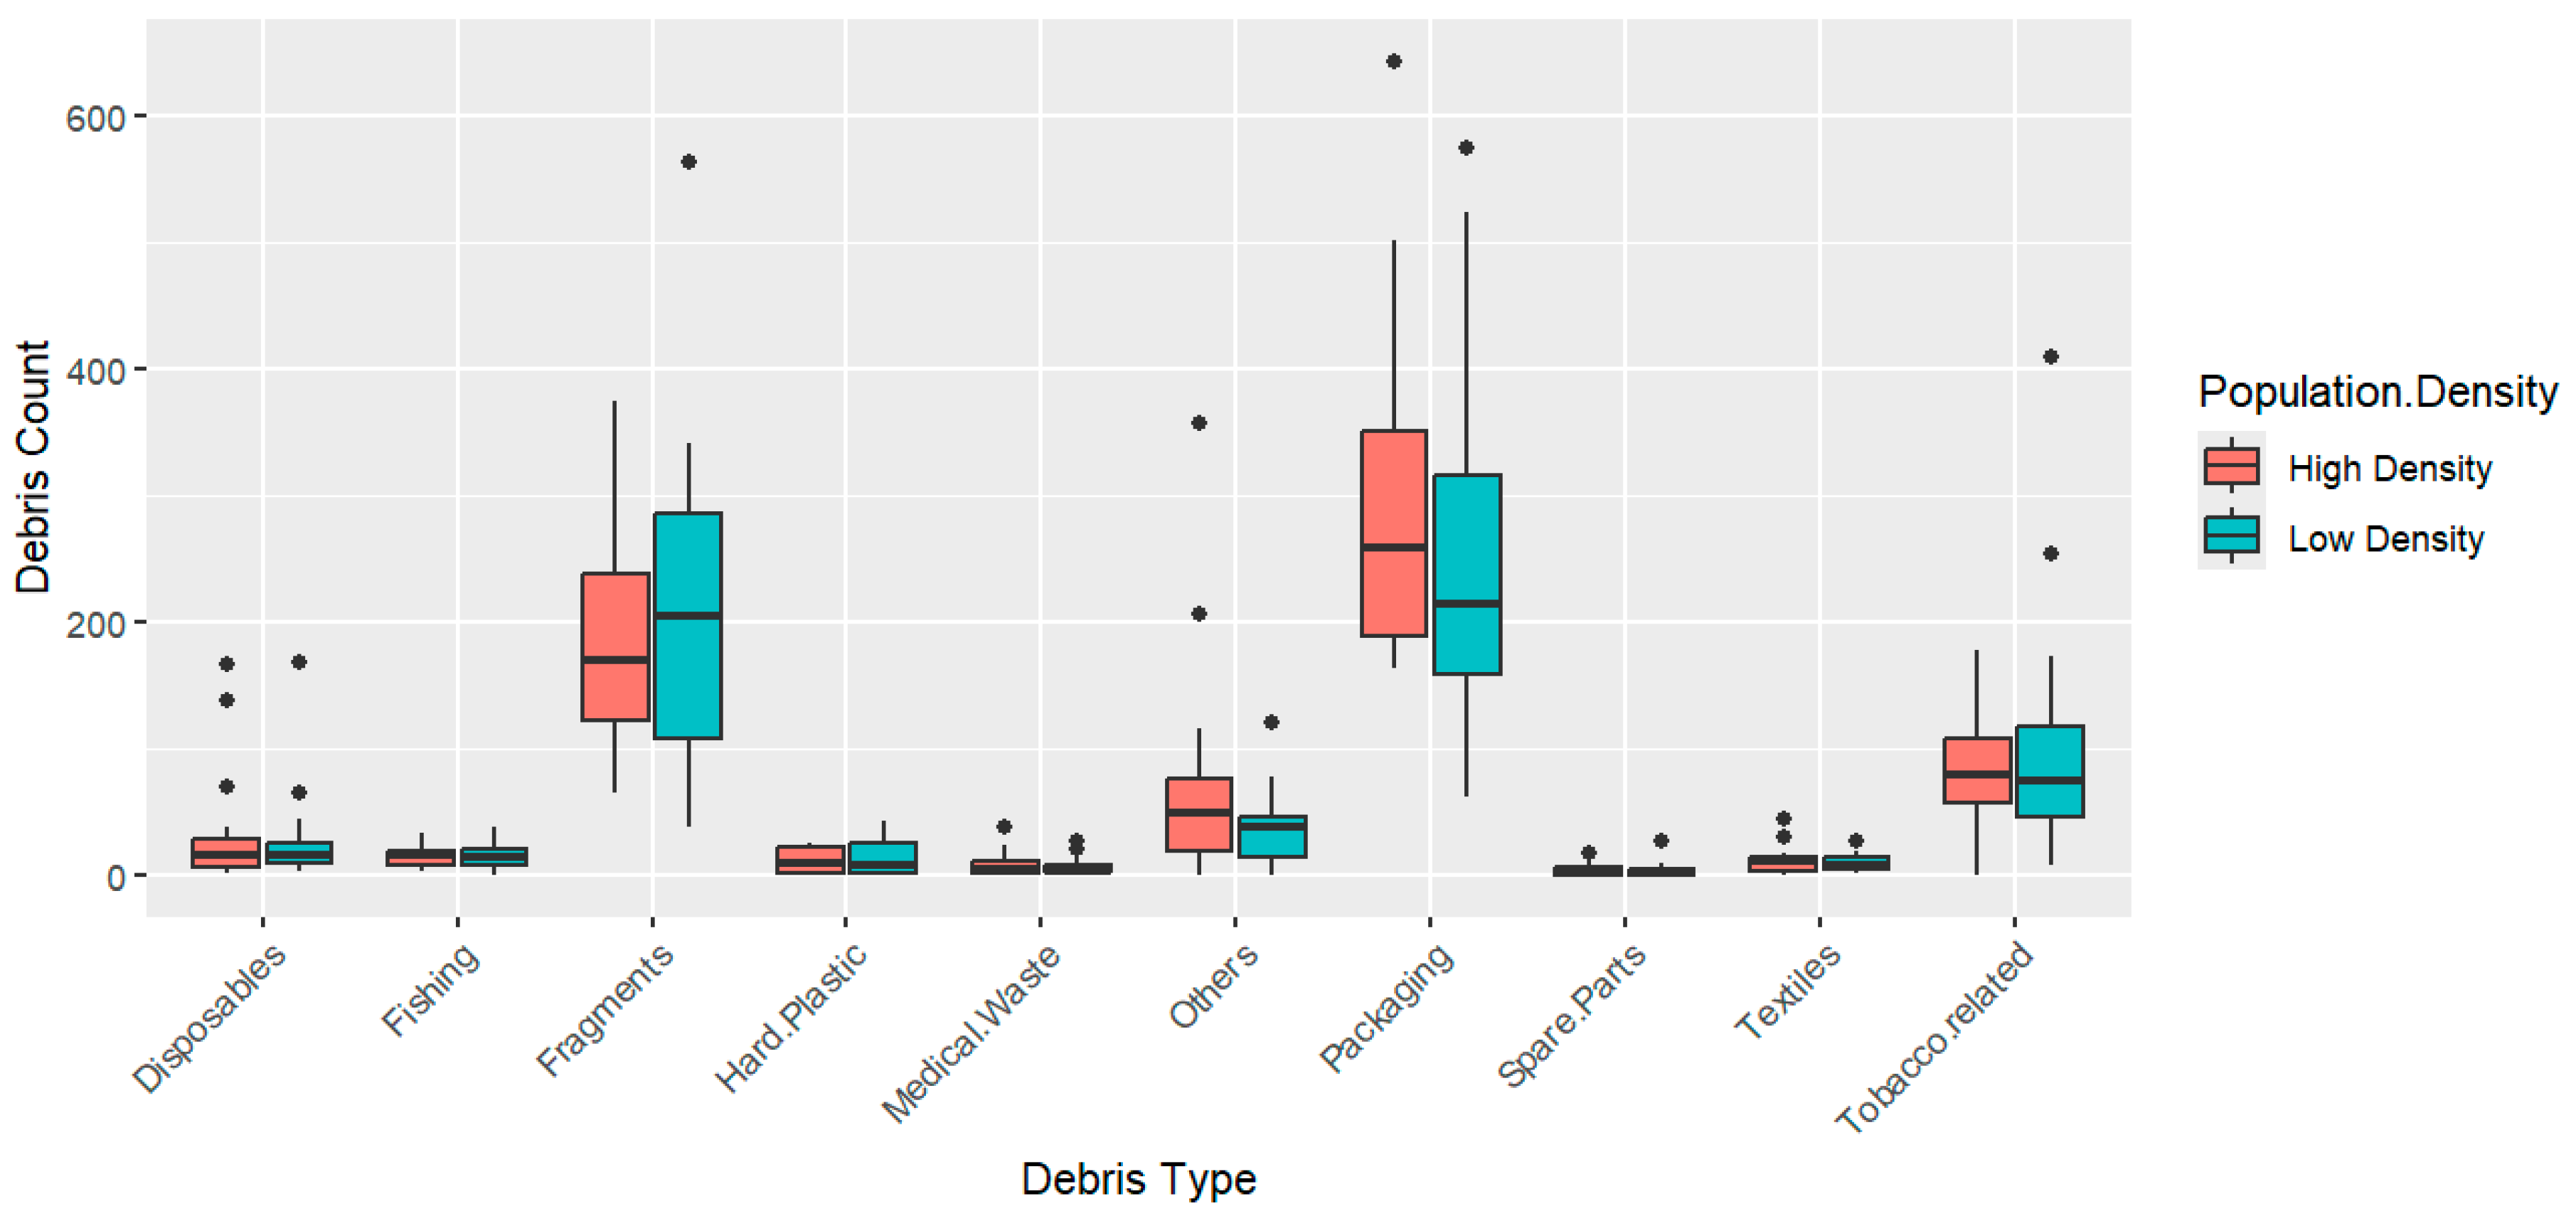
A total of 27,826 items of litter were recorded from the transects in floodplains. Of these, 14,820 items were recorded in high-population-density areas and 13,546 items in low-population-density areas. Packaging plastics were the predominant debris category, consistent with observations from river shoreline transects, comprising 52.03% in high-population-density areas and 48.66% in low-population-density areas of the total litter, with means of 3.7 ± 1.48 items m−2 and 3.47 ± 1.69 items m−2, respectively. Single-use plastic fragments accounted for 28.2% and 31.54% of the total litter, with means of 2.02 ± 0.88 items m−2 and 2.25 ± 1.33 items m−2, respectively (Figure 8) (Table S4). In high-density areas, debris such as fragments and others showed greater variability, while packaging debris was dominant in both high- and low-density areas. Low-density areas exhibited higher median counts for fragments.
However, there was no statistically significant difference found between debris densities from low-population-density and high-population-density sites in floodplains (Wilcoxon signed-rank V = 36, p-value = 0.43).

4.5. Seasonal Variations

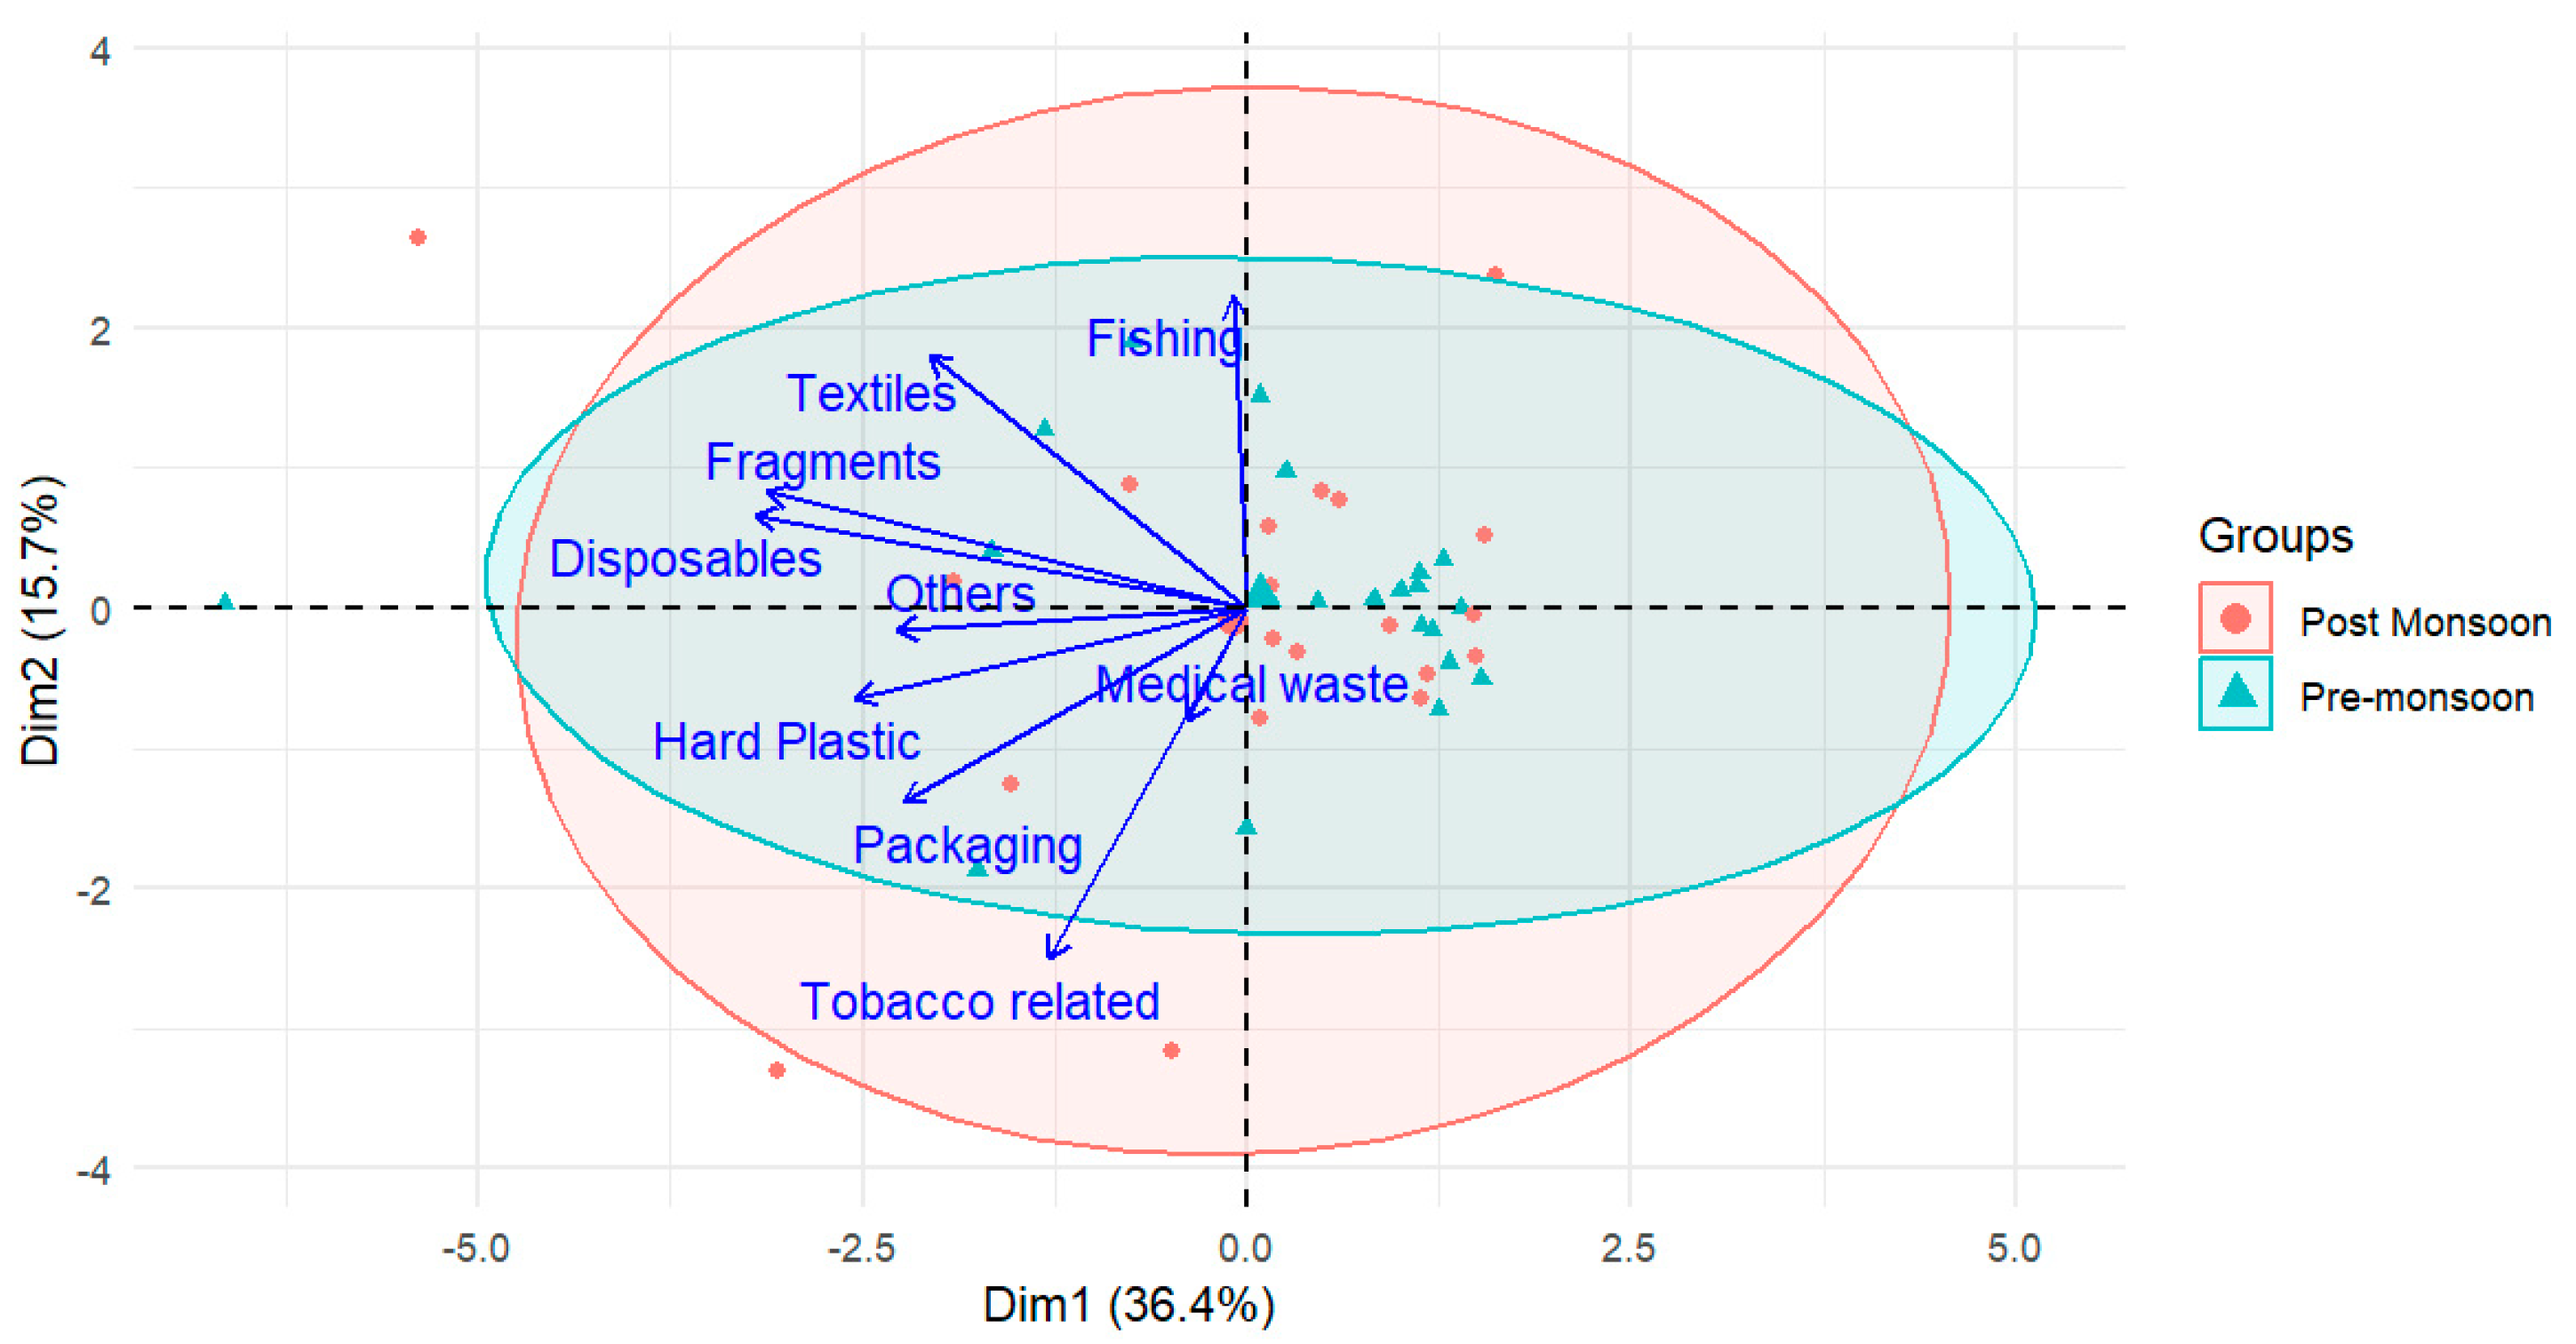
During the pre-monsoon interval in riverside transect 4386, debris items weighing 66 kg were recorded, whereas, in the post-monsoon phase, a total of 5518 debris items with a combined weight of 60.8 kg were retrieved. Packaging debris significantly contributed to the overall variability of debris types, as indicated by its prominent position along Dim1 (36.4% variance) (Figure 9). It emerged as the predominant litter category in both pre-monsoon and post-monsoon seasons, constituting 54.92% and 54.47% of the total quantities, respectively. The mean densities were 0.12 ± 0.1 items m−2 (pre-monsoon) and 0.15 ± 0.09 items m−2 (post-monsoon). This category exhibited a post-monsoon increase, as evidenced by the pronounced vector orientation towards post-monsoon data points, suggesting the augmented deposition and discharge of packaging debris due to monsoonal hydrological transport (Figure 9).
Tobacco-related debris accounted for 15.09% and 20.55% of the total quantities, with mean densities of 0.03 ± 0.05 items m−2 and 0.06 ± 0.12 items m−2, respectively (Table S5). Statistical analysis revealed no significant difference in debris density between the two seasons (V = 13, p = 0.30).
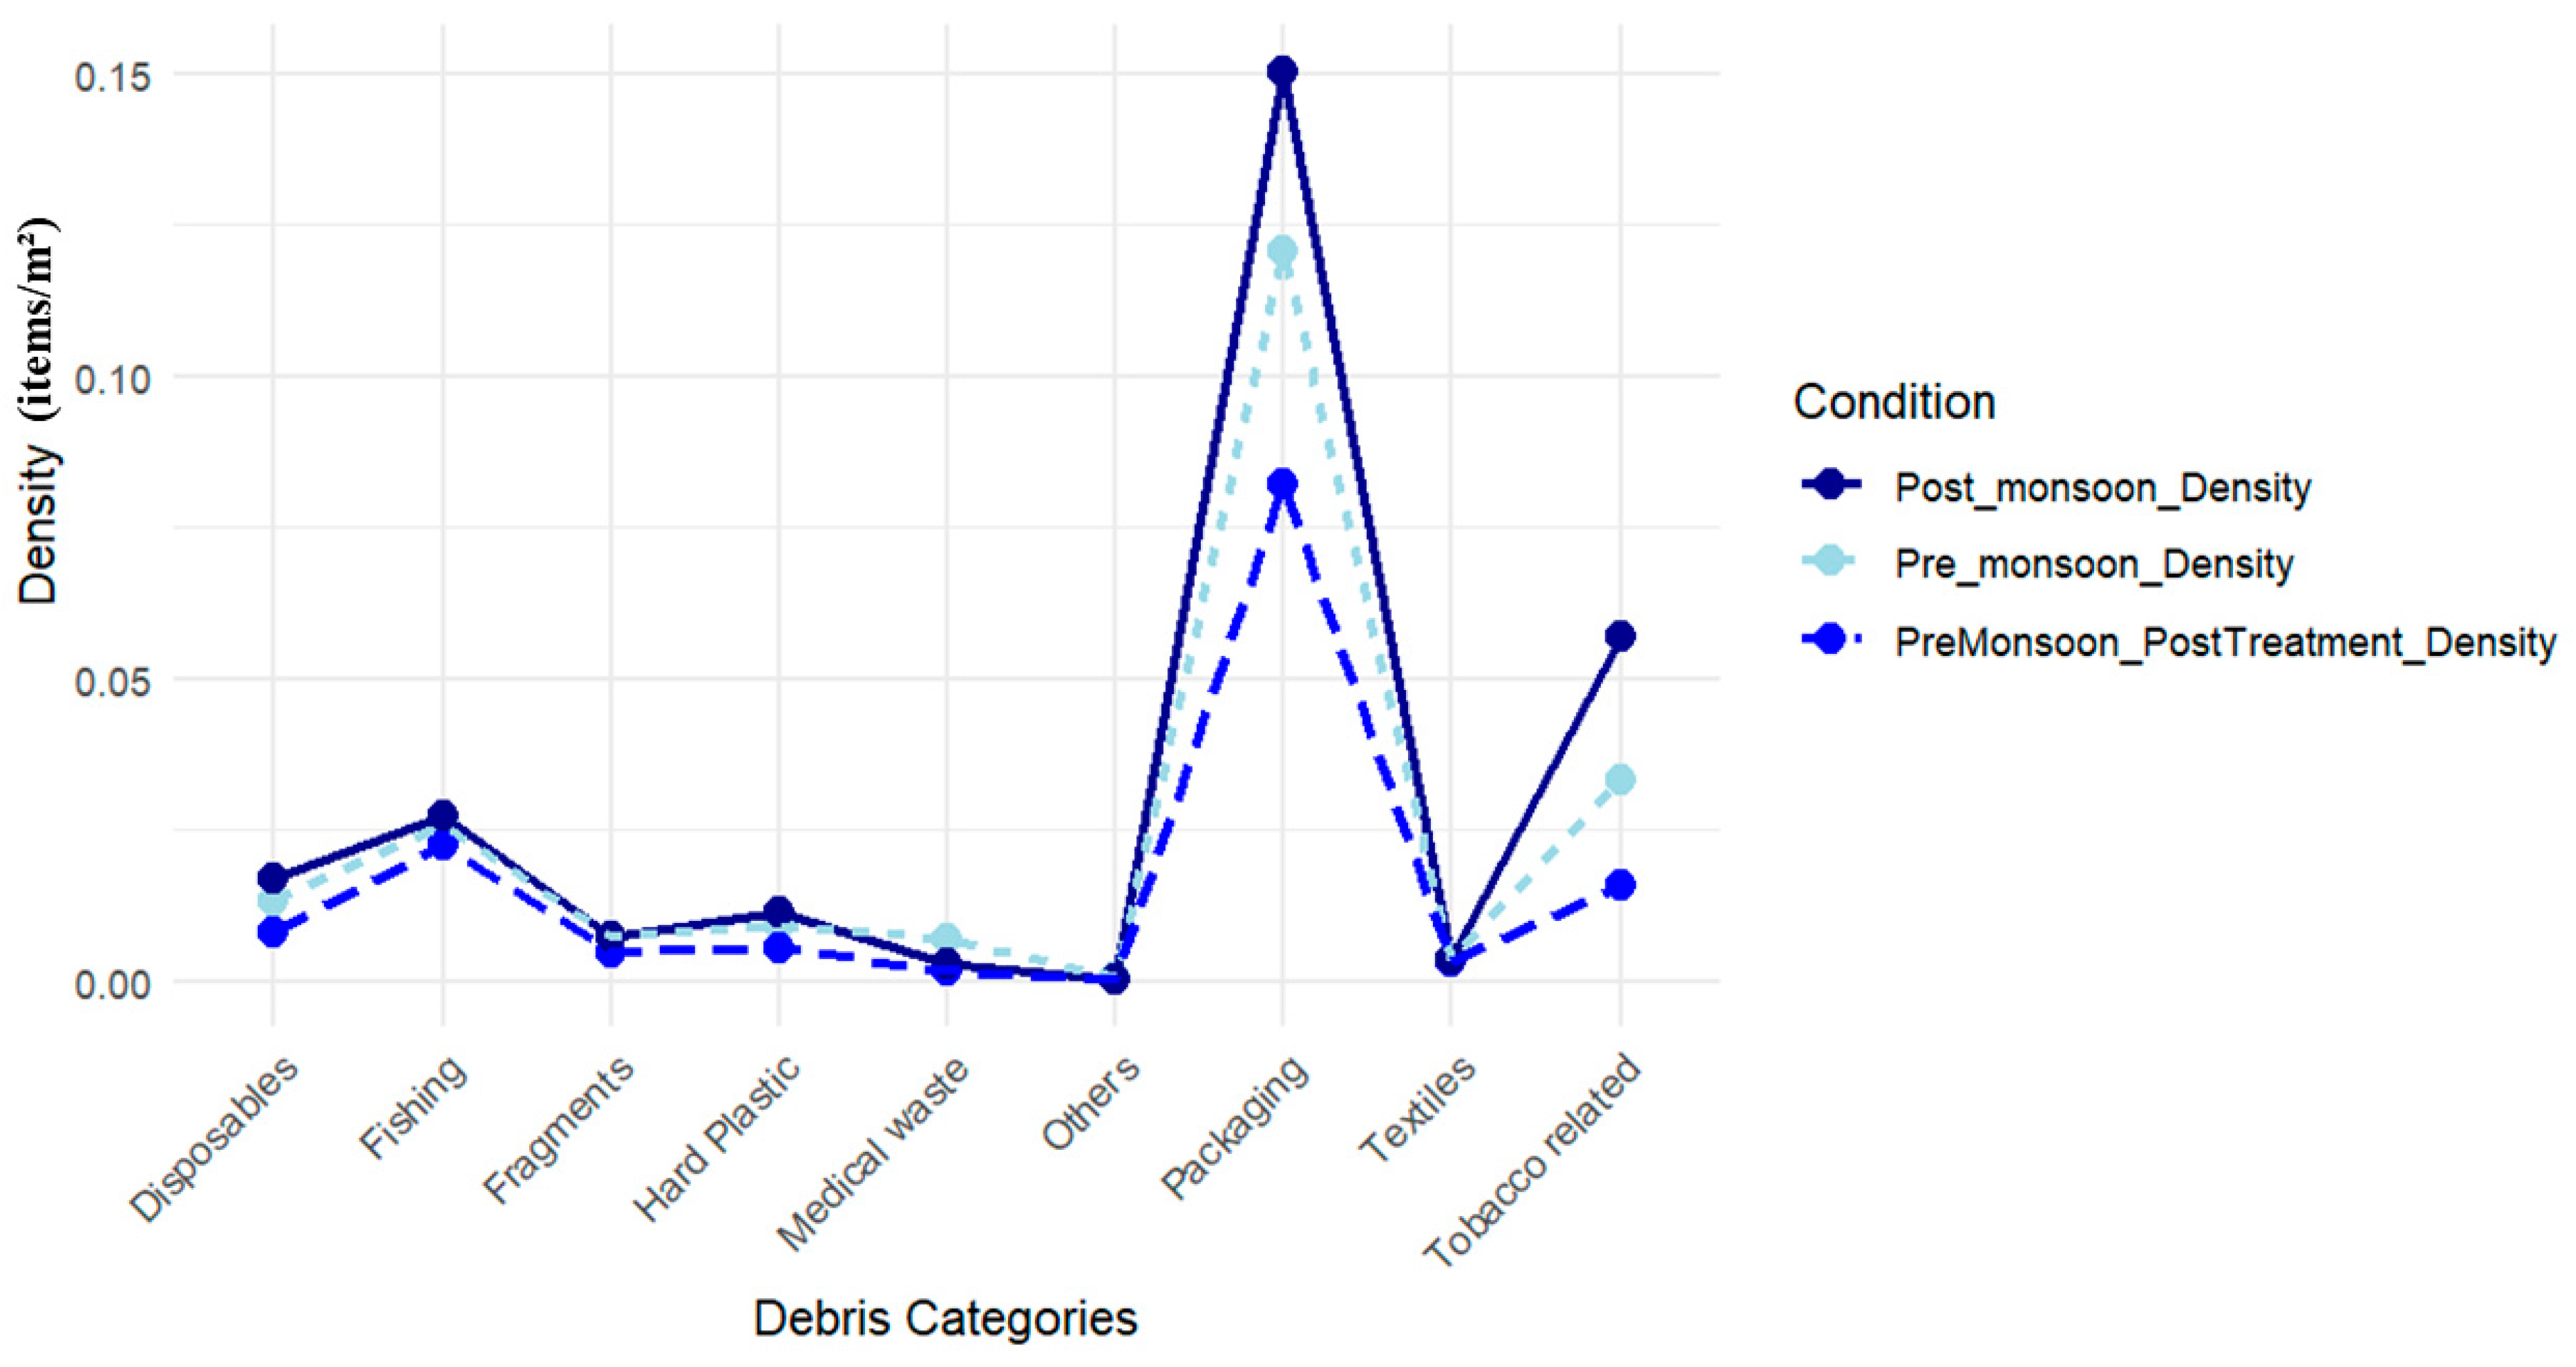
In contrast, the evaluation involving treatment sites (Site 1,5, 12, 17) using the Wilcoxon signed-rank exact test demonstrated a statistically significant difference (V = 1, p = 0.0078) in debris density between the two seasons after treatment (Figure 10). Post monsoon, debris density increased across all sizes, highlighting replenishment and replacement of waste due to flooding (Table S6).

4.6. Debris Distribution in High Biodiversity Zone

Thirteen transect sites (Site 2 to Site 14) (Figure 1) out of the twenty sampling sites were located within a 34 km stretch of High-Biodiversity Zone 5 [40], where 61% of the total debris was recorded (Table 1).
Packaging debris had the highest count, with 12,484 items, comprising 63.07% of the total packaging debris recorded in the study area. The mean density was 0.44 ± 0.13 items m−2, indicating significant variability in this category. Fragments comprised 61.97% (n = 5468) of the total fragment debris recorded, with a mean density of 0.19 ± 0.09 items m−2. Disposable cutleries accounted for 1229 items, comprising 68.89% of the total disposable debris recorded in the High-Biodiversity Zone, with a mean density of 0.04 ± 0.030 items m−2.
The data indicate that packaging debris was the most prevalent by count, followed by fragments and disposables. The fragments, primarily originating from the breakdown of packaging wrappers and hard plastics, pose a significant threat to wildlife, particularly in the High-Biodiversity Zone. These fragments, ranging in size from a few millimetres to several centimetres, are often ingested by aquatic species, leading to choking, internal injury, and even death. Disposables, including items like plastic cups, plates, and cutlery, further contribute to the pollution load. Additionally, the fishing gear and spare parts categories accounted for substantial portions of the total debris recorded in the High-Biodiversity Zone, underscoring the critical need for targeted interventions in these ecologically sensitive areas.

4.7. Ghost Fishing Gears

Fishing-related debris was consistently observed in both pre-monsoon and post-monsoon seasons, accounting for 11.76% and 9.9% of the total debris quantities, with mean densities of 0.03 ± 0.02 items m−2 and 0.03 ± 0.03 items m−2, respectively.
Moreover, fishing-related debris was notably prevalent within the High-Biodiversity Zone. In total, 72.93% of the total ghost fishing gear was observed in the High-Biodiversity Zone, with a mean density of 0.03 ± 0.02 items m−2. This high percentage highlights the substantial impact of local fishing practices on plastic pollution in ecologically sensitive areas.

5. Discussion

Our results show that human habitations in river floodplains generate more waste than shorelines (Figure 3 and Figure 4; Tables S1 and S2). The accumulation of litter in floodplains, coupled with inadequate waste management, suggests the likelihood of the discharge of a substantial percentage of debris into rivers during post-monsoon floods. The high density of debris in floodplains can also be attributed to the easy accessibility of plastic-packaged products and the lack of affordable alternatives for daily purchases (such as shampoo and detergent sachets). This may amplify reliance on single-use plastics, accentuating their prevalence and accumulation in the study area with no difference in urban and rural settings [29]. Conversely, river shoreline transects exhibited significantly lower litter densities, as their close proximity to the river leads to direct leakage into the river. Packaging-related debris remained the predominant category in both sampling groups, consistently persisting in its prevalence. This observed pattern may be associated with the increased use of plastic-packaged products linked to increased availability and accessibility due to the urbanisation of rural regions [50]. The limited ability of lower-income populations to purchase goods in bulk, resulting in the reliance on single-use sachets for daily necessities, significantly contributes to increased plastic waste generation from non-recyclable packaging. These findings align with the findings of Jambeck et al. (2015) [24] and Lebreton et al. (2017) [13], who identified plastic packaging as a major component of marine and riverine debris. Geyer et al. (2017) found that it constitutes nearly half of global plastic waste [3]. Youngblood et al. (2022) highlighted that increased rural access to plastic-packaged products exacerbates this issue, necessitating advanced waste management strategies [50].
Interestingly, both urban and rural areas displayed comparable litter prevalence overall (Figure 5; Table S3), and this pattern persisted when examining high- and low-population-density areas within both urban and rural settings separately (Figure 8; Table S4). Urban areas are generally perceived to harbour more litter than rural areas; however, the higher levels of debris observed in rural areas compared to urban areas can be attributed to the presence of waste collection facilities in urban areas and the lack of adequate waste management infrastructure in rural areas [51] Marais & Armitage. Urban centres benefit from municipal waste collection services, which facilitate regular waste removal and processing, whereas rural communities often lack structured waste segregation, recycling, and disposal mechanisms. Consequently, waste is frequently disposed of in open areas, burned, or directly discharged into river systems, contributing to environmental pollution. Additionally, cultural and religious practices conducted along riverbanks further exacerbate debris accumulation, as offerings and ritual materials, often encased in plastic, enter aquatic ecosystems.
The analysis of nightlight intensity data from 2012 to 2020 revealed significant urbanisation, evidenced by increased luminance indicating the expansion of urban centres, road networks, and the transformation of rural areas, especially close to the riparian zone (Figure 7). The observed luminance variations reflect substantial landscape changes and urbanisation trends, correlating with the increased availability of plastic-packaged products in rural areas due to economic factors and limited alternatives [50]. The predominance of packaging waste and fragments among recorded debris supports urbanisation and leads to lifestyle changes, increased consumption of plastic-packaged goods, and significant environmental impacts in freshwater ecosystems, necessitating comprehensive waste management strategies [52].
Our analysis revealed no statistically significant difference in debris densities between pre- and post-monsoon along identical transects before treatment (Figure 9; Table S5). However, a significant difference emerged when considering treatment sites (Figure 10; Table S6). This difference is attributed to the replacement of debris due to flood impacts in the floodplains. This finding suggests a dynamic cycling of debris items within the surveyed aggregation pathways, likely resulting from the replenishment or renewal of debris, processes of deposition, and gradual displacement [53]. Additionally, the substitution of plastic debris for newly generated litter is influenced by monsoon-induced floods, which are characteristic of the region [33]. The multifaceted impact of floods on plastic pollution in rivers introduces additional plastics into the river and contributes to the increased entrapment of plastics in riparian vegetation and their deposition on shorelines [33,54,55,56]. Although we acknowledge that this accumulation level observed represents an approximation, extrapolating from the findings of the surveyed stretch, the estimation suggests that the river in Sahibganj harbours more than 0.37 million pieces of waste along its shoreline [14].
The fluctuations in the quantification of plastic debris primarily stem from two influential factors: seasonal inundations in nearby villages that facilitate the discharge and removal/replacement of debris and the river’s role in transporting a substantial volume of waste from upstream to downstream regions [53,55]. These findings underline the widespread presence of plastic litter in diverse environments and the significance of comprehending the dynamics of litter accumulation, particularly in the post-monsoon period [57].
The debris prevalence along the intersecting channels (Site 1,4,18,19) of the Ganga River suggests that the potential reciprocal transport of plastic waste between the Udhwa Bird Sanctuary (a wetland) (Figure 1) and the river poses a notable ecological hazard to the Protected Area’s (PA) migratory and resident bird habitats [58]. Additionally, it underscores the impact of local tourism in amplifying plastic waste discharge into the river through the connecting channel near the wetland. The findings also indicate the contribution of plastic waste to the river from communities not only residing in the immediate vicinity of the Ganga River but also from those situated farther away through various channels such as canals.
The predominance of packaging debris (43%) and plastic fragments (21%) in the total observed debris highlights the escalating ecological threat posed by plastic pollution to freshwater biota. Both physical effects, such as entanglement in meso- and macroplastic debris, and chemical effects, including the release of toxic additives and sorbed contaminants, compromise organismal health [59]. As plastic degrades, it yields microplastics that heighten ingestion risks for aquatic organisms, leading to gastrointestinal obstructions, abrasions, and metabolic stress [19,60]. The bioaccumulation of microplastics in zooplankton, benthic invertebrates, and fish disrupts trophic interactions, propagating adverse effects throughout the aquatic food web [17,59,60,61,62]. Furthermore, the high prevalence of disposable plastics contributes to habitat degradation by altering sediment composition and impeding oxygen exchange, thereby exacerbating ecological threats [62].
The substantial presence of ghost fishing gear (72.9% of the total observed fishing-related debris) in the High-Biodiversity Zone heightens the risk of entanglement for apex species such as the Gangetic dolphin and smooth-coated otter [19,39]. These synthetic pollutants also serve as vectors for hydrophobic contaminants, intensifying toxicological risks through bioaccumulation [63].
Implementing targeted mitigation strategies, such as net recycling and upcycling initiatives, is imperative to curtail fishery-derived plastic pollution and safeguard the ecological integrity of these critical freshwater ecosystems [19,64,65]. Encouraging fishing communities to adopt sustainable waste management practices can mitigate the direct discharge of plastic waste into aquatic systems.
The study demonstrates that, owing to the absence of waste management facilities within the study area, a significant proportion of waste is possibly introduced into the riverine system. This occurs either via improper disposal practices or as a consequence of discharge precipitated by flash flood events during the monsoon season. These measures should be complemented by robust policy frameworks that enforce regulations on plastic waste disposal and promote public awareness campaigns to educate stakeholders about the impacts of plastic pollution. The integration of technological advancements in plastic waste tackling can also augment the efficiency of these strategies.
These findings highlight the need for robust waste management strategies that are tailored for both geographic regions (shorelines and floodplains) and community types (rural and urban). Notably, while major debris research often focuses on urban areas, our study also highlights the importance of addressing litter issues in rural areas. Understanding these nuances is crucial for effective waste management and litter reduction strategies. In response to this, the Plastic Waste Management Amendment Rules, 2021, specifically aim to mitigate the adverse environmental impacts of discarded single-use plastic items on terrestrial, aquatic, and marine ecosystems [66]. Effective from 1 July 2022, these regulations ban identified single-use plastic products, emphasising those with minimal utility and a high likelihood of becoming litter [66]. Despite their enactment, the practical implementation of these rules faces significant challenges, particularly in ensuring compliance at the ground level and promoting widespread behavioural change among the population. Legislation targeting specific litter sources, such as finding alternative packaging options and banning single-use plastic items, has shown promise in reducing litter abundance [67]. Further legislative actions, such as recent bans on single-use plastic in India [66], signal progress toward mitigating plastic pollution. However, the effectiveness of such measures depends on factors that include the enforcement of legislation and public awareness. To further bolster these efforts, the adoption of Extended Producer Responsibility (EPR) frameworks is imperative. EPR policies have been shown to substantially decrease plastic packaging waste by incentivising sustainable design, improving collection and recycling systems, and motivating producers to reduce waste generation through economic mechanisms [68]. This strategy facilitates the transition to a circular economy, promoting the reuse and recycling of plastic packaging, thereby minimising environmental impact.

Conclusions and Recommendations

Despite India’s relatively modest plastic production, inadequate waste management systems—particularly in rural and floodplain regions—remain a critical driver of plastic pollution in marine and riverine environments. The Ganga River, with its pervasive packaging and single-use plastic debris, exemplifies this escalating crisis, which is compounded by limited affordable alternatives, low environmental awareness, and rapid population growth. Such conditions intensify the risk of environmental degradation, threatening aquatic biodiversity, ecosystem services, and the socioeconomic well-being of dependent communities, particularly those in rural areas.
To address this multifaceted challenge, robust infrastructure and governance mechanisms must be established. Emphasis should be placed on waste segregation, regular collection, and treatment in both rural and urban areas, coupled with policy instruments such as Extended Producer Responsibility (EPR) and plastic taxation. Moreover, community-driven solutions—including awareness campaigns and financial incentives—are crucial for achieving sustainable outcomes. Strengthening research and innovation on plastic pollution and its movement through aquatic systems using advanced hydrological modelling and the development of biodegradable materials will guide evidence-based policy and adaptive management.
Priority measures to mitigate plastic pollution in the river basins are summarised in Table 2 integrating urgency (based on the impact on climate/freshwater ecosystems and practical feasibility) with timescale (based on financial requirements and implementation horizon). By adhering to these recommendations, stakeholders can bridge urban–rural disparities, safeguard freshwater ecosystems, and foster long-term environmental resilience.
Key: Urgency and Timescale Definitions
  • Urgency (based on the impact on climate/freshwater ecosystems and practical feasibility):
    1—High priority: immediate action is critical to avoid severe ecological damage and to leverage existing feasibility.
    2—Moderate priority: important for long-term ecosystem health, may require incremental policy changes or stakeholder alignment.
    3—Low priority: less immediate ecological threat, or substantial feasibility constraints.
  • Timescale (based on financial requirements and time needed for implementation):
    A—Short term (1–2 years): lower financial outlay; can be implemented relatively quickly.
    B—Medium term (3–5 years): moderate to significant financial investment; requires phased planning and stakeholder coordination.
    C—Long term (5+ years): high capital investment and/or major policy integration needed.

Supplementary Materials

The following supporting information can be downloaded at: https://www.mdpi.com/article/10.3390/su17114932/s1, Table S1: Debris Distribution in Shorelines along with top 3 categories contribution; Table S2: Debris Distribution in Floodplains along with top 3 categories contribution; Table S3: Variation of debris distribution: Rural vs. Urban; Table S4: Variation of debris distribution: High Population Density Areas (HPDA) Vs. Low Population Density Areas (LPDA); Table S5: Seasonal Variation in debris distribution along the river: Pre-monsoon (PrM) vs. post-monsoon (PoM); Table S6: Seasonal Variation after treatment in Debris densities and impact of floods: Pre-monsoon vs. Post-monsoon.

Author Contributions

E.S.: Conceptualisation, Methodology, Investigation, Data Curation Formal analysis, Data Visualisation, Writing—original draft, Writing—review and editing. A.R.: Formal Analysis, Writing—review and editing. P.D.: Writing—review and editing. S.B.: Writing—review and editing. H.K.: Conceptualisation, Supervision, Methodology, Writing—review and editing. S.A.H.: Project Administration, Funding acquisition, Resources, Conceptualisation, Supervision, Writing—review and editing. R.B.: Project Administration, Funding acquisition, Resources, Conceptualisation, Supervision, Methodology, Writing—review and editing. All authors have read and agreed to the published version of the manuscript.

Funding

National Mission for Clean Ganga (NMCG), Ministry of Jal Shakti, Government of India, under grant number B-03/2015-16/1077/NMCG—NEW PROPOSAL.

Institutional Review Board Statement

Not applicable.

Informed Consent Statement

Not applicable.

Data Availability Statement

The data supporting the figures in this paper and other findings of this study are available from the corresponding author upon request.

Acknowledgments

We extend our gratitude to the National Mission Clean Ganga (NMCG) for funding support. Special thanks to the forest department and district administration of Sahibganj, Jharkhand, and to the Wildlife Institute of India for their support. Koldewey’s work is funded by the Bertarelli Foundation. Our sincere appreciation also goes to Rajesh Kumar and Santosh Kumar Mandal for their dedicated support, and to community volunteers Lalan Kumar Mandal, Barun Kumar Mandal, and Rakesh Kumar for their assistance during fieldwork.

Conflicts of Interest

The authors declare that they have no known competing financial interests or personal relationships that could have appeared to influence the work reported in this paper.

References

  1. Bodor, A.; Feigl, G.; Kolossa, B.; Mészáros, E.; Laczi, K.; Kovács, E.; Perei, K.; Rákhely, G. Soils in distress: The impacts and ecological risks of (micro) plastic pollution in the terrestrial environment. Ecotoxicol. Environ. Saf. 2024, 269, 115807. [Google Scholar] [CrossRef] [PubMed]
  2. Free, C.M.; Jensen, O.P.; Mason, S.A.; Eriksen, M.; Williamson, N.J.; Boldgiv, B. High-levels of microplastic pollution in a large, remote, mountain lake. Mar. Pollut. Bull. 2014, 85, 156–163. [Google Scholar] [CrossRef]
  3. Geyer, R.; Jambeck, J.R.; Law, K.L. Production, use, and fate of all plastics ever made. Sci. Adv. 2017, 3, e1700782. [Google Scholar] [CrossRef] [PubMed]
  4. Obbard, R.W.; Sadri, S.; Wong, Y.Q.; Khitun, A.A.; Baker, I.; Thompson, R.C. Global warming releases microplastic legacy frozen in Arctic Sea ice. Earth’s Future 2014, 2, 315–320. [Google Scholar] [CrossRef]
  5. Waller, C.L.; Griffiths, H.J.; Waluda, C.M.; Thorpe, S.E.; Loaiza, I.; Moreno, B.; Pacherres, C.O.; Hughes, K.A. Microplastics in the Antarctic marine system: An emerging area of research. Sci. Total Environ. 2017, 598, 220–227. [Google Scholar] [CrossRef]
  6. Carpenter, E.J.; Smith, K.L., Jr. Plastics on the Sargasso Sea surface. Science 1972, 175, 1240–1241. [Google Scholar] [CrossRef] [PubMed]
  7. Goldstein, M.C.; Rosenberg, M.; Cheng, L. Increased oceanic microplastic debris enhances oviposition in an endemic pelagic insect. Biol. Lett. 2012, 8, 817–820. [Google Scholar] [CrossRef]
  8. Law, K.L.; Morét-Ferguson, S.; Maximenko, N.A.; Proskurowski, G.; Peacock, E.E.; Hafner, J.; Reddy, C.M. Plastic accumulation in the North Atlantic subtropical gyre. Science 2010, 329, 1185–1188. [Google Scholar] [CrossRef]
  9. Lebreton, L.; Slat, B.; Ferrari, F.; Sainte-Rose, B.; Aitken, J.; Marthouse, R.; Hajbane, S.; Cunsolo, S.; Schwarz, A.; Levivier, A.; et al. Evidence that the Great Pacific Garbage Patch is rapidly accumulating plastic. Sci. Rep. 2018, 8, 4666. [Google Scholar] [CrossRef]
  10. Thompson, R.C.; Olsen, Y.; Mitchell, R.P.; Davis, A.; Rowland, S.J.; John, A.W.; McGonigle, D.; Russell, A.E. Lost at sea: Where is all the plastic? Science 2004, 304, 838. [Google Scholar] [CrossRef]
  11. Blettler, M.C.M.; Garello, N.; Ginon, L.; Abrial, E.; Espinola, L.A.; Wantzen, K.M. Massive plastic pollution in a mega-river of a developing country: Sediment deposition and ingestion by fish (Prochilodus lineatus). Environ. Pollut. 2019, 255, 113348. [Google Scholar] [CrossRef]
  12. Blettler, M.C.; Abrial, E.; Khan, F.R.; Sivri, N.; Espinola, L.A. Freshwater plastic pollution: Recognizing research biases and identifying knowledge gaps. Water Res. 2018, 143, 416–424. [Google Scholar] [CrossRef]
  13. Lebreton, L.C.M.; Van Der Zwet, J.; Damsteeg, J.W.; Slat, B.; Andrady, A.; Reisser, J. River plastic emissions to the world’s oceans. Nat. Commun. 2017, 8, 15611. [Google Scholar] [CrossRef] [PubMed]
  14. Owens, K.A.; Kamil, P.I. Adapting Coastal Collection Methods for River Assessment to Increase Data on Global Plastic Pollution: Examples from India and Indonesia. Front. Environ. Sci. 2020, 7, 208. [Google Scholar] [CrossRef]
  15. Schmidt, C.; Krauth, T.; Wagner, S. Export of Plastic Debris by Rivers into the Sea. Environ. Sci. Technol. 2017, 51, 12246–12253. [Google Scholar] [CrossRef] [PubMed]
  16. Cole, M.; Lindeque, P.; Halsband, C.; Galloway, T.S. Microplastics as contaminants in the marine environment: A review. Mar. Pollut. Bull. 2011, 62, 2588–2597. [Google Scholar] [CrossRef]
  17. Azevedo-Santos, V.M.; Brito, M.F.; Manoel, P.S.; Perroca, J.F.; Rodrigues-Filho, J.L.; Paschoal, L.R.; Gonçalves, G.R.L.; Wolf, M.R.; Blettler, M.C.M.; Andrade, M.C.; et al. Plastic pollution: A focus on freshwater biodiversity. Ambio 2021, 50, 1313–1324. [Google Scholar] [CrossRef]
  18. Lestari, P.; Trihadiningrum, Y. The impact of improper solid waste management to plastic pollution in Indonesian coast and marine environment. Mar. Pollut. Bull. 2019, 149, 110505. [Google Scholar] [CrossRef]
  19. Nelms, S.E.; Duncan, E.M.; Patel, S.; Badola, R.; Bhola, S.; Chakma, S.; Chowdhury, G.W.; Godley, B.J.; Haque, A.B.; Johnson, J.A.; et al. Riverine plastic pollution from fisheries: Insights from the Ganges River system. Sci. Total Environ. 2021, 756, 143305. [Google Scholar] [CrossRef]
  20. Rochman, C.M.; Tahir, A.; Williams, S.L.; Baxa, D.V.; Lam, R.; Miller, J.T.; Teh, F.-C.; Werorilangi, S.; Teh, S.J. Anthropogenic debris in seafood: Plastic debris and fibers from textiles in fish and bivalves sold for human consumption. Sci. Rep. 2015, 5, 14340. [Google Scholar] [CrossRef]
  21. Roman, L.; Schuyler, Q.; Wilcox, C.; Hardesty, B.D. Plastic pollution is killing marine megafauna, but how do we prioritize policies to reduce mortality? Conserv. Lett. 2021, 14, e12781. [Google Scholar] [CrossRef]
  22. Wright, S.L.; Kelly, F.J. Threat to human health from environmental plastics. BMJ 2017, 358, j4334. [Google Scholar] [CrossRef] [PubMed]
  23. Hubacek, K.; Guan, D.; Barua, A. Changing lifestyles and consumption patterns in developing countries: A scenario analysis for China and India. Futures 2007, 39, 1084–1096. [Google Scholar] [CrossRef]
  24. Jambeck, J.R.; Geyer, R.; Wilcox, C.; Siegler, T.R.; Perryman, M.; Andrady, A.; Narayan, R.; Law, K.L. Plastic waste inputs from land into the ocean. Science 2015, 347, 768–771. [Google Scholar] [CrossRef]
  25. Rafey, A.; Siddiqui, F.Z. A review of plastic waste management in India—Challenges and opportunities. Int. J. Environ. Anal. Chem. 2023, 103, 3971–3987. [Google Scholar] [CrossRef]
  26. Chandramouli, C.; General, R. Census of India 2011; Provisional Population Totals; Government of India: New Delhi, India, 2021; pp. 409–413. [Google Scholar]
  27. Apostol, L.; Mihai, F.C. Rural waste management: Challenges and issues in Romania. Present Environ. Sustain. Dev. 2012, 105–114. [Google Scholar] [CrossRef]
  28. Khan, F.R.; Mayoma, B.S.; Biginagwa, F.J.; Syberg, K. Microplastics in inland African waters: Presence, sources, and fate. In Freshwater Microplastics: Emerging Environmental Contaminants? Springer Nature: London, UK, 2018; pp. 101–124. [Google Scholar]
  29. Mihai, F.C.; Gündoğdu, S.; Markley, L.A.; Olivelli, A.; Khan, F.R.; Gwinnett, C.; Gutberlet, J.; Reyna-Bensusan, N.; Llanquileo-Melgarejo, P.; Meidiana, C.; et al. Plastic pollution, waste management issues, and circular economy opportunities in rural communities. Sustainability 2021, 14, 20. [Google Scholar] [CrossRef]
  30. Nxumalo, S.M.; Mabaso, S.D.; Mamba, S.F.; Singwane, S.S. Plastic waste management practices in the rural areas of Eswatini. Soc. Sci. Humanit. Open 2020, 2, 100066. [Google Scholar] [CrossRef]
  31. Gasperi, J.; Dris, R.; Bonin, T.; Rocher, V.; Tassin, B. Assessment of floating plastic debris in surface water along the Seine River. Environ. Pollut. 2014, 195, 163–166. [Google Scholar] [CrossRef]
  32. Hurley, R.R.; Woodward, J.C.; Rothwell, J.J. Ingestion of microplastics by freshwater tubifex worms. Environ. Sci. Technol. 2017, 51, 12844–12851. [Google Scholar] [CrossRef]
  33. Sinha, R.; Mohanta, H.; Jain, V.; Tandon, S.K. Geomorphic diversity as a river management tool and its application to the Ganga River, India. River Res. Appl. 2017, 33, 1156–1176. [Google Scholar] [CrossRef]
  34. Kaza, S.; Yao, L.; Bhada-Tata, P.; Van Woerden, F. What a WASTE 2.0: A global Snapshot of Solid Waste Management to 2050; World Bank Publications: Washington, DC, USA, 2018. [Google Scholar]
  35. Schneider, F.; Parsons, S.; Clift, S.; Stolte, A.; McManus, M.C. Collected marine litter—A growing waste challenge. Mar. Pollut. Bull. 2018, 128, 162–174. [Google Scholar] [CrossRef]
  36. Sanghi, R.; Kaushal, N. Introduction to our national river Ganga via cmaps. In Our National River Ganga: Lifeline of Millions; Springer Nature: London, UK, 2014; pp. 3–44. [Google Scholar]
  37. Nomani, M.Z.M.; Salahuddin, G.H.A.Z.A.L. River health assessment of Ganga basin in India: A comparative perspective. Pollut. Res. 2020, 39, S266–S271. [Google Scholar]
  38. Shukla, A.K.; Ojha, C.S.P.; Garg, R.D.; Shukla, S.; Pal, L. Influence of spatial urbanization on hydrological components of the Upper Ganga River Basin, India. J. Hazard. Toxic Radioact. Waste 2020, 24, 04020028. [Google Scholar] [CrossRef]
  39. Das, G.C.; Sharma, S.P.; Ali, S.Z.; Gawan, S.; Usmani, A.A.; Sarkar, A.; Katdare, S.; Rawat, A.; Gangaimaran, P.; Panda, A.K.; et al. Prioritising river stretches using multi-modelling habitat suitability of Gangetic dolphin (Platanista gangetica) as a flagship species for aquatic biodiversity conservation in the Ganga River Basin, India. Ecol. Indic. 2022, 145, 109680. [Google Scholar] [CrossRef]
  40. WII-NMCG. Biodiversity Profile of the River: Planning Aquatic Species Restoration for Ganga River; Wildlife Institute of India: Dehradun, India, 2019; p. 223.
  41. Esri. ArcGIS, Version 10.6.1; Computer Software. 2020. Available online: https://www.esri.com/ (accessed on 26 October 2023).
  42. Office of the Registrar General Census Commissioner, India. Census of India 2001; Ministry of Home Affairs, Government of India: New Delhi, India, 2001. Available online: http://censusindia.gov.in/ (accessed on 30 October 2023).
  43. Wildlife Institute of India (WII) ENVIS Centre. Protected Area Network in India. 2022. Available online: https://wiienvis.nic.in/Database/Protected_Area_854.aspx (accessed on 24 February 2025).
  44. Kumar, R.; Sharma, P.; Manna, C.; Jain, M. Abundance, interaction, ingestion, ecological concerns, and mitigation policies of microplastic pollution in riverine ecosystem: A review. Sci. Total Environ. 2021, 782, 146695. [Google Scholar] [CrossRef]
  45. Opfer, S.; Arthur, C.; Lippiatt, S. NOAA Marine Debris Shoreline Survey Field Guide; NOAA Marine Debris Program: Silver Spring, MD, USA, 2012.
  46. ESRI. ArcGIS Desktop: Release 10; Environmental Systems Research Institute: Redlands, CA, USA, 2011. [Google Scholar]
  47. Rehman, S.; Honap, V.; Siddiqui, A.; Maske, A.; Maithani, S. Spatio-Temporal Variations in Night Lights, Economy and Night Light Emissions in States of India. J. Indian Soc. Remote Sens. 2021, 49, 2933–2943. [Google Scholar] [CrossRef]
  48. Ye, Y.; Yun, G.; He, Y.; Lin, R.; He, T.; Qian, Z. Spatiotemporal Characteristics of Urbanization in the Taiwan Strait Based on Nighttime Light Data from 1992 to 2020. Remote Sens. 2023, 15, 3226. [Google Scholar] [CrossRef]
  49. Bedi, T.K.; Puntambekar, K.; Singh, S. Assessment of Light Pollution in Indian Scenario: A Case of Bangalore. J. Inst. Eng. Ser. A 2021, 102, 657–672. [Google Scholar] [CrossRef]
  50. Youngblood, K.; Brooks, A.; Das, N.; Singh, A.; Sultana, M.; Verma, G.; Zakir, T.; Chowdhury, G.W.; Duncan, E.; Khatoon, H.; et al. Rapid characterisation of macroplastic input and leakage in the Ganges river basin. Environ. Sci. Technol. 2022, 56, 4029–4038. [Google Scholar] [CrossRef]
  51. Marais, M.; Armitage, N.; Wise, C. The measurement and reduction of urban litter entering stormwater drainage systems: Paper 1-Quantifying the problem using the City of Cape Town as a case study. Water Sa 2004, 30, 469–482. [Google Scholar] [CrossRef]
  52. Seto, K.C.; Fragkias, M.; Güneralp, B.; Reilly, M.K. A meta-analysis of global urban land expansion. PLoS ONE 2011, 6, e23777. [Google Scholar] [CrossRef]
  53. Van Emmerik, T.H.; Frings, R.M.; Schreyers, L.J.; Hauk, R.; de Lange, S.I.; Mellink, Y.A. River plastic transport and deposition amplified by extreme flood. Nat. Water 2023, 1, 514–522. [Google Scholar] [CrossRef]
  54. Meijer, L.J.; Van Emmerik, T.; Van Der Ent, R.; Schmidt, C.; Lebreton, L. More than 1000 rivers account for 80% of global riverine plastic emissions into the ocean. Sci. Adv. 2021, 7, eaaz5803. [Google Scholar] [CrossRef]
  55. Roebroek, C.T.; Harrigan, S.; Van Emmerik, T.H.; Baugh, C.; Eilander, D.; Prudhomme, C.; Pappenberger, F. Plastic in global rivers: Are floods making it worse? Environ. Res. Lett. 2021, 16, 025003. [Google Scholar] [CrossRef]
  56. Van Emmerik, T.H. The impact of floods on plastic pollution. Glob. Sustain. 2024, 7, e17. [Google Scholar] [CrossRef]
  57. Van Emmerik, T.; Schwarz, A. Plastic debris in rivers. Wiley Interdiscip. Rev. Water 2020, 7, e1398. [Google Scholar] [CrossRef]
  58. Tariq, A.; Qadir, A.; Ahmad, S.R. Consequences of plastic trash on behavior and ecology of birds. In Microplastic Pollution: Environmental Occurrence and Treatment Technologies; Springer International Publishing: Cham, Switzerland, 2022; pp. 347–368. [Google Scholar]
  59. Barrett, N.; Miller, J.; Orbock-Miller, S. Quantification and Categorization of Macroplastics (Plastic Debris) within a Headwaters Basin in Western North Carolina, USA: Implications to the Potential Impacts of Plastic Pollution on Biota. Environments 2024, 11, 195. [Google Scholar] [CrossRef]
  60. Bellasi, A.; Binda, G.; Pozzi, A.; Galafassi, S.; Volta, P.; Bettinetti, R. Microplastic contamination in freshwater environments: A review, focusing on interactions with sediments and benthic organisms. Environments 2020, 7, 30. [Google Scholar] [CrossRef]
  61. Almeida, M.P.D.; Gaylarde, C.; Pompermayer, F.C.; Lima, L.D.S.; Delgado, J.D.F.; Scott, D.; Neves, C.V.; Vieira, K.S.; Neto, J.A.B.; Fonseca, E.M. The complex dynamics of microplastic migration through different aquatic environments: Subsidies for a better understanding of its environmental dispersion. Microplastics 2023, 2, 62–77. [Google Scholar] [CrossRef]
  62. Gutiérrez-Rial, D.; Villar, I.; Álvarez-Troncoso, R.; Soto, B.; Mato, S.; Garrido, J. Assessment of Microplastic Pollution in River Ecosystems: Effect of Land Use and Biotic Indices. Water 2024, 16, 1369. [Google Scholar] [CrossRef]
  63. Richardson, K.; Asmutis-Silvia, R.; Drinkwin, J.; Gilardi, K.V.; Giskes, I.; Jones, G.; O’Brien, K.; Pragnell-Raasch, H.; Ludwig, L.; Antonelis, K.; et al. Building evidence around ghost gear: Global trends and analysis for sustainable solutions at scale. Mar. Pollut. Bull. 2019, 138, 222–229. [Google Scholar] [CrossRef] [PubMed]
  64. Badola, S.; Gill, A.K.; Dobriyal, P.; Patel, S.; Khan, M.Z.; Hussain, S.A. Haunting the Ganges: Addressing the issues of ghost gear in the Ganga River through an incentive-based institutional mechanism. Front. Conserv. Sci. 2024, 5, 1341434. [Google Scholar] [CrossRef]
  65. Do, H.L.; Armstrong, C.W. Ghost fishing gear and their effect on ecosystem services–Identification and knowledge gaps. Mar. Policy 2023, 150, 105528. [Google Scholar] [CrossRef]
  66. MoEFCC. ‘Ban on Single-Use Plastic’ Starred Question No. 173; Ministry of Environment, Forest and Climate Change: New Delhi, India; Government of India: New Delhi, India, 2021.
  67. Nøklebye, E.; Adam, H.N.; Roy-Basu, A.; Bharat, G.K.; Steindal, E.H. Plastic bans in India—Addressing the socio-economic and environmental complexities. Environ. Sci. Policy 2023, 139, 219–227. [Google Scholar] [CrossRef]
  68. Lindhqvist, T. Extended Producer Responsibility in Cleaner Production: Policy Principle to Promote Environmental Improvements of Product Systems. Ph.D. Thesis, Lund University, Lund, Sweden, 2000. [Google Scholar]
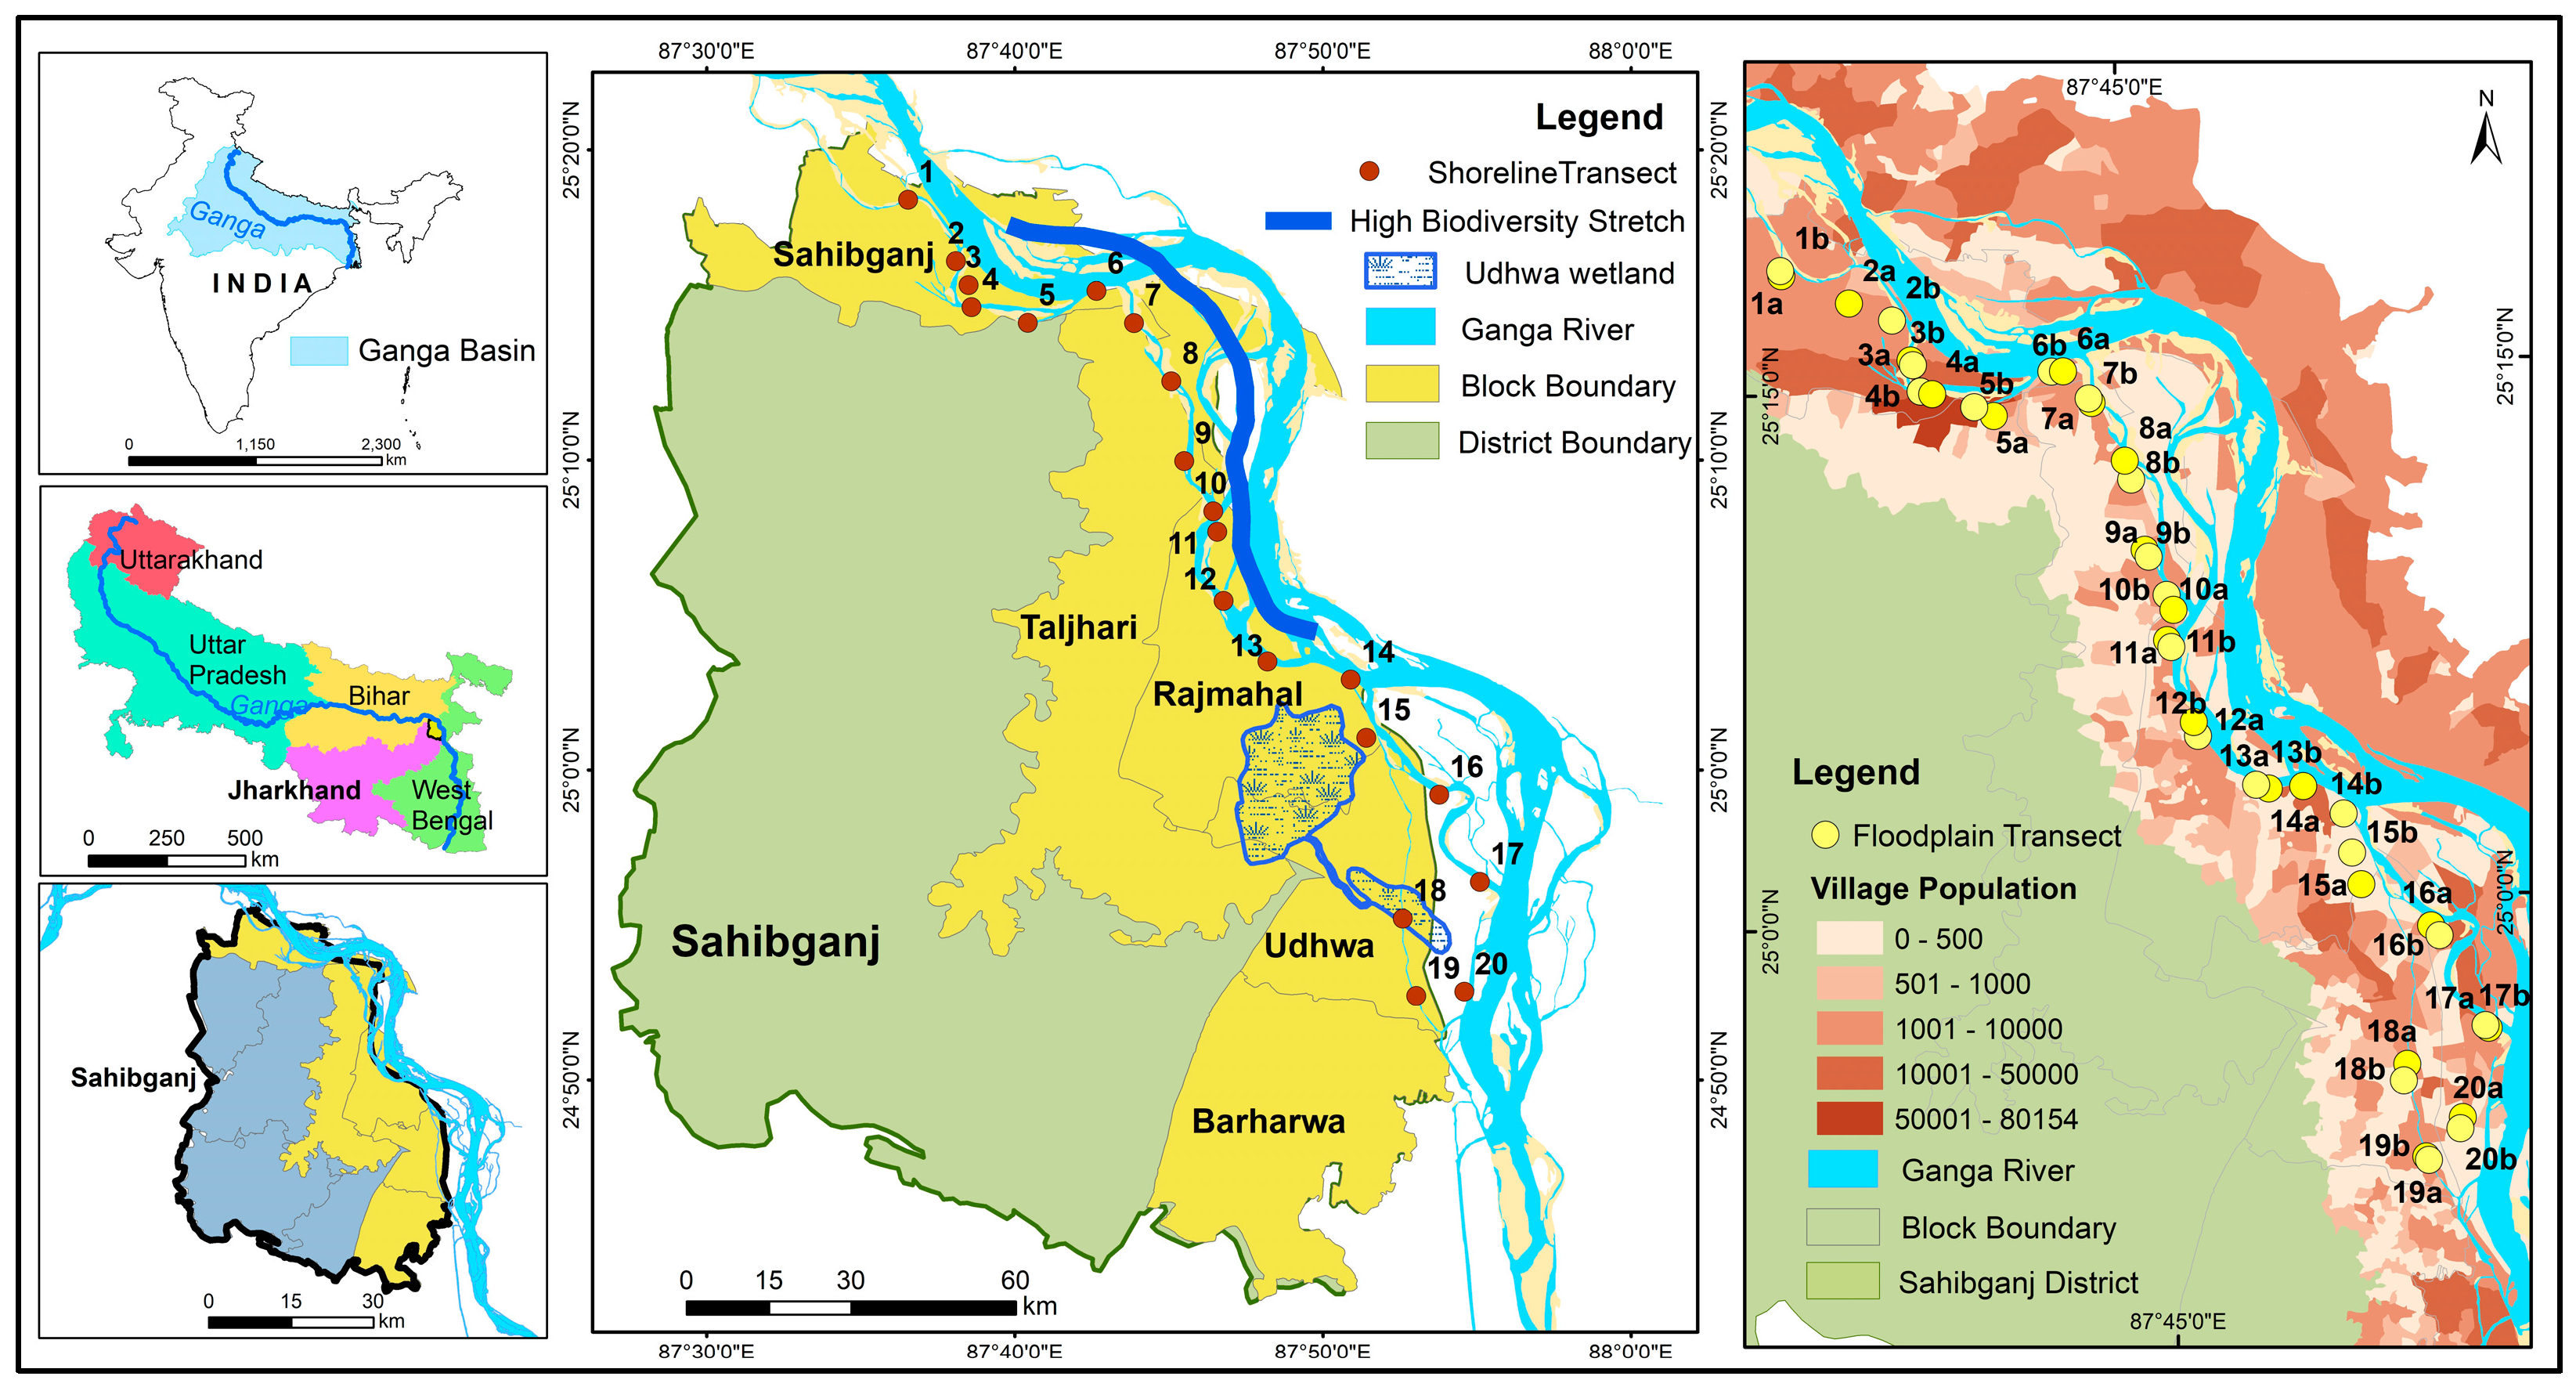
Figure 1. Location of the study area in Jharkhand, India, showing the section of the Ganga River stretch studied. The map highlights the high-biodiversity stretch of the river, sampling sites, block boundaries, shorelines, and floodplain transects (population density transects in the floodplains, na = high population density; nb = low population density). Inset maps indicate the position of Jharkhand within India and the relative location of Sahibganj district. Mapping Source: Arc GIS 10.6.1 (ESRI, 2020) [41]; population data: Census 2001, Census 2011 [26,42]; wetland data: Protected Area Network, ENVIS 2022 [43].
Sustainability 17 04932 g001
Figure 2. Google Earth satellite imagery illustrating the selection of transect sites from the grid overlay. Transects are classified based on built-up area: high-population-density transect (>80% built-up area) and low-population-density transect (<50% built-up area). The shoreline transect site is also highlighted along the riverbank. Available online: https://earth.google.com (accessed on 22 May 2024).
Sustainability 17 04932 g002
Figure 3. PCA biplot showing debris distribution in shorelines and floodplains along PC1 (56.2%) and PC2 (12.6%) axes, with vectors indicating types of debris.
Sustainability 17 04932 g003
Figure 4. Density comparison of debris categories in floodplains and shorelines along the Ganga River (items/m2).
Sustainability 17 04932 g004
Figure 5. Boxplot comparing debris density (items/m2) of various debris categories in floodplain and shoreline areas, categorised by rural and urban settlements along the Ganga River. The box represents the interquartile range (IQR), the horizontal line inside the box indicates the median, whiskers extend to 1.5 times the IQR, and points beyond the whiskers represent outliers.
Sustainability 17 04932 g005
Figure 6. Bar chart illustrating debris count across various survey sites, distinguishing between rural and urban settlements along the Ganga River.
Sustainability 17 04932 g006
Figure 7. Nighttime light data from 2012 to 2020 showing urbanisation and a proxy for increased availability of plastic-packaged products along the Ganga River (red, orange, and yellow regions indicate urban centres, peri-urban, and rural areas with heightened human activities and infrastructure development, correlating with increased consumption of plastic-packaged goods. Black regions represent areas with minimal artificial illumination).
Sustainability 17 04932 g007
Figure 8. Boxplot comparing debris count of various debris types in high- and low-population-density areas along the Ganga River. The box represents the interquartile range (IQR), the horizontal line inside the box indicates the median, whiskers extend to 1.5 times the IQR, and points beyond the whiskers represent outliers.
Sustainability 17 04932 g008
Figure 9. PCA biplot showing debris composition and distribution in pre-monsoon and post-monsoon periods along the Ganga River, with vectors indicating types of debris and ellipses representing group clusters.
Sustainability 17 04932 g009
Figure 10. Interaction plot showing trends in debris densities (items/m2) across different conditions (pre-monsoon, pre-monsoon post-treatment, and post-monsoon) for various debris categories along the Ganga River.
Sustainability 17 04932 g010
Table 1. Summary of debris categories recorded in the High-Biodiversity Zone along with the percentage of total quantities found along the river Ganga, Sahibganj, Jharkhand.
S. No.CategoryDebris Count Recorded in High-Biodiversity ZonePercentage of Total Category Quantities Recorded in the Study Area (%)Mean±SD
1Disposable cutleries122968.890.040.030
2Fishing81972.930.030.022
3Fragments546861.970.190.087
4Hard Plastic58364.850.020.008
5Medical Plastic Waste33769.480.010.011
6Other128459.580.050.026
7Packaging12,48463.070.440.127
8Spare Parts13071.820.0050.004
9Textile37063.030.010.005
10Tobacco-Related Debris47124.820.020.010
Table 2. Recommendations: prioritised measures for plastic pollution mitigation. The numbers correspond to the bullet points number in the following list.
S.No.Measure to Be TakenTarget AreaTimescale 2Urgency ¹
1Strengthening Waste Management Infrastructure
(a)Establish and maintain regular waste collection facilities and segregation centres in rural floodplain communities to prevent dumping and plastic discharge into riverine systems.RuralC1
(b)Upgrade waste segregation, collection, and recycling facilities to minimise landfill dependency and promotion of enhance circular economy based mechanisms.UrbanC1
(c)Implement community-led waste retrieval programmes in floodplain settlements to remove accumulated plastic debris before monsoon flooding.RuralA1
(d)Develop smart waste-tracking systems (e.g., GIS, remote sensing) to identify leakage hotspots and optimise interventions.Rural and UrbanB2
2Policy Implementation and Governance
(a)Strengthen Extended Producer Responsibility (EPR) frameworks to hold producers accountable for plastic waste and incentivise eco-friendly packaging.Rural and UrbanA1
(b)Introduce plastic taxation and incentive-based recycling schemes to encourage businesses and consumers to adopt sustainable alternatives.UrbanB2
(c)Integrate plastic waste management regulations into broader rural development and urban planning policies for long-term sustainability.Rural and UrbanB2
(d)Strengthen local institutions such as village councils by capacity building and resource provisionRuralB1
3Community Engagement and Awareness
(a)Launch localised awareness campaigns emphasising the impacts of plastic pollution on climate, marine, and freshwater ecosystems, encouraging responsible disposal.Rural and UrbanA1
(b)Establish financial incentives for community-driven collection/recycling efforts, fostering local entrepreneurship in sustainable waste solutions.Rural and UrbanB2
(c)Develop educational programmes (schools, NGOs) to instil long-term environmental stewardship and responsible consumption habits.Rural and UrbanB2
4Advancing Research and Innovation
(a)Conduct longitudinal studies on macro-, meso-, and microplastic contamination to assess climate resilience, freshwater ecosystem health, and human impacts.Rural and UrbanB2
(b)Promote biodegradable packaging R&D (industry–academia collaboration) to replace single-use plastics and reduce non-recyclable waste.UrbanB2
(c)Enhance scientific monitoring of plastic transport using advanced hydrological and geospatial models to inform adaptive management.Rural and UrbanB2
Disclaimer/Publisher’s Note: The statements, opinions and data contained in all publications are solely those of the individual author(s) and contributor(s) and not of MDPI and/or the editor(s). MDPI and/or the editor(s) disclaim responsibility for any injury to people or property resulting from any ideas, methods, instructions or products referred to in the content.