Abstract
In the context of Industry 4.0, the transformative integration of intelligent digitalization, sustainable practices, and cross-sectoral industrial convergence within manufacturing systems constitutes a strategic imperative for addressing global climate emergencies and accelerating resource scarcity. Using panel data from 279 prefecture-level cities and the multiperiod difference-in-differences (DID) approach, this study investigates the impact of intelligent manufacturing on urban green innovation efficiency and its heterogeneous effects. The results reveal that intelligent manufacturing significantly enhances urban green innovation efficiency through scale agglomeration, economic agglomeration, and talent agglomeration, with robustness confirmed by propensity score matching DID tests and double machine learning. In addition, financial development has a nonlinear moderating effect on this relationship. When financial development surpasses the critical threshold of 3.817, its positive moderating effect becomes significantly enhanced. Heterogeneity analyses demonstrate that the benefits of intelligent manufacturing are more pronounced in the middle and western regions, noncentral cities, and cities with advanced industrial intelligence, robust digital finance ecosystems, or stringent environmental regulations. These findings provide novel insights into the dynamic mechanisms through which intelligent manufacturing fosters green innovation, offering policymakers in developing economies a framework to tailor regional strategies, optimize governance systems, and harness intelligent manufacturing as a catalyst for sustainable, innovation-driven growth.
1. Introduction
Climate disasters and the rapid depletion of natural resources continue to serve as warning signs of the traditional development model’s unsustainable nature, compelling human civilization to make both cognitive and practical changes through green innovation. In this context, the notion of sustainable development has sparked considerable interest among governments and academics worldwide [1,2]. Manufacturing, as the primary source of global economic expansion, is also the most energy-intensive and polluting industry, severely limiting sustainable development. As the world’s largest developing economy and global manufacturing hub, China currently navigates a complex landscape marked by two imperatives: decarbonizing its industrial framework while fundamentally reorienting its technological innovation ecosystem. Persistent structural challenges emerge from a misalignment between R&D advancements and practical industrial implementation, with environmentally sustainable technologies encountering significant commercialization barriers. Concurrently, systemic inefficiencies in resource allocation and the sluggish modernization of legacy industries continue to undermine the effectiveness of green innovation initiatives, creating compounded obstacles in achieving sustainable industrial transformation. This critical juncture reveals an urgent need to reconcile technological potential with market realities while addressing deep-rooted institutional constraints in production systems.
In this context, this study chooses intelligent manufacturing as a breakthrough because its digital and intelligent features can effectively integrate innovation resources, optimize factor allocation, breakthrough information barriers, and provide a new path for green technology innovation. Intelligent manufacturing can not only improve the efficiency of green technology research and development and transformation but also build a new industrial ecology through changes in the production mode, which is the key to overcoming the current green innovation dilemma and cultivating a new driving force for sustainable development.
Made in China 2025 (MIC2025) was launched in 2015 with the goal of overcoming the inherent contradiction between resource and environmental efficiency in industrialization by integrating advanced technologies such as the Internet of Things (IoT), artificial intelligence (AI), and robotics into the manufacturing ecosystem, thereby providing a strategic laboratory for researching how intelligent manufacturing can reshape cities’ green innovation efficiency (GIE). However, existing research on the policy effects of intelligent manufacturing focuses on the dimensions of production efficiency and economic output, and it has been shown that the application of intelligent manufacturing-related technologies can optimize the production process, reduce maintenance costs, improve enterprise production efficiency and organizational management, and improve production efficiency and quality [3] and the economic efficiency of enterprises [4].
The drivers of global GIE have been extensively discussed in the established literature and can be summarized mainly in terms of external environmental factors and firm microbehavior. External environmental factors include factors such as government environmental regulation [5] and external audit risk [6]. As the main body of green innovation, the issuance of green bonds [7], green financing [8], and the financial flexibility of enterprises [9] all play key roles in green innovation. Recent studies have further explored the spillover effects of green technologies [10,11] and the role of industrial agglomeration [12].
On the basis of the literature, this paper suggests that there is still room for further expansion. Although the literature has analyzed the factors affecting green innovation, few studies have focused on the impact of the pilot demonstration city construction of MIC2025 on a city’s GIE and identified its role mechanism. Second, many studies have investigated the impact of intelligent manufacturing on GIE in the context of manufacturing transformation and upgrading, but accurate causal identification is lacking, and multidimensional policy research judgments from the perspective of heterogeneity are lacking. On the basis of rigorous endogeneity treatment and robustness tests, this paper focuses on exploring the mechanism through which intelligent manufacturing enhances the efficiency of urban green innovation and analyzes the effects of policy pilots in different cities to provide experience for the transformation and upgrading of the manufacturing industry.
This study aims to empirically determine the causal relationship between intelligent manufacturing and urban green innovation. In terms of empirical methodology, the event shock and DID design of MIC2025 is utilized to reveal this causal relationship. On the basis of the benchmark regression, a series of robustness tests and endogeneity treatments are used to provide stronger evidence for the study. During the sample period, this study uses panel data for 279 Chinese cities from 2007–2022, which includes not only periods of rapid growth in manufacturing but also periods of increased uncertainty in the urban innovation environment. We find that the efficiency of green innovation in the pilot cities is significantly improved in all of the intelligent manufacturing policy interventions. Intelligent manufacturing enhances the efficiency of urban green innovation by increasing the level of urban manufacturing scale agglomeration, economic agglomeration, and talent concentration. In addition, a high level of financial product markets that provide financial support for green innovation activities in cities can increase the resilience of cities to sustainable development. Finally, this study further discusses the heterogeneity effect due to urban endowments. To achieve a high level of industrial intelligence, digital finance, and government environmental regulations can add to intelligent manufacturing to improve the efficiency of urban green innovation.
In contrast to the literature, this paper provides a marginal contribution to the efficiency of green innovation in cities. First, it constructs a theoretical framework of intelligent manufacturing, financial development level, agglomeration effect, and urban green innovation, which helps to enrich the theory of green innovation growth. Theoretically, this work is based on the agglomeration effect and deeply excavates the transmission mechanism through which intelligent manufacturing affects the efficiency of urban green innovation, which is conducive to solving the long-standing controversy concerning the relationship between industrial agglomeration and urban green development. Third, starting from city characteristics, this study examines the heterogeneity of the impact of intelligent manufacturing policies on urban green innovation and explores the differences in the impact of intelligent manufacturing on the improvement of GIE in cities with different characteristics from multiple perspectives, which provides theoretical support for the development of targeted and personalized urban digital transformation programs. Finally, the findings of this study provide policy insights and lessons learned for other countries, offering a replicable policy toolkit for high-quality regional economic transformation that can help shape the path toward sustainable development in the process of manufacturing transformation and upgrading.
The remainder of this paper is organized as follows. Section 2 presents the literature review. Section 3 introduces the background of MIC2025 and the theoretical effect of intelligent manufacturing on GIE. Section 4 presents the sample, methodology, and variables used in the empirical analysis. Section 3 describes the research design, variables, and models. Section 4 presents the results and analysis of the benchmark regression, robustness tests, mechanism tests, threshold tests, and heterogeneity tests. Section 6 summarizes the results and provides some suggestions.
The analytical framework of this study is shown in Figure 1. Given the dual challenges of the current climate and energy crisis, this study focuses on the urgent need for the transformation and upgrading of the manufacturing industry and provides theoretical support and practical paths for the construction of a sustainable urban development system by systematically analyzing the direct role, indirect conduction and threshold characteristics of intelligent manufacturing on the efficiency of urban green innovation.
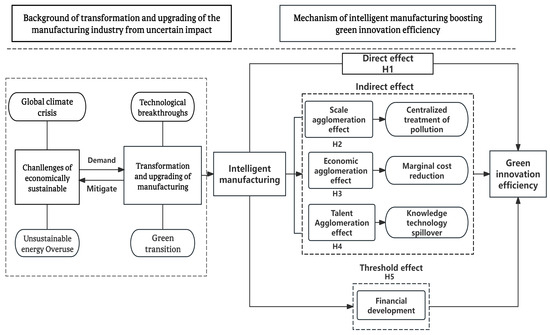
Figure 1.
Analytical framework.
2. Literature Review
2.1. Evaluation of GIE
Green innovation, which has been widely discussed over the past two decades, combines environmental sensitivity and ecological awareness [13], is an advanced technology based on reducing or eliminating environmental hazards, and it serves as a key strategic driver for achieving sustainable development. In addition to green innovation, GIE emphasizes the economics and sustainability of innovation activities, representing the input-output ratio of innovation activities while taking into account environmental limits or the combined advantages of green innovation outcomes [14]. There are three main techniques used to assess GIE: the number of green patent applications as a direct indicator, stochastic frontier analysis, and the data envelopment analysis method [15,16,17].
2.2. Influencing Factors of GIE
Existing studies have extensively explored the elements that influence the effectiveness of green innovations. The study revealed that adequate environmental regulatory measures may effectively boost green innovation activities and have a favorable U-shaped association with GIE [18]. Digitalization has been widely discussed in the field of green innovation, and internet development and digital technologies can minimize resource reliance. Digital transformation in key areas can improve operational efficiency and innovation [19], and studies have directly demonstrated that digital infrastructure can impact GIE through industry clustering and diversification [20]. Financial strategies have also been identified as a key element in supporting green innovation in terms of the amount of growth in the digital economy [21]. Additionally, as the primary source of innovation, a company’s features, its environmental management system, and its internal strategy can affect green innovation to varying degrees [22], with the factors of corporate accounting practices, direct investment, and corporate environmental responsibility being particularly important.
2.3. Impact of Intelligent Manufacturing on GIE
Existing studies are actively investigating intelligent manufacturing from two angles: first, the concept of intelligent manufacturing itself. Intelligent manufacturing is primarily an intelligent transformation of production processes and manufacturing links powered by digital technology, arising from the deep integration of the internet, Internet of Things, artificial intelligence, and current manufacturing technologies [23]. Research on the implementation pathways of intelligent manufacturing has established a relatively comprehensive theoretical framework, with key focus areas including energy efficiency optimization system design, intelligent manufacturing architecture development, intelligent worker competency modeling, big data technology support applications, and industrial internet platform construction [24].
The second goal is to investigate the applications of intelligent manufacturing in diverse industries. Intelligent manufacturing may help with technological integration and productivity improvement [25], generate concurrent improvements in manufacturing competitiveness and system complexity, and optimize the interconnection of production elements in real time [26]. Industry 4.0, the fourth industrial revolution, has altered production by combining advanced digital technologies, boosting automation, connectivity, and data-driven decision-making, according to recent research [27]. In terms of the research relevant to this paper, intelligent manufacturing contributes to the potential of reducing household-related carbon emissions to mitigate global warming, which positively impacts carbon emission reduction [28]. Increasing the use of robots can improve labor productivity and economic growth in developed countries [29], and intelligent manufacturing can lead to a low-carbon transition by facilitating the upgrading of the industrial structure. In conclusion, the application of intelligent manufacturing significantly improves the economic and ecological benefits of manufacturing enterprises and promotes sustainable development.
Although existing studies have extensively explored the economic benefits of smart manufacturing, investigations of its global environmental impacts are still at an early stage, and there is room for further exploration of causal identification, heterogeneity analysis, and global impact assessment, with less attention given to the mechanism of the pilot policy of MIC2025 on the efficiency of green innovation in cities. Therefore, this paper explores in depth the internal mechanism by which smart manufacturing affects green innovation, which not only helps in understanding its sustainable development potential but also provides a scientific basis for policy formulation.
Table 1 focuses on integrating the findings of the literature in the area of intelligent manufacturing-related technologies and applications and the factors influencing the efficiency of green innovation.

Table 1.
Main contributions considered.
3. Policy Background and Research Hypotheses
3.1. Policy Background
China’s manufacturing industry became the world’s largest at the beginning of the twenty-first century due to low-cost factor advantages, but the long-term reliance on resource consumption and the OEM export model has resulted in insufficient economic growth momentum. After 2010, the fading of the domestic demographic dividend, high energy consumption per unit of the output value of conventional industrial capacity, and slow conversion of scientific and technical advancements highlighted the importance of industrial upgrading. In other words, China urgently has to overhaul its industrial growth paradigm.
To promote high-quality and sustainable economic development, as well as high-end, green, comprehensive transformation and upgrading of the manufacturing industry, China presented the goals and timetable of the strategy for a strong manufacturing country in May 2015, known as the MIC2025 strategy, which is implemented primarily by the Ministry of Industry and Information Technology (MIIT). The United States, Germany, Japan, South Korea, and other major economies throughout the world have created similar schemes, trying to build intelligent manufacturing as a strategic advantage. MIIT chose 30 policy trial cities in two waves between 2016 and 2017. MIC2025 outlines the specific goals of the strategy for a strong manufacturing country, such as manufacturing innovation center projects, intelligent manufacturing projects, industrial foundation projects, green manufacturing projects, and high-end equipment innovation projects. It methodically develops a top-level design for manufacturing industry transformation and upgrading over the decade 2016–2025, offering a clear strategic framework and implementation path for economic transformation.
Figure 2 shows the geographical distribution of the pilot cities. The distribution of pilot cities is characterized by no serious selection bias. In addition, the policies are highly representative and of general relevance to the green innovation effect of intelligent manufacturing.
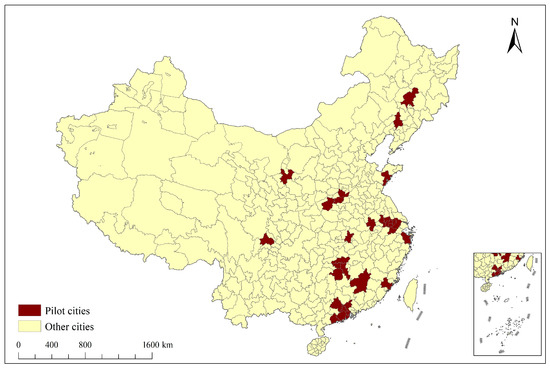
Figure 2.
Geographical distribution of MIC2025 pilot cities.
3.2. Research Hypothesis
3.2.1. Intelligent Manufacturing and GIE
Intelligent manufacturing, leveraging its outstanding advantages of permeability, diffusion, and spillover, injects new kinetic energy into the construction of green innovation ecology, hastening the evolution of the global industrial system toward low-carbon and sustainable transformation [30]. Technological innovation has the potential to overcome the bottleneck limits of key and core technologies, facilitating large-scale use and fast iterative upgrading of new technologies [31]. Intelligent production systems can optimize the efficiency of resource utilization, reduce energy consumption and pollution in the manufacturing industry, and promote the transformation of the industry to low carbon through green technology research and development and clean energy substitution. Moreover, intelligent manufacturing can obtain information about the quantity of materials needed faster, control the use of materials more precisely, and assess how production affects the environment more intelligently [25] as a way of preventing the waste of natural resources and improving the effectiveness of resource utilization. Finally, intelligent manufacturing relies on data-driven mechanisms to help enterprises build digital platforms to reduce the risk of green innovation by accurately identifying R&D needs and strengthening information transparency [32]. In summary, intelligent manufacturing is consistent with the principles of green innovation in terms of both inputs and outputs.
Hypothesis 1.
Intelligent manufacturing significantly enhances urban GIE.
3.2.2. The Scale Agglomeration Effect
Intelligent manufacturing improves the efficiency of urban green innovation by promoting manufacturing agglomeration. Manufacturing agglomeration refers to the process of a high concentration of manufacturing and related industries in a geographical area and the continuous convergence of related factors [33,34]. Relying on the industrial internet and modular production technology, intelligent manufacturing overcomes the traditional geographic proximity’s dependence on economies of scale and provides a new impetus for manufacturing agglomeration. Many manufacturing enterprises in the same industry or related manufacturing industries are concentrated in a centralized layout, forming a form of industrial organization with significant economies of scale through the expansion of the production scale and the sharing of infrastructure and resources. The positive externalities of agglomeration can reduce the unit cost of production of firms and exert significant economies of scale as a way to improve economic efficiency [35]. Cross-regional resource integration and standardized process sharing through clusters can not only help economies of scale focus on pollution control [36] but also stimulate innovation through knowledge and technology spillovers [37] to improve environmental quality and increase energy efficiency.
Hypothesis 2.
Intelligent manufacturing enhances urban GIE through scale agglomeration.
3.2.3. The Economic Agglomeration Effect
Intelligent manufacturing improves the efficiency of urban green innovation by increasing economic agglomeration. Intelligent manufacturing improves the efficiency of production processes and transparency of project information, promotes the development of new tracks such as industrial software and smart equipment, and not only enhances the visualization of investment returns but also creates diversified paths for capital appreciation. In addition, supporting policies accurately guide the inflow of capital; build a synergistic network of technology, industry, and policy; and accelerate the targeted agglomeration of urban economic factors. Firms’ green innovation investments are often characterized by large upfront investments [38], and economic agglomeration can provide upfront financial support for green innovation. In economically developed regions, intelligent manufacturing can mobilize more high-tech talent and achieve upstream and downstream linkages in the industrial chain, which is conducive to the positive effects of technological innovation and knowledge spillover, improve the utilization efficiency of input factors, effectively reduce regional carbon emissions [39], and promote the common development of green innovation.
Hypothesis 3.
Intelligent manufacturing enhances urban GIE through economic agglomeration.
3.2.4. The Talent Aggregation Effect
The technological complexity of intelligent manufacturing requires professionals with relevant skills to design, maintain, and optimize smart systems, increasing the demand for composite talent. Emerging positions such as digital twin modeling and industrial AI algorithm research and development continue to unleash their attractiveness, driving high-level technical talent and composite engineers to converge in the core industrial areas, thereby increasing the talent concentration level of the city. In the era of the knowledge economy, human capital has become the main source of competitive advantage for enterprises [40]. A higher level of human capital accumulation is associated with a stronger ability to absorb and transform new technologies [41] as a way to improve urban GIE. On the one hand, talent clustering can effectively break through the spatial and temporal barriers of knowledge transfer and generate significant scale development advantages [42]; on the other hand, this cluster development mode can not only radiate innovation factors to the surrounding regions but also strengthen its knowledge spillover effect by relying on the advantage of geographical proximity [43].
Hypothesis 4.
Intelligent manufacturing enhances urban GIE through talent agglomeration.
3.2.5. Threshold Effect
Intelligent manufacturing for urban innovation requires financial market conditions. Innovation activities are both high-risk and high-uncertainty, especially in the stages of technology development and diffusion. Different innovation tasks focus, and challenges need to be urgently resolved. Financial institutions, through the optimization of enterprise financing constraints, release risk warnings or positive incentive signals to guide market players in implementing green industrial upgrading. Relying on the price discovery function of the financial market, the information transmission channel effectively transfers the capital allocation signal to the real field, prompting investors to adjust the asset portfolio and production enterprises to optimize the production capacity structure, forming a market-driven endogenous momentum of industrial transformation, and promoting the manufacturing industry to the environmentally friendly development paradigm of orderly evolution. Green finance can help address financing constraints, provide financial support, and stimulate technological innovation through synergies with environmental regulatory policies at the regional level [44], further improving the sustainability performance of enterprises [45] and further promoting green production. However, owing to the short-term profit-seeking nature of capital, at a low financial development level, financing difficulties for green technology enterprises occur, which hinders the transmission of financial incentives for green innovation.
Hypothesis 5.
The impact of intelligent manufacturing on urban GIE exhibits significant threshold effects contingent on varying levels of financial development.
4. Research Design
4.1. Sample Selection and Data Sources
Considering the availability and effectiveness of the actual data, this paper uses balanced panel data from 279 prefecture-level cities in China during the period of 2007–2022 for empirical analysis on the basis of the empirical model to be constructed, and the sample of this paper excludes cities with serious missing data, such as Macao S.A.R., Hong Kong S.A.R., and Taiwan. The authors manually compiled a list of MIC2025 pilot cities on the basis of the “Circular of the State Council on the Issuance of the Strategy and Implementation Program of MIC2025” and the list provided by the Ministry of Industry and Information Technology of China. China’s Digital Inclusive Financial Development Index, measured via the Digital Financial Development Index compiled by Peking University, with elevation standard deviation data as an instrumental variable from the Geospatial Data Cloud Platform of the Computer Network Information Center of the Chinese Academy of Sciences (http://www.gscloud.cn). The rest of the data were obtained from databases such as the China Statistical Yearbook, China Urban Statistical Yearbook, China Science and Technology Statistical Yearbook, China Energy Statistical Yearbook, and State Intellectual Property Office of China (http://www.cnipa.gov.cn/), and the missing values in the variables were supplemented by linear interpolation.
4.2. Model Design
Benchmark Model
To evaluate the impact of intelligent manufacturing on GIE, this study treats the policy’s implementation as a quasinatural experiment, considering 30 cities participating in the MIC2025 pilot in 2016 and 2017 as the treatment group and those in nonpilot cities as the control group, constructing the following multiperiod DID model:
where is the city and where is the time ( = 1, …, 279; = 2007, …, 2022). represents the urban GIE of city in year , and indicates whether city was subject to the MIC2025 treatment in year , where 1 signifies treatment and 0 otherwise. measures the policy’s treatment effect, represents a series of control variables that may affect urban GIE, and are individual and year-fixed effects, capturing city-specific characteristics and time factors inherent to each city, respectively, and is the error term, which is assumed to be independently and identically distributed.
4.3. Definition of Key Variables
4.3.1. GIE
There are three main approaches to assessing the efficiency of green innovation. The first approach uses the number of green patent applications as a direct indicator [15], and while this approach captures the scale of green innovation, it does not reflect its efficiency [46]. The second approach uses stochastic frontier analysis (SFA), which is a model that integrates energy, labor, and other inputs, as well as undesirable pollution outputs, into an input-output framework to estimate GIE [16]. SFA is more rigorous in separating stochastic errors, but its dependence on functional form, distributional assumptions, and data quality limits its applicability in complex scenarios.
In contrast, the third and most widely adopted approach involves data envelopment analysis, which circumvents the challenge of functional form specification and does not require dimension normalization or assignment of indicator weights, thus improving the objectivity of efficiency assessment [17]. Therefore, this paper adopts the DEA model to measure the GIE of cities. DEA measures its level of efficiency through linear programming by establishing a production frontier for the observed data and then comparing the distance between the production frontier and each decision unit. Compared with the traditional DEA model, the Super-SBM model with unexpected outputs can eliminate disturbances such as angular differences and radial defects, fully address slack variables and unexpected outputs in the process of production inputs and outputs, be able to redecompose the noncomparable problem with an efficiency value of 1, and obtain a more accurate result in terms of the efficiency of urban GIE. The specific model is as follows:
where ρ represents the GIE value, ρ ≥ 1 indicates that the decision-making unit is relatively effective, 0 < ρ < 1 indicates that it is relatively ineffective, n denotes the number of decision-making units, j indicates the decision-making unit, and h refers to the number of production periods. The variables m, and correspond to the quantities of input indicators i, desirable output indicators g, and undesirable output indicators w, respectively. The elements , , and are the corresponding vector values. Finally, represents the weight vector.
The input factors and the desired output and nondesired output indicators selected for this paper are summarized in Table 2.
Table 2.
Evaluation index system for GIE.
4.3.2. Intelligent Manufacturing
The core explanatory variable (DID) was the dummy variable of the MIC2025 pilot policy, which consisted of a group dummy variable (treat) and a year dummy variable (post). This variable was given a value of 1 only when the city was on the pilot list after the policy was implemented and 0 otherwise. The MIC2025 pilot program, having spanned eight years since its implementation, provides sufficient temporal coverage and data granularity to establish this policy initiative as a robust proxy variable for intelligent manufacturing development.
4.3.3. Control Variables
Depending on the explanatory variables, we employed distinct sets of control variables, structured to encompass the following dimensions: Educational development level (Edu) is measured by the ratio of education expenditure to general budgeted fiscal expenditures. The economic development level (Rgdp) is represented by per capita GDP, deflated using 2006 as the base year and logarithmically transformed. Government intervention (Gov) is quantified as the proportion of government fiscal expenditure to GDP. The financial development level (Fin) is calculated as the year-end total deposits and loans of financial institutions relative to regional GDP. The urban greening level (Gsc) is gauged by the urban green coverage rate. Foreign direct investment (FDI), incorporated as an additional control variable in robustness checks, adjusts the baseline model specifications. The openness level (Open) is defined as the ratio of the import–export trade volume to GDP. The public infrastructure level (Tra) is measured by the per capita urban road area. The industrial structure upgrading index (Is) is operationalized as the ratio of tertiary industry value added to secondary industry value added.
4.3.4. Mechanism Variables
This paper examines the mechanism path of intelligent manufacturing on urban green innovation from three aspects: scale agglomeration (Scale), economic agglomeration (ECO), and talent agglomeration (STA). The scale agglomeration of the manufacturing industry is measured by the horizontal location entropy of manufacturing industry agglomeration, and the specific formula is as follows:
where denotes the city’s manufacturing location quotient, represents its manufacturing employment, indicates the year-end resident population, q corresponds to national manufacturing employment, and represents the total national urban population.
Economic capital agglomeration () is measured by the sum of the value added by the secondary sector and the tertiary sector and takes its logarithm. Talent aggregation () is measured by the proportion of the number of employees in scientific research, technical services, and geological exploration; the sum of employees in information transmission, computer services, and software; and the total number of employees in the city.
4.3.5. Threshold Variable
The financial development level (Fin) is chosen as the threshold variable, in accordance with the specification given in the preceding sections. Table 3 shows the descriptive statistics for the variables.
Table 3.
Variable definitions.
The descriptive statistics for the variables are shown in Table 4. In this work, samples with too many missing variables were excluded, extremes were removed and filled with means, and only countable missing variables were linearly interpolated via Stata18 software. After cleaning, there is no large numerical gap in the data, and the numerical performance of each variable is also in line with its economic significance.
Table 4.
Descriptive statistics of the main variables.
5. Empirical Test and Analysis
5.1. Benchmark Regression
Table 5 lists the estimated results of the impact of intelligent manufacturing on the GIE of cities. In the benchmark regression model, this paper uses a stepwise regression approach. In column (1), the model contains only policy variables and does not include city and individual control effects. The results show that the coefficient of DID is 0.148 and is significant at the 1% level, implying that intelligent manufacturing can significantly contribute to the growth of GIE in the pilot cities. Column (2) adds time-fixed effects and city-level control variables to column (1), and the estimated coefficients are still significantly positive at the 1% level, but the values of the regression coefficients decrease. Column (3) adds a series of control variables that may affect the efficiency of green innovation in cities, and column (4) adds time-fixed effects and city-fixed effects to (3). In terms of economic significance, taking the fourth column as an example, the implementation of the MIC2025 policy led to a 10% increase in the GIE of the city. The empirical results support Hypothesis 1. The literature empirically analyses the data of China’s A-share listed manufacturing enterprises on the basis of data from 2008–2021 by constructing a double-difference method and concludes that intelligent manufacturing has a significant role in promoting the green innovation of enterprises [40], which is corroborated by the findings of this paper.
Table 5.
Results of benchmark regression.
5.2. Validity Test of the DID Model
5.2.1. Parallel Trend Test
The DID approach to benchmark regression is based on the separation of experimental and control groups. If there is a substantial difference in the development trends of the two samples prior to policy implementation, it is not a relevant controlled experiment for determining a legitimate treatment effect. Therefore, it is necessary to verify whether there is a significant difference between the overall trends of the experimental and control group samples before policy implementation. Figure 3 shows the results of the parallel trend test; before the policy was enacted, the vertical lines all passed through 0, and the coefficients were not significantly different from zero, indicating that there was no significant difference between the treatment weaving and control groups, satisfying the prerequisites of the DID method; after the policy was enacted, except for the first year, the coefficients were all significantly positive. The results of this test correspond to the empirical results in Table 5.
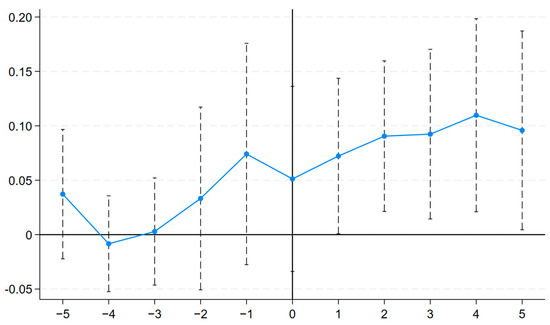
Figure 3.
Para-trend test.
5.2.2. Placebo Test
To test whether the improvement in GIE in cities promoted by the MIC2025 policy is caused by other random factors, this paper conducts a placebo test by randomly generating a dummy variable for the time of policy implementation and a dummy variable for the treatment group. Furthermore, 30 cities among 279 sample cities were randomly selected as the treatment group to obtain the estimated placebo coefficient of the GIE of cities affected by the implementation of the pilot policy of MIC2025. The kernel density and p value distributions of the regression coefficient estimates were plotted after this process was repeated 1000 times. As shown in Figure 4, the results show that the fake treatment effects obtained after randomizing the pilot cities roughly follow a standard normal distribution, and the true effects derived from the benchmark regression lie at the extreme end of each distribution. Most of the regression coefficients are concentrated on both sides of 0 and are significantly different from the actual estimation results. This finding indicates that, after randomization, the pilot policy no longer has a significant effect on GIE, implying that the treatment effect from the benchmark regression is real and effective. Accordingly, it can be hypothesized that the effect of intelligent manufacturing on urban GIE is not affected by other stochastic factors, which verifies the robustness of the regression results.
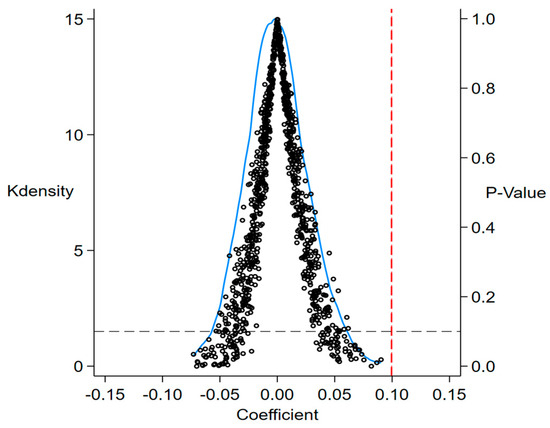
Figure 4.
Placebo test.
5.2.3. Problems with the Effects of Heterogeneous Treatment
Considering that the gradual nature of the MIC2025 city pilot will lead to identification bias in the traditional two-way fixed-effects model (TWFE), this paper refers to the Goodman–Bacon method to carry out Bayesian decomposition. The results of the test in Table 6 show that the weight of the “good control group”, with cities that never participated in the pilot as the control group, reaches 99%, and its corresponding average treatment effect is close to the baseline estimation coefficient, which suggests that the baseline estimation is robust, i.e., it is mainly the external shocks brought about by the piloting of the intelligent manufacturing policy, not the differences in the treatment time, that enhance the efficiency of green innovation in cities. Difference enhances the efficiency of urban green innovation.
Table 6.
Results of bacterial decomposition.
5.3. Robustness Analysis
5.3.1. PSM-DID
Given that the selection of MIC2025 pilot cities does not constitute a genuine natural experiment, potential selection bias may still incur estimation distortions. To mitigate self-selection bias in the sample, this study employs propensity score matching (PSM). First, we construct a logit model using control variables as covariates, performing sample matching through four methods: nearest-neighbor matching, caliper matching, kernel matching, and Mahalanobis distance matching. The matched samples are subsequently analyzed via the baseline regression model. As shown in Table 7, the DID coefficient remains statistically significant and positive. While the PSM-DID estimates exhibit marginal fluctuations compared with the baseline results, the deviations remain statistically negligible, with all estimates passing significance tests at least at the 5% level. This confirms that the MIC2025 policy significantly enhances urban GIE.
Table 7.
Results of the PSM-DID estimators.
5.3.2. Excluding Interference from Other Policies
To avoid the interference of other policies on the estimation results of the benchmark regression, this paper excludes the innovative city, smart city, and low-carbon China pilot city policies related to urban GIE implemented by the Chinese government during the sample period. The regression results in column (1) of Table 8 show that the estimated coefficients of DID are significantly positive, not much different from those of the benchmark regression, and pass the significance test at the 1% level. This finding shows that intelligent manufacturing can improve urban GIE and that the benchmark regression results are reliable.
Table 8.
Results of other robustness tests.
5.3.3. Alternative Measures for the Core Dependent Variable
This study employs a Super-SBM model incorporating undesirable outputs to measure GIE. To directly analyze the impact of the MIC2025 policy on urban green innovation output, while considering the time lag in green patent grants, we use “green patent applications” as substitute variables to test whether the demonstration zone policy enhances urban GIE. The regression results in column (2) of Table 8 show that the DID coefficient is significantly positive, indicating that under the requirements of intelligent manufacturing transformation, demonstration zone construction significantly improves GIE in prefecture-level cities.
5.3.4. Alleviating the Missing Variable Problem
To address potential estimation bias caused by omitted variables, this study conducts robustness checks by incorporating additional control variables. Following established research practices, we introduce per capita road area, the industrial structure upgrading index, and the degree of openness as supplementary controls. The regression results in column (3) of Table 8 demonstrate that the DID coefficient remains positive at the 1% significance level for urban GIE improvement after these variables are included, which aligns with the baseline regression results and further confirms the robustness of our findings.
5.3.5. Controlling for the Effects of Spatial Spillovers
On the one hand, the demonstration zone policy may siphon off factors from neighboring cities and inhibit innovation in neighboring cities; on the other hand, the innovation experience and technology of the demonstration zone may have a demonstration effect on manufacturing innovation in other cities, which in turn promotes innovation in neighboring cities. Therefore, to avoid the influence of regional spillover effects on the estimated coefficients, cities in the control group with geographic neighborhoods with the selected cities or city clusters are excluded and regressed again in this paper. The regression results are shown in column (4) of Table 8, and the coefficients are still significantly positive, indicating that MIC2025 is robust to the enhancement of urban GIE.
5.3.6. Exogeneity Test for Policy Variables
To examine whether the establishment of MIC2025 pilot cities was endogenously influenced by preexisting urban GIE levels, thereby testing the validity of the key identification assumption in the DID approach, this study adopts the hazard regression model specification following Beck et al. (2010) [47]:
where denotes the duration as MIC2025 demonstration cities, with all other variables maintaining consistency with prior specifications. The statistically insignificant association between a region’s selection/timing for pilot city designation and external environmental factors confirms the strong exogeneity of the policy. The regression results in column (5) of Table 8 show an insignificant coefficient for the GIE variable, indicating that prepolicy urban green innovation levels had no statistically significant effect on a city’s likelihood of being selected as an MIC2025 pilot city.
5.3.7. Double Machine Learning (DML)
Compared with traditional causal inference models, double machine learning has advantages in model specification and estimation. Therefore, this paper conducts robustness checks through a double machine learning model, divides the dataset into training and prediction sets at a 1:5 ratio, and employs four algorithms—Lasso regression, support vector machine, support vector machine, and linear regression—to perform prediction and solving for both the main regression and auxiliary regression. The results in Table 9 show that the estimated coefficient of the core explanatory variable DID closely aligns with the baseline regression results, indicating the robustness of our benchmark estimates.
Table 9.
Results of the DML test.
5.4. Endogenous Tests
Given the potential endogeneity concerns in the primary regression model, this study adopts an instrumental variable (IV) approach for estimation. Specifically, the standard error of cities’ geographic altitude serves as an alternative instrumental variable for intelligent manufacturing. This selection demonstrates theoretical validity: terrain fluctuation not only constitutes the technological foundation for enterprise implementation of intelligent manufacturing but also has a minimal direct impact on urban GIE, thereby satisfying both the relevance and exclusion restriction requirements. As revealed in the two-stage regression results reported in Table 10, the first-stage regression demonstrates a strong correlation between intelligent manufacturing and the instrumental variable, successfully passing the relevance test while eliminating concerns regarding overidentification. The second-stage estimation results show that the coefficient of intelligent manufacturing remains statistically significant at the 1% level with a positive coefficient, indicating that intelligent manufacturing significantly enhances urban GIE.
Table 10.
Endogenous tests.
5.5. Mechanism Analysis
The regression results in Table 11 indicate that intelligent manufacturing can significantly increase the level of manufacturing agglomeration, economic agglomeration, and talent agglomeration in a city, and the estimated coefficients are significant at least at the 1% level.
Table 11.
Results of mechanism analysis.
Manufacturing agglomeration generates economies of scale that allow firms to achieve lower production costs per unit, thereby serving as an important driver of enhanced economic efficiency through scale effects [35]. Manufacturing scale agglomeration generates a high-density innovation network, which facilitates the dissemination and exchange of tacit knowledge. This knowledge spillover effect fosters a favorable environment for urban green innovation and promotes the innovation and diffusion of green technologies [48]. In addition, economies of scale generated by manufacturing agglomeration improve energy utilization efficiency and expand market opportunities and resource availability for green stringers [49]. Thus, intelligent manufacturing improves the efficiency of urban innovation by increasing the level of urban agglomeration. Hypothesis 2 was tested and is consistent with the findings of scale agglomeration theory.
Empirical studies have demonstrated that higher levels of urban economic agglomeration significantly enhance a city’s regional attractiveness and spatial spillover effects, a well-documented phenomenon in regional economics [50,51]. Economic agglomeration is more conducive to the concentration of factors and industries, which increases returns to scale and technology as well as knowledge spillovers and leads to innovations in management systems [52], thereby improving the level of urban innovation. In economically developed regions, intelligent manufacturing can mobilize more talent, enhance the internalized professional division of labor in the city through the close cooperation of upstream and downstream enterprises in the industrial chain, drive the green upgrading of the whole industry, and promote the development of green innovation [53]. Hypothesis 3 is confirmed.
Talent serves as the fundamental driver of innovation and a strategic resource, playing an indispensable role in key aspects of manufacturing, including technological advancement, ecosystem development, and the commercialization of research outcomes [54]. Scientific and technological talent has become one of the key elements accelerating global economic development [55], and the concentration of high-quality innovative talent accelerates the transformation of innovation results [56], providing personnel security for cities to carry out green innovation activities. As a result, intelligent manufacturing can contribute to the efficiency of green innovation in cities by increasing the level of urban talent pooling; thus, Hypothesis 4 is proven.
5.6. Threshold Effect Analysis
To further investigate whether intelligent manufacturing has nonlinear impacts on urban GIE, this study employs a panel threshold model for empirical testing. Here, Fin is designated as the threshold variable. The bootstrap testing method is applied to assess the presence of threshold effects and determine the number of thresholds. The threshold effect model is specified as follows:
The significance tests for threshold effects with 1000 bootstrap replications are presented in Table 12. The results indicate that financial development exhibits a single-threshold effect, with the threshold value estimated at 3.817, which is statistically significant at the 1% level. In contrast, the double-threshold model yields a p value of 0.194, which fails to achieve statistical significance. Consequently, this study proceeds with the single-threshold specification for analysis. The LR likelihood function ratio test is shown in Figure 5, which reveals that the thresholds fall within the confidence interval. This further confirms the true validity of the threshold estimates. Figure 5 visualizes the threshold estimates and their significance.
Table 12.
Significance tests for threshold effects.
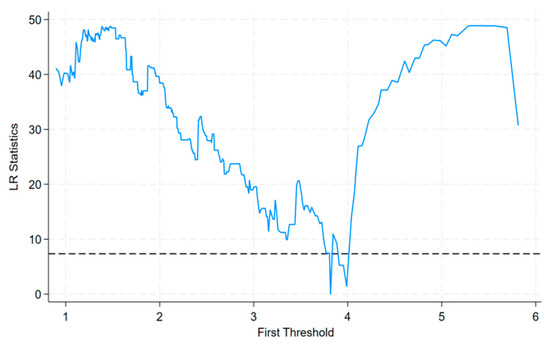
Figure 5.
Single-threshold effect estimation for Fin.
Table 13 shows the regression results of the threshold effect. When the level of financial development is less than or equal to 3.817, the regression coefficient of intelligent manufacturing on a city’s GIE is 0.0226, and when the level of financial development is greater than 3.817, the regression coefficient of intelligent manufacturing on a city’s GIE increases significantly to 0.221. The synergistic effect of the level of financial development and intelligent manufacturing on the efficiency of urban green innovation presents a significant single-threshold feature. The synergistic effect of financial development level and intelligent manufacturing on urban GIE shows a significant single-threshold feature. Hypothesis 5 is confirmed and is consistent with existing findings in the literature [21].
Table 13.
Estimation results of threshold regression.
The reason for the above results may be that when the level of financial development is below the threshold, when it is in the stage of financial inhibition, capital has a tendency toward short-term profit-seeking, credit resources tend to flow to traditional capital-heavy industries, and intelligent manufacturing enterprises have difficulty obtaining financing because of technological uncertainty and few collateral assets. Once financial development breaks through the threshold, the synergy of multidimensional mechanisms triggers structural shifts, and the popularization of green bonds and intellectual property bonds reduces the cost of financing green technological innovations. Coupled with the deep integration of policy incentives and market mechanisms, financial resources can be accurately directed to clean technology breakthroughs in the field of intelligent manufacturing.
5.7. Further Discussion: Heterogeneity Analysis
5.7.1. Location and Urban Hierarchy Heterogeneity
Gradient differences in industrial structure and resource endowments between cities may cause the effects of pilot policies to differ significantly across regions and levels of cities. For this reason, this study divides the pilot cities into eastern, middle, and western regional groups on the basis of the geographic location of Chinese cities. The sample is divided into central and noncentral cities on the basis of city class. The regression results are shown in Table 14.
Table 14.
Heterogeneity analysis (1).
A comprehensive comparison of the regression results for the three major regions of East China, Middle China, and West China reveals that the demonstration zone policy has a significant positive effect on urban green innovation in the middle region, with the coefficient being significant at the 1% level. The DID coefficients are significant at the 5% level in the West, but the coefficients are smaller than those in the Middle, whereas they are not significant in the East. This shows that intelligent manufacturing is more capable of increasing GIE in the middle region than in the western region. This may be because the middle region has a high proportion of traditional manufacturing industries and is heavily polluted, and MIC2025 has greater potential to improve its GIE. The western region has a weak manufacturing base, lagging technology, and vast space for the development of intelligent manufacturing, while the eastern region has mature manufacturing technology and high marketization, and the marginal effect of the policy is limited.
According to the regression results in Table 14, intelligent manufacturing has a significant positive contribution to GIE in noncentral cities and is not significant for central cities. The economic structure of central cities is diverse, with a low share and high level of manufacturing and weak policy effects, whereas noncentral cities rely on traditional manufacturing and are in urgent need of technological innovation, and the green innovation effect of intelligent manufacturing is more significant.
5.7.2. Heterogeneity Analysis of the Industrial Intelligence Level
Compared with the traditional production mode, industrial intelligence is characterized by automation, intelligence, and high efficiency, which provides unprecedented opportunities and conditions for the development of green innovation activities. Therefore, for cities with higher levels of industrial intelligence, can the implementation of the pilot’s policy stimulate the first-mover advantage of high levels of industrial intelligence and better enhance the efficiency of urban green innovation? Therefore, in this study, the level of industrial intelligence in each city in the previous year was measured. The study compiles data on AI companies and identifies a company as an AI company when its business scope involves keywords related to AI, such as chips, image recognition, computer vision, speech recognition, and sensors. We measure the level of AI development by the logarithmic value of the number of AI firms in the city in that year and group them by means, of setting a dummy variable for the level of industrial intelligence (LEVEL1), assigning a value of 0 to cities below the mean and a value of 1 to cities above the mean, and interacting this variable with the double-difference interaction term for the pilot policy (LEVEL1 × DID).
The results are shown in Table 15. The coefficient of the interaction term passes the significance test at the 1% level, and the coefficient is positive, indicating that the construction of pilot cities has a stronger effect on the improvement in the green development efficiency of cities with higher levels of industrial intelligence. On the one hand, industrial intelligence realizes innovation and changes in production organization through accelerating the efficiency of information collection and processing and the efficiency of production and R&D decision-making and effectively enhances the product innovation ability of the industry; on the other hand, industrial intelligence indirectly enhances the efficiency of urban green ecology by optimizing the energy structure and promoting the upgrading of the industrial structure.
Table 15.
Heterogeneity analysis (2).
5.7.3. Heterogeneity Analysis of the Digital Finance Development Level
All the subjects in a city are subject to financial constraints for green spending and innovation, and digital finance, as a fusion of the traditional economy and information technology, provides financial security for the optimization of the manufacturing structure and the transformation and upgrading of the manufacturing industry. On this basis, the study adopts the China Inclusive Financial Development Index (CFDI) compiled by Peking University and divides the cities into high digital financial development level cities and low digital financial development level cities through its mean value, sets a dummy variable for the digital financial level (LEVELS2), assigns a value of 1 to cities above the mean and 0 to cities below the mean, and then constructs the interaction term (LEVELS2 × DID).
The regression results in Table 15 indicate that pilot policies are more effective in cities with higher levels of digital finance. This may be because the digital economy promotes industrial upgrading and carbon emission reduction by reducing market segmentation and optimizing resource allocation while directing funds to R&D and energy savings by improving the matching of supply and demand, thus enhancing the level of green manufacturing and the efficiency of urban innovation.
5.7.4. Heterogeneity Analysis of Government Environmental Regulation
Green innovation projects have a long return cycle, high risk, and systematic and stronger characteristics; thus, enterprises or other subjects performing the green innovation activities of the subjective initiative are very limited, and urban green innovation needs to be driven by the “tangible hand”. Government environmental regulation can play a role in regulating and guiding these activities. Therefore, this study measures the level of government environmental regulation in cities in the year prior to the implementation of the policy, uses the proportion of words containing environmental protection in the annual reports of enterprises to the total words in the annual reports of enterprises as a measure of the level of government environmental regulation, assigns a value of 1 to cities that are above the mean value and a value of 0 otherwise, and constructs an interaction term (LEVELS3 × DID).
The regression results in Table 15 indicate that pilot policies are more effective in cities with higher levels of government environmental regulation. Regulatory policies force highly polluting and inefficient enterprises to exit or transform through tools such as emission standards and carbon trading; promote the flow of capital, labor, and other factors to the field of green technology; and optimize the efficiency of urban innovation resource allocation.
6. Conclusions and Policy Implications
6.1. Research Conclusions
In this paper, the “Made in China 2025” policy is used as an external shock, and 279 prefecture-level cities in China from 2007–2022 are used as a research sample. A quasinatural experiment is constructed via a multitemporal double-difference model to investigate whether intelligent manufacturing can improve the efficiency of urban green innovation. (1) The “Made in China 2025” policy can enhance the urban GIE of cities, and this conclusion still holds through a series of robustness tests and endogeneity treatments. (2) Intelligent manufacturing systematically enhances a city’s GIE by forming manufacturing scale agglomerations, economic agglomerations, and talent agglomerations. (3) Based on different levels of financial development, there is a significant threshold effect of intelligent manufacturing on urban green innovation. (4) Heterogeneity analysis reveals that MIC2025 is better able to promote GIE in middle, western, and noncentral urban areas. The promotion effect of MIC2025 on GIE is more significant in cities with higher levels of industrial intelligence, financial development, and government environmental regulations. The findings of this study provide empirical support and actionable insights for advancing green urban development globally, especially for many developing countries that can learn from this experience and contribute to the process of sustainable development in cities around the world.
6.2. Theoretical Contributions
This paper establishes an analytical framework for the coordination of manufacturing transformation and environmental governance, builds an analytical framework for the synergistic promotion of manufacturing transformation and upgrading and environmental governance, and reveals the inherent relationship between technological innovation-driven resource efficiency improvement and environmental protection. Second, using the agglomeration effect and financial development, this study identifies the intelligent manufacturing transmission mechanism that promotes GIE, providing theoretical support as well as a practical reference for addressing the problem of the dynamic balance between economic growth and the ecological carrying capacity. Finally, this paper facilitates the exploration of an economic-environmental win-win paradigm by analyzing the research from a multidimensional heterogeneity perspective, offering useful theoretical experiences for intelligent manufacturing city pilot selection and providing a replicable policy toolkit for high-quality regional economic transformation.
6.3. Practical Value
In response to these findings, this study proposes the following policy implications for global policymakers and practitioners. Countries, especially developing countries, should recognize the key role of intelligent manufacturing in promoting the green innovative development of cities and the green transformation of the economy, deeply understand the strategic value of intelligent manufacturing technology, incorporate intelligent manufacturing technology into the top-level design framework of sustainable urban governance and industrial system innovation, and promote the comprehensive construction of manufacturing industry ecosystems through a systematic policy layout. A wide range of developing countries similar to China should develop laws to guide the clustering of manufacturing industries and elements relevant to intelligent manufacturing, such as economic and human resources. Guiding the high-quality development of industry and promoting the systematic evolution of technological innovation, industrial synergy, and ecological cultivation.
Second, the government must establish a high-level, multilevel financial market since the degree of financial development has a substantial nonlinear influence on upgrading manufacturing. The price discovery function of the multilevel green financial market can be optimized, the precise allocation of capital elements to key areas of intelligent manufacturing can be guided, and financial institutions can make market-oriented decisions and allocate funds to green emerging industries to provide financial support for innovative research and development in areas related to intelligent manufacturing. This increases a city’s economic resilience and promotes sustainable development.
Third, to identify the effects of intelligent manufacturing policies, the diverse implications of policy implementation must be considered during the policy creation and implementation process. This is determined not only by the city’s location and administrative level but also by the level of industrial intelligence, digital finance development, and government environmental control. This necessitates that nations adopt policies that are exactly in line with the features of urban growth, emphasizing the dynamics of sustainable urban development and promoting the cooperative advancement of eco-governance and green technology innovation. This requires countries to develop intelligent manufacturing at the same time but also to accelerate the process of urban industrial intelligence construction and promote the development of urban digital financial innovation; on this basis, the government needs to support the introduction of the corresponding environmental regulatory policy system through the establishment of sound laws and regulations, the improvement of the regulatory framework, and the development of incentives.
7. Research Limitations
This study yields constructive conclusions while acknowledging several limitations that warrant future research attention. First, urban GIE metrics could be refined through more appropriate indicator systems. The categorization of green innovation should be enhanced beyond the conventional dichotomy of green product innovation and green process innovation prevalent in the literature. Subsequent investigations should specifically examine the differential impacts of intelligent manufacturing across distinct green innovation typologies. Furthermore, there is room for further improvement in sample selection. Given the current data availability, the sample period for this article ends in 2022. When more data can be obtained, nonlinear analysis can be carried out in future research to explore the influence of different stages of MIC2025. Moreover, this paper bases its analysis on the Chinese perspective, while the impact of intelligent manufacturing on GIE may vary from country to country; thus, cross-country cross-sectional comparative studies are necessary. Finally, while our DID design rigorously controls for observed confounders through covariate balancing and fixed effects, we acknowledge the potential bias from unobserved concurrent shocks that may correlate with both the policy implementation and outcome variables.
Author Contributions
Conceptualization by H.J.; methodology by H.J.; data curation by X.Z.; formal analysis X.Z.; writing—original draft by X.Z.; writing—review and editing by F.Z.; supervision by F.Z. All authors have read and agreed to the published version of the manuscript.
Funding
This research was funded by the Youth Project of the National Social Science Foundation of China, Grant number 21CJL028. And the APC was funded by F.Z.
Institutional Review Board Statement
Not applicable.
Informed Consent Statement
Not applicable.
Data Availability Statement
The data presented in this study are available upon request from the corresponding author. The data presented in this study were derived from the following resources available in the public domain: the China Statistical Yearbook (http://www.stats.gov.cn); the China City Statistical Yearbook (http://www.stats.gov.cn/zs/tjwh/tjkw/tjzl/, accessed on 28 February2023); the China Statistical Yearbook on Science and Technology (http://www.sts.org.cn); the China Energy Statistical Yearbook (http://www.stats.gov.cn/zs/tjwh/tjkw/tjzl/); the Ministry of Industry and Information Technology of the People’s Republic of China (http://www.miit.gov.cn); the Geospatial Data Cloud Platform of the Computer Network Information Center of the Chinese Academy of Sciences (http://www.gscloud.cn); and the National Intellectual Property Administration of the People’s Republic of China. (http://www.cnipa.gov.cn); Peking University Digital Finance Research Center (https://idf.pku.edu.cn/yjcg/zsbg/513800.htm, accessed on 21 April 2021).
Conflicts of Interest
The authors declare that they have no conflicts of interest.
References
- Mensah, J.D. Rethinking the contribution of creative economies in Africa to sustainable development. An empirical research of creative intermediaries in Accra’s contemporary art sector. Int. J. Cult. Policy 2025, 31, 551–568. [Google Scholar] [CrossRef]
- Figueira, C.; Fullman, A.R. Regenerative cultural policy: Sustainable development, cultural relations, and social learning. Int. J. Cult. Policy 2025, 31, 451–466. [Google Scholar] [CrossRef]
- Cai, W. Research on the Integration of Artificial Intelligence Technology and Mechatronics Engineering against the Backdrop of Intelligent Manufacturing. Int. J. Front. Eng. Technol. 2024, 6, 9–14. [Google Scholar]
- Sun, K. Analysis of production and organisational management efficiency of Chinese family intelligent manufacturing enterprises based on IoT and machine learning technology. Enterp. Inf. Syst. 2022, 16, 208–222. [Google Scholar] [CrossRef]
- Zhou, P.; Song, F.M.; Huang, X. Environmental regulations and firms’ green innovations: Transforming pressure into incentives. Int. Rev. Financ. Anal. 2023, 86, 102504. [Google Scholar] [CrossRef]
- Yang, D.; Jiao, X.; Liao, W. Audit Risk and Green Innovation in SMEs. Financ. Res. Lett. 2025, 76, 106978. [Google Scholar] [CrossRef]
- Chang, K.; Luo, D.; Xing, K.; Mi, B. The effectiveness of the green bond instrument on stimulating firms’ green innovation performance: A comparative study based on Chinese market. Pac.-Basin Financ. J. 2025, 91, 102706. [Google Scholar] [CrossRef]
- Zhang, X.; Jiang, F.; Liu, H.; Liu, R. Green finance, managerial myopia and corporate green innovation: Evidence from Chinese manufacturing listed companies. Financ. Res. Lett. 2023, 58, 104383. [Google Scholar] [CrossRef]
- Wang, L.; Zhao, C.; Gan, Y.; Ni, X. Financial Flexibility, Organizational Resilience and Corporate Green Innovation. Financ. Res. Lett. 2025, 76, 106917. [Google Scholar] [CrossRef]
- Liu, X.; He, Z.; Deng, Z.; Poddar, S. Analysis of Spatiotemporal Disparities and Spatial Spillover Effect of a Low-Carbon Economy in Chinese Provinces Under Green Technology Innovation. Sustainability 2024, 16, 9434. [Google Scholar] [CrossRef]
- Zhang, Q.; Wang, Y.; Chen, Q. Green Bond Issuance and the Spillover Effect of Green Technology Innovation from the Perspective of Market Attention: Evidence from China. Systems 2024, 12, 399. [Google Scholar] [CrossRef]
- Zhou, J.; Li, Y.; Tian, J.; Ma, Z. The Spatial Effect and Threshold Characteristics of Green Technological Innovation on the Environmental Pollution of Thermal Power, etc., Air Pollution-Intensive Industrial Agglomeration in China. Processes 2022, 11, 43. [Google Scholar] [CrossRef]
- Wen, H.; Shi, J.; Lu, P. Can green technology innovation reduce the operational risks of energy-intensive enterprises? Systems 2023, 11, 194. [Google Scholar] [CrossRef]
- Miao, C.; Fang, D.; Sun, L.; Luo, Q. Natural resources utilization efficiency under the influence of green technological innovation. Resour. Conserv. Recycl. 2017, 126, 153–161. [Google Scholar] [CrossRef]
- Zeng, P.; Xiao, J. Can the Yangtze River Economic Belt Development Strategy Enhance Regional Green Innovation Capability: Based on the Evidence from Quasinatural Experiments. Stat. Res. 2023, 40, 91–104. [Google Scholar]
- Kang, P.H.; Ru, S.F. Bilateral effects of environmental regulation on green innovation. China Popul. Resour. Environ. 2020, 30, 93–104. [Google Scholar]
- Yu, Y.Z. Research on technological Innovation Efficiency and Its Influencing Factors in China’s High-tech Industry-A Two-stage Analysis from the Perspective of value chain. Econ. Sci. 2009, 4, 62–74. [Google Scholar]
- Fan, F.; Lian, H.; Liu, X.; Wang, X. Can environmental regulation promote urban green innovation Efficiency? An empirical study based on Chinese cities. J. Clean. Prod. 2021, 287, 125060. [Google Scholar] [CrossRef]
- Fantozzi, I.C.; Olhager, J.; Johnsson, C.; Schiraldi, M.M. Guiding organizations in the digital era: Tools and metrics for success. Int. J. Eng. Bus. Manag. 2025, 17, 18479790241312804. [Google Scholar] [CrossRef]
- Zhang, H.; Zhang, K.; Yan, T.; Cao, X. The impact of digital infrastructure on regional green innovation efficiency through industrial agglomeration and diversification. Humanit. Soc. Sci. Commun. 2025, 12, 1–15. [Google Scholar] [CrossRef]
- He, F.; Hu, L.J.; Chen, L. The Effect of Financial Development on Industrial Green Technology Innovation Efficiency: Experience Analysis from 288 Cities in China. Sustainability 2024, 16, 5619. [Google Scholar] [CrossRef]
- Bevivino, P. Smart manufacturing in the food and beverage industry. Manuf. Confect. 2019, 99, 33–37. [Google Scholar]
- Chen, Y.; Han, Z.; Cao, K.; Zheng, X.; Xu, X. Manufacturing upgrading in industry 4.0 era. Syst. Res. Behav. Sci. 2020, 37, 766–771. [Google Scholar] [CrossRef]
- Arcidiacono, F.; Podrecca, M.; Schupp, F. Unraveling the path to smart manufacturing advancement: Insights from necessary condition and fuzzy-set qualitative comparative analyses. Ind. Manag. Data Syst. 2025. ahead-of-print. [Google Scholar]
- Shen, Y.; Zhang, X. Intelligent manufacturing, green technological innovation and environmental pollution. J. Innov. Knowl. 2023, 8, 100384. [Google Scholar] [CrossRef]
- Aceto, G.; Persico, V.; Pescapé. A Industry 4.0 and health: Internet of things, big data, and cloud computing for healthcare 4.0. J. Ind. Inf. Integr. 2020, 18, 100129. [Google Scholar] [CrossRef]
- Fantozzi, I.; Santolamazza, A.; Loy, G.; Schiraldi, M. Digital Twins: Strategic Guide to Utilize Digital Twins to Improve Operational Efficiency in Industry 4.0. Future Internet 2025, 17, 41. [Google Scholar] [CrossRef]
- Bastida, L.; Cohen, J.J.; Kollmann, A.; Moya, A.; Reichl, J. Exploring the role of ICT on household behavioral energy efficiency to mitigate global warming. Renew. Sustain. Energy Rev. 2019, 103, 455–462. [Google Scholar] [CrossRef]
- Fu, X.M.; Bao, Q.; Xie, H.; Fu, X. Diffusion of industrial robotics and inclusive growth: Labor market evidence from cross country data. J. Bus. Res. 2021, 122, 670–684. [Google Scholar]
- Ma, T.; Cao, X.; Zhao, H. Development zone policy and high-quality economic growth: Quasinatural experimental evidence from China. Reg. Stud. 2023, 57, 590–605. [Google Scholar] [CrossRef]
- Sun, Y.; Zhong, H.; Wang, Y.; Pan, Y.; Tang, D. The effect of green finance on the transformation and upgrading of manufacturing industries in the Yangtze River economic belt of China. Front. Environ. Sci. 2024, 12, 1473621. [Google Scholar] [CrossRef]
- Goldfarb, A.; Tucker, C. Digital economics. J. Econ. Lit. 2019, 57, 3–43. [Google Scholar] [CrossRef]
- Krugman, P. Increasing returns and economic geography. J. Political Econ. 1991, 99, 483–499. [Google Scholar] [CrossRef]
- Porter, M.E. Clusters and the New Economics of Competition; Harvard Business Review: Boston, MA, USA, 1998; Volume 76, pp. 77–90. [Google Scholar]
- Fan, C.C.; Scott, A.J. Industrial agglomeration and development: A survey of spatial economic issues in East Asia and a statistical analysis of Chinese regions. Econ. Geogr. 2003, 79, 295–319. [Google Scholar] [CrossRef]
- Gao, K.; Yuan, Y. The effect of innovation-driven development on pollution reduction: Empirical evidence from a quasinatural experiment in China. Technol. Forecast. Soc. Change 2021, 172, 121047. [Google Scholar] [CrossRef]
- Lehmann, E.E.; Schenkenhofer, J.; Vismara, S. Hidden champions and knowledge spillovers: Innovation-enhancing agglomeration effects and niche technology specificity. Small Bus. Econ. 2025, 1–21. [Google Scholar] [CrossRef]
- Hsu, P.H.; Tian, X.; Xu, Y. Financial development and innovation: Cross-country evidence. J. Financ. Econ. 2014, 112, 116–135. [Google Scholar] [CrossRef]
- Hong, J.; Gu, J.; Liang, X.; Liu, G.; Shen, G.Q.; Tang, M. Spatiotemporal investigation of energy network patterns of agglomeration economies in China: Province-level evidence. Energy 2019, 187, 115998. [Google Scholar] [CrossRef]
- Jin, M.; Chen, Y. Has green innovation been improved by intelligent manufacturing?—Evidence from listed Chinese manufacturing enterprises. Technol. Forecast. Soc. Change 2024, 205, 123487. [Google Scholar] [CrossRef]
- Nelson, R.R.; Phelps, E.S. Investment in humans, technological diffusion, and economic growth. Cowles Found. Discuss. Pap. 1966, 56, 69–75. [Google Scholar]
- Liu, T.; Li, Z.; Zhang, C.; Xia, Q. How comprehensive innovation reform pilot improve urban green innovation efficiency?—Evidence from China. Sustainability 2022, 14, 4550. [Google Scholar] [CrossRef]
- Ning, L.; Wang, F.; Li, J. Urban innovation, regional externalities of foreign direct investment and industrial agglomeration: Evidence from Chinese cities. Res. Policy 2016, 45, 830–843. [Google Scholar] [CrossRef]
- Jiang, L.; Wang, Y.; Zhang, J. Local-neighborhood effects of environmental regulations on green technology innovation in manufacturing: Green credit-based regulation. Front. Environ. Sci. 2022, 10, 1072180. [Google Scholar] [CrossRef]
- Ding, X.; Jing, R.; Wu, K.; Petrovskaya, M.V.; Li, Z.; Steblyanskaya, A.; Makarov, V.M. The impact mechanism of green credit policy on the sustainability performance of heavily polluting enterprises—Based on the perspectives of technological innovation level and credit resource allocation. Int. J. Environ. Res. Public Health 2022, 19, 14518. [Google Scholar] [CrossRef]
- Mao, J.; Liu, Y. The impact of undertaking industrial relocation on green innovation efficiency in the yellow river basin: A two-stage analysis from an innovation value chain perspective. Sustainability 2025, 17, 1581. [Google Scholar] [CrossRef]
- Beck, T.; Levine, R.; Levkov, A. Big bad banks? The winners and losers from bank deregulation in the United States. J. Financ. 2010, 65, 1637–1667. [Google Scholar] [CrossRef]
- Dong, B.; Gong, J.; Zhao, X. FDI and environmental regulation: Pollution haven or a race to the top? J. Regul. Econ. 2012, 41, 216–237. [Google Scholar] [CrossRef]
- Wang, C. How does manufacturing agglomeration affect urban ecological resilience? evidence from the Yangtze river delta region of China. Front. Environ. Sci. 2024, 12, 1492866. [Google Scholar] [CrossRef]
- Miguelez, E.; Moreno, R. Networks, diffusion of knowledge, and regional innovative performance. Int. Reg. Sci. Rev. 2017, 40, 331–336. [Google Scholar] [CrossRef]
- Huang, S.P.; Li, Y. The influence of HSR on technological innovation in urban agglomerations along the line. Econ. Issues Explor. 2018, 46, 38–46. [Google Scholar]
- Gao, L.N.; Zhang, H.D. Agglomeration economics, innovation spillover, and regional innovation performance. Ind. Technol. Econ. 2015, 34, 70–77. [Google Scholar]
- Porter, M. America’s green strategy. Bus. Environ. A Read. 1996, 33, 1072. [Google Scholar]
- Wang, X.; Feng, Y.; Qian, L.; Liang, F. Talent Introduction Policies, Optimal Labor Allocation, and Corporate Green Innovation. Sustainability 2025, 17, 1112. [Google Scholar] [CrossRef]
- Zhang, X.; Lü, W.; Lin, F. Can Scientific and Technological Talent Aggregation Accelerate Economic Growth? An Empirical Study. J. Syst. Sci. Inf. 2015, 3, 145–153. [Google Scholar] [CrossRef]
- Jiang, X.; Fu, W.; Li, G. Can the improvement of living environment stimulate urban innovation?—Analysis of high-quality innovative talents and foreign direct investment spillover effect mechanism. J. Clean. Prod. 2020, 255, 120212. [Google Scholar] [CrossRef]
Disclaimer/Publisher’s Note: The statements, opinions and data contained in all publications are solely those of the individual author(s) and contributor(s) and not of MDPI and/or the editor(s). MDPI and/or the editor(s) disclaim responsibility for any injury to people or property resulting from any ideas, methods, instructions or products referred to in the content. |
© 2025 by the authors. Licensee MDPI, Basel, Switzerland. This article is an open access article distributed under the terms and conditions of the Creative Commons Attribution (CC BY) license (https://creativecommons.org/licenses/by/4.0/).