4.1. Descriptive Analytics
In this paper, before the analysis, the collected data pre-processed through methods such as shrinkage and elimination to minimize the influence of extreme values and reduce the heteroskedasticity, thereby improving the accuracy and effectiveness of subsequent analyses. Details of the data collection and processing process can be found in
Table S1 of the Supplementary Materials. Subsequently, to grasp the overall traits of the sample, this paper uses STATA data processing software to carry out descriptive analysis of the collected data. The results are shown in
Table 1 below.
Based on the analysis above, the maximum value of Clean Energy Transition (CET) is 0.119, indicating that the use of clean energy has taken up a larger proportion of energy consumption in some regions, and that significant progress has been made in enhancing the energy framework and safeguarding the environment. The minimum value is 0, indicating that there are still some regions with very little clean energy transition and still rely heavily on fossil energy. Overall, the mean value of clean energy transition is 0.013, indicating average clean energy transition about country is still in primary stage. Median is 0.007, slightly lower than the mean value, and the data distribution is tilted to the left, implying that the progress of clean energy transition in most regions has not yet reached the average level, and the transition needs to be strengthened. The standard deviation is 0.018, indicating that although all regions are promoting clean energy transition, there are obvious differences in the progress and strength of transition. The maximum value for Digital Economy (DEC) is 0.142, indicating that some regions have made significant progress in DEC. The minimum value is 0.003, expressing that some regions are still at a very early stage in building the digital economy. Overall, the average value of the digital economy is 0.023, embodying that China’s DEC as a whole is still in its infancy. The median is 0.014, slightly lower than the mean, and the data distribution is tilted to the left, implying that the level of the digital economy in most regions has not yet reached the national average, and there is more room for improvement. The standard deviation is 0.024, signifying that there are clear disparities in the advancement of the digital economy across various regions. The maximum value of Upgrading of the Industrial Structure (UIS) is 3.806, indicating that some regions have achieved remarkable results in optimizing and upgrading their industrial structure, forming a highly developed and diversified industrial system. The minimum value is 0.371, indicating that the industrial structure of some regions is relatively homogeneous. Overall, the mean value of industrial structure upgrading is 1.145, indicating that China’s industrial structure is at a critical stage of transformation and upgrading. The median is 1.012, close to the mean but slightly lower, indicating that there are more regions with improvement of the industrial framework close to the average level. The typical deviation is 0.581, suggesting that there are variations in the advancement of industrial structure upgrading across different regions. The maximum value of technological innovation (TI) is 116,113, indicating that some regions are leading in the field of technological innovation. The minimum value is 33, indicating a relative lack of technological innovation activities in some regions. Overall, the mean value of technological innovation is 10,101.08, indicating that technological innovation has reached a certain scale, but the median value of 2363.5 is much lower than the mean value, indicating that the level of technological innovation in most regions is lower than the national average, and that there is a large room for improvement. The standard deviation is 20,856.6, indicating that different regions have large differences in technological innovation capability.
From the descriptive analysis of the control variables, the maximum value of economic growth (EG) is 180,844, which shows the growth strength of some economically developed regions. The minimum value is 14,876, which shows the relative lag of economic growth in some less developed regions. Overall, the mean value of economic growth is 59,977.4, indicating that the overall economy of China is currently at a medium level of development. The median is 50,467, which is slightly lower than the mean, indicating that the level of economic growth in most regions has not yet reached the national average. The standard deviation is 34,774.39, indicating that there are significant variations in the degree of economic growth among different regions. The maximum value of foreign direct investment (FDI) is 1,300,000, which shows that some regions with a significant level of economic openness and a favorable investment environment have attracted a large inflow of foreign capital. The minimum value is 52, indicating that some other regions still have much room for improvement in attracting foreign investment. Overall, the mean value of foreign direct investment is 95,909.79, suggesting that the country’s attractiveness to foreign investment is at a medium level. The median is 24,952.5, which is lower than the mean, indicating that the scale of FDI in most regions has not yet reached the national average. The standard deviation is 200,187.4, suggesting that there are significant disparities in the scale of FDI in different regions. The maximum value of trade openness (Open) is 1.809, indicating that some regions with a high degree of openness to the outside world are highly dependent on international trade for their economic activities. The minimum value is 0.001, which shows that some inland or relatively closed economic regions have a very low proportion of international trade in their economies. Overall, the mean value of trade openness is 0.203, indicating that China’s overall economy is moderately open. The median is 0.087, much lower than the mean, indicating that the trade openness of most regions has not yet reached the national average. The standard deviation is 0.311, indicating that there are large differences in trade openness among different regions. The maximum value of the consumption level (CL) is 55,162, and the minimum value is 13,054.2, indicating that the consumption level shows obvious regional differences. Overall, the mean value of the consumption level is 25,069.65, indicating that the overall consumption capacity of China is at a medium level. The median is 23,578.4, which is slightly lower than the mean, indicating that the consumption level of most regions has not yet reached the national average. The standard deviation is 8232.837, indicating that there is a big difference in consumption level between different regions. The maximum value of government support (GS) is 0.276, indicating that some local governments have invested more in public services. The minimum value is 0.033, indicating that some local governments invest relatively little in public service expenditures, and may face financial pressure or have different development priorities. Overall, the mean value of government support is 0.089, indicating that the average ratio of public service expenditures to GDP is moderate at the national level. The median is 0.077, slightly below the mean, indicating that the level of government support in most regions has not yet reached the national average. The standard deviation is 0.045, indicating that there are some differences in the level of government support in different regions.
4.2. Correlation Analysis
In order to have a preliminary understanding of the correlation between the variables, in this part, a Pearson correlation analysis was conducted on the variables, and the findings are presented in
Table 2 below.
Table 2 above demonstrates the correlation levels between the variables in this paper, and the correlation analysis of the core variables with Clean Energy Transition (
CET) shows that the correlation coefficient between Digital Economy (
DEC) and Clean Energy Transition (
CET) is 0.349, and its significance
p < 0.01 indicates that there is a significant correlation between Digital Economy (
DEC) and Clean Energy Transition (
CET). The correlation coefficient of industrial structure upgrading (
UIS) and clean energy transition (
CET) is 0.241, and its significance
p < 0.01 indicates that there is a significant correlation between
UIS and
CET. The correlation coefficient between technological innovation
(TI) and clean energy transition (
CET) is 0.176, and its significance
p < 0.01 indicates that there is a significant correlation between technological innovation
(TI) and clean energy transition (
CET).
From the correlation analysis of control variables with clean energy transition (CET), it can be seen that the correlation coefficient between economic growth (EG) and clean energy transition (CET) is 0.093, and its significance p < 0.01, suggesting that there is a strong relationship between EG and CET.
The correlation coefficient of foreign direct investment (FDI) and clean energy transition (CET) is 0.039, and its significance p < 0.05 indicates the significant correlation between FDI and clean energy transition (CET). The correlation coefficient of trade openness (Open) and clean energy transition (CET) is 0.176 and its significance p < 0.01 indicates that there is a significant correlation between trade openness (Open) and clean energy transition (CET). The correlation coefficient of Consumption Level (CL) and Clean Energy Transition (CET) is 0.192, and its significance p < 0.01 indicates that there is a significant correlation between Consumption Level (CL) and Clean Energy Transition (CET). The correlation coefficient of government support (GS) and clean energy transition (CET) is 0.066, and its significance p < 0.01 indicates that there is a significant correlation between government support (GS) and clean energy transition (CET).
The outcomes of the correlation analysis merely indicate a potential connection from two or two variables, but the mechanism of influence between multiple variables needs to be demonstrated by further regression analysis. Before regression, in order to avoid biased results caused by potential strong correlations between variables, the variables were tested for multicollinearity, as detailed in
Table 3 below.
According to
Table 4 below, the average VIF is 2.555, and each variable’s VIF is below the critical threshold of 10. This indicates that there is no significant multicollinearity among the variables, a point that can be further supported by regression analysis.
4.3. Benchmark Regression Results
There are many models for regression analysis, and when conducting the actual analysis, it is often necessary to use different models according to the nature of the panel data, so how to determine the applicable model for the panel data is crucial to the regression results. In this regard, we often use F-test and Hausman test to choose. According to the results of the F-test, we can choose between mixed regression model and fixed effect regression model, while the Hausman test can help us distinguish between the fixed effect regression model and the random effect regression model. The test shows that F (279, 2514) = 10.22 and
p = 0.0000 < 0.05, which shows that the fixed effect model outperforms the mixed OLS model in terms of model selection. Another Hausman test found that chi
2 (3) = 16.93 and
p = 0.0007 < 0.05, which shows that the fixed effect model is superior to the random effect model in terms of model selection. Therefore, before the subsequent study is adopted in conducting the research, taking into account the different data units and magnitudes used in this paper may have a significant impact on the results of the study, this paper will be standardized when conducting the study to eliminate the differences in the scale of the information among the data so that data of different magnitudes or units can be analyzed on the same scale.
Table 5 below shows the study of the influence of the
DEC on the
CET, where column (1) is the study of the impact of the digital economy on the clean energy transition without controlling for other factors and without fixing for individual and time effects. Column (2) is a study of the influence of the
DEC on the
CET, controlling for other factors and fixing only individual effects. Column (3) is for other factors and fixing only time effects. Column (4) is a study of the impact of the digital economy on the clean energy transition, controlling for other factors and fixing individual and time effects.
As can be seen in column (1) of
Table 5, the regression coefficient of Digital Economy (DEC) on Clean Energy Transition (
CET) without controlling for other factors and without fixing for individual and time effects is 0.3492, which passes the test of significance at the 1% level. Column (2) shows that the regression coefficient of Digital Economy (
DEC) on Clean Energy Transition (
CET) is 0.4037, which passes the test of significance at the 1% level, controlling for other factors and fixing for individual effects only. Column (3) shows that the regression coefficient of Digital Economy (
DEC) on Clean Energy Transition (
CET), controlling for other factors and fixing only the time effect, is 0.4881, which passes the test of significance at the 1% level. Column (4) shows that the regression coefficient of digital economy (
DEC) on clean energy transition (
CET) is 0.3572, which passes the test of significance at the 1% level, controlling for other factors and fixing the individual and time effects. From the previous analysis, it can be seen that Digital Economy (
DEC) has a significant positive effect on Clean Energy Transition (
CET) and the regression results are highly consistent with the previous hypothesis. Such a result may be due to the fact that, on the one hand, the booming development of digital economy provides strong technical support for clean energy transition. In the era of digital economy, cutting-edge technologies such as big data, cloud computing, the Internet of Things (
IoT), and artificial intelligence have been widely used, and these technologies not only promote the transformation and upgrading of traditional industries but also bring revolutionary changes to the development and utilization of clean energy. For example, through big data analysis, energy demand can be predicted more accurately, optimize energy allocation, and reduce energy waste; cloud computing technology makes the production and distribution process of clean energy more intelligent, and improves the efficiency of energy use; and the application of the Internet-of-Things technology realizes remote monitoring and maintenance of clean energy equipment and reduces operating costs. The integration and application of these technologies provides strong technical support for clean energy transformation and promotes the rapid development of the clean energy industry. On the other hand, the digital economy has created a favorable social atmosphere for clean energy transformation by enhancing public awareness of environmental protection and promoting the popularization of green and low-carbon lifestyles. With the wide application of digital technology, the public’s cognition and understanding of clean energy has been deepening, and the desire and pursuit of a green and low-carbon life become stronger. The formation of this social atmosphere not only promotes the rapid development of the clean energy market but also promotes the continuous innovation and upgrading of clean energy technology.
Simultaneously, the DEC also enhances the engagement and communication between the public, government, and enterprises through channels such as social media and online platforms, promoting the formulation and implementation of clean energy policies that are more in line with public opinion and market demand.
4.4. Robustness Test
To guarantee the dependability and consistency of the research findings, this paper plans to employ two approaches for robustness testing. One approach involves excluding municipalities that are directly governed by the central government, as these areas typically exhibit higher economic development, superior infrastructure, and more abundant policy resources, which may have a significant impact on clean energy transition. Therefore, this paper deletes the samples of municipalities (Beijing, Shanghai, Tianjin, Chongqing) to improve the accuracy and reliability of the study. The results of the analysis are shown in Column (1) of
Table 5, which shows that after deleting municipality samples, the regression coefficient of Digital Economy (
DEC) on Clean Energy Transformation (
CET) is 0.3699, which passes the test of significance at the 1% level. It can be seen that after deleting the group of municipalities that are directly governed by the authority government, the results of the positive impact of the
DEC on the clean energy transition (
CET) did not change, which is consistent with the previous regression results, indicating that the overall robustness of this study is good. The second method is quantile regression, which is used for robustness testing. This approach verifies whether the impact of the
DEC on the clean energy transition remains consistent across different quantiles. This consistency enhances the credibility of the research conclusions. As shown in
Table 5, column (2), the
DEC has a positive impact on the
CET at various quantile points. The regression coefficients are always positive and all of them pass the significance test at the 1% level. It can be seen that after the quantile regression, the positive effect of
DEC on
CET is significant and stable at different quantile points, which aligns with the earlier regression findings, suggesting that the overall reliability of this study is strong.
4.5. Endogeneity Analysis
In order to avoid the effect of endogeneity among different indicators, this paper uses the generalized method of moments estimation (GMM) with first-order differencing to estimate the model and further test the endogeneity problem. Considering that the digital economy and clean energy transition will not change rapidly in the short term, there may be a certain trend in the digital economy. Considering that there could be a reciprocal causal connection involving the DEC and the clean energy transition, this paper takes the lag period of the core explanatory variable digital economy indicator as an instrumental variable and uses the first-order difference generalized moment estimation method (GMM) to construct a dynamic panel model to further test the endogeneity problem. On the one hand, the current level of clean energy transition will not affect the development of the DEC in the previous period and meet the exogenous requirements of instrumental variables. Conversely, the development of the DEC usually has the characteristics of path dependence and technology accumulation, and there is a strong relationship between the development level of the DEC in the early stage and the current period, which meets the correlation condition of instrumental variables.
In addition, to address the potential issue of endogeneity and over-identification of instrumental variables in differential GMM analysis, the following two tests were conducted. Firstly, an autoregressive) test (AR test) was conducted with the aim of testing whether a model serial correlation exists. It is based on an autoregressive model that verifies the existence of a continuous linear correlation in the data by calculating the autocorrelation coefficient of the data. The purpose of this test is to confirm the appropriateness of the chosen GMM estimation method as well as to verify the presence of serial correlation in the model. In column AR(1) in
Table 6, the results of the first order serial correlation test are provided. AR(2) provides the results of the second order serial correlation test. Next, Hansen’s test was conducted to test the validity of the instrumental variables and the consistency of the GMM estimation method. The purpose of this test is to ensure that the instrumental variables fulfill the relevant identification conditions and to verify the reliability of the GMM estimation method.
According to
Table 6, it can be seen that the
p-value of AR(1) is less than 0.05, which indicates significance, while the
p-value for the AR(2) model exceeds 0.05, suggesting that non-significance. This indicates that there is no serial correlation present in the regression, suggesting that the model successfully addresses the endogeneity issue. The result of Hansen test indicates that the
p-value of instrumental variables is greater than 0.1, suggesting that the instrumental variables are valid and there is no over-identification problem. The regression coefficient of 0.134 for Digital Economy (
DEC) on Clean Energy Transition (
CET) passes the test of significance at 10% level. It can be seen that the result that the Digital Economy (
DEC) has a positive effect on the Clean Energy Transition
(CET) has not changed, which means that the endogeneity problem does not affect the findings above, and the endogeneity test is passed.
4.6. Influence Mechanism Test
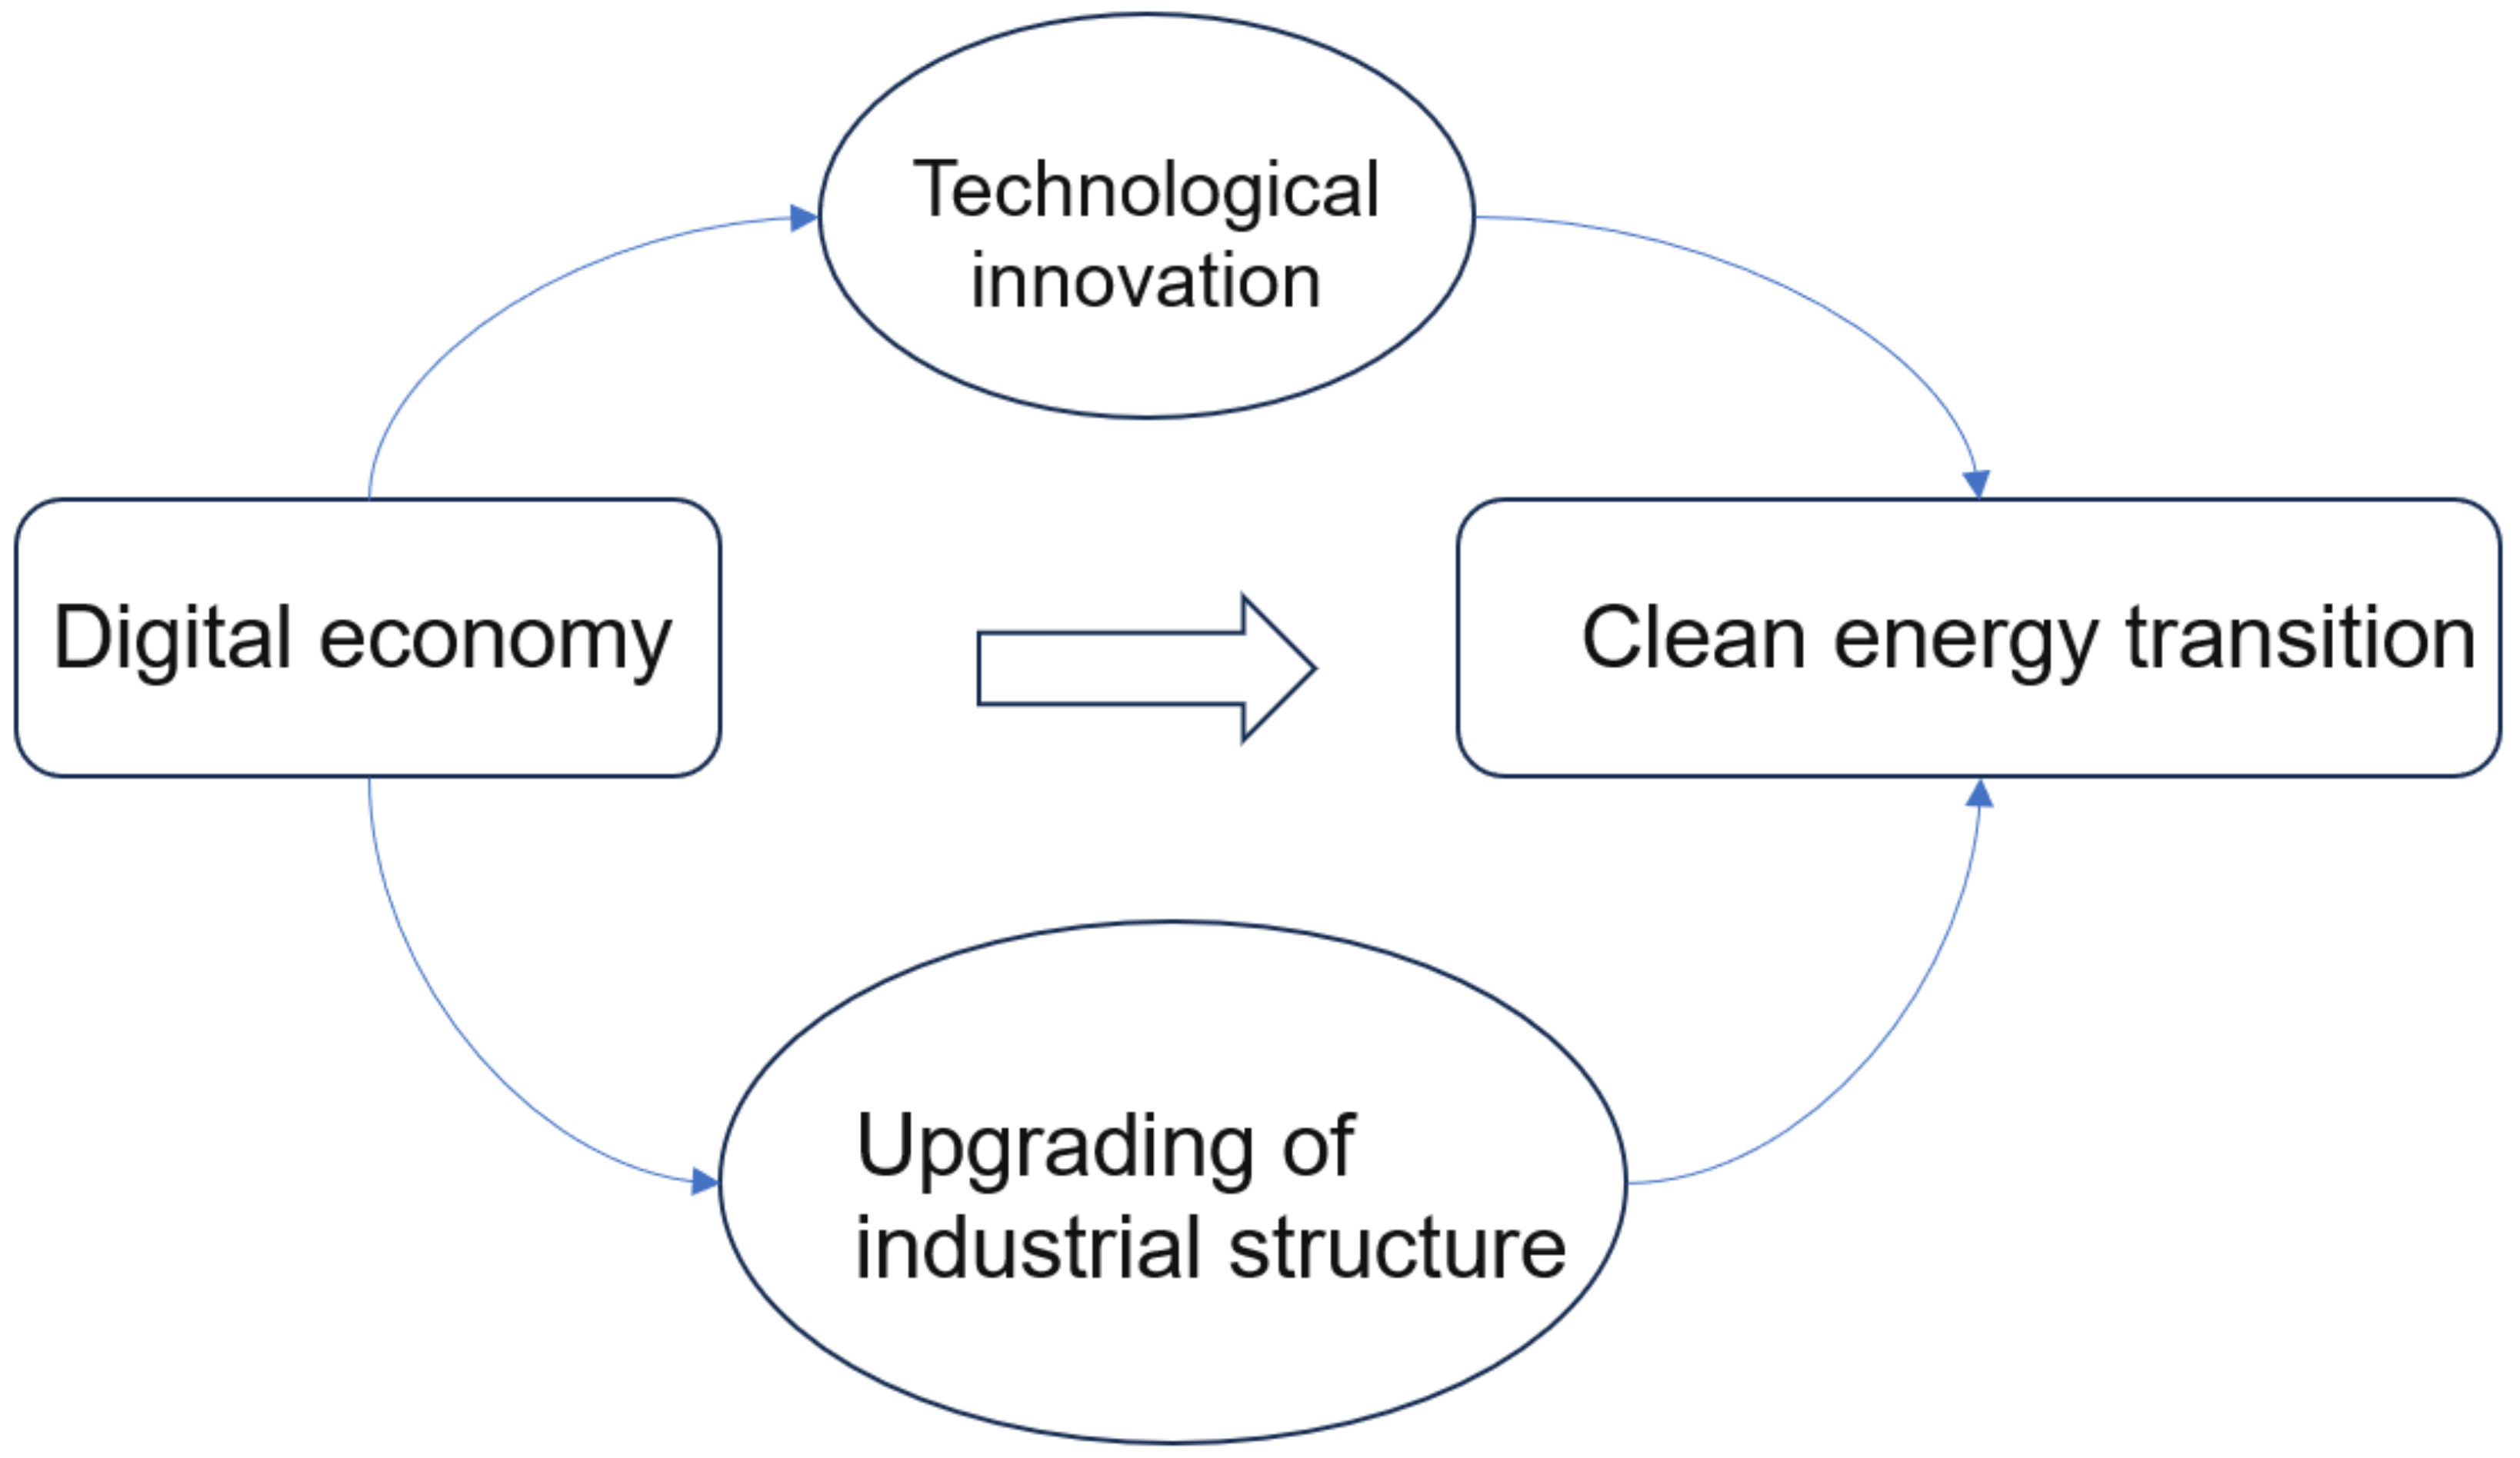
Based on the results of the previous study, it is evident that the development of the digital economy can significantly promote the clean energy transformation. But through what specific mechanisms does the digital economy influence the clean energy transformation? The theoretical analysis part puts forward the hypothesis that the impact of digital economic development on clean energy transformation is realized through two channels: technological innovation and industrial structure upgrading. This paper adopts the mediation effect model to verify the two impact channels of technological innovation and industrial structure upgrading.
The core of the two-step test is to assess the influence of the independent variable on the dependent variable and then assess independent variable on the mediating variable. As for effect from the mediator variable on the dependent variable, it is proved by the conclusions of existing studies. Considering that the first step has already been discussed in the Benchmark Regression section, this section will focus on subsequent steps and avoid repeating previously covered content. According to the results of
Table 7, it can be seen that in column (1), the regression coefficient of digital economy (
DEC) to industrial structure upgrading (
UIS) is 0.0340, which passes the significance test at the 10% level, which shows that the digital economy has a significant positive impact on industrial structure upgrading, and the second step of the corresponding test is established. At the same time, existing studies have proved that there is a significant positive correlation between industrial structure upgrading (
UIS) and clean energy transition (
CET), and when the industrial structure is further upgraded (
UIS), regional clean energy transition (
CET) will also be further developed.
The above results show that the development of the DEC can promote the clean energy transition by promoting the upgrading of the industrial structure. This result is mainly because of the ongoing improvement of the industrial framework and the rapid development of emerging industries driven by the digital economy. This growth not only raises the overall level of wealth in society but also provides an ample source of funding for the investment in green industries such as clean energy. At the same time, with the upgrading of the industrial structure, the energy consumption structure has also undergone significant changes, and the proportion of clean energy in energy consumption has been increasing, laying a solid foundation for the green transformation of the energy structure. In the same way, the regression coefficient of digital economy (DEC) to technological innovation (TI) is 0.2872, which passes the significance test at the level of 1%, which shows that the digital economy has a significant positive impact on technological innovation, and the second step of the corresponding test is established. At the same time, existing studies have shown a positive correlation between technological innovation (TI) and clean energy transition (CET). It is evident that the development of the DEC can promote the clean energy transition by promoting technological innovation This result may be due to the rapid development of cutting-edge technologies like big data, cloud technology, and AI, driven by the digital economy, which not only provide powerful tools for clean energy research and development but also promote continuous innovation and breakthroughs in clean energy technology.
Through the empowerment of the DEC, the production efficiency of clean energy can be improved, the cost can be reduced, and the reliability can be enhanced, thus laying a solid foundation for the widespread application of clean energy. The innovation of clean energy technology is not only reflected in the breakthrough of the technology itself but also in the expansion and deepening of technology application. On the one hand, the innovation of CET has promoted the development of the clean energy industry, making the proportion of clean energy in the energy structure continue to increase, providing strong support for the optimization and transformation of the energy structure. On the other hand, technological innovation has also promoted the commercialization of clean energy technology, making the application of clean energy technology more extensive and deeper, creating favorable conditions for the acceleration of clean energy transformation.
4.7. Analysis of Regional Heterogeneity
Considering that the promotion effect of the
DEC on clean energy transition may show heterogeneity in various areas because of the significant differences in the degree of economic development among Chinese regions, the paper divides the sample of the study into three regions, namely, East, Central, and West, according to the provinces they belong to for regression analysis. Among them, 12 provinces and municipalities directly under the central government, including Beijing, Tianjin, Hebei, Liaoning, Shanghai, Jiangsu, Zhejiang, Fujian, Shandong, Guangdong, Guangxi, and Hainan, are divided into the eastern region; 9 provinces and autonomous regions, including Shanxi, Inner Mongolia, Jilin, Heilongjiang, Anhui, Jiangxi, Henan, Hubei, and Hunan, are divided into the central region; and 9 provinces, namely, Chongqing, Sichuan, Guizhou, Yunnan, Shaanxi, Gansu, Ningxia, Qinghai, and Xinjiang, autonomous regions and municipalities directly under the central government are divided into the western region, and the results of regional heterogeneity analysis are shown in
Table 8.
The outcomes are shown in
Table 8. For the eastern region, the regression coefficient of the
DEC on the clean energy transition (
CET) is 0.1696, which passes the significance test at the 1% level. In the central region, the regression coefficient of the
DEC on the clean energy transition (
CET) is 0.4877, which passes the significance test at 1% level. For the western region, the regression coefficient of the
DEC on the clean energy transition (
CET) is 0.5584, which passes the significance test at 1% level. It can be seen that the digital economy in the western region has a stronger role in promoting the clean energy transition. Such a result is mainly due to the fact that the western region has a unique advantage in terms of clean energy resources. The western region has plentiful renewable energy sources such as solar energy and wind energy, and the development and utilization of these resources are important for promoting the clean energy transformation. The rapid development of the digital economy has provided strong support for the intelligent and efficient utilization of these resources, thus accelerating the process of clean energy transformation. In contrast, the central and eastern regions may have certain limitations in terms of clean energy resources. Although these regions are also rich in energy resources, the types and quantities of their clean energy resources may be more limited compared to those in the western region. In addition, the central and eastern regions may be more dependent on traditional energy industries, such as coal, oil, and natural gas, in their economic development. While these traditional energy industries drive economic growth, they also put greater pressure on the environment. As a result, the central and eastern regions may face greater challenges and difficulties in promoting the clean energy transition, thus weakening the facilitating role of the digital economy in the clean energy transition.
4.8. Analysis of Heterogeneity in Economic Growth Levels
The level of economic growth reflects the economic vitality and development potential of a region, and some noticeable differences in resource allocation, industrial structure, and policy orientation among regions with different levels of economic growth. These differences may lead to different impacts of digital economy on clean energy transition. Therefore, this paper divides the sample into two groups for in-depth analysis based on the median economic growth level in order to explore the differences in the role of digital economy in different economic contexts, and the specific analysis is shown in
Table 9.
The regression results, as shown in
Table 9, show that in high economic growth regions, the regression coefficient of
DEC on
CET is 0.1849, which passes the significance test at the 1% level. In the low economic growth region, the regression coefficient of the
DEC on the
CET is 0.5103, which passes the significance test at 1% level. hese findings suggest that the development of the
DEC in low economic growth regions has a stronger contribution to the clean energy transition. Such a result is mainly due to the fact that high economic growth regions tend to have more developed economic systems and diversified industrial structures, and these regions may be more complex and diversified in terms of energy consumption and energy structure.
The process of promoting the clean energy transition in the high-economic-growth regions may face more challenges and difficulties, such as the modernization and enhancement of conventional energy sectors, the innovation and implementation of clean energy technologies, as well as the competition and oversight of energy markets. These challenges and difficulties may, to some extent, undermine the facilitating role of the digital economy in the clean energy transition. In contrast, low economic growth regions may be more homogeneous and backward in terms of the economic structure and development stage, with relatively simple energy consumption and the energy structure. These regions may be more dependent on external technical support and financial inputs in promoting the clean energy transition, and the
DEC is one of the important ways to provide such support and inputs. Through the application and promotion of digital technologies, low economic growth regions can make more effective use of clean energy resources, improve energy use efficiency, and reduce environmental pollution, thereby accelerating the process of clean energy transition. The relevant data analysis is shown in
Table 10 below.
4.9. Analysis of Spatial Spillover Effects
In this paper, the reciprocal of the geographical distance between cities is used to construct the spatial weight matrix, and the findings suggest that the Moran index of the
DEC on the
CET from 2013 to 2022 passes the significance test at the 1% level. After determining the existence of spatial effects, the LM test and the Hausman test were further used in this paper, and the test results rejected the null hypothesis of random effects, so the fixed-effect spatial Durbin model was used. At the same time, the Wald test is also used to analyze whether the spatial Durbin model will degenerate into a spatial autoregressive model or a spatial error model, and the test results show that the study is suitable for the spatial Durbin model, and the final regression results can be seen in
Table 11.
According to the specific results in the table, the indirect effect of the DEC is 0.713, and p < 0.01, indicating that there is a significant positive spillover effect of the DEC on the CET at the 1% significant level. That is, the development of the DEC will increase by 1 unit, which will promote the CET in the surrounding area by 0.713 units. It can be concluded that the DEC can significantly contribute to the CET not only in the region but also in the surrounding areas. The reason for the above results may be that the digital economy itself is based on advanced information technology, and the development process is accompanied by the generation and dissemination of a large number of new technologies. Different regions are not developing in isolation in the field of digital economy but through multiple channels for technological exchanges and cooperation. When the digital economy of a certain region develops rapidly, the new energy management technology of the region can quickly spread to the surrounding areas through technical cooperation and other means. By learning from these advanced technologies, the surrounding areas can improve their own clean energy technology level, thereby accelerating the process of the local clean energy transformation.


