Article

Ethanol Content Increase in Gasoline Toward Sustainable Liquid Fuels Worldwide: Impacts on Manufacturing and Supply Chains via Discrete-Event Scenarios

by
Mahmoud Ahmednooh
1,2,3,* and
Brenno Menezes
3
1
Division of Engineering Management and Decision Sciences, College of Science and Engineering, Hamad Bin Khalifa University, Qatar Foundation, Doha P.O. Box 3212, Qatar
2
Production Planning and Scheduling, Um Said Refinery, Qatar Energy, Doha P.O. Box 34110, Qatar
3
Blend-Shops Company, Qatar Science and Technological Park, Qatar Foundation, Doha P.O. Box 3212, Qatar
*
Author to whom correspondence should be addressed.
Sustainability 2025, 17(11), 4884; https://doi.org/10.3390/su17114884
Submission received: 10 February 2025 / Revised: 6 March 2025 / Accepted: 11 March 2025 / Published: 26 May 2025

Abstract

Biofuels, such as ethanol (CH3CH2OH), remain significantly underutilized globally despite their potential to mitigate environmental effects associated with fossil fuel combustion. Ethanol (ETH) can seamlessly blend with petroleum-derived gasoline, boosting its octane rating as a virtuous side effect. However, in several countries, octane number (ON) boosters such as methyl-tert-butyl-ether (MTBE) are still blended into the gasoline (also known as gas or petrol) sold in fuel stations, despite this being restricted or banned due to deleterious effects on the environment and health. Additionally, in nations overproducing naphtha from refining petroleum condensates, such as in the Middle East, investments in extra carbon chain rearrangement units can be an outlet to enhance gasoline production, since they produce high-ON streams; however, aromatic concentration becomes a limiting constraint. A discrete-event simulation algorithm combines sixteen main (primary) manufacturing variations into two secondary manufacturing and three supply chain variations, building gasoline yield and property plots over 512 gasoline production scenarios.

1. Introduction

ETH is an alternative fuel to fossil fuel products such as gasoline, used either as a complete or partial replacement. As a renewable energy source in motor engines, ETH (CH3-CH2-OH) is more environmentally friendly than fossil fuels in light fleet vehicles. It also stands as an alternative to ON additive boosters like MTBE with ETH, boasting a typical research octane number (RON) of 108 [1]; this is around 10 points below MTBE but 40 points higher than raw naphtha, a key precursor to petroleum-refined gasoline. Hence, incorporating ETH into gasoline blends enhances the fuel’s octane rating by boosting the motor engine’s performance, preventing knock or spontaneous ignition before the electrical spark; it also contributes to mitigating greenhouse gas (GHG) emissions, since the exhausted CO2 from the engine’s internal combustion related to the ETH component is primarily equivalent to that sequestered during the growth of ETH’s biomass raw materials (such as sugar cane, corn, and beetroot).
In regions such as the United States and Canada, ETH is commonly used in the market as E10–E15 gasoline, a blend containing 10–15% anhydrous ETH and 90–85% mineral gasoline [2]. In contrast, Brazil incorporates 27% ETH (by volume) into its gasoline and boasts the largest fleet of flex-fuel vehicles, capable of operating on any combination of ETH and gasoline [3]. In Europe, ETH is blended at a lower proportion of 5% by volume. However, MTBE remains a necessary component of the gasoline pool to meet ON specifications, despite the ban of MTBE in the USA, Canada, and Brazil, among other nations. According to EU Directive 98/70/EC, gasoline is permitted to contain up to 15% MTBE by volume. However, actual MTBE concentrations in European gasoline are much lower, averaging approximately 2–3% by volume [4].
Furthermore, considering gasoline production, as seen in Figure 1, naphtha-reforming units play a pivotal role in converting distilled or straight-run raw naphtha into reformate or reformed streams, which are essential components for boosting octane ratings in gasoline pools. Among the gasoline components for ON enhancement, and unlike ON additives such as MTBE that are added to the pool in small amounts, the output of the reforming units is considered the main quality-basic component of the gasoline pools.
The sustainability of the gasoline market goes beyond carbon footprint matters, and includes ON specification; this is a property constraint that, via manufacturing and supply chain maneuvers (flexibility), may help nations to adapt to the global shortage of high-octane gasoline and the ripple effects of this on the aromatics market, which highlights the critical need for reliable octane boosters. This has prompted a shift toward sustainable alternatives to aromatic components by using reformate units with ETH (enhancement in both carbon footprint and ON booster) rather than relying solely on increased MTBE (for ON only) in pure petroleum-refined gasoline (PPRG). ON boosters, which are essential for preventing engine knocking (premature ignition before the spark), became a key concern in 2022 as global gasoline demand surged unexpectedly. This demand spike was driven by the easing of COVID-19 restrictions and compounded by geopolitical tensions and reduced refinery capacities, which disrupted petroleum-derived supplies.
The surge in fuel demand strained gasoline supply chains, including ON boosters, regarding both refinery-based and external sources. The global reduction in refinery capacity intensified these pressures, as more than 10 small-scale refineries were shut down during the COVID-19 pandemic due to negative profit margins [6,7,8]. Additionally, the Russia–Ukraine conflict further disrupted supply chains. As a result, the availability of high-octane blend components from petroleum refining, such as aromatics (e.g., reformate and toluene), became limited, driving significant price hikes.
Aromatics, which serve as both gasoline blend components and feedstocks for petrochemicals, have seen their prices more than double in some cases due to rising demand and constrained supply. Looking ahead, experts predict ongoing challenges in meeting gasoline octane rating requirements, potentially leading to further ON booster shortages.
The economic viability of extracting aromatics for chemical applications remains uncertain amid volatile markets and increasing extraction costs; this creates substantial challenges for industry players as they navigate these manufacturing and supply chain complexities. Regardless of refinery design and production flexibility, alternative sources of ON boosters will be essential to address rising gasoline requirements toward sustainability. This need persists despite global consumption trends and governmental restrictions.
Since ETH acts as a quality-basic gasoline component, similar to MTBE and reformate streams (due to their inherent high ON), integrating it into the gasoline recipe provides operational flexibility in refinery plants. For example, when adding ETH, suppose that the targeted ON is met or surpassed in the gasoline pools; in this case, adjustments to the severity of the reformate process unit to a lower catalyst conversion mode can be made, given that the carbon chain cycling transformation in the reformate processes reduces the volume of the reformed output stream by producing hydrogen (H2) as a by-product, provoking material losses in the process unit (reformate) yields. Consequently, a complete shutdown of the reformate unit can be considered if the ON is not a concern in gasoline production, such as in a nation like Brazil, which uniquely adds 27% ETH by volume to its gasoline [5].
However, in places with low and no addition of ETH to gasoline, such as in the Gulf Cooperation Countries (GCCs), a reformate stream with the highest ON possible needs to be produced; this corresponds to operating the reformate unit in a high-severity mode. Furthermore, MTBE might still be added considerably to gasoline pools to meet ON needs when there is a total absence of ETH. For instance, it occurs at 15% by volume in Qatar [9]. The integration of ETH into gasoline blends offers a spectrum of advantages for petroleum refineries, including the following:
  • Increased gasoline production (by reducing reformate stream losses when in low-ON mode);
  • Enhanced profitability (since the price of ETH is lower than mineral gasoline);
  • Mitigating CO2 emissions via the incorporation of renewable fuel components [10];
  • The potential to cease the utilization of ON boosters such as MTBE (which is already banned or restricted in most nations) [4].
This analysis underscores the manifold benefits and strategic opportunities associated with adopting ETH as a key component in pursuing a more sustainable and profitable fuel industry. ETH acts as a quantity-basic gasoline component (QTB-GC), e.g., in straight-run light naphtha (LN) and hydrotreated light cracked naphtha (HTLCN) streams, as well as a quality-basic gasoline component (QLB-GC), e.g., in reformed naphtha (RFN) streams. The interplay of the gasoline-component drivers, encompassing petroleum refinery manufacturing, ETH supply chains, and national policies and resources toward sustainable gasoline production and recipes, demands that manufacturer-made and supply chain gasoline-component dimensions (within their degrees of freedom) be researched to elucidate their effects toward ETH increases in gasoline for sustainable liquid fuels worldwide.
This study makes the following key contributions to the field of sustainable fuel production:
  • Comprehensive analysis of ETH integration: We evaluate the integration of ETH into gasoline blends, considering both manufacturing (refinery operations) and supply chain (external inputs such as MTBE and heavy naphtha) dimensions, and providing a holistic view of sustainable fuel production;
  • Discrete-event simulation model: A discrete-event simulation model was developed to analyze over 512 scenarios, examining variations in refinery operations, supply chain inputs, and policy constraints. This approach allows for a detailed evaluation of gasoline production in terms of both quantity (yield) and quality (octane rating);
  • Synergistic effects of ETH and other components: We explore the synergistic effects of combining ETH with other gasoline components, such as MTBE and reformate streams, across multiple refinery sites; this provides insights into how ETH can reduce or eliminate the reliance on MTBE while maintaining or improving octane ratings;
  • Tailored solutions for different regions: The findings provide a framework for nations to adopt ETH in gasoline blends tailored to their unique regulatory and resource constraints. This is particularly relevant for regions with varying levels of ETH adoption, such as the Middle East, Europe, and North America;
  • Carbon footprint reduction: The study highlights the potential for ETH to reduce the carbon footprint of gasoline production, aligning with global sustainability goals and reducing greenhouse gas emissions;
  • Practical insights for refinery operations: This research offers practical insights for refinery operators, including strategies for adjusting reformate unit severity, optimizing gasoline blends, and reducing material losses, thereby enhancing profitability and sustainability.

2. ETH and Gasoline Interplay with Geopolitics

The ETH content in gasoline worldwide varies, as seen in Figure 2. Among the nations or regions in the plot, there are several reasons for their current state of ETH blending in gasoline:
  • Arable land for ETH production;
  • Public policies toward renewable energy and de-risking dependence on fossil fuels;
  • Overproduction of light petroleum (crude oil and condensate streams);
  • Banning or restricting MTBE from the gasoline pool.
Figure 2. ETH content in gasoline [11,12,13].
Sustainability 17 04884 g002
Today, the USA and Brazil, together, account for 82% of global ETH production [14]. Particularly, a national program in Brazil called Pro-Alcohol, which aimed to de-risk the supply of petroleum and derivatives, was launched in the wake of the Iran and Iraqi War in 1979, regarding the so-called Second Oil Crisis [15]. By that time, a new segment of the light vehicle fleet (LVF) had engines adapted to be fueled exclusively by hydrous ETH (at 4% of water in volume). Today, anhydrous ETH (no water content) contributes to 27% of the gasoline sold in fuel stations in Brazil [3], selling E73-grade gasoline (27% anhydrous ETH and 73% mineral gasoline). Moreover, the flex-fuel fleet of the LFV in the country is expected to reach 80% by 2024 [16]; the fleet can be fueled by pure refined gasoline, ETH, or any combination of both.
On the other hand, due to their overproduction of light petroleum and lack of arable land, most Middle Eastern countries have zero ETH content in their gasoline. In this case, to reach the specified octane rating in gasoline—which the results of this article address—it is necessary to add a considerable amount of MTBE. However, due to the deleterious effects of this component on health and the environment, several nations have banned its utilization as an ON booster in gasoline [17].
Countries such as India, with a population surpassing one billion, can add ETH at 10% to their gasoline based on national production, which represents 5% of global [18] production, and some imports of this biofuel (Renewable Fuels Association, 2022). ETH also needs to be imported into Europe because of its reduced production and low efficiency related to the conversion of beetroot sugars to alcohols (-CH2-OH) as ETH. In its majority, ETH is converted from sugar cane in Brazil and corn in the USA. However, new ETH production plants in Brazil have been designed from the grassroots level to be flexibly raw-material-based, enabling the process of both sugar cane and corn [16].
China, a major player in the global liquid fuels market, holds 20% of the world’s total car fleet and is the third-largest ethanol (ETH) producer after the USA and Brazil, accounting for approximately 2% of global production [13]. Integrating ETH into the nation’s gasoline pool is challenging due to China’s massive market size, which would require unprecedented levels of biofuel consumption if such an energy policy were implemented [19]. The authors of [10] developed a triple-perspective analysis framework (raw material resource, vehicle, and infrastructure) and concluded that China should focus on developing 1.5-generation (1.5G) ETH under its specific conditions. Unlike 1G ETH, which is derived from food crops like wheat, corn, sugarcane, and beetroot, and 2G ETH, which uses non-food biomass like agricultural residues and lignin, 1.5G ETH is produced from non-food crops such as cassava, sweet sorghum, and sweet potatoes. These crops can grow on marginal lands, making them more sustainable and less competitive with food production [20]. The production cost of 1.5G ETH is slightly higher than 1G ETH but significantly lower than 2G ETH, positioning it as a viable intermediate solution [10]. Currently, China is piloting E10 gasoline (a blend of 10% ethanol and 90% gasoline) in select provinces, with some regions offering it fully or partially at fuel stations [21]. This marks a significant step toward establishing a nationwide E10 market. Since 2016, the Chinese government has phased out subsidies for 1G ETH production, but continues to support 1.5G and 2G ETH through subsidies, reflecting their alignment with long-term sustainability and energy security goals [22].

3. ETH and Octane Rating Boosters in Gasoline

3.1. ETH and MTBE

A complete transition from MTBE to ETH in gasoline as a blending component is accompanied by complexities, primarily driven by the RON disparity between the two components. MTBE boasts a relatively high RON of 118.3, whereas ETH exhibits a notably lower RON at 108 [1]. This substantial difference in ON necessitates meticulous adjustments to the gasoline components to achieve an appropriate and well-balanced blend. One potential solution involves the production of higher-RON components from carbon-chain-rearranged naphtha (CCRN) by increasing the severity of the reformate unit; this has a cost in terms of reducing the volume of the reformed naphtha output and, consequently, higher H2 production as a side effect. Another solution for modifying the ON in the refinery site is to vary the catalytic cracking (CC) units’ modes of operation between maximum gasoline and maximum diesel by manipulating feed composition and spatial velocity, temperature, catalyst formulation, etc., in the process unit. Implementing adjustments in the petroleum refinery plant allows for increasing the availability of lower- or higher-ON refined gasoline components; this can be effectively combined with SC-related components with high ONs, such as the additives MTBE and ETH, in the production of the desired ON gasoline grades of 95 and 98 RON.
It is observed that the addition of MTBE to n-paraffins, iso-paraffins, and olefins results in a synergistic octane number effect (linearly by volume), and antagonistic blending is observed for MTBE blends with naphthenes and aromatics. The octane number and response of gasoline/MTBE blends depend on the composition of the base gasoline fuel produced from petroleum refining [23]. While most of the studies on MTBE and gasoline blends focus on the market and compare MTBE with other octane boosters, the authors of [24] studied the octane rating effect of blending MTBE (5–20 vol%) in reformate, jet fuels, and three Saudi gasoline fuels. They found that MTBE effectively boosts the octane numbers of gasoline without adversely affecting its other properties. They reported that adding 5 and 20 vol% MTBE increases the RON of gasoline by 1.9 and 11.8, respectively.
Regions such as the Middle East, motivated by ETH’s lower carbon footprint and ability to function as an ON booster in place of MTBE, necessitate strategic adjustments to their gasoline-blending practices toward sustainable liquid fuels worldwide. ETH provides a means to curtail MTBE usage within the blend, and, in certain instances, it represents a viable avenue for its complete substitution. This transition assumes pivotal importance because it facilitates the utilization of MTBE in alternative applications, or even creates opportunities for its exports. Moreover, the judicious integration of ETH into the blend carries the inherent benefit of augmenting gasoline production volumes. This increase in output not only caters to domestic consumption, but also generates surplus gasoline that can be efficiently channeled for exportation, thus providing a chance to bolster refinery profitability.

3.2. ETH and Carbon-Chain-Rearranged Naphtha

Despite its low ON, the latent value of raw naphtha (RWN) in the form of light and heavy naphtha (LN and HN), as seen in Figure 1, can be optimally harnessed through its integration into gasoline-blending components, given that gasoline inherently holds a higher market value than this unfinished material stream. In the global energy market, RWN constitutes a fundamental hydrocarbon product, primarily serving as a precursor or feedstock in producing various petroleum-derived products in the petrochemical and chemical industries. Inside the refinery walls, two main process units convert RWN to carbon-chain-rearranged naphtha using both the REF and ISO units. These conversions are crucial for improving the octane rating of the resulting gasoline product, meeting quality specifications, and enhancing the fuel’s efficiency in combustion engines.
The reformate (REF) unit is integral for producing high-ON components in a refinery. It accomplishes this by converting low-octane linear hydrocarbons (paraffins) in the distilled heavy naphtha (HN) stream into high-octane aromatic hydrocarbons via the generation of branched alkanes (isoparaffins), naphthenes (cyclic), and aromatics. Undesirably, it produces hydrogen (H2) as a by-product, reducing the quantity of reformate available in the reforming unit output. Alternatively, the unit can yield a higher molecular rearrangement regarding linear molecules to aromatics in HN, such as benzene–toluene–xylene (BTX), rather than incorporating it into blending; this enhances the refinery’s profitability by exploring higher-added-value markets in the petrochemical and chemical industries. Another alternative to boost the ON in gasoline is the inclusion of isomerization (ISO) processes, which use a distilled light naphtha (LN) stream as feedstock. LN typically contains straight-chain hydrocarbons; it can be transformed into branched isomers through isomerization. The goal is to convert, for example, the normal butanes and pentanes present in the LN streams into their isomeric forms, such as isobutane and isopentane.
Incorporating ETH into the gasoline blending process provides a practical approach to maximizing the quantity and quality of the final blend. Several countries, such as the USA, currently incorporate approximately 10% ETH into their gasoline blends, with the potential for further increases. Brazil, in particular, has made substantial strides, achieving blends of up to 27% ETH, and recent plans focus on increasing it up to 30% [12]; this paves the way for the addition of a low-RON component from the reformate units by reducing the severity and, therefore, the material losses of reformed naphtha, since lower amounts of H2 are produced. Moreover, it can be conjugated to the increased addition of stocked LN volumes in the gasoline pools. By including ETH as a component in the gasoline blends, the practice of naphtha (both LN and HN) exportation can be progressively diminished, ushering in a more sustainable and economically advantageous approach to resource utilization. As demonstrated, numerous variations in manufacturing—through design and operations within the petroleum refinery network—and in the supply chain, including imports of ETH, MTBE, and HN, significantly impact the quantity and quality of gasoline. Consequently, it is critical to investigate the interconnections between these variations and their effects on gasoline yields and properties. Such research is essential given the multiple pathways that can be adopted based on a nation’s resources, regulatory frameworks, and strategies for advancing toward more sustainable liquid fuels. The novelty of this work lies in its comprehensive approach, encompassing all possible variations in both manufacturing and supply chain parameters to evaluate gasoline production. This study aims to identify the optimal pathway tailored to each nation’s specific needs and circumstances, facilitating adaptation to any of the over 512 adopted scenarios presented in this work. Other examples of ETH in sustainable supply chains can be found in [25,26], and its integration into gasoline under environmental constraints can be found in [16].

4. Problem Statement: Gasoline Recipes

Figure 1 shows several process capabilities and trade-offs inside the refinery when producing so-called pure PPRG. The selection of the petroleum and given yields in the distillation columns, catalytic cracking (CC) routes, and CC modes of operations, in addition to the reformate modes—as previously explained—all play a role in gasoline production [27,28,29,30]. Moreover, decisions can be made to include secondary manufacturing process units to enhance the gasoline pool’s ON. Analyzing how these diverse manufacturing scenarios (endogenous factors) interplay with out-of-refinery-walls, exogenous, and supply chain (SC) choices—such as ETH blending and banning MTBE in producing sustainable liquid fuels—is the object of our study [1,23,31]. Particularly, the internalization of heavy naphtha (HN) to increase the feed of a second reformate unit (or just increased capacity) is included as an SC dimension for gasoline production. The algorithm that builds the scenarios from the combination of the primary and secondary manufacturing scenarios follows a process network structure considering process transformations with respect to the discrete-event selection in a downstream flow of raw materials to products (as in Figure 1); through this, the gasoline yield (quantity) and properties (qualities) such as RON and aromatics content (ARO) are calculated.

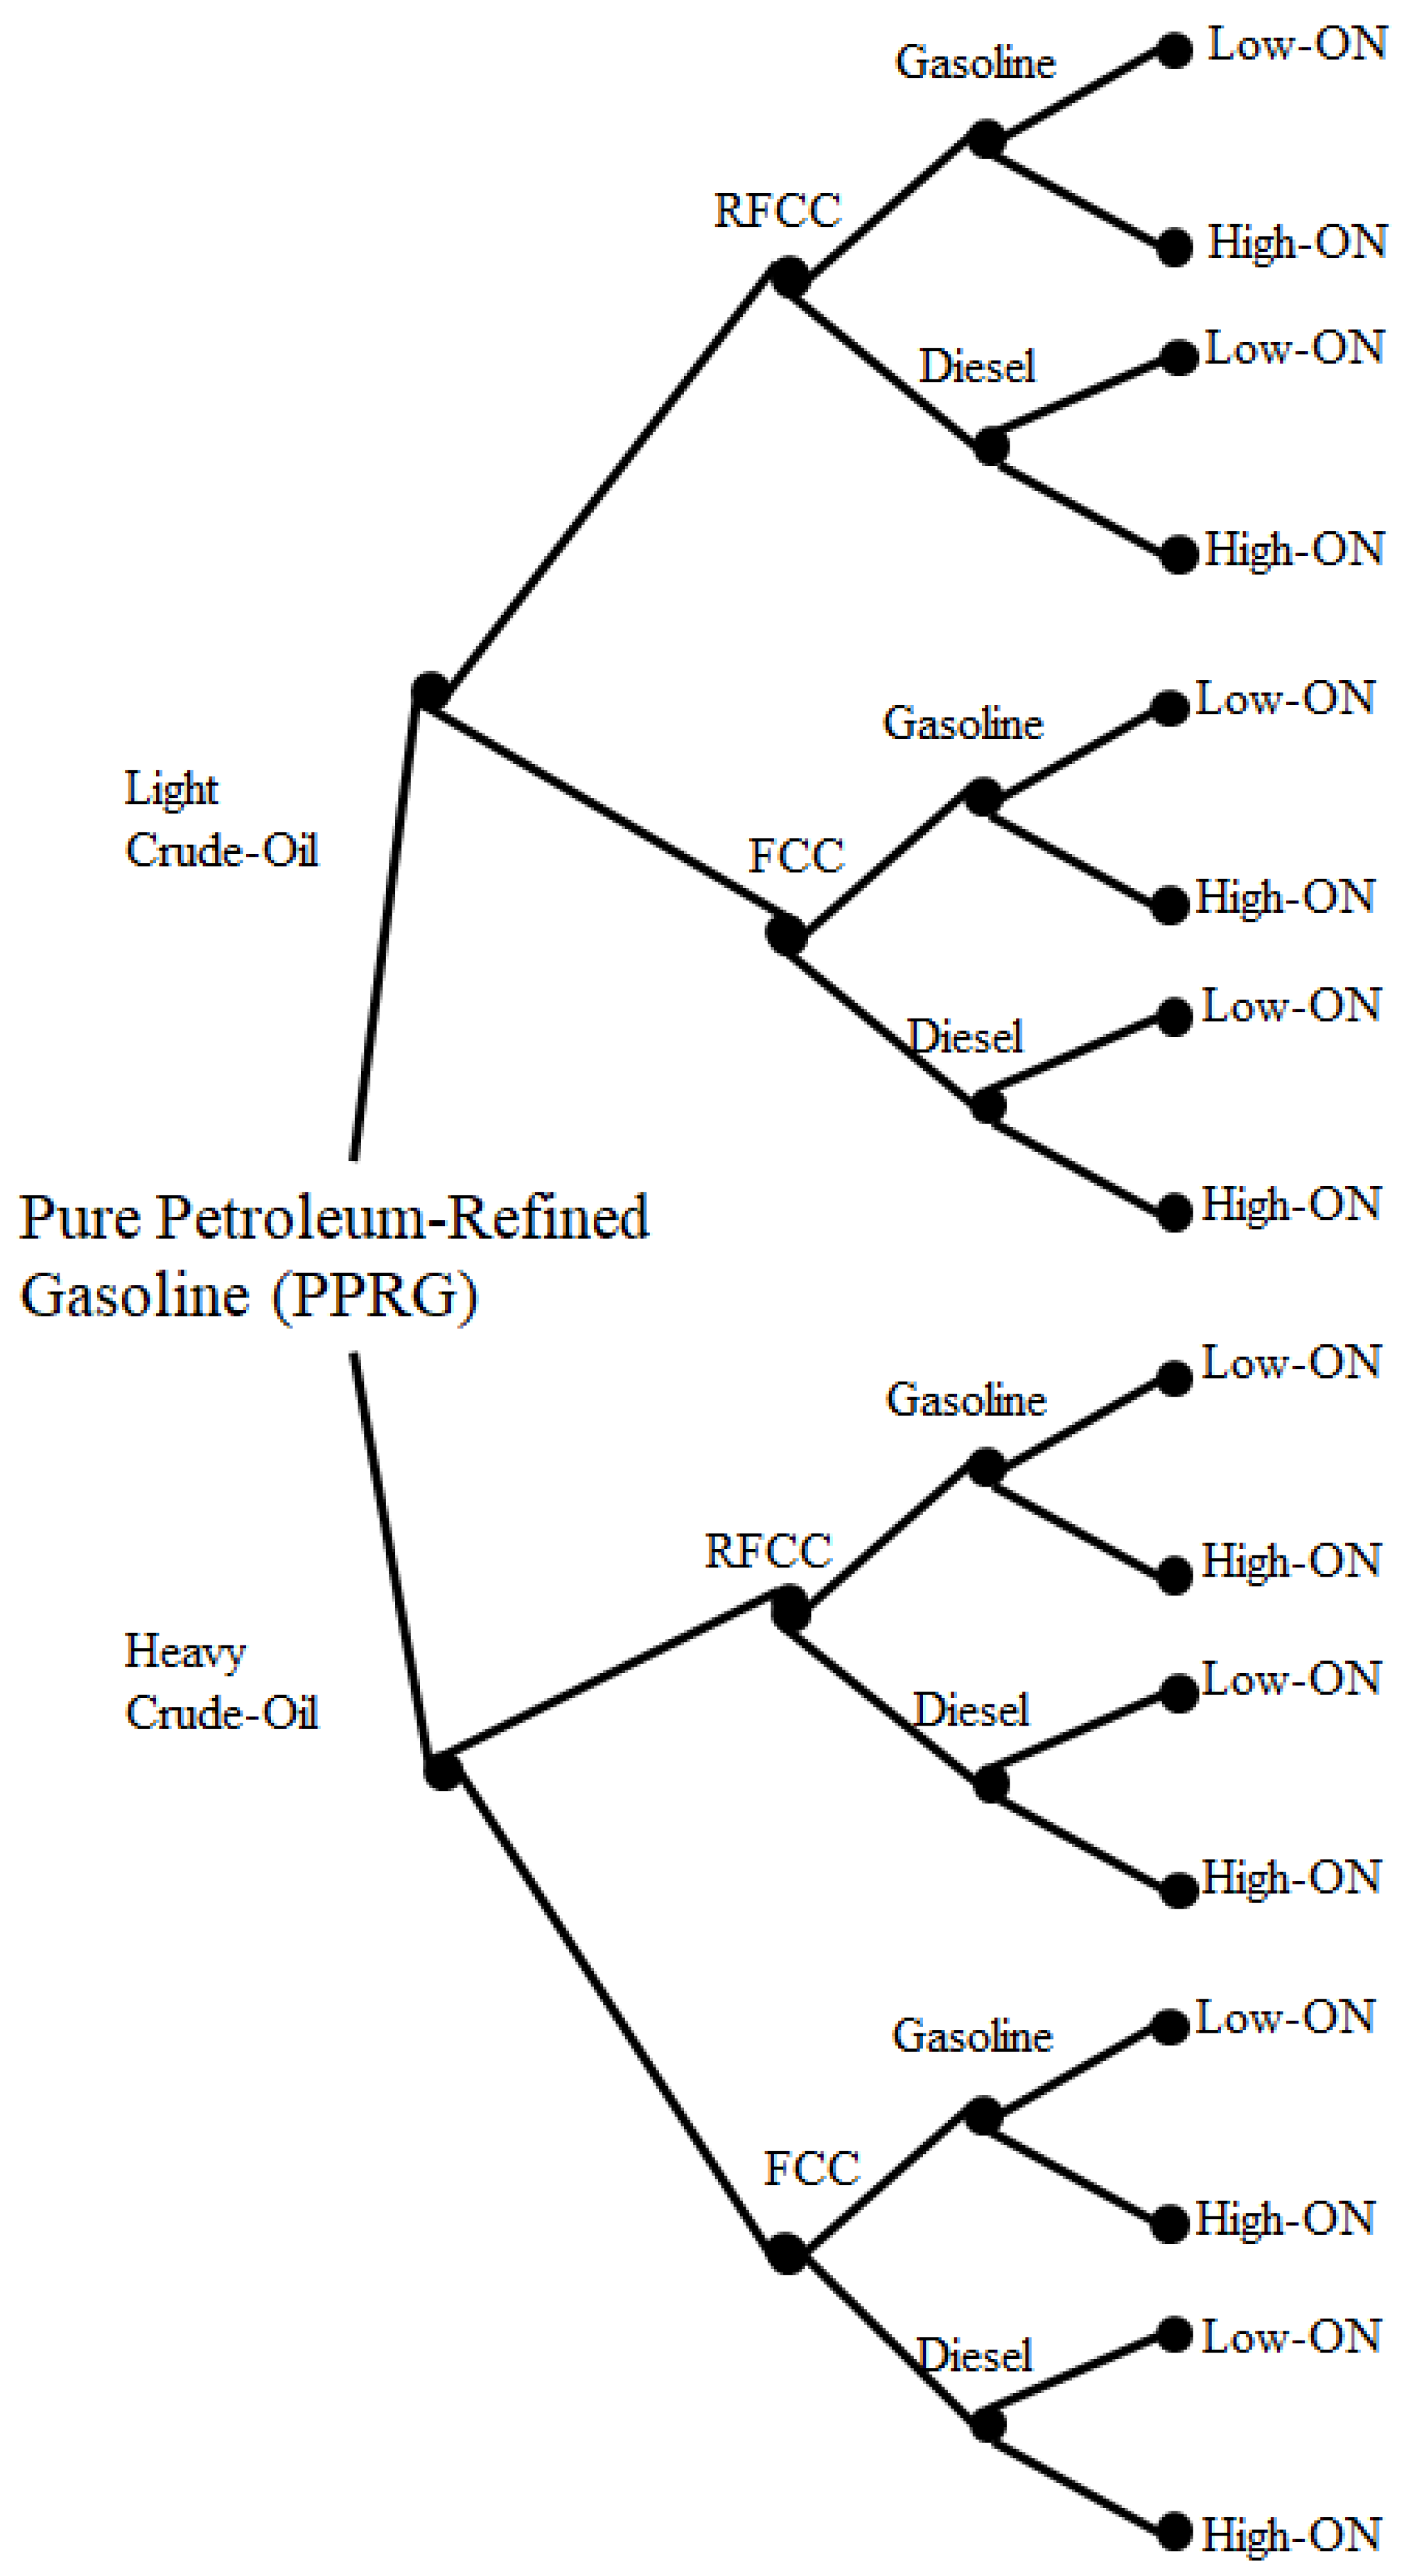
4.1. Gasoline Recipes and Component Dimensions

Typically, 40–50% of the gasoline composition is made of the light cracked naphtha (LCN) streams from fluid catalytic cracking (FCC) and residue fluid catalytic cracking (RFCC) process units [32]. These streams are hydrotreated inside the refinery process network before being stocked and blended into the gasoline pools. As seen in Figure 1, the RFCC unit is fed by the crude distillation unit’s (CDU) atmospheric residuum (ATR) when the ATR-to-CC route is RFCC [33,34]. ATR is produced in a range varying from 20% to 50% of the CDU yield [5]; however, in this work, we consider petroleum for gasoline production in a range of 20% to 30%, considering ultra-light and light petroleum cases for gasoline production, as is the case in the Middle East.
If the chosen ATR-to-CC route uses the vacuum distillation unit (VDU) and FCC, the FCC unit is fed by light and heavy VDU gas oils (50% yield of the VDU). Considering a yield range of the LCN between 35 and 50% of the RFCC/FCC process units’ outputs, in a good approximation, petroleum refinery feeds and process unit networks are designed, operated, controlled, and monitored for the conversion of 3.5–15% of the petroleum throughputs into LCN. For example, when using heavier crude oils (at 30% ATR) via the RFCC route in the gasoline mode (at 50% LCN production), the petroleum-to-LCN conversion is 15%. Conversely, when using lighter crude oils (at 20% ATR) via the FCC route in the diesel mode (at 35% LCN production), the petroleum-to-LCN conversion is 3.5%. This LCN stream is treated in hydrotreating (HT) units before becoming available as HTLCN for blend scheduling operations to produce the final blended gasoline grade.
The other basic component for the economics of gasoline production is the distilled, raw, or straight-run naphtha, generally known as light naphtha (LN). This is directed from the CDU to the intermediate final stocks to become a component tank (among all possible candidates) for the final gasoline composition to be certified before dispatching from the refinery site. Since this LN stream/stock presents a low ON, the addition of this component in the final gasoline pool is generally limited to 10–15% or even less, with the chance of totally ceasing this operation depending on the following factors: the evaporation and octane rating limits in the final gasoline pools, the symbiosis with petrochemical assets, the inclusion of an isomerate unit to extend ON availability, etc. Raw naphtha (RWN) streams from CDU generate prices that are many times lower than the petroleum from raw materials; therefore, rather than export RWN, its utilization for the production of finished products or as feedstock for petrochemical industries near the petroleum refinery site is desired according to the negative margin of this unfinished commodity.
Still, when taking advantage of gasoline-like streams with low value, butane (C4) streams from the light outputs (fuel gas and liquefied petroleum gas) of CDU are typically added at 1% in the final gasoline pool. This is limited by the Reid vapor pressure (RVP) property, since it regulates the escape of light molecules into the gas phase in the final fuel at the absolute vapor pressure exerted by the vapor of the liquid and any dissolved gases/moisture at 37.8 °C (100 °F).
The mix of hydrotreated LCN, LN, and C4 is well established and known as a low-added-value basic stream, forming the quantity-basic components in gasoline production in a petroleum refinery site [35,36]. Refineries processing petroleum in the form of condensate (very light petroleum) typically do not have RFCC or FCC, and their gasoline composition is basically made of distilled naphtha streams direct from the CDUs and processed naphtha streams from process units handling carbon chain rearrangement (to become the gasoline-like streams in a more spherical molecular conformation). This means that, when pressurized during injection in a motor engine, the gasoline components more easily avoid the auto-ignition promoted by the pressure in the piston; then, they ignite as close as possible to the electrical spark moment that promotes the combustion and expansion of the exhausted gases and, therefore, the movement of the engine. Other types of process units based on grouping molecules, such as alkylation and polymerization processes, can also be used to produce quality-basic components in the final gasoline pool.
Hence, considering that hydrotreated LCN (HTLCN), straight-run LN, and C4 account for 50–65% of the gasoline mix when considering only the manufacturer-made components, 35–50% of the components in the final recipe still need to be considered; these are intended to increase the octane rating of the gasoline. For this, the main process unit—the reforming or reformate unit (REF)—transforms raw heavy naphtha (linear or paraffinic molecules) from the CDU into ramified or naphthenic/aromatic molecules. In these cycling reactions, hydrogen molecules (H2) are produced as a side effect, and, therefore, a reduction in total volume occurs in the liquid phase of the output reformate. The main feed for naphtha reforming units is the heavy naphtha (HN) straight-run stream from the CDU route, which represents around 5–10% of petroleum crude oils (this is higher when using condensate petroleum raw materials).
Considering the mix of HTLCN, LN, and C4 as the quantity-basic gasoline components and the REF, isomerate (ISO), and polymerate (POLY) streams as the quality-basic components, there are dozens of process variations for the production of pure petroleum-refined gasoline (PPRG) inside the refinery. When considering these quantity- and quality-basic gasoline components, the manufacturer-made component studies to be developed relate solely to refinery manufacturing processes (the following are the endogenous independent variables: MAN-IVs and ENDO-IVs). These MAN- or ENDO-IVs are integrated into the exogenous SC options/IVs, considering the utilization of ETH, ON boosters, and additional carbon-chain-rearranged naphtha (CCRN) streams, which all represent choices to be made outside of the petroleum refinery (therefore, these are the exogenous IVs).
The primary (main) elements of the endogenous, manufacturer-made, or pure PPRG components for gasoline production in the refinery (without the SC- or EXO-IVs) are the following:
  • Crude oils: light or heavy;
  • ATR route: RFCC or VDU/FCC;
  • Catalytic cracking (CC) mode: gasoline or diesel;
  • Reformate unit mode: low-ON or high-ON.
The secondary (marginal) elements of these manufacturer-made components for gasoline production go beyond this, e.g., installing or operating units such as isomerate and polymerate options:
  • Isomerate: yes or no;
  • Polymerate: yes or no.
The number of manufacturer-made scenarios for PPRG is defined by the permutation of the two options of the main variations (petroleum: light or heavy; ATR routes; CC modes; and REF modes); this constitutes the primary level of the manufacturer-made components for gasoline production, yielding 24 combinations. For each of these 16 (or 24) scenarios, as seen in Figure 3, the secondary level of the manufacturer-made scenarios creates three additional options (ISO, POLY, and both) in each of the 16 primary MAN-made PPRG scenarios. Therefore, a total number of 64 scenarios can be generated; there are 16 scenarios when not including the secondary-level options and 48 additional scenarios when combining these 16 scenarios (in Figure 3) with the other secondary manufacturer-made or endogenous options (inside the refinery walls).
The exogenous, supply chain-related, policy-defined, etc., components for gasoline production in the refinery site are the following:
  • ON boosters (MTBE);
  • ETH;
  • Additional carbon-chain-rearranged naphtha (CCRN).
These exogenous or supply chain independent variable (SC-IV) (outside refinery walls) combinations create 7 scenarios (when carrying out C3,1 + C3,2 + C3,3) for each of the 64 manufacturer-made scenarios. Therefore, a total number of 448 scenarios can be generated via the 64 manufacturer-made and SC scenarios. Additionally, the exclusion of the SC scenarios, per se, sees that there are 64 manufacturer-made scenarios, so a total of 512 different scenarios exist, as seen in Figure 4. As much as possible, for each SC-IV selection, a different gasoline blending composition is available using ETH at 5%, 10%, and 25%, or MTBE at 5% and 15%.

4.2. Pseudo-Code Algorithm to Simulate Scenarios

We analyzed hundreds of discrete-event simulated scenarios, considering manufacturing and supply chain variations impacting gasoline production in terms of quantity and quality inside a petroleum refinery site [5,37]. A pseudo-algorithm for calculating yields, the RONs, and other properties is presented in Algorithm 1. All data and source code in the Python 2.7.13 programming language are available at GitHub—Ethanol-Gasoline Repository (https://github.com/brencasme/ethanol-gasoline, accessed on 15 February 2025).
The algorithm plots the yields and RONs for 16 primary (main) scenarios, with an additional 48 scenarios generated by including isomerate (ISO), polymerate (POLY), or both. Supply chain aspects are included to predict gasoline production enhancement for each SC-IV separately, regarding the 16 scenarios with maximum yields and RONs (including both ISO and POLY). The results of these plots for gasoline yield and RON are presented in Section 5. Section 6 and Section 7 further analyze these results using the same functions used in the Call(ini, calc, plot) function in Algorithm 1.
Algorithm 2 outlines the construction of the discrete-event simulation. The simulation begins with petroleum selection, followed by a series of do-loops that generate the 16 main scenarios, as illustrated in Figure 3. The process network flows downstream, with yields calculated from higher to lower amounts that overlap individual contributions (per four options) from Figure 5, demonstrating the yields of the primary or main PPRG. Petroleum selection creates branches in the tree (Figure 3), with lighter petroleum on the left and heavier petroleum on the right, as shown in the result sections (Section 5, Section 6 and Section 7).
Distilled streams are formed in the outer loop from the petroleum options (line 2 in Algorithm 2). The inner loops then select the hydrotreated naphtha (HN) transformation in the reformate (REF) unit and the process design option of either the RFCC (residue fluid catalytic cracking) or FCC (fluid catalytic cracking) routes for the ATR-to-CC (atmospheric residue to catalytic cracker) option. The ATR feed for the selected design significantly influences gasoline production, which is addressed in the next inner loop (line 6 in Algorithm 2). In moving one level deeper into the tree (Figure 3), the RFCC and FCC options are combined with petroleum selection. Scenarios 1–8 are generated for lighter petroleum (left side of the tree), and scenarios 9–16 are generated for heavier petroleum (right side of the tree), combined with the RFCC and FCC ATR-to-CC route options. Scenarios 1–4 use RFCC, while scenarios 5–8 use FCC, all with lighter petroleum. Similarly, scenarios 9–12 use RFCC and scenarios 13–16 use FCC, all with heavier petroleum. The CC mode of operation begins in line 8 of Algorithm 2, and the lowest influence on quantity but the highest influence on the RON per amount (as seen in Figure 6) starts in line 12 of Algorithm 2.
Algorithm 1 Result Plots
  1: 
64 PPRG Scenarios and Scenarios Based on Maximum PPRG Yield and RON (ISO and POLY Included)
  2: 
16 P r i m a r y s c e n a r i o s CALL ( i n i ,   c a l c ,   p l o t Figure 5 and Figure 6)
  3: 
48 S e c o n d a r y s c e n a r i o s CALL ( i n i ,   I S O ,   P O L Y ,   c a l c ,   p l o t Figure 7)
  4: 
Choose the 16 M A X Y i e l d a n d R O N P P R G S c e n a r i o s
  5: 
for   S c e n a r i o 1 T O 16 do
  6: 
  SET S C CALL ( i n i ,   c a l c ,   p l o t )
  7: 
   ( 1 + M T B E ) P P R G M a x CALL ( i n i ,   c a l c ,   p l o t Figure 8)
  8: 
   ( 1 + E T H ) P P R G M a x CALL ( i n i ,   c a l c ,   p l o t Figure 9)
  9: 
   ( 1 + R E F 2 ) P P R G M a x CALL ( i n i ,   c a l c ,   p l o t Figure 10)
10: 
end for
Algorithm 2 Calculation
  1: 
Ini.py Initialize( Y i e l d s , P r o p e r t i e s , R a t i o s )
  2: 
for   C r u d e ( l o w , h i g h ) do
  3: 
   Q FLOW ( C 4 ,   L N ,   H N ,   A T R )
  4: 
  if  I S O = T R U E  then
  5: 
    Q L N Q I S O
  6: 
    Q I S O Q L N R A T I O I S O
  7: 
  end if
  8: 
  for  A T R R o u t e ( R F C C , F C C ) do
  9: 
    Q FLOW ( C C )
10: 
   for  C C M o d e ( G a s o l i n e , D i e s e l ) do
11: 
     Q FLOW ( G A S E S ,   L C N )
12: 
    if  P O L Y = T R U E  then
13: 
      Q P O L Y Q G A S E S R A T I O P O L Y
14: 
    end if
15: 
    for  R E F M o d e ( L O W , H I G H ) do
16: 
      Q FLOW ( R E F )
17: 
    end for
18: 
   end for
19: 
  end for
20: 
end for
21: 
YIELDS()
22: 
PROPERTIES()
23: 
End Procedure
In lines 4 and 10 of Algorithm 2, an IF–THEN clause is used to include the ISO and POLY units, expanding the 16 main PPRG scenarios (Figure 3) to 48 additional scenarios by including ISO, POLY, or both. At the end of Algorithm 2, the yields and properties for the final gasoline pool are calculated. The flows considered include the following:
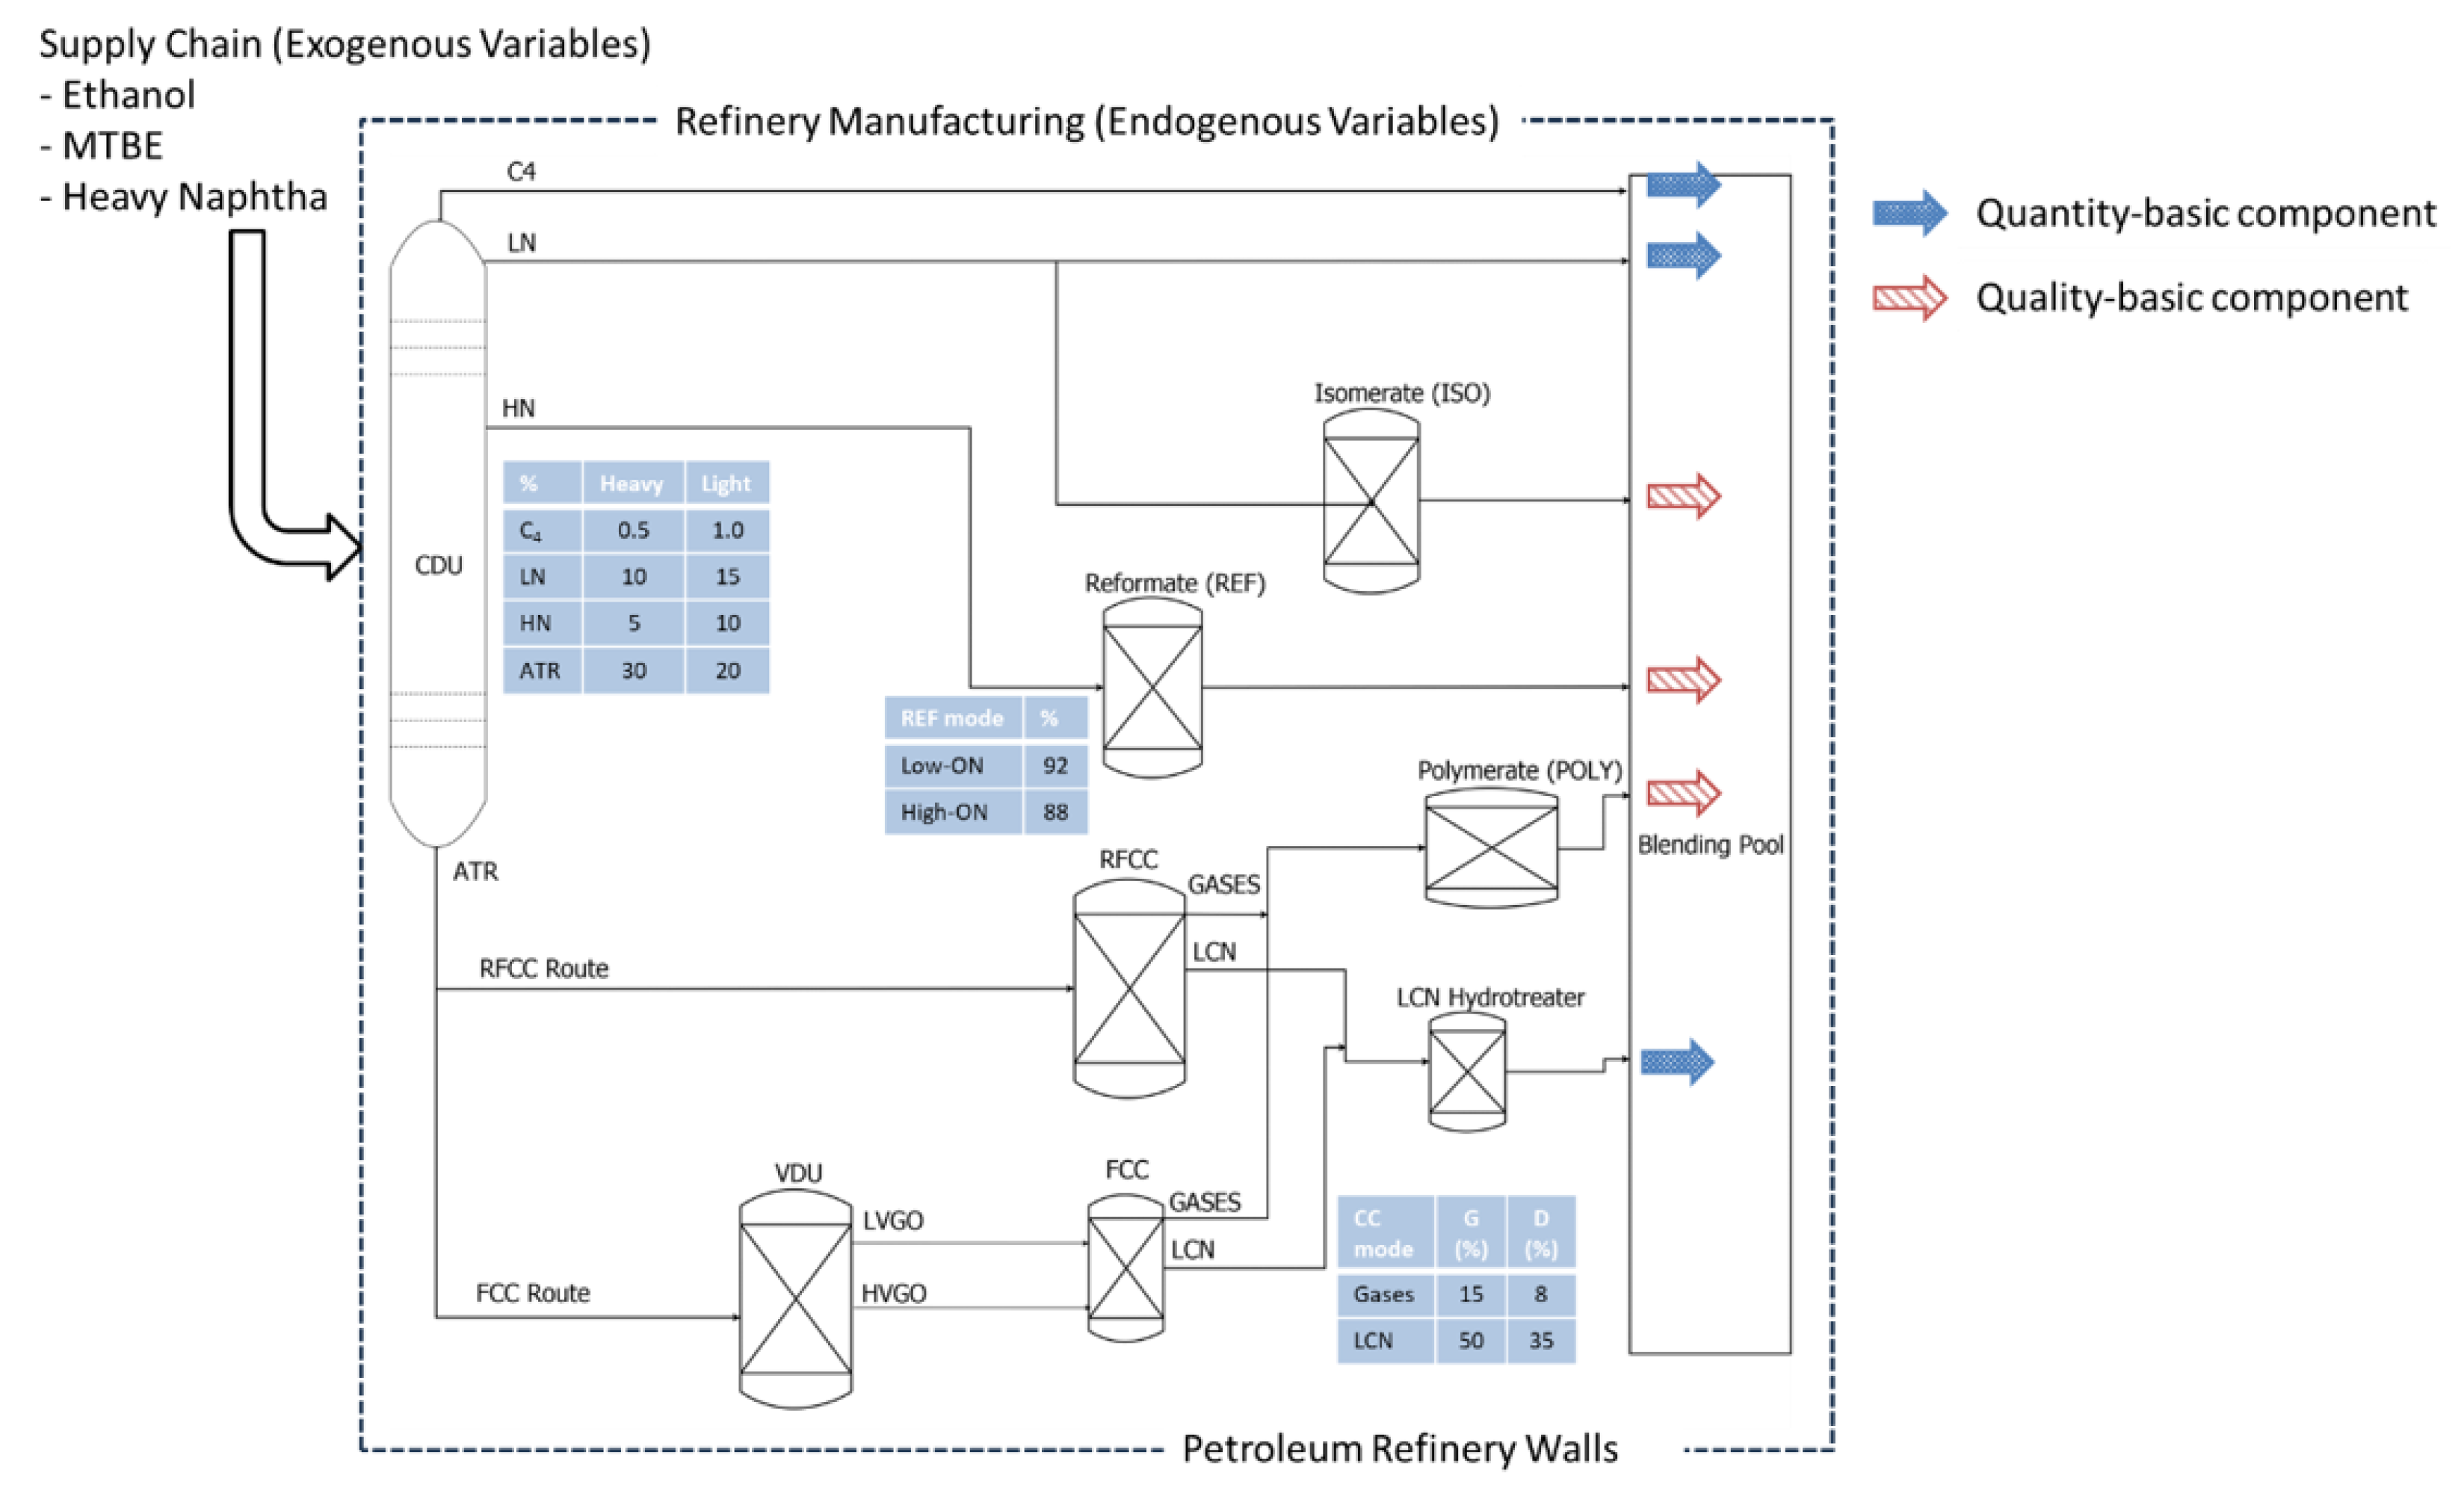
  • Main components (always included): Butane (C4), light naphtha (LN), reformate (REF) streams, and HTLCN;
  • Marginal or secondary components (included via IF–THEN clauses): Isomerate (ISO) and polymerate (POLY).
Figure 6. Gasoline production (—) in red on the left and RON (—) in blue on the right based on primary variations in the manufacturer-made scenarios for PPRG.
Sustainability 17 04884 g006
Another option, discussed in Section 6, is the possibility of stocking LN due to its reduced RON value (lower than 70). From a scheduling perspective, higher RON values can be achieved. This operational maneuver can also be included as an IF–THEN statement. All these details can be verified in the Python 2.7.13 code shared in the data repository.
Figure 7. Gasoline production and RON based on primary and secondary (ISO and POLY units) variations in the manufacturer-made scenarios for PPRG.
Sustainability 17 04884 g007
Figure 8. MTBE at 5%, 10%, and 15% in the full PPRG.
Sustainability 17 04884 g008
Figure 9. ETH at 5% and 10% in the full PPRG.
Sustainability 17 04884 g009
Figure 10. Extra reformate (REF2) unit at 15% to the full PPRG (primary and secondary manufacturer-made variations).
Sustainability 17 04884 g010

4.3. Gasoline Component Quantities: Process Scenario Flows

Considering the refinery process network in Figure 1, there are six possible components or streams forming the gasoline recipes:
  • Butane (C4);
  • Light naphtha (LN);
  • Isomerate (ISO);
  • Reformate (REF);
  • Polymerate (POLY);
  • HTLCN.
C4 and LN are raw distillates from the CDU (crude distillation unit). The flows and amounts of these distillates are calculated based on a given CDU throughput ( Q ¯ F C D U ) and the fixed yields of the product distillates. These yields are represented by Y ¯ C 4 L , Y ¯ L N L , Y ¯ H N L , and Y ¯ A T R L for light petroleum when the selection y L is active. For heavy petroleum, the yields are Y ¯ C 4 H , Y ¯ L N H , Y ¯ H N H , and Y ¯ A T R H if the selection y H is active. These options ( y L or y H ) are mutually exclusive and are selected in the combinations of the main PPRG scenarios, as defined in Equations (1)–(4).
The output flows of the distillates— Q C D U , C 4 , Q C D U , L N , Q C D U , H N , and Q C D U , A T R —are determined by petroleum selection and the respective yields. These calculations are controlled by Algorithms 1 and 2 for the 16 main scenarios in Figure 3, where the first level of the tree builds 8 scenarios for lighter petroleum (left side) and 8 scenarios for heavier petroleum (right side) in the resulting plots.
Q i , C 4 = Q C D U , C 4 = Q ¯ F C D U Y ¯ C 4 L · y L + Y ¯ C 4 H · y H
Q C D U , L N = Q ¯ F C D U Y ¯ L N L · y L + Y ¯ L N H · y H
Q C D U , H N = Q ¯ F C D U Y ¯ H N L · y L + Y ¯ H N H · y H
Q C D U , A T R = Q ¯ F C D U Y ¯ A T R L · y L + Y ¯ A T R H · y H
Continuing downstream in Figure 1, the possibility of adding carbon-chain-rearranged naphtha (CCRN) units exists. The purpose of the CCRN units is to transform the linear-like molecules found in LN and HN streams into more spherical–conformation molecules to increase the octane rating. The main CCRN unit is the reformate unit (REFU), which converts linear HN streams into more cyclic (naphthenic and aromatic) naphtha streams. Additionally, a marginal gain in octane rating can be achieved by operating or installing an isomerate unit (ISOU), as defined in Equation (5). The remaining LN ( Q i , L N ) to be blended into gasoline is defined in Equation (6).
Q i , I S O = R ¯ L N / I S O · Q C D U , L N · y I S O
Q i , L N = Q C D U , L N Q i , I S O
The reformate unit (REFU) is always operational, as per the refinery network in Figure 1, and operates in either low- ( y L o w ) or high- ( y H i g h ) severity modes, as defined in Equation (7). In low-severity mode, a higher yield of the reformate (REF) stream ( Q i , R E F ) is expected, as less H2 is formed in the cyclic carbon chain reactions. Therefore, Y ¯ R E F L o w is greater than Y ¯ R E F H i g h .
Q i , R E F = Q C D U , H N Y ¯ R E F L o w · y L o w + Y ¯ R E F H i g h · y H i g h
The CC feed ( Q F C C ) is defined in Equation (8), considering that atmospheric residue (ATR) can be routed to RFCC (if y R F C C is chosen) or FCC (if y F C C is chosen), as seen in Figure 1. For the FCC option, Y ¯ G O is the ratio of the ATR that is fed into the FCC feed in the form of vacuum gas oils after processing in the VDU (vacuum distillation unit).
Q F C C = Q C D U , A T R y R F C C + Y ¯ G O · y F C C
Another option is the RFCC or FCC mode of operation, either in gasoline ( y G ) or diesel ( y D ) mode; this determines the conversion of the CC feed ( Q F C C ) to GASES and LCN streams, which influence gasoline production. In Equations (9) and (10), the CC yields Y ¯ G A S E S G and Y ¯ L C N G are defined for the gasoline mode, while Y ¯ G A S E S D and Y ¯ L C N D are defined for the diesel mode.
Q C C , G A S E S = Q F C C Y ¯ G A S E S G · y G + Y ¯ G A S E S D · y D
Q C C , L C N = Q F C C Y ¯ L C N G · y G + Y ¯ L C N D · y D
Equation (11) models the reduction in volume marginally promoted in the LCN hydrotreater yield, given by Y ¯ H T L C N , where the remaining stream ( Q i , H T L C N ) is mixed into the gasoline pools. Equation (12) includes the polymerate unit (POLYU), which transforms the Q C C , G A S E S stream (containing unsaturated light molecules from C2 to C4 carbon chains) into the polymerate stream ( Q i , P O L Y ), considering the ratio R ¯ P O L Y of the GASES stream diverted to the POLYU.
Q i , H T L C N = Q H T L C N = Y ¯ H T L C N · Q C C , L C N
Q i , P O L Y = R ¯ P O L Y · Q C C , G A S E S · y P O L Y
The final gasoline pool yield is calculated by combining the main PPRG independent variables, simulated as follows:
  • Crude selection: light ( y L ) or heavy ( y H ) petroleum;
  • Reformate mode of operation: low ( y L o w ) or high ( y H i g h ) severity;
  • ATR-to-CC route: RFCC ( y R F C C ) or FCC ( y F C C );
  • CC mode of operation: gasoline ( y G ) or diesel ( y D ).
By replicating the scenario tree in Figure 3, 16 different PPRG yields can be managed following the proposed refinery network in Figure 1 and the selections of crude in Equations (1)–(4), the reformate mode in Equation (7), the ATR-to-CC route in Equation (8), and the CC mode in Equations (9) and (10). These calculations are controlled by Algorithm 2 using four do-loops, considering the selections in Figure 3.
Additional variations in PPRG yields and properties can be related to the inclusion of the isomerate unit, which processes straight-run light naphtha (LN), as defined in Equation (5). The remaining LN for the gasoline pool is calculated in Equation (6). Furthermore, the polymerate unit (POLYU) can be included in the calculations, as defined in Equation (12), where the produced gaseous stream is partially converted to polymers from the olefins content.

4.4. Gasoline Components and Blending Formulas

Gasoline plays a pivotal role in meeting domestic demand for liquid fuels for light fleets worldwide. Companies may capitalize on the margins from spot and contracted international markets. Still, they are constrained by manufacturing capabilities, supply chains (SCs), energy policies (EPs), and the natural resources of their respective nations. In gasoline production, non-manufacturing components, such as SC and EP, include the addition of additives, such as MTBE, the viability of incorporating ETH, the overproduction of raw heavy naphtha in neighboring sites (allowing extra reformate in manufacturing options), and regulations in national and international markets. One underlying goal is to reduce naphtha exports by channeling it into finished products within the refinery, thereby increasing gasoline production while adhering to properties such as Reid vapor pressure (RVP) and ON.
In gasoline blending, controls for adding light components such as C4 (butane) and straight-run light naphtha (LN) must adhere to specific maximum-allowed RVP values. Additionally, reformate addition is constrained by aromatic content and benzene limits, typically set at 25% and 1% by volume, respectively. By initially assessing the inherent ON of these products without supplementary additives (e.g., ETH), we establish a baseline for pure PPRG. This baseline serves as a reference point for evaluating subsequent non-manufacturing scenarios, optimizing gasoline production in terms of both quality and quantity.
The properties of the gasoline components for the final blends are detailed in Table 1. Each component has specific properties that significantly affect gasoline quality and performance. For the gasoline recipe scenarios, components that are always present (C4, LN, REF, and HTLCN) and that marginally enhance gasoline production (ISO and POLY), as well as supply chain components (MTBE, ETH, and extra reformate, which has the same properties as the reformate stream) are considered. These components form a final pool, where both yields (quantities) and blended properties (qualities) are calculated in the discrete-event simulation proposed in Algorithms 1 and 2. The properties include Reid vapor pressure (RVP), aromatic content (ARO), olefin content (OLE), RON, and motor octane number (MON). These properties are regulated by market standards, making the determination of gasoline recipes crucial for both operational and economic success, as they significantly impact fuel performance, efficiency, volatility, combustibility, and environmental considerations.
For the gasoline blend properties, specific gravity (SG) is governed by a volume-based blended property, S G B , found in Equation (13), which is linearly proportional to the volume flows of each input, Q i . These flows are determined through a discrete-event simulation for the main tree in Figure 3 and Algorithms 1 and 2. The blended property RVP is calculated using a transformed basis known as the property index (PI); we used RVP1.25 in the calculations. The PI is linearly proportional to the volume flows of each input, Q i , as shown in Equation (14). Equation (15) represents a mass- or weight-based property, such as sulfur concentration ( S U L B ).
SG B = i IN Q i · SG i i IN Q i
RVP B 1.25 = i IN Q i · RVP i 1.25 i IN Q i
SUL B = i IN Q i · SG i · SUL i i IN Q i · SG i
Equations (16)–(19) relate to the RON and MON properties in the gasoline blend. R O N V i v in Equation (16) and M O N V i v in Equation (17) are highly nonlinear due to the synergistic and antagonistic molecular interactions of the gasoline-like streams. The volumetric contents of the aromatic and olefinic components are necessary for determining the RON/MON grades of gasoline. However, this nonlinearity is not an issue for the solution algorithms, as this work introduces a discrete-event simulation based on manufacturing and supply chain variations rather than an optimization approach. These constraints represent blending values for the RON and MON of each component in the gasoline pool, calculated as volume-based properties, as shown in Equations (18) and (19).
RON i v = RON ¯ i + a [ ( RON ¯ i RON B ) ( J ¯ i J v ) ] + b ( ARO ¯ i ARO B ) 2 + c ( OLE ¯ i OLE B ) 2 + d [ ( ARO ¯ i ARO B ) ( OLE ¯ i OLE B ) ]
MON i v = MON ¯ i + e [ ( MON ¯ i MON B ) ( J ¯ i J v ) ] + f ( ARO ¯ i ARO B ) 2 + g [ 2 ( OLE ¯ i OLE B ) 2 ( ARO B 2 ARO B 2 ) ( ARO B 2 ARO B 2 ) 2 ]
RON G = i IN Q i · RON i v i IN Q i
MON G = i IN Q i · MON i v i IN Q i
The coefficients a to g in Equations (16) and (17) can be found in the source code in the data repository attached to this work, as well as in references such as [5,35,39]. These coefficients can also be determined experimentally.

4.5. Gasoline Component Properties: Process Scenario Qualities

Considering the refinery process network in Figure 1, six components or recipe streams are used to prepare the final gasoline pool: C4, LN, ISO, REF, POLY, and HTLCN. Variations in the qualities or properties of the distillates C4 and LN, both blended in the gasoline pool, are negligible.
The reformate unit (REFU) operates in either low- ( y L o w ) or high- ( y H i g h ) severity modes, which affect the RON and MON properties. A shift of 1.5 points in the RON and 0.75 points in the MON is observed, as defined in Equations (20) and (21), from the baseline R O N ¯ i , R E F in Table 1. This shift increases the ON in high-ON mode if y H i g h is chosen or decreases it in the low-ON mode if y L o w is chosen.
R O N i , R E F = R O N ¯ i , R E F + P ¯ R E F R O N · y L o w + P ¯ R E F R O N · y H i g h
M O N i , R E F = M O N ¯ i , R E F + P ¯ R E F M O N · y L o w + P ¯ R E F M O N · y H i g h
The catalytic cracking (CC) unit operates in either the gasoline ( y G ) or diesel ( y D ) mode, with an increase of 0.5 points in the RON and 0.25 points in the MON in the gasoline mode; there is a decrease of 0.5 points in the RON and 0.25 points in the MON in the diesel mode, as defined in Equations (22) and (23).
R O N i , C C = R O N ¯ i , C C + P ¯ C C R O N · y D + P ¯ C C R O N · y G
M O N i , C C = M O N ¯ i , C C + P ¯ C C M O N · y D + P ¯ C C M O N · y G
The RON and MON decrease after using hydrotreating units, with a reduction of 0.5 points in the RON and 0.25 points in the MON, as defined in Equations (24) and (25).
R O N i , H T L C N = R O N i , C C P ¯ H T L C N R O N
M O N i , H T L C N = M O N i , C C P ¯ H T L C N M O N

4.6. Uncertainty and Error Analysis

The gasoline component qualities used in this study were obtained from published studies, particularly [40]. These values serve as reference benchmarks; however, inherent variability in refining operations, feedstock composition, and measurement techniques introduces uncertainties. Component properties such as octane rating (RON), Reid vapor pressure (RVP), and aromatic content may fluctuate based on crude oil characteristics, processing conditions, and refinery configurations.
To standardize the analysis, this study assumes that component qualities remain within reported study values without accounting for fluctuations due to seasonal crude variations, equipment efficiency, or blending inconsistencies. Additionally, the ethanol integration scenarios assume uniform mixing effects without considering potential phase separation, hygroscopic behavior, or temperature-dependent blending interactions.

Error Sources in Model Assumptions

Several simplifications were made in the discrete-event simulation model:
  • Blending Interactions: This study applies volume-based property blending rules, but real-world gasoline blending exhibits nonlinear interactions, particularly with oxygenates like ethanol and MTBE [40].
  • Process Yield Assumptions: The reformate unit’s severity levels (low vs. high ON) assume fixed conversion efficiencies, whereas actual refinery operations may adjust hydrogen production and reformate composition based on feed variations.
  • Component Stability: Ethanol volatility and water absorption were not explicitly modeled, potentially impacting RVP calculations in high-ethanol blends.
  • Supply Chain Variability: The model assumes consistent ethanol availability, but geopolitical factors, production constraints, and biofuel mandates can influence supply reliability.
By addressing these factors, the accuracy of gasoline blending models can be improved. The surrogate modeling approach presented in [40] could be leveraged for a more accurate representation of nonlinear blending processes.

5. Gasoline Production: Recipe Results

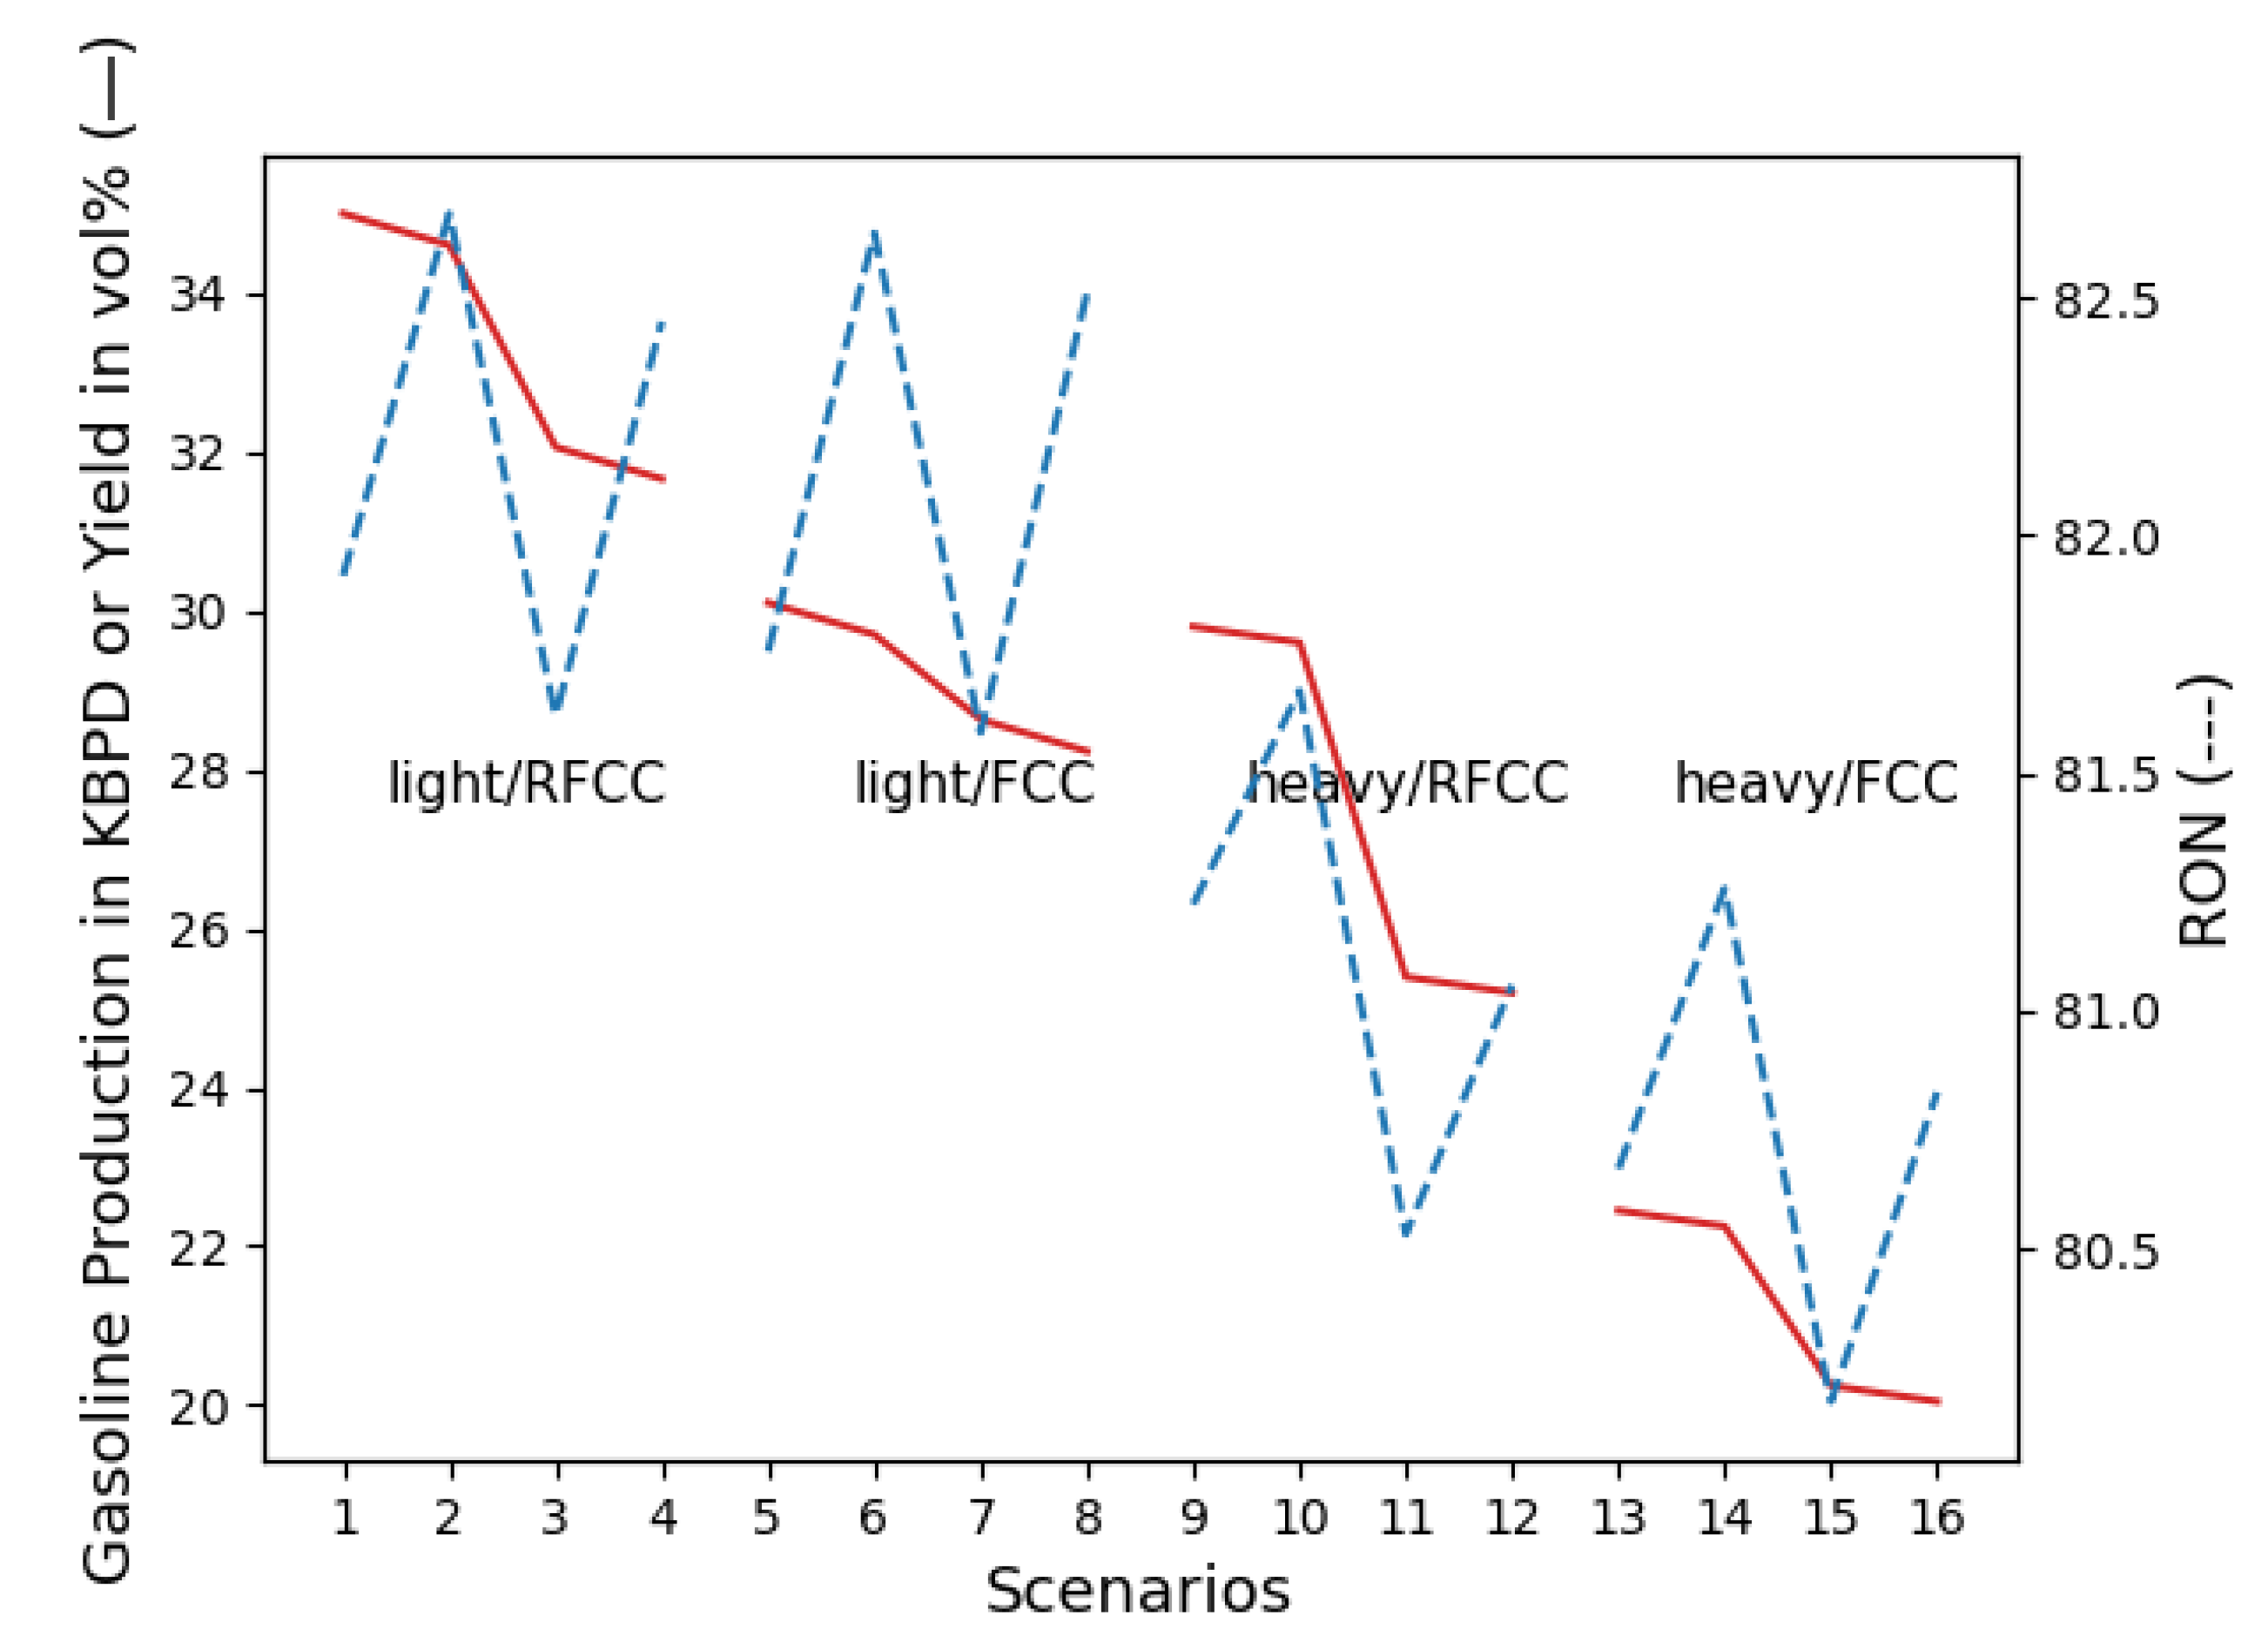
5.1. Refined Gasoline Production

The petroleum refinery in Figure 1 represents a typical refinery, showing the processes, yields, and streams related to gasoline production. A total of 64 manufacturer-made scenarios (within the refinery) are possible in producing pure PPRG. Additional gasoline components, such as MTBE (an ON booster) and ETH, are introduced to this processing site, along with the construction or installation of another reformate unit if overproduction of heavy naphtha (from an external site) when processing light petroleum or condensate occurs. The process involves a distillation column with a capacity, Q ¯ F C D U , of 100,000 barrels per day (BPD). Other products, such as jet fuel and diesel, are excluded from this study.
For the PPRG or solely manufacturer-made gasoline, the problem considers the streams produced in the CDU that can directly or indirectly form the gasoline pool: C4 (butane), LN, HN, and ATR, as seen in Figure 1. The liquid petroleum gas (LPG) stream typically ranges from 2 to 5% of the distillation output and contains, as defined in the problem, 0.5% in the lighter petroleum, and 1% in the heavier petroleum of C4, which is the light component that can be included in the gasoline pool. The next component is the light naphtha (LN) stream, with a yield ranging from 10 to 15% when using the CDU (15% in lighter petroleum and 10% in heavier petroleum). A portion of this stream can be routed to an isomerate unit (ISOU), and the remaining LN is blended into the gasoline pool to increase gasoline quantity at a reduced cost. However, due to its low-ON content, stocking LN is common when producing higher ON grades, such as those needed for premium gasoline. In this work, simulation cases where LN is stocked to increase the ON are presented as a comparison.
The heavy naphtha (HN) stream, with a typical yield of 5–10% (10% in lighter petroleum and 5% in heavier petroleum), is directed to the reformate or reforming unit. In this process, 8–12% by volume is lost in the output naphtha due to hydrogen (H2) production via the cyclic reaction to produce naphthenic and aromatic molecules, resulting in a higher RON and MON reformate (REF) component. The H2 is typically used in hydrotreaters to remove sulfur from carbon chains, forming hydrogen sulfide (H2S). However, this reformate unit (REFU) by-product stream is a minor part of the H2 produced in the refinery site for this treatment.
The CDU or atmospheric residue (ATR) yields 20–30% (20% in lighter petroleum and 30% in heavier petroleum) of the distillation unit throughput. This is the most important CDU distillate for gasoline at the refinery site, as low-value fractions are transformed into gasoline-like streams (olefins for POLYU and LCN for HTLCN). ATR is the feed for residue fluid catalytic cracking (RFCC) if this is the chosen route. If the fluid catalytic cracking (FCC) route is selected, ATR feeds the vacuum distillation unit (VDU) first, as seen in Figure 1. Within the RFCC/FCC units, the long carbon chain residue is broken down in the reactor, and the resulting stream undergoes separation in an associated distillation tower. Two main potential gasoline streams are produced: light cracked naphtha (LCN), typically comprising 35–50% of the catalytic cracking (CC) feed and 8–15% of the polymerized compounds rich in olefins (unsaturated molecules such as CH2=CH2). If the ATR route uses VDU and FCC, the ATR is transformed into two distinct streams that influence gasoline production: light vacuum gas oil (LVGO) and heavy vacuum gas oil (HVGO). Both of these streams are directed to the FCC unit, as seen in Figure 1. It is assumed that the products from the FCC unit exhibit similarities to those obtained from RFCC.
The yields of the C4, LN, HN, and ATR distillates from the CDU are 1%, 15%, 10%, and 20% of the petroleum feed for lighter petroleum, respectively. For heavier petroleum, the yields are 0.5%, 10%, 5%, and 30%, respectively. For the CC modes, the yields of GASES and LCN in the gasoline mode are 15% and 50%, respectively. In the diesel mode, the CC yields of GASES and LCN are 8% and 35%, respectively. For the REF unit operating in low-ON or high-ON mode, the yield reduces by 8% and 12%, respectively. An increase (in high-ON) or decrease (in low-ON) of 1.5 points in the RON and 0.75 points in the MON is observed from the baseline in Table 1. Similarly, for the CC unit operating in the gasoline or diesel modes, an increase (in gasoline) or decrease (in diesel) of 0.5 points in the RON and 0.25 points in the MON is observed from the baseline in Table 1. A reduction of 0.5 points in the RON and 0.25 points in the MON is observed after using the hydrotreating unit (HTU) producing HTLCN, which is blended into the gasoline pools.
When considering all given data, Equations (1)–(25), and the refinery network shown in Figure 1, the gasoline production, conversion, or yield over 100 KBPD for the selections of petroleum, ATR routes, CC modes, and REF modes can be constructed for the 16 main manufacturer-made scenarios, as seen in Figure 5. The higher petroleum-to-gasoline conversions (gasoline production in KBPD or yield in %) occur predominantly in light petroleum (scenarios 1–8), primarily due to the increased LN and HN values (15% and 10%, respectively). Although the heavy petroleum selection yields a higher ATR stream (30% of the CDU) for RFCC/FCC, only in scenarios 9 and 10 does the total conversion of petroleum to gasoline surpass scenarios 7 and 8 (in lighter petroleum); when the selections are the RFCC route and the gasoline mode in the CC, this is compensated for by a higher LCN production in the RFCC/CC gasoline scenarios (in heavier petroleum).
When considering Figure 1, the petroleum refinery network, and the yields of the REF and CC selections, along with the light/heavy petroleum and ATR routes (RFCC or FCC), one can interpret the gasoline production (or yield/conversion in %) and the variations in the gasoline RONs shown in Figure 6. The 16 main scenarios are divided into four groups of four (light/RFCC, light/FCC, heavy/RFCC, and heavy/FCC), where detailed variations emerge among different modes concerning blended gasoline yields and the RON. These differences are primarily influenced by the light or heavy yields and ATR routes of the CDU and secondarily by the REF and CC unit modes. In Figure 5, scenarios 1–4, 5–8, 9–12, and 13–16 show distinctions in gasoline yields and RONs based on (a) severity (REFU mode on low- and high-ON) and (b) CC mode selection (if in gasoline or diesel mode), demonstrating how these choices impact gasoline quantity and quality outputs.

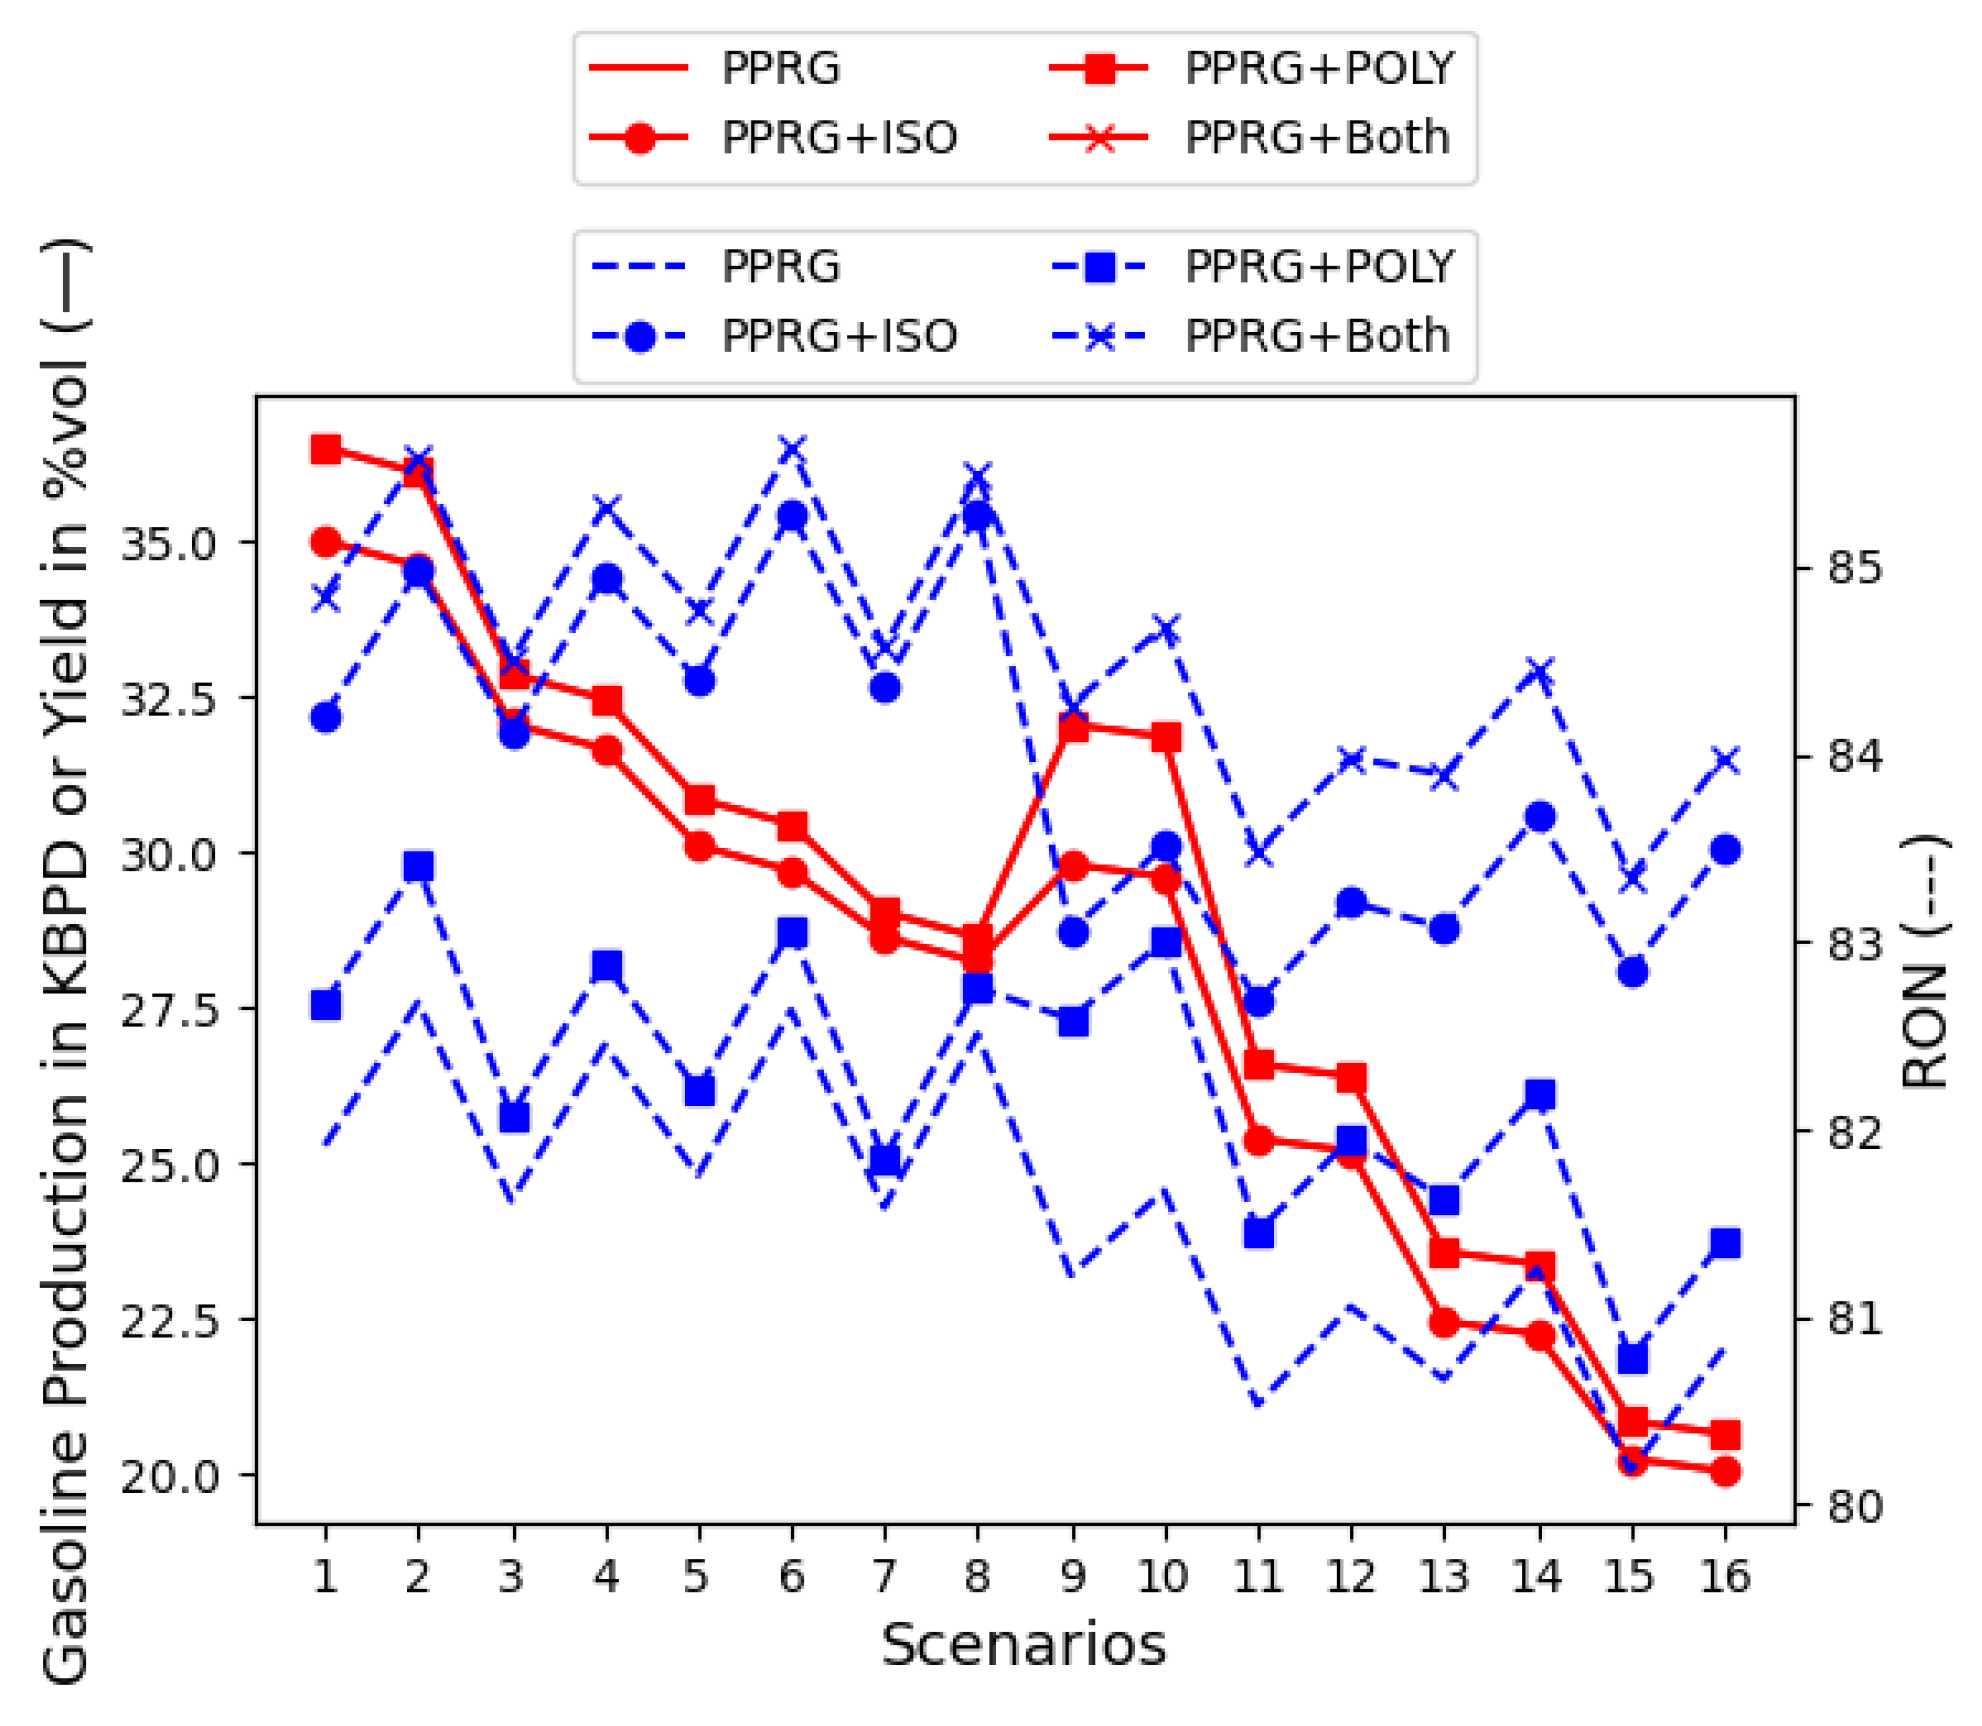
5.2. PPRG with Isomerate and Polymerate Units (Full PPRG)

Figure 7 shows the gasoline production/yield and RONs for the 16 primary manufacturer-made scenarios when adding the ISO and POLY units. These secondary MM selections are plotted upon the primary 16 MM scenarios for pure PPRG. These units promote increased ON streams by rearranging linear molecules into ramified naphtha molecules in the ISOU or grouping C2–C4 olefins into C4–C8 olefins in the POLYU. By including the ISO and POLY units in the network, the PPRG scenarios are known as full PPRG, where the maximum values of gasoline yield and RON can be obtained inside the refinery when using all remaining LN in the gasoline pool (without stocking LN).
Since the ISOU uses LN as the feed, no difference is found in the gasoline yields. What is fed by LN into the ISOU is reduced in the final gasoline pool, as seen in the flowsheet network in Figure 1. Due to the reduction in a low-ON stream because of LN and the addition of the isomerate stream (higher ON), the inclusion of the ISOU increases the RON by around 1.8 to 2.5 points in all scenarios. The LCN and REF streams are the determining causes of the increase in ARO and OLE concentrations among the scenarios. Hence, variations in the RON occur according to the antagonistic and synergistic effects calculated in the gasoline components’ blending values in Equations (16) and (17). The RON increases by 2 points in scenarios 1–8; in scenarios 13–16, this increase is about 2.5 points. This is expected to occur since the more spherical conformation on the ramified molecules from the ISOU has an antagonistic interaction on the ON; there are planar molecules in the gasoline-like streams and higher concentrations of ARO and OLE, as found in scenarios 1–8 according to the higher amounts in the REF streams (formed by the processing of HN, which presents higher yields in light petroleum). Particularly, from scenario 16 to scenario 9 (all for the same HN production in heavy petroleum), the observed increase in the RON by including ISO streams reduces it from 2.5 to 1.8 due to the ATR-to-CC route (if using RFCC or FCC) and CC mode of operation. In scenario 9, the highest concentration of ARO and OLE occurs when the selections of RFCC and CC in the gasoline mode are made.
For the POLY unit, gasoline yield increases when adding a new stream from the polymerization of the rich olefinic stream separated from the GASES feed; this increases the RON by 0.50–0.75 points in scenarios 1–8 and 0.75–1.25 points in scenarios 9–16. This is expected to occur, since the higher planar conformation on the polymers from the POLYU has an antagonistic interaction on the ON, with planar molecules in the gasoline-like streams and higher concentrations of ARO and OLE, as found in scenarios 1–8. Moreover, within scenario groups 1–8 and 9–16, there is a higher increase in the RON when the POLY stream is added in scenarios 5–8 and 13–16, where the lower production of LCN when using the FCC route (half of the RFCC route) reduces the ARO and OLE concentrations, diminishing their antagonistic effects on the ON in the blends.
Regarding the problem, it is thought that 30% of the LN stream from the CDU is diverted to the ISO feed, 50% of the GASES stream produced in RFCC/FCC is separated, and the olefinic-like stream is fed into the POLY unit. By including both units, a variation between 2.5 and 3.5 points in the RON is achieved when using the marginal or secondary manufacturer-made variations promoted by the ISO and POLY units.

5.3. The Full PPRG with Supply-Chain-Independent Variables

The SC-IVs of the exogenous (outside the refinery) components were added to the gasoline recipe. These SC-IVs were tested independently, with the maximum yield and RON obtained for the 16 main and secondary manufacturer-made scenarios (with ISO and POLY units included in the network) for the so-called full PPRG.

5.3.1. MTBE in the Gasoline Blend

The full PPRG scenarios were tested with 5%, 10%, and 15% additions of MTBE by volume. As seen in Figure 8, MTBE presents a more synergistic effect in scenarios 9–16 than in scenarios 1–8. As cited in [23], MTBE presents synergistic effects with paraffins, iso-paraffins, and olefins, and antagonistic effects with naphthenes and aromatics, corroborating the results in Figure 8. There is less reformate stream in the gasoline in scenarios 9–16 due to the reduced amount of HN in the heavy petroleum. Within the 1–8 and 9–16 scenarios, when choosing scenarios with FCC (5–8 and 13–16), the synergy with MTBE is higher than their counterparts (1–4 and 9–12 scenarios), since the CC at the ATR-to-CC in the VDU/FCC route provides fewer naphthenic and aromatic components in the final gasoline pool when the production of the LCN stream is lower.
Another confirmation of the correctness of the results in Figure 8 comes from [24], where the effect of gasoline fuels using MTBE was analyzed. The researchers found that MTBE effectively boosts the octane numbers of gasoline without adversely affecting its other properties, reporting that 5% to 20% (vol.%) of MTBE increases the RON of gasoline by 1.9 and 11.8, respectively. Our results show an increase of 2.0 at 5% MTBE for scenarios 1–8 (with more naphthenes and aromatics from the higher reformate streams) and 5.0 at 15% MTBE, also for scenarios 1–8. Additionally, the increase of 3.0 at 5% MTBE is found for scenarios 9–16 (with fewer naphthenes and aromatics from the lower reformate streams) and 8.0 to 9.5 at 15% MTBE.

5.3.2. ETH in the Gasoline Blend

The full PPRG scenarios were tested with ETH addition, as per the practice of Europe and the USA, at 5% and 10%, respectively. Figure 9 shows the resulting increase in the RON of around 2–3 points at 5% and 4–5 points at 10% of ETH. Similar to MTBE, scenarios 5–8 and 13–16, where the FCC is the catalytic cracking option, present higher synergy with ETH, considering that these scenarios have lower concentrations of olefinic and aromatic components in the final gasoline pool.

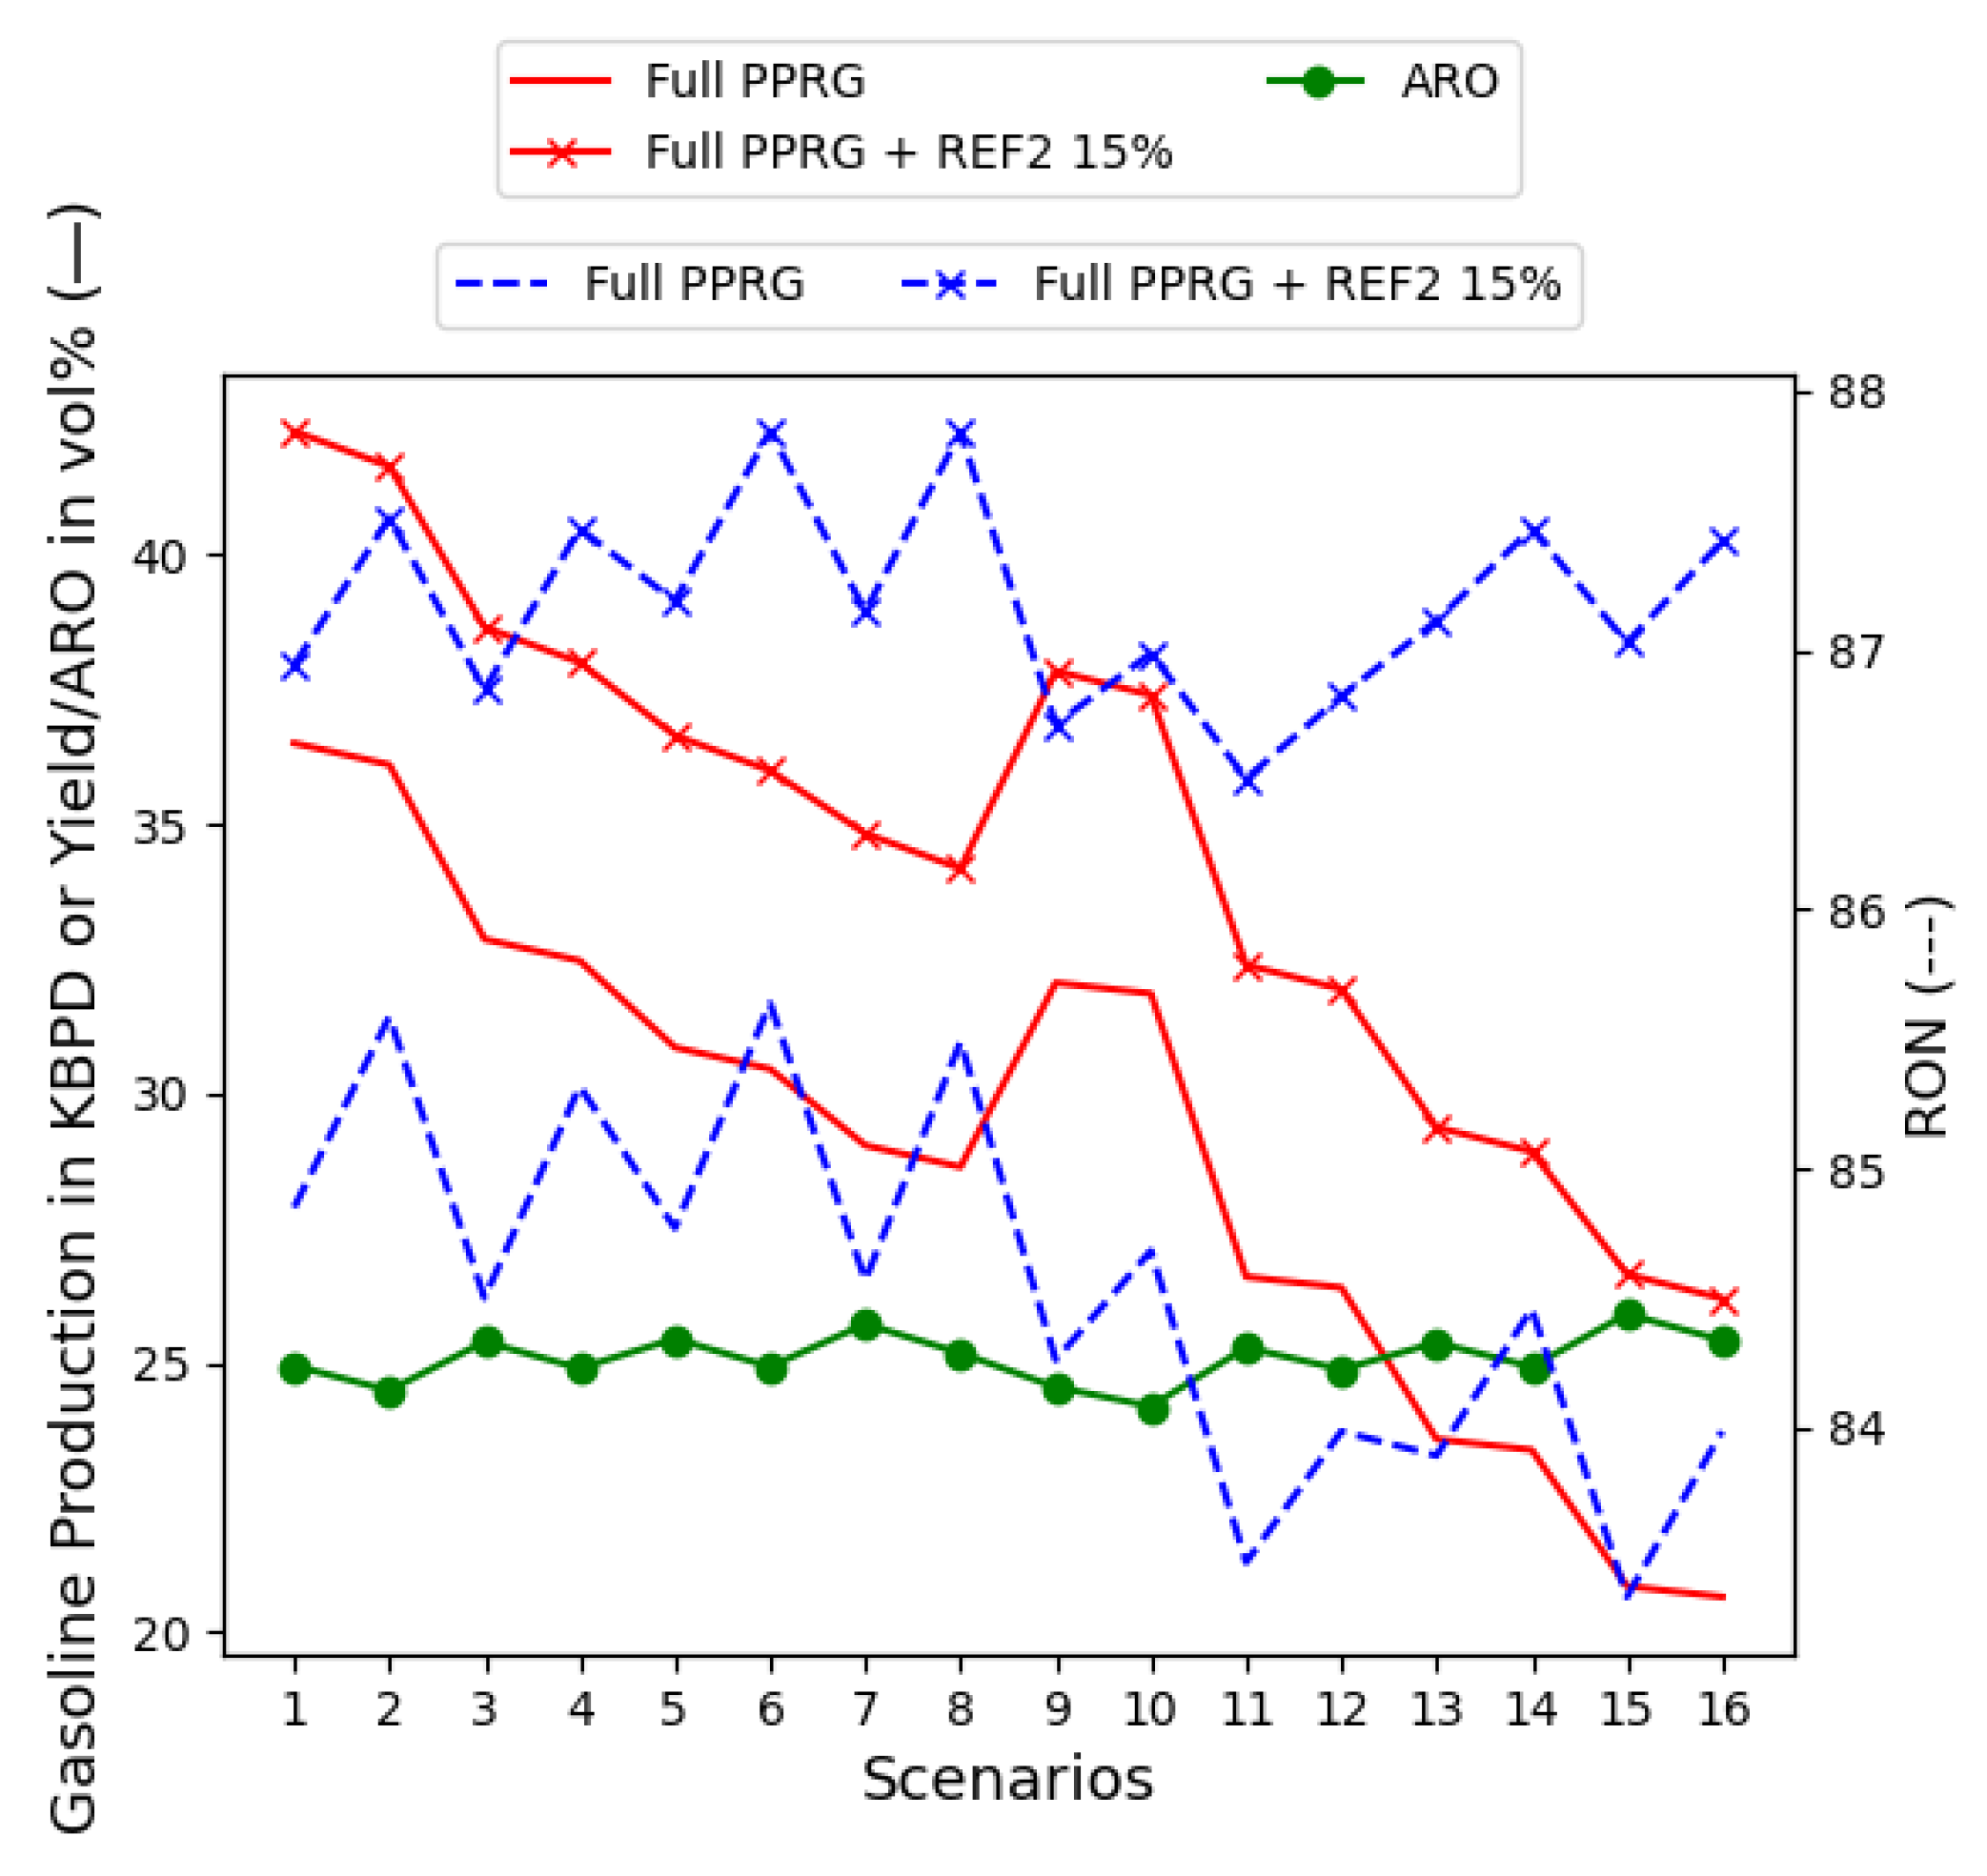
5.3.3. Extra Reformate (REF2) Unit in the Gasoline Blend

A second or extra reformate unit can be a valuable solution for countries with excess naphtha. However, in countries lacking such resources, establishing a second reformate unit may not be feasible, as they might need to resort to importing naphtha. It is worth noting that a specific aromatic constraint of a maximum of 25% by volume must be met in the final gasoline pool.
As seen in Figure 10, including more reformate has, indeed, led to an increase in gasoline quantity and ON (octane number) quality, tested until the 25% aromatic content limit is reached. In this recipe, around 5.505 KBPD of the extra reformate stream can be incorporated into the refinery’s gasoline pool (at 15% of the final gasoline content by volume). This resulted in a RON increase of around 2.5 to 3.5 points for scenarios 9–16 and around 2 to 2.25 points for scenarios 1–8. Similar to MTBE and ETH, the reformate stream enacts antagonistic effects on the ON in olefins, naphthenes, and aromatics, as seen in scenarios with RFCC selections. Therefore, an increased shift in the RON is observed in scenarios 5–8 and 13–16 (with FCC ATR-to-CC route selection) compared to their counterparts within the same group (1–8 or 9–16).

6. Interplay of Manufacturer-Made and Supply Chain-Related Dimensions

As seen in the results of each supply chain-related dimension built upon the 16 maximal routes for gasoline and pure PPRG yields, adding additive-like components such as MTBE to gasoline is crucial to meeting ON specifications; these are often set at a RON of 95 to 98, sold as premium gasoline in many countries. This is proven in Figure 8, where the 16 maximum PPRG blends with 5% to 15% MTBE by volume produced gasoline recipes with a RON of 91 to 94, with a 6–10-point increase in the RON at 15% MTBE by volume. However, due to mandates banning MTBE because of its deleterious effects on the environment and human health, relying on MTBE for ON specification must be avoided. If MTBE is added to the gasoline pool, it should be used as an additive rather than a main component, especially when added at 15% or more, as is done in some Middle Eastern countries. This is the main contribution of this paper: to prepare nations still producing PPRG mixed with MTBE in higher concentrations, as in the Middle East, for a transition away from MTBE.
Regarding sustainable liquid fuels worldwide, ETH is a viable gasoline component, as it plays a duel role of being a quantity-basic component (e.g., light cracked naphtha, LCN) and a quality-basic component (e.g., MTBE), in addition to its renewable footprint as a biofuel. Additionally, an extra reformate stream can be included in the gasoline pool to meet ON specifications, but maximum amounts of aromatic and benzene concentrations are limiting constraints. This extra reformate addition can be further explored if ETH is considered in gasoline recipes, as it helps to dilute the concentration of aromatic and benzene components. As seen, results on the interplay between these three supply chain-related gasoline dimensions (or exogenous independent variables) are needed to elucidate ETH’s role in sustainable gasoline production. Figure 4 shows a visualization of the supply chain cases plotted upon the 16 maximum PPRG yields and RONs. Since the maximum values of the yields and RONs are the main objective of the discrete-event simulation cases, the 16 main PPRG scenarios in Figure 3 with the maximum marginal increase promoted by the inclusion of both ISO and POLY units were tested alongside the supply chain or exogenous variables such as MTBE. As seen in Figure 8, Figure 9 and Figure 10, none of the supply chain options were sufficient to reach a RON of 91 and 95, typically specified for regular and premium gasoline, respectively.
In this context, to reach a reasonable scenario for gasoline production in a Middle Eastern country still using MTBE without ETH in the gasoline formulation and overproducing naphtha by processing petroleum condensates, starting from the full pure PPRG, a typical gasoline recipe can be blended (by volume):
  • MTBE at 5% instead of 15–20%, as per today’s recipes. A few points are plotted in Figure 8;
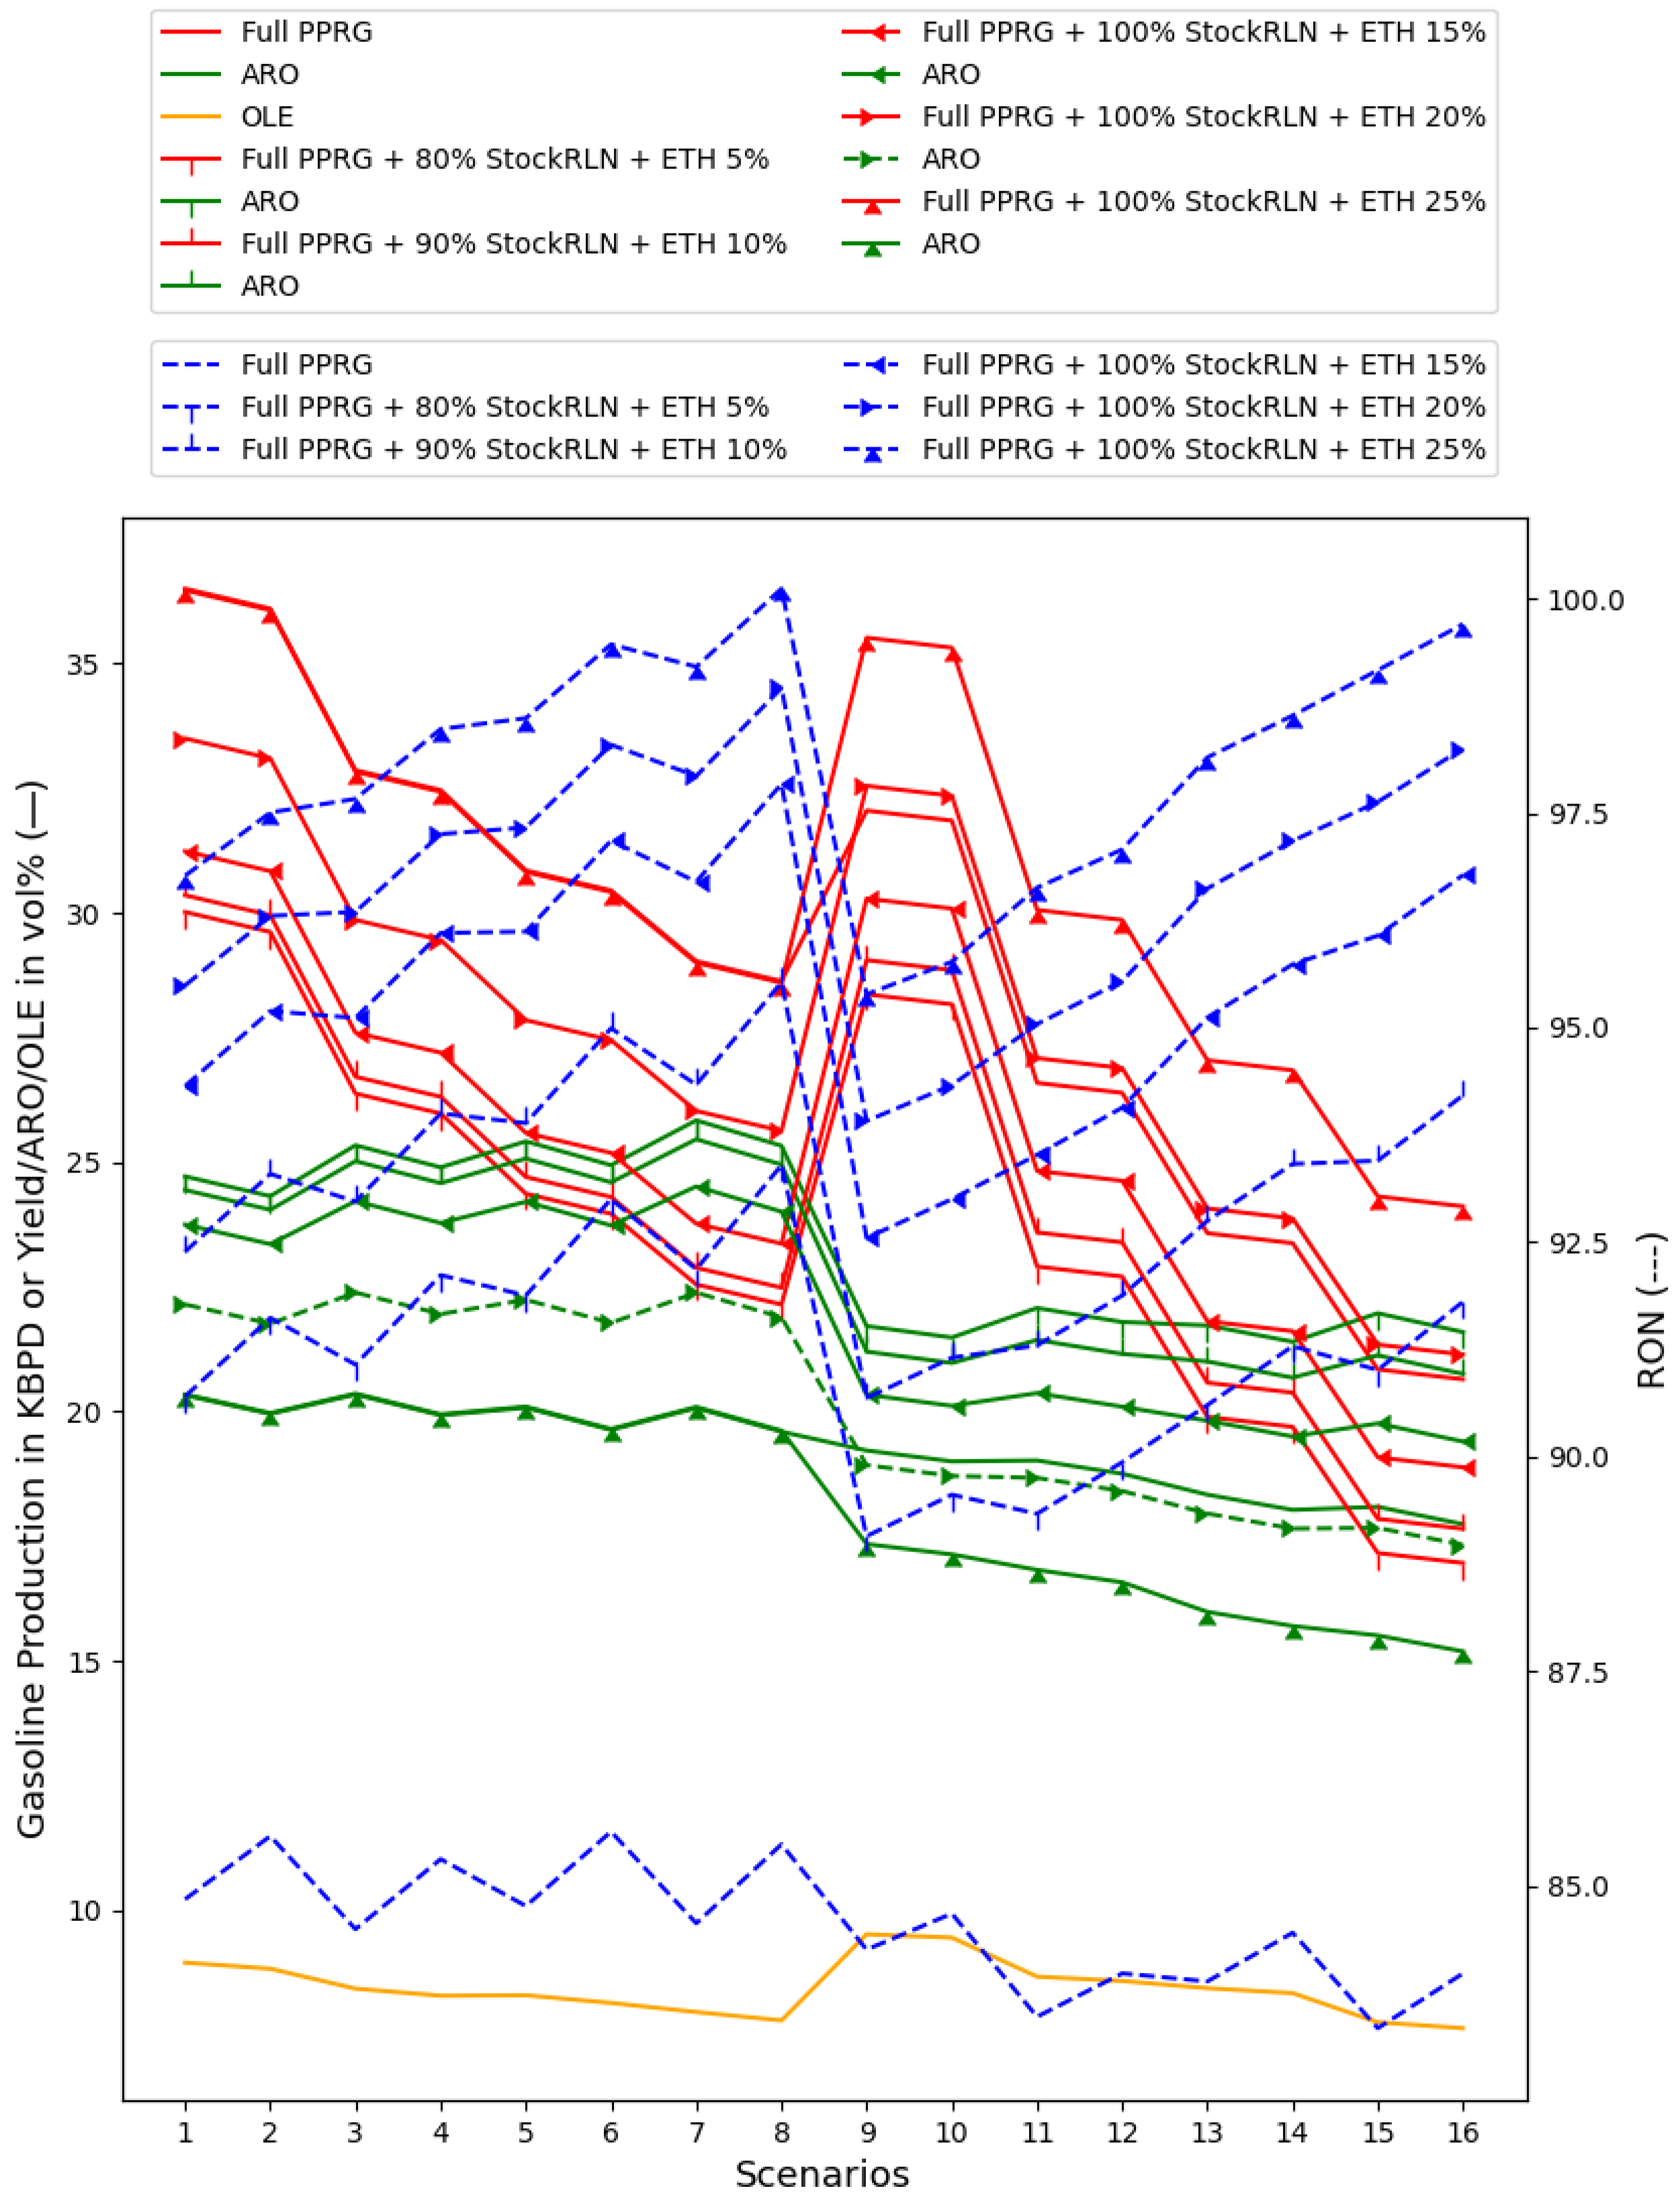
  • ETH at 10%, with 5% and 10% plotted in Figure 9;
  • An extra reformate (REF2) unit can be added until it reaches the aromatic content limit of 25% by volume, which is the typical maximum allowed content, as in Figure 10.
We evaluated the ETH increase in gasoline for our option at 10% (by volume) and its interplay with the other supply chain independent variables (SC-IVs) using the manufacturer-made or endogenous independent variables (ENDO-IVs) for the 16 maximum PPRGs when including ISO and POLY units; the following gasoline recipes are made by combining the exogenous independent variables (EXO-IVs) as follows:
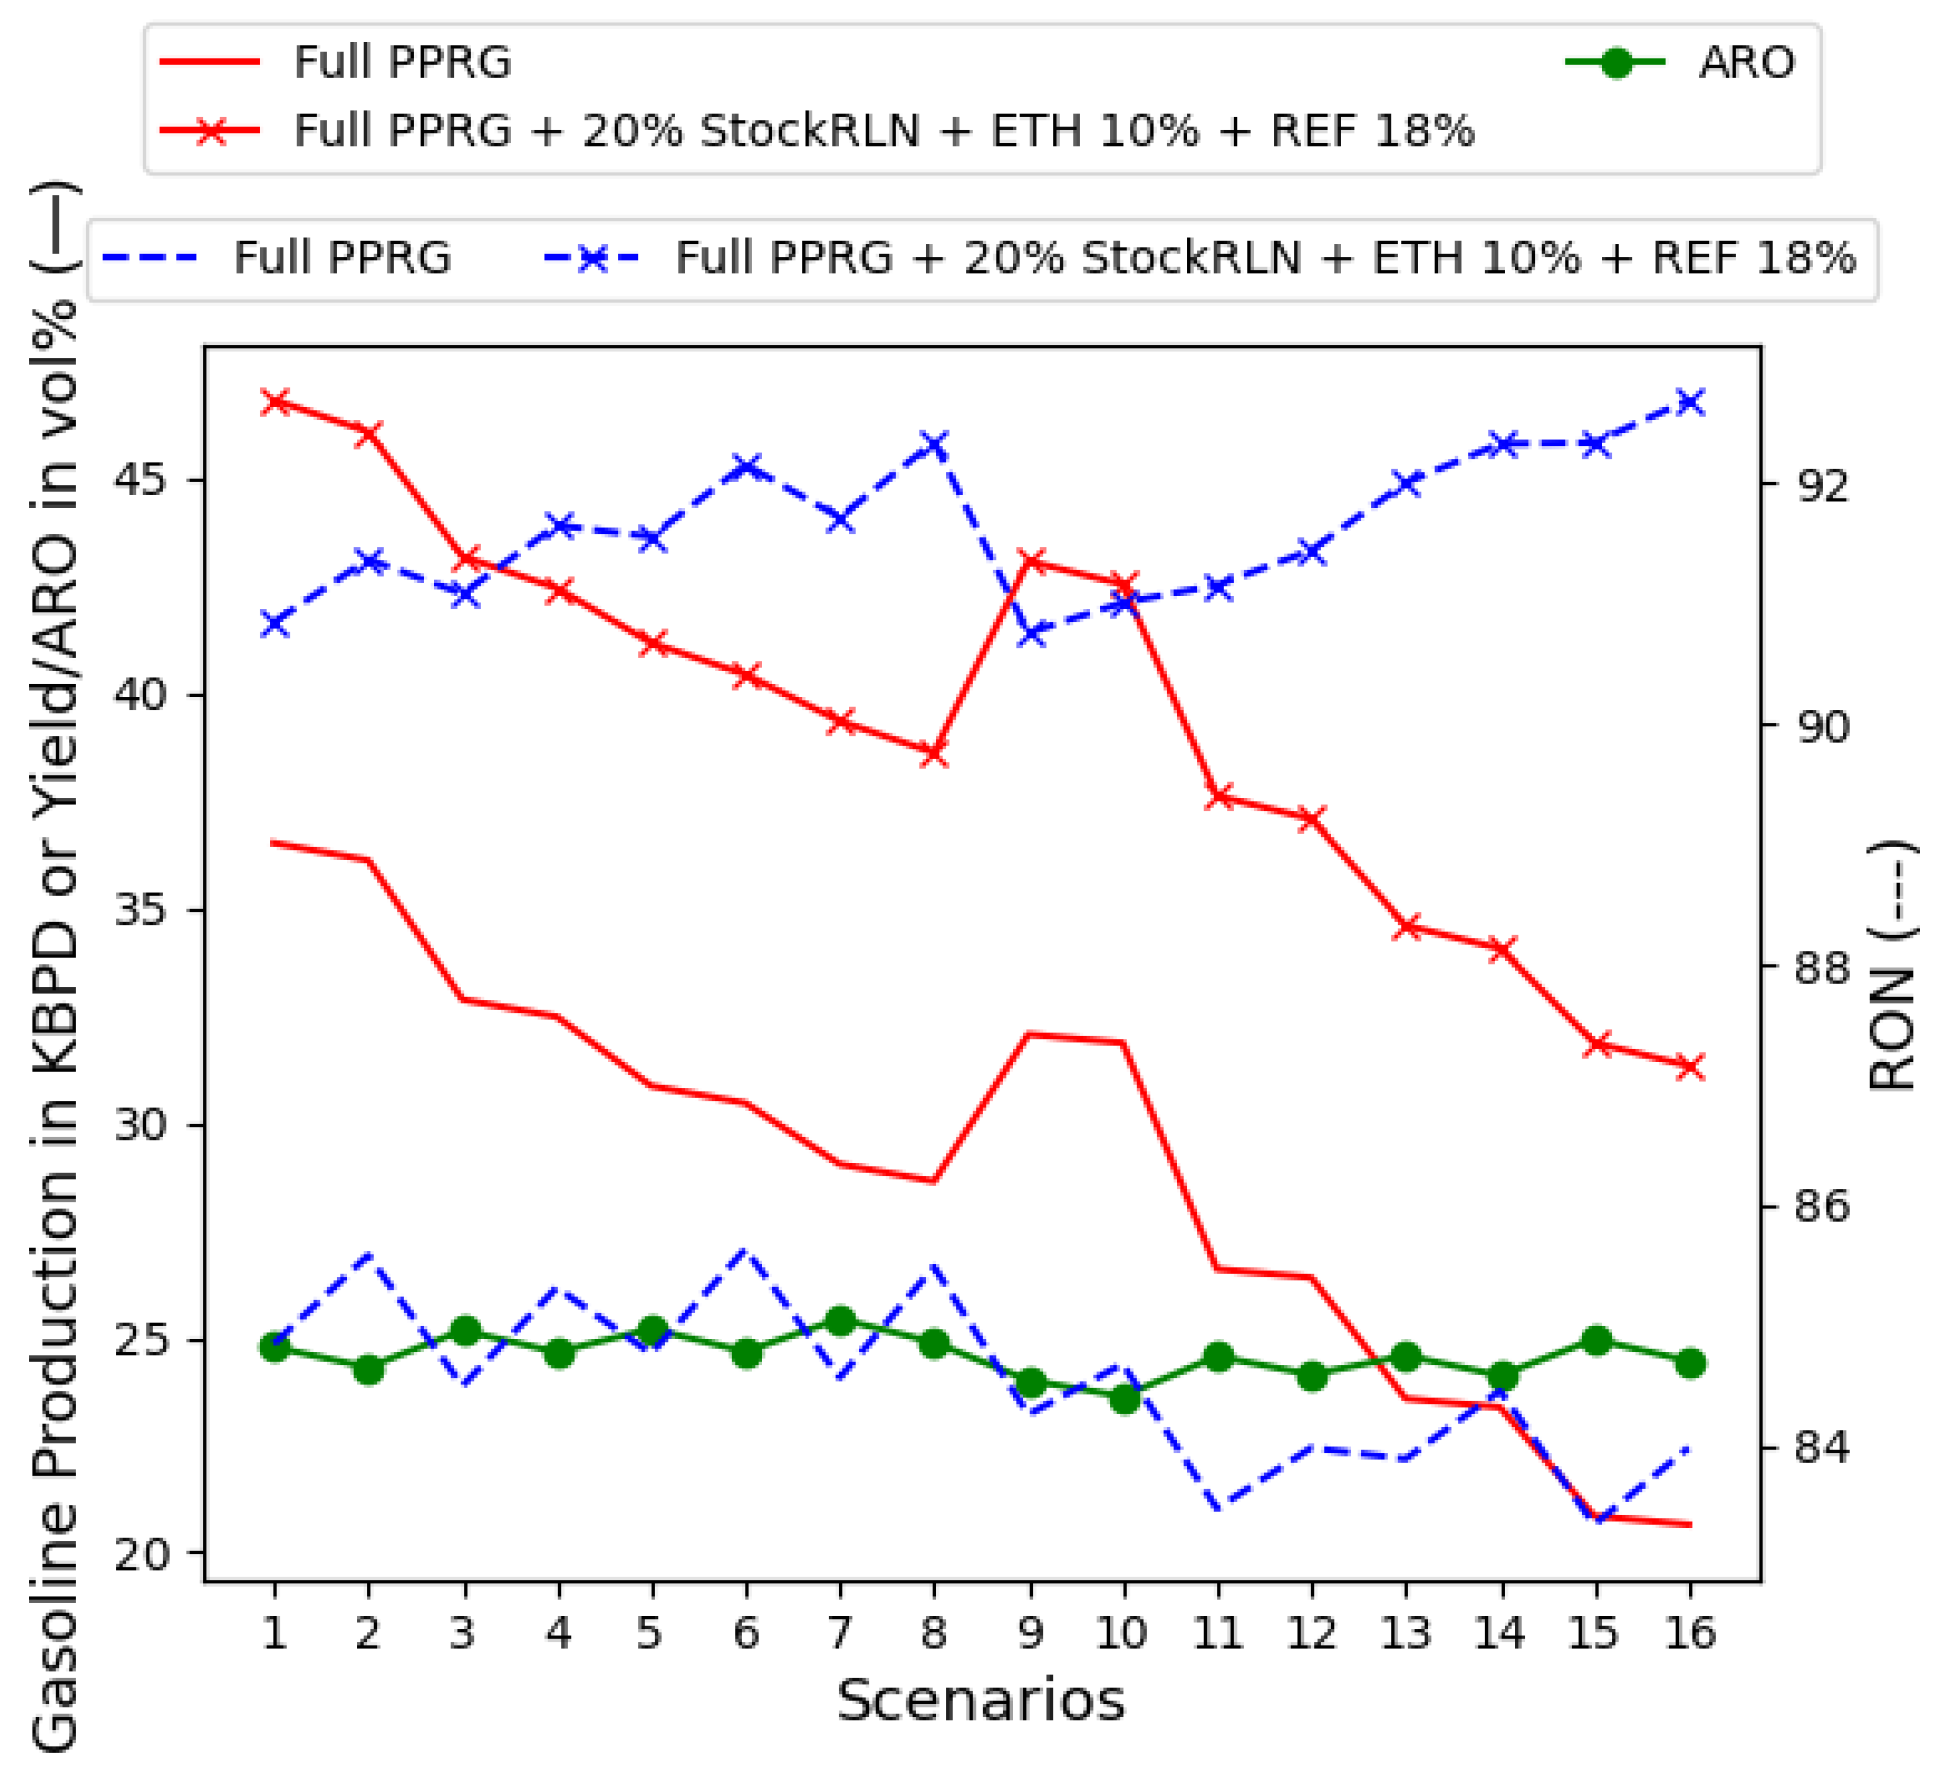
  • MTBE at 5% and ETH at 10%, as in Figure 11;
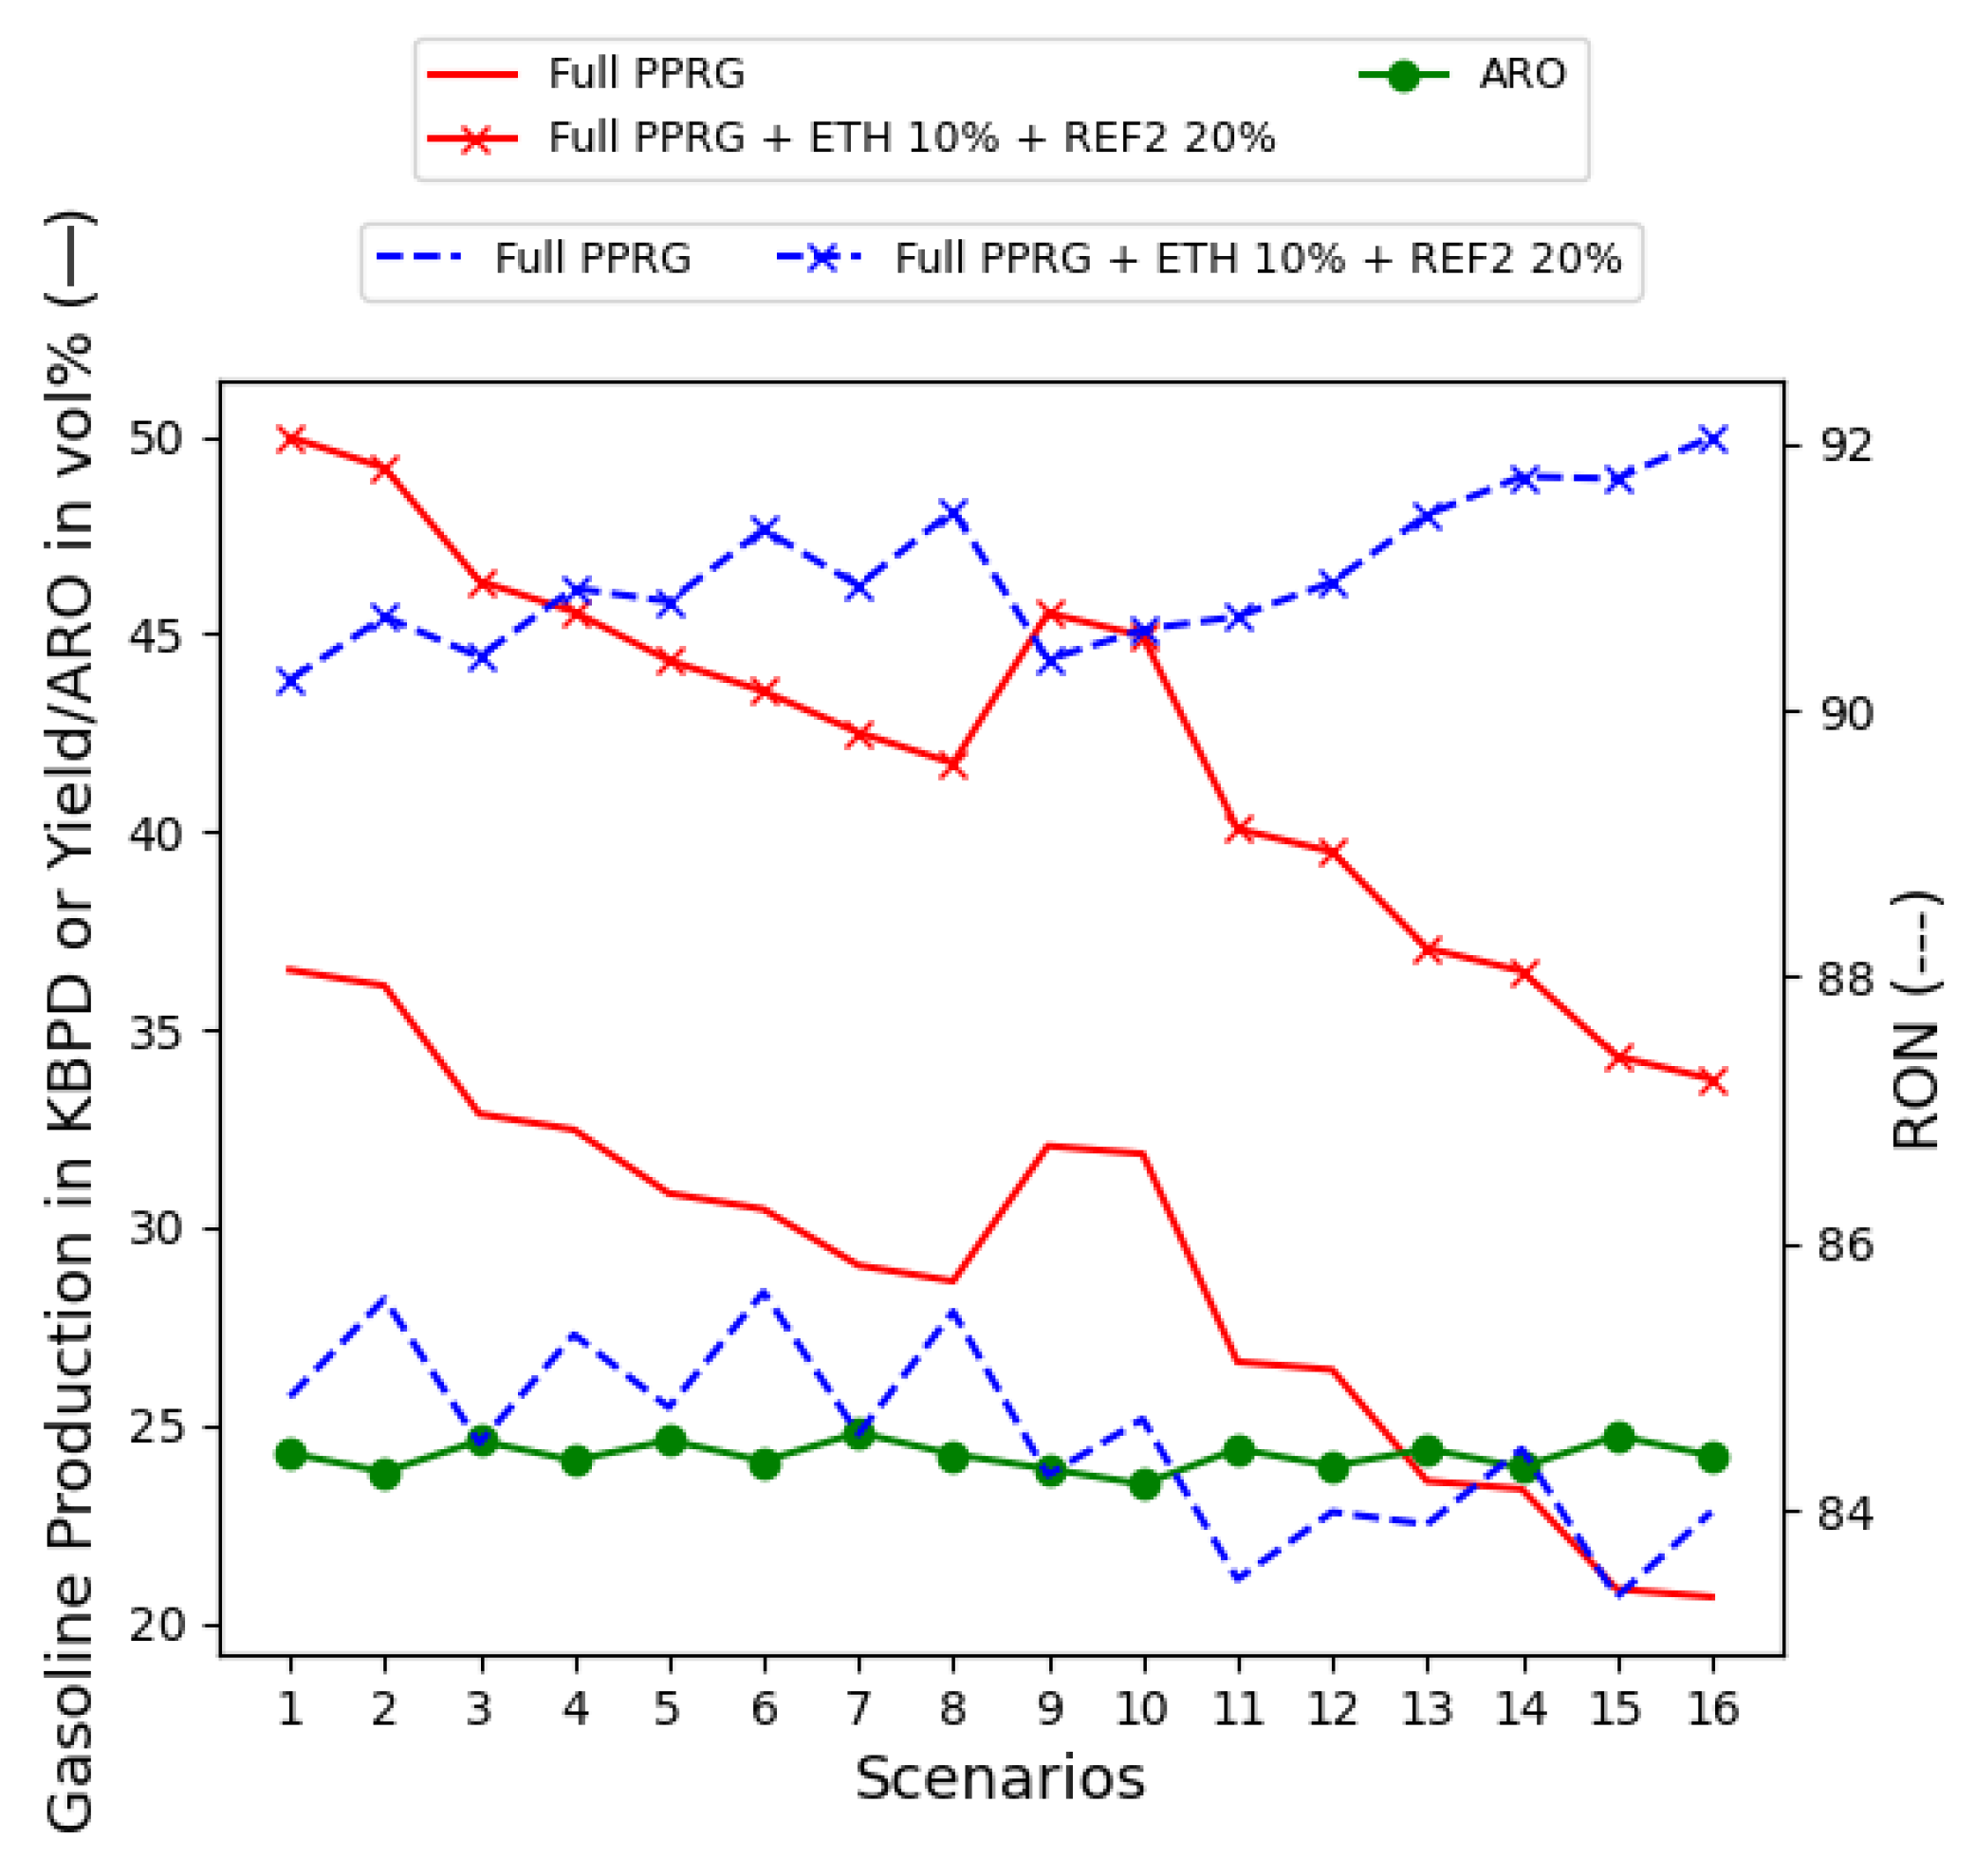
  • ETH at 10% and REF2 unit until ARO bounds around 25% by volume, which is found when REF2 is at 20% by volume, as in Figure 12;
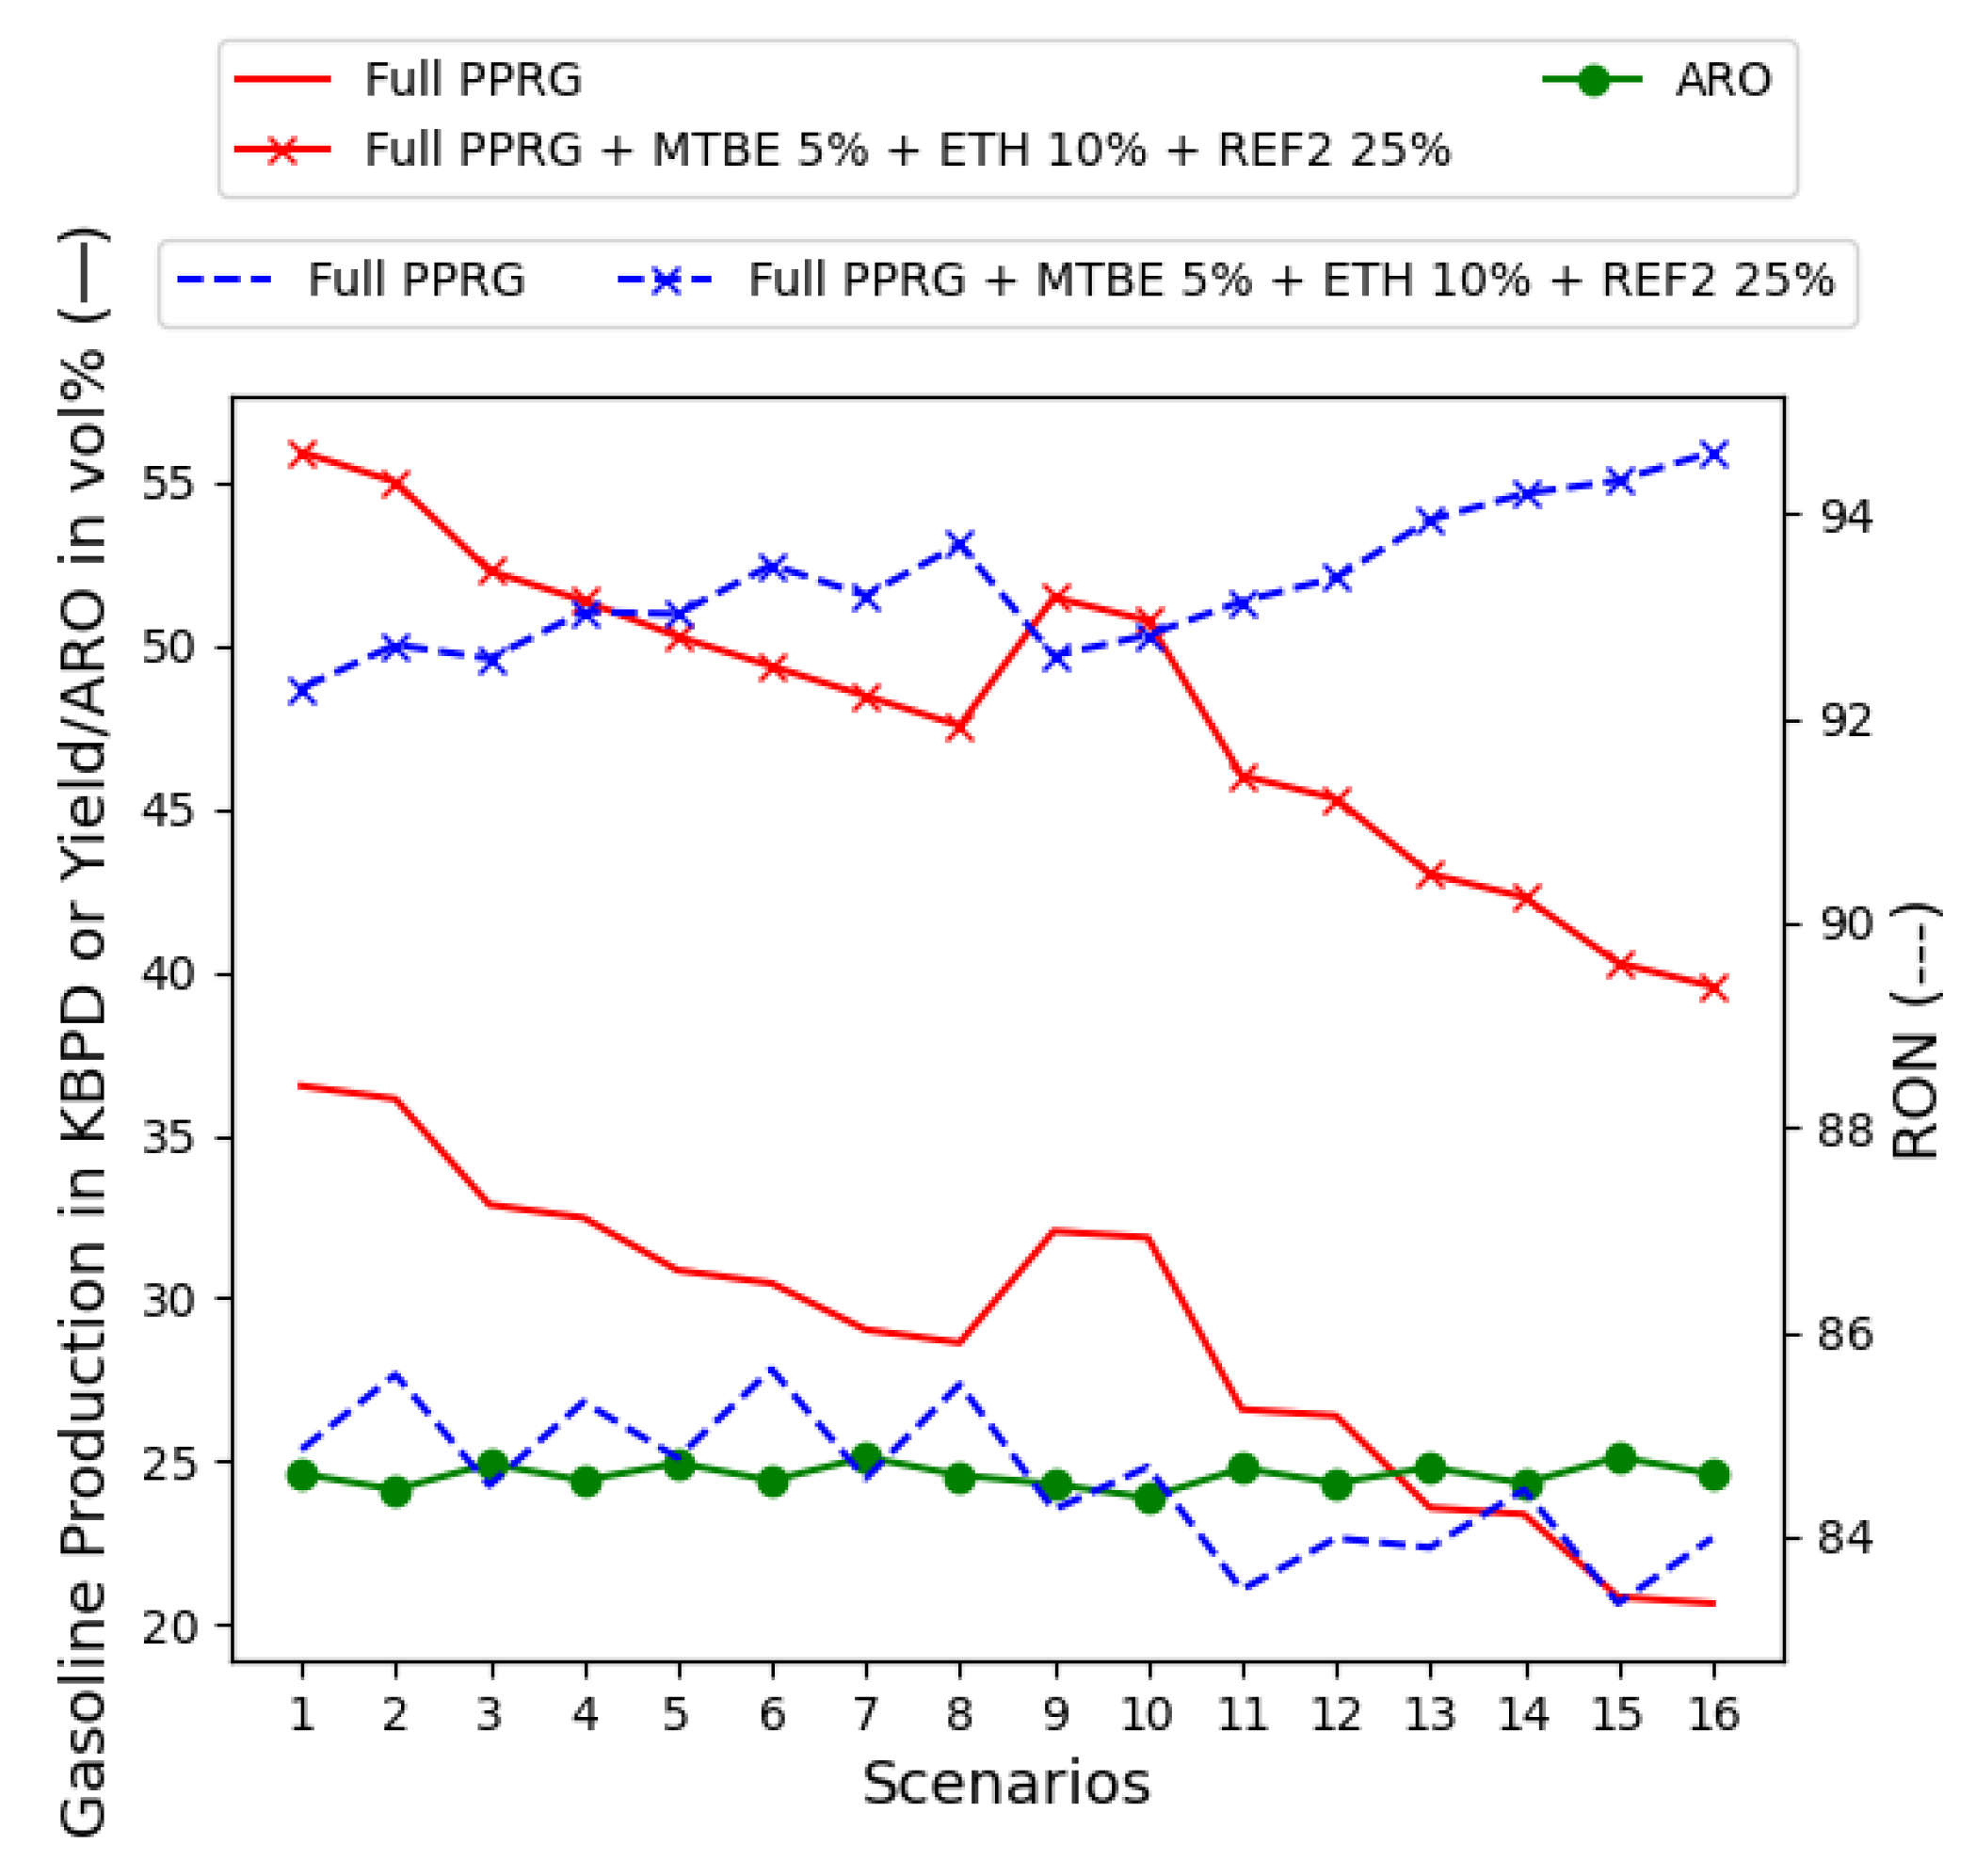
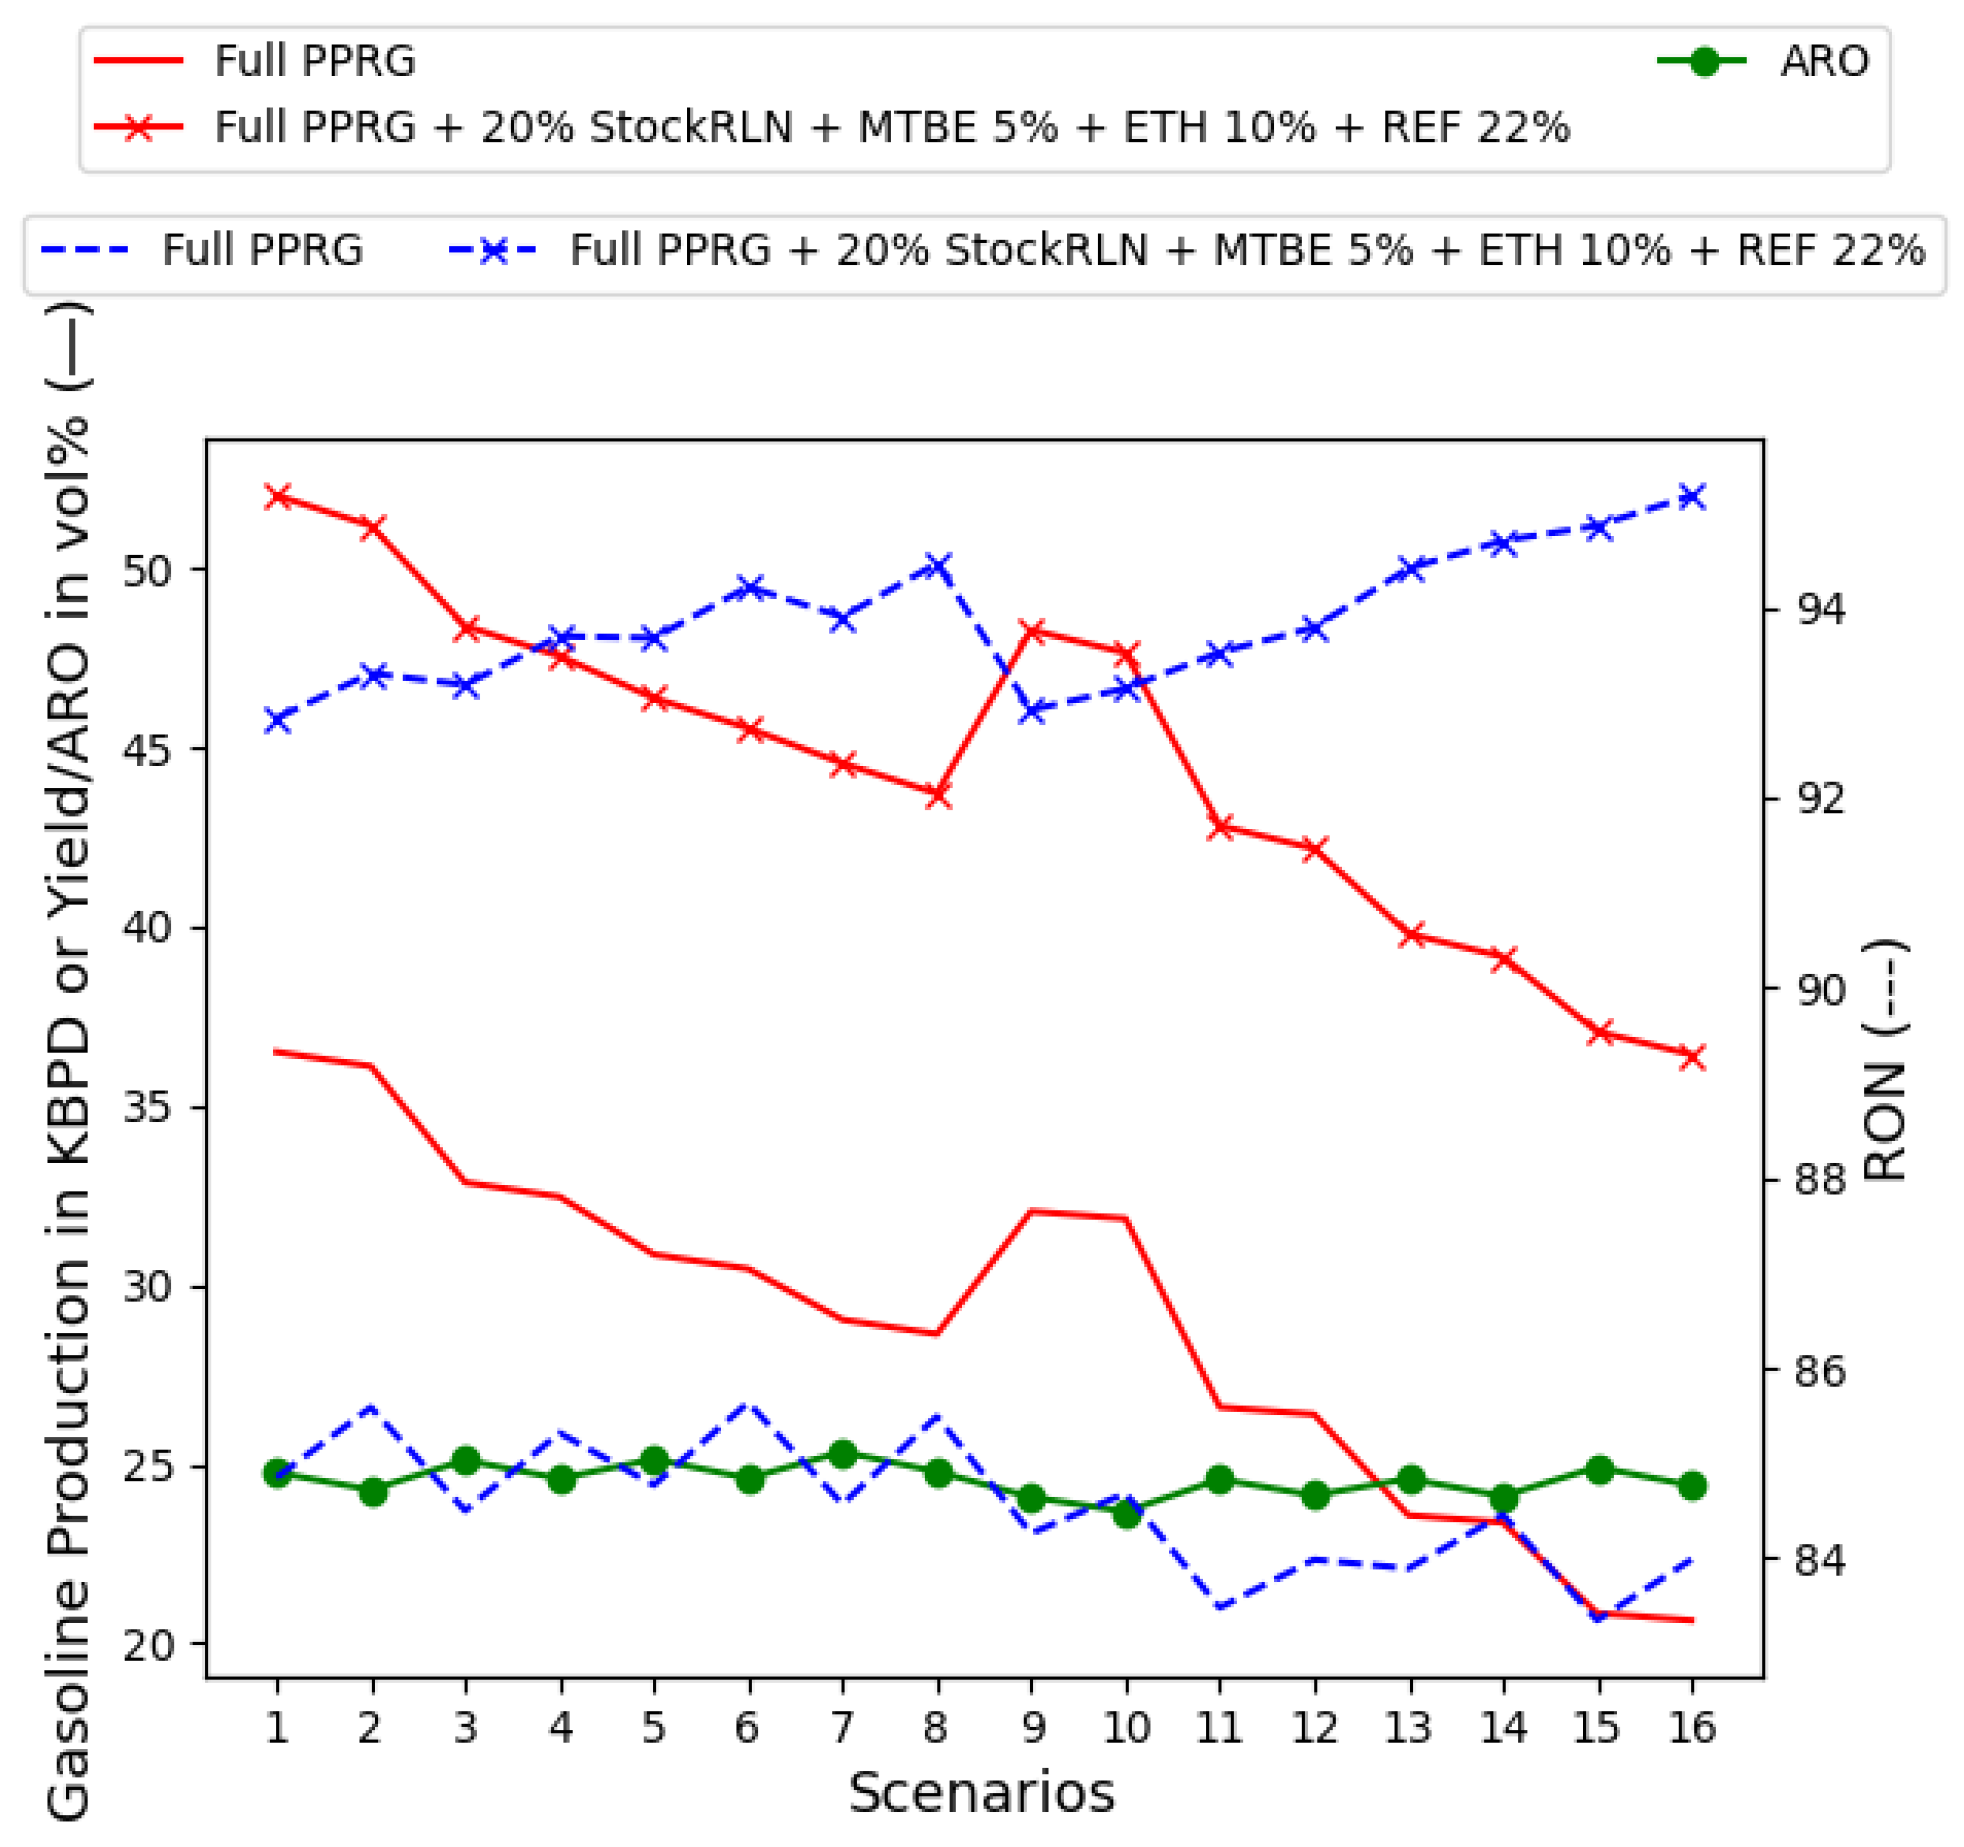
  • Mixing all supply chain-related dimensions, MTBE at 5%, ETH at 10%, and REF2 content, until the gasoline mix is bounded by 25% of ARO. This occurs at 25% of REF2 in the gasoline recipe, as in Figure 13.
The results in Figure 11 and Figure 13 open avenues for reducing or banning MTBE in the gasoline recipe in the Middle East by adding ETH at 10%, as is the case in the US. In all results, an RON of 90 to 91 as a minimum could be produced, making it possible to meet the specifications for regular gasoline. A total MTBE ban can be achieved by leveraging the advantage Middle Eastern countries have with reserves of light petroleum and condensates; this is shown in Figure 12, where at 20% of an extra reformate unit, a 91–92 RON is achieved in the gasoline pool, limited by 25% by volume. This extra reformate unit (REF2) could be allowed by using the internalization of heavy naphtha from external sources, as shown in Figure 13; we can see that refineries in Ras Laffan (in the north) export heavy naphtha to nations overseas instead of diverting it to the Umm Said Refinery (in the south); this could be responsible for RONs of 91 and 95 for gasoline production nationwide with the use of MTBE at 15% [9].
However, for ETH at 10%, both ETH with reduced MTBE (Figure 11) and ETH/REF2 without MTBE (Figure 12), or, more generally speaking, any scenario with ETH at 10% and REF2 (up to ARO at 25%), cannot provide the 95 RON grade of gasoline, which is demanded for premium gasoline products. Therefore, MTBE is still needed at 5 to 10%, as shown in Figure 14, where even at 5% MTBE, 10% ETH, and 25% REF2 (the amount where ARO reaches 25%), only a range of 92–94 for the RON is achieved. Of course, higher RON values would be achieved by increasing the volumetric concentration of MTBE and ETH in the blends. To support the increase in the RON, other operational strategies must be implemented to produce higher ON grades of gasoline, such as stocking LN and increasing the amount of ETH when producing gasoline.

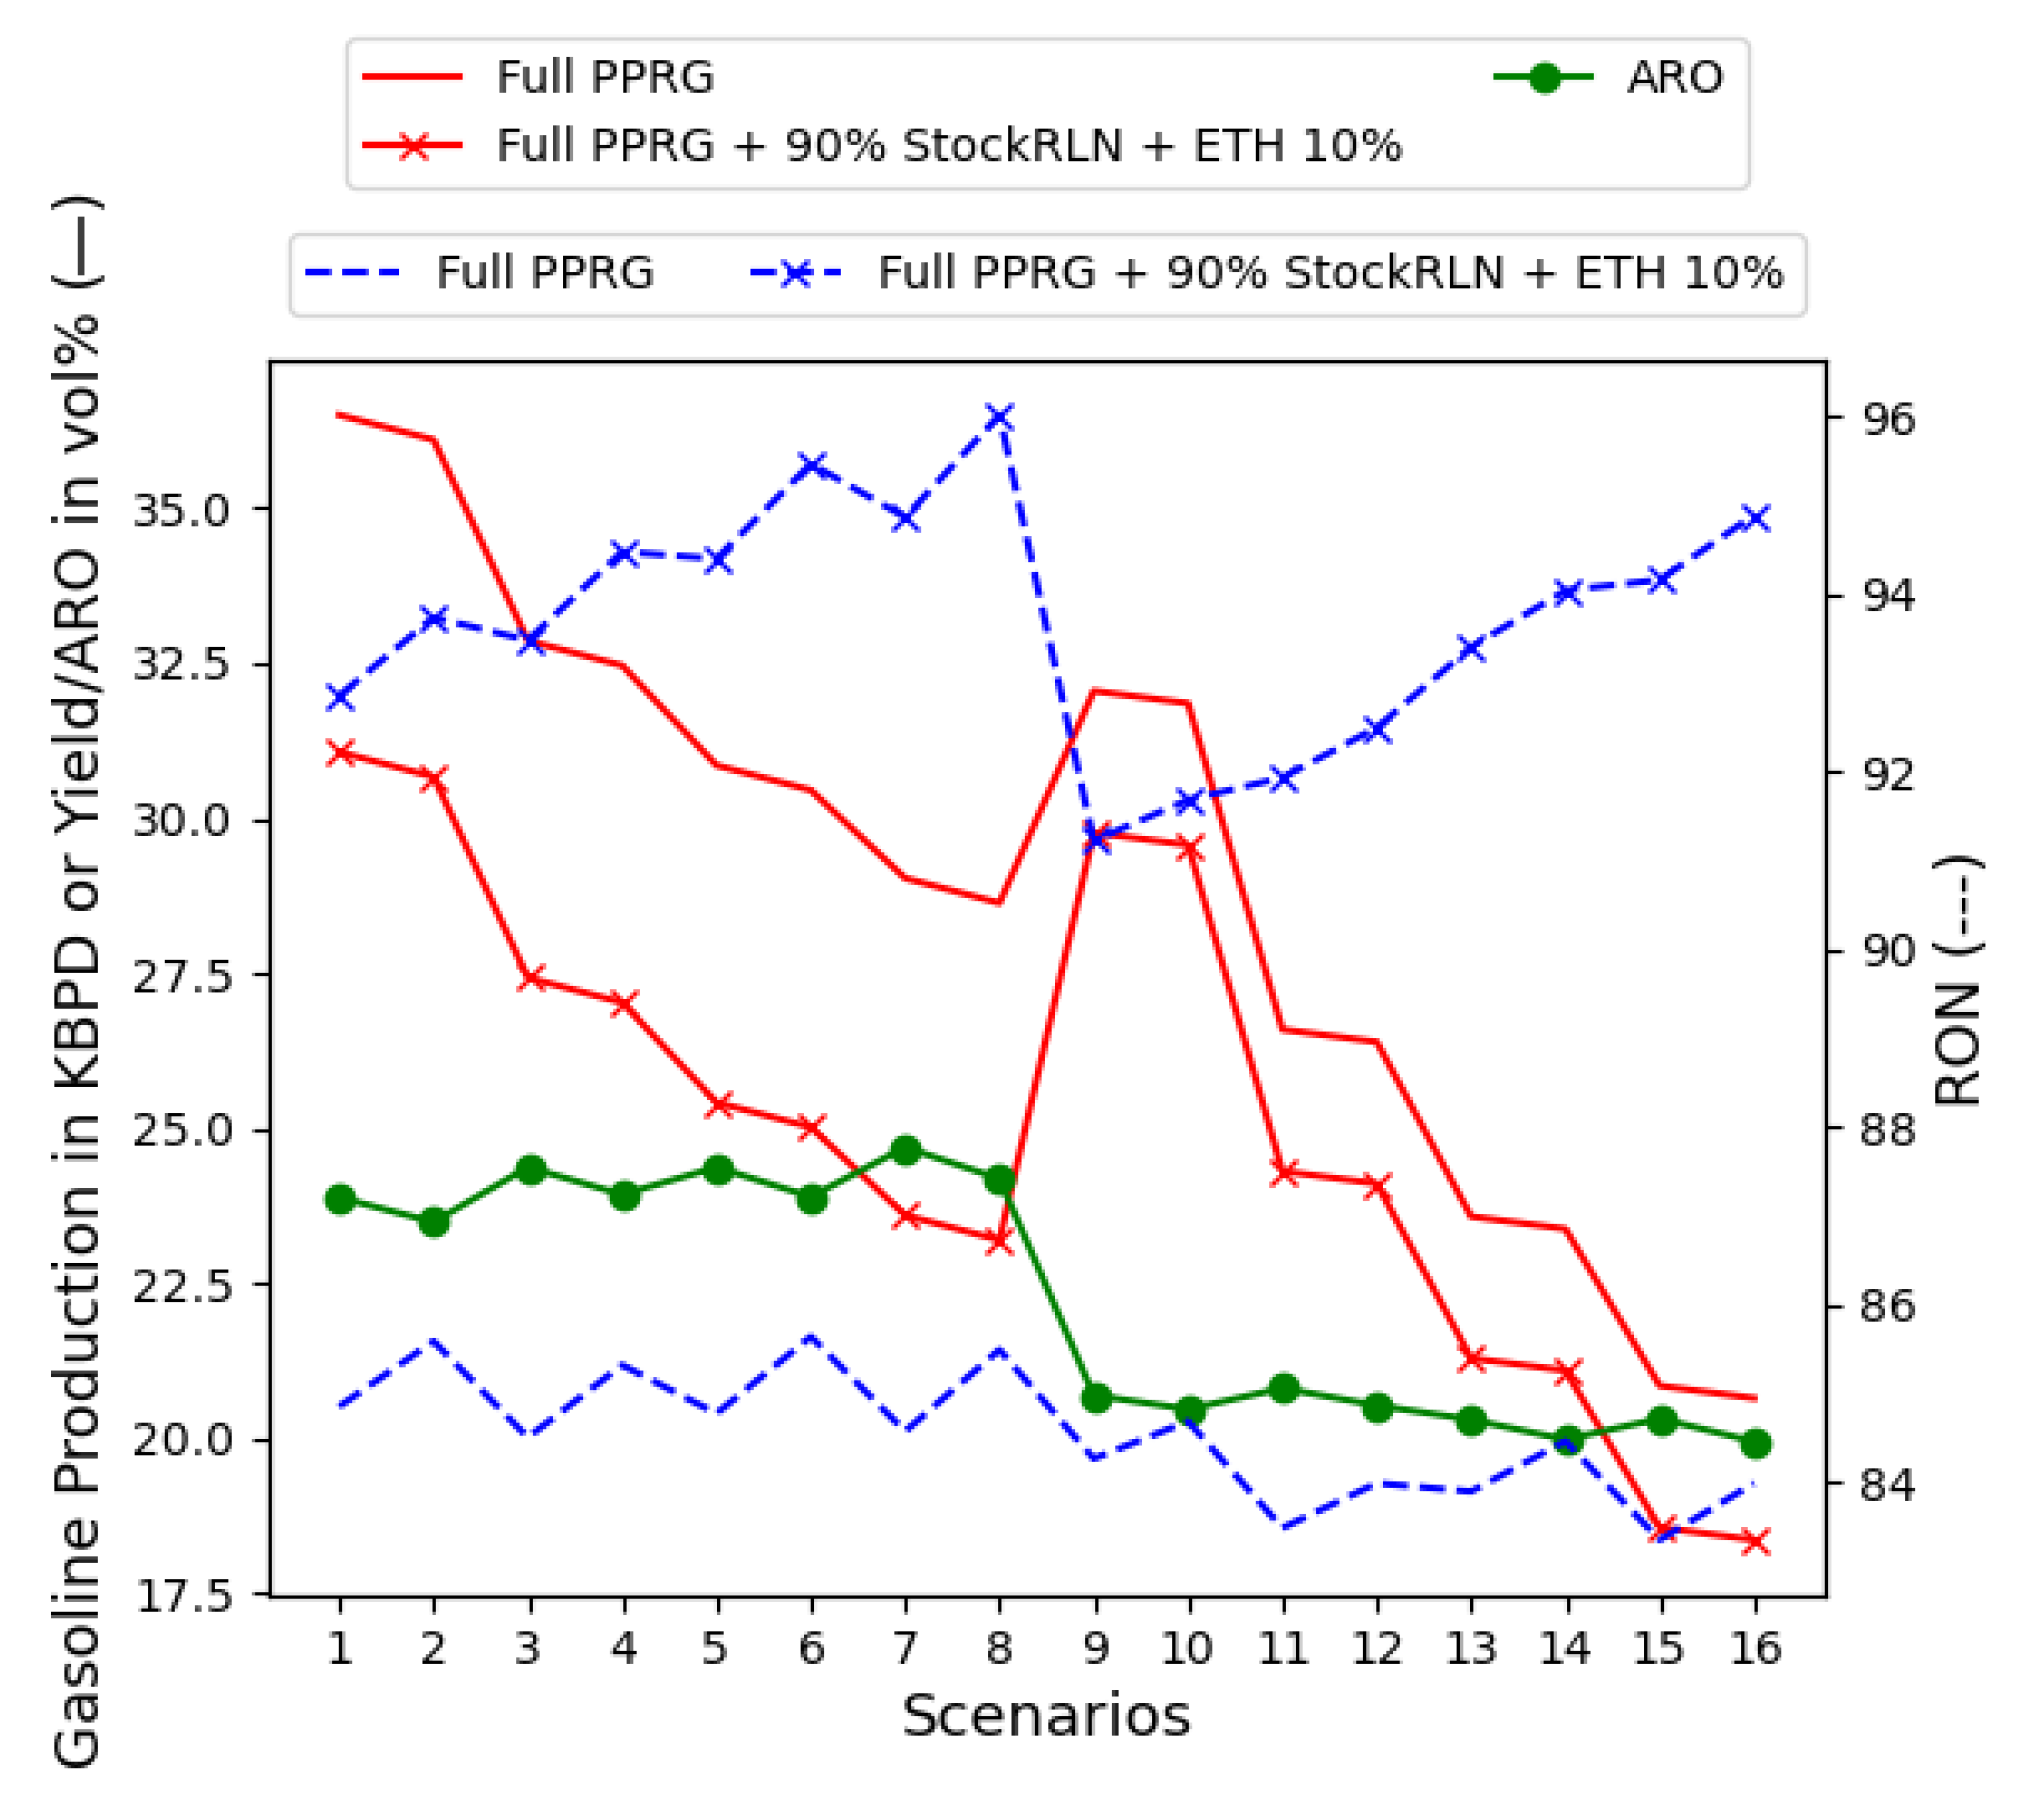
Reduction in Light Naphtha for Higher-ON Grades of Gasoline

Considering variations in the ON, for a petroleum refinery producing fuels such as gasoline using a process scheduling perspective, producing higher grades of gasoline (95–98 RON) is possible by reducing the LN content in the pool. Considering the recipe for the full PPRG production framework, from the full range of distilled LN, there is a split, where 30% is diverted to feed the isomerate unit, and the remaining LN (RLN) can be completely blended (as can be done for the PPRG) or stocked (when producing higher ON grades of gasoline). Figure 15, Figure 16, Figure 17 and Figure 18 show the effect of stocking the RLN until the ARO is at 25% by volume in the gasoline mix. These plots show how LN acts as a diluent of ARO concentration in the final gasoline recipes.
In Figure 15, the reduction in gasoline production is related to the stock of 60% of the remaining LN. This is the limit where ARO concentration is bound to 25% by volume. With this option, an increase of 3–4 points in the RON is found in the 16 PPRG cases. For the cases in Figure 16, with 10% ETH, 90% of the RLN can be stocked, and the gains in the RON meet the grade of 95 to produce premium gasoline. Therefore, there is a chance to enact mandates banning MTBE by stocking LN for 95 to 98 RON gasoline grades, but this is achieved using a biofuel such as ETH in the formulation.
Another interesting observation in the stock of LN analysis is presented in Figure 17, where adding an extra reformate unit (REF2) and ETH when stocking LN (at the 25% ARO limit) is not necessarily the best option, as LN is necessary for the pool to reduce ARO. In this case, no more than 20% of the RLN can be stocked when including REF2. To conclude the analysis of the scenarios by interplaying the supply chain or exogenous variables, the case with all SC-IVs in Figure 18 repeats Figure 14 at 5% MTBE, 10% ETH, and REF2 up to 25% ARO concentration. In this case, the RLN is 20% (stocked), and the REF2 unit is 22% by volume in the final gasoline pools across the scenarios. In this case, no gains in obtaining higher ON grades are achieved by stocking the RLN, as seen in Figure 18, compared with Figure 14. In these recipes, higher values of RON are achieved by controlling the addition of the RLN to the gasoline. Hence, stocking LN is an operational decision that must be made when producing different grades of gasoline.

7. Final Remarks

7.1. Banning MTBE from Gasoline

When searching for scenarios that allow for a total MTBE ban, two shortcuts to reach the 95 RON gasoline grade (premium gasoline) are shown in Figure 16; these were further explored. In this scenario, the stock of the RLN is combined with ETH at 5% to 25%, without including REF2. As shown in Figure 19, at the full PPRG baseline, the ARO content ranges from 19 to 20% by volume, so there is room to avoid the total amount of LN produced in the refinery. Therefore, it can be stocked to increase the RON in the final gasoline pool (at the cost of losing a diluent of ARO). This RLN stocking (or avoidance of blending in the pool) is partial at 80% and 90%, with 5% and 10% ETH by volume in the gasoline pool, respectively, to guarantee ARO dilution. However, at 15% ETH and higher, avoiding RLN can be achieved, reaching the maximum RON possible.
The addition of an extra reformate (REF2) is not under consideration, as it competes with stocking LN as an undesired ARO concentration booster. This is corroborated by Figure 17, where the inclusion of REF2 implies reducing RLN stocking to maintain the ARO below 25% by volume. Furthermore, as more ETH is added to gasoline production, more RLN can be stocked, and REF2 can even be included, as an increase in ETH acts as an ARO diluent.
From 5% to 25% by volume, ETH is added to the gasoline blends, and the stock of the RLN is determined by limiting ARO concentration to 25% by volume. At 5% ETH, RLN stocking reaches 80%, so only 20% of the RLN is blended into the final gasoline pool. At 10% ETH, RLN stocking reaches 90%, so only 10% of the RLN is blended into the final gasoline pool. These recipes showed an increase of 5–10 points in the RON across the 16 full PPRG scenarios (those with ISO and POLY units included). For scenarios 1–8, the reduced ARO concentration, compared to scenarios 9–16, yields higher RONs, with a range of 1–2 points above. This RON difference between groups (group 1—lighter petroleum: scenarios 1–8; group 2—heavier petroleum: scenarios 9–16) is enlarged when stocking RLN and adding ETH, as proposed in the recipes in Figure 19. Since there is more LN in light petroleum (as in scenarios 1–8), the effect of stocking it on boosting the RON is higher in this group than in group 2. Within the groups, the scenarios with RFCC (scenarios 1–4 and 9–12) presented a reduced increase in the RON compared to their counterparts in the same group for the same petroleum. This is caused by the increased olefinic (OLE) concentration when RFCC is selected due to higher amounts of LCN produced in this ATR-to-CC route. Therefore, the olefinic components present in the LCN streams have an antagonistic effect on the ON when blended with ETH.
The other recipes in Figure 19 consider that 100% of the RLN is stocked and 15%, 20%, and 25% ETH (by volume) is added to the gasoline pool. At 15% ETH, all scenarios in group 1 and the FCC scenarios in group 2 (scenarios 13–16) can reach a RON of 95. At 20% ETH, an RON of 95 can be achieved for scenarios 11–12. At 25% ETH, a RON of 95 is met in all scenarios, where even scenarios 11–12 present a surplus of quality (premium quality), since they reached a RON higher than 95. It can be observed that ETH acts as an ARO diluent, similar to LN, as for 15 to 25% ETH, a reduction in ARO concentration is found. This role of ETH as an ARO diluent opens the possibility of exploring the inclusion of an extra reformate (REF2) unit to achieve even higher RON values.

7.2. Reduction in CO2 Footprint Using ETH in Gasoline

To conclude, regarding the impacts of ETH on sustainable gasoline, the reduction in CO2 emissions per liter of gasoline for E5, E10, E15, E20, and E25 grades is plotted in Figure 20, along with the total amount of CO2 emissions per scenario for these gasoline grades with ETH. The baseline emissions are defined in the full PPRG (pure petroleum-refined gasoline) with roughly 2.347 kg per liter (kg/L), which is the average release of CO2 emissions during the combustion of mineral gasoline.
Considering the average release of CO2, the reduction in CO2 emissions (in kg/L) is proportional to the increase in ETH content in the gasoline pool [1,23]. It reduces approximately 0.117 kg/L of CO2 for every 5% increase in ETH. This evaluation is made by multiplying the total emissions from the baseline case (2.347 kg/L) by the reduction in refined gasoline with the addition of ETH [5,35]. The maximum gasoline production gains in terms of the ON (octane number) are around 96–100 points by avoiding the blend of RLN at the highest ETH concentration possible without damaging non-flex-fuel engines. This limiting ETH concentration is found at 25% by volume in gasoline, as beyond this threshold, the fleet must be adapted to be fueled by any combination of mineral gasoline and anhydrous ETH, including 100% hydrous ETH (with 4% water by volume) [5].
For the total CO2 emissions, reduction follows the stock of RLN and the addition of ETH. From the baseline (the full PPRG), the recipe including 80% RLN stock and 5% ETH reduces CO2 emissions by 3 kilotons. This reduction is proportional to the decrease in gasoline production by avoiding the blend of 80% of the remaining LN components in the gasoline pool. This is sufficient to reach a RON of 90 or more in scenarios 1–8 and 13–16, but not in scenarios 9–12, as seen in Figure 18. This demonstrates the antagonistic effect of ETH in elevated aromatic (ARO) and olefinic (OLE) concentrations on the ON; this can be seen in scenarios 9–12 using the RFCC selection, which produces twice the LCN streams compared to the FCC selection in scenarios 13–16. Although ETH reduces the same CO2 footprint for all scenarios (since it depends on the ETH content), its effect on the ON varies according to the molecular composition of the gasoline blend. Hence, ETH’s indirect CO2 intensity effect on the RON for better performance during the combustion process differs per scenario. Therefore, less CO2 formation is observed for the same power released in the fleet’s motor engines in higher ON figures.

8. Conclusions

Considering all manufacturing and supply chain variations presented in this work, there are several ways (from those strategic to operational) to meet the ON requirements for antiknock or the avoidance of spontaneous ignition before the electrical spark in gasoline motor engines (the Otto cycle). In the production of gasoline (petrol or gas) sold in fuel stations, the primary manufacturer-made gasoline includes petroleum raw materials (light or heavy), ATR routes (RFCC or FCC), RFCC/FCC modes for gasoline and diesel, and reformate units in low- or high-ON modes. Additionally, decisions to include isomerate (ISO) and polymerate (POLY) units, either through installation or operation (depending on the discrete-event selection), can be implemented. For the out-of-refinery or exogenous gasoline components, logistics and plant production limits must be accounted for in the gasoline recipes determined by supply chain-related variations, such as MTBE, ETH, and extra reformate, in moving toward sustainable liquid fuels worldwide.
Among nations, MTBE and ETH are blended into the gasoline pool as octane-rating boosters. After the ban of MTBE in gasoline in most countries in 2006, ETH became the primary alternative to reach ON grades, such as regular (a RON of 91) and premium (a RON of 95–98) gasoline products. In nations with excess naphtha, such as Qatar in the Middle East, extra reformate blending is a strategy for boosting the ON of gasoline. However, it is insufficient to produce a RON of 91, as seen in Figure 9. As proposed in this work, an additional maneuver to increase the ON in the pool is the stocking of RLN to avoid blending such a low-ON stream (as seen in Table 1) into the gasoline mix. However, this must be carefully managed, as this stream acts as an aromatic (ARO) diluent, as seen in the results of the plots in Figure 15, Figure 16, Figure 17 and Figure 18, where stocking the RLN is explored until the ARO concentration limit of 25% by volume is reached.
The results confirm that ethanol, at higher blend levels, not only compensates for MTBE removal, but also enables flexible gasoline manufacturing pathways that optimize refinery operations. This is particularly relevant for refineries with surplus naphtha streams, where ETH incorporation can reduce reliance on severe reforming operations, thereby improving hydrogen balances and refinery efficiency. Additionally, this study highlights how refinery processing modes (e.g., reformate severity, RFCC/FCC operation) interact with ethanol blending strategies, providing insights into how refineries can adjust their gasoline formulations dynamically.
Toward sustainable gasoline worldwide, recipes without MTBE and with higher ETH content (a renewable fuel) are determined in this work. Higher ON grades than those for ETH at 10% by volume must be achieved to meet a RON of 95 to 98; this is demanded for premium gasoline grades. As indicated in Figure 16, combining the stocking of RLN and ETH at 10% by volume can provide a RON of 95 in a few scenarios. This was further tested (Figure 19) by stocking RLN and adding elevated levels of ETH, respecting the mix at a 25% maximum ARO concentration.
Future studies could focus on optimizing PPRG, manufacturer-made gasoline, and supply chain schemes using optimization techniques in IMPL. This would help validate the results of the discrete-event simulation and determine the optimal scenario for ethanol integration, balancing refinery operations, supply chain constraints, and gasoline quality targets.
An increase in ETH is necessary to facilitate a reduction in or the banning of MTBE from the gasoline pool. The virtuous side effect of the reduced CO2 footprint when adding a biofuel such as ETH to gasoline, along with its ON-boosting capability at 108 RON points, makes this supply chain-related dimension the most important for sustainable fuels. Especially in regions where MTBE in gasoline is banned due to concerns about water pollution and public health, achieving a RON of 95 to 98 can be accomplished using ETH in the gasoline pool.

Author Contributions

Conceptualization, M.A. and B.M.; methodology, M.A. and B.M.; formal analysis, M.A. and B.M.; investigation, M.A. and B.M.; resources, M.A. and B.M.; writing—original draft preparation, M.A. and B.M.; writing—review and editing, M.A. and B.M.; supervision, B.M.; project administration, B.M. All authors have read and agreed to the published version of the manuscript.

Funding

This research received no external funding.

Institutional Review Board Statement

Not applicable.

Informed Consent Statement

Not applicable.

Data Availability Statement

The original contributions presented in the study are included in the article; further inquiries can be directed to the corresponding author.

Acknowledgments

Open access funding was provided by the Qatar National Library (QNL).

Conflicts of Interest

Author Mahmoud Ahmednooh was employed by the company Production Planning and Scheduling, Um Said Refinery, Qatar Energy, Author Brenno C. Menezes was employed by the company Blend-Shops Company, Qatar Science and Technological Park, Qatar Foundation. The remaining authors declare that the research was conducted in the absence of any commercial or financial relationships that could be construed as a potential conflict of interest.

Abbreviations

The following abbreviations are used in this manuscript:
ATRAtmospheric residue
AROAromatic
BPDBarrels per day
BTXBenzene-Toluene-Xylene
°CDegrees Celsius
C4Butane
CCCatalytic cracking
CCRContinuous catalytic reforming
CDUCrude distillation column
CCRNCarbon-chain-rearranged naphtha
CH2-OHAlcohols
CH3-CH2-OHETH
CNCracked naphtha
COCarbon monoxide
CO2Carbon dioxide
E5Gasoline with 5% ETH by volume
E10Gasoline with 10% ETH by volume
E15Gasoline with 15% ETH by volume
E20Gasoline with 20% ETH by volume
E25Gasoline with 25% ETH by volume
E73Gasoline with 73% ETH by volume
ENDO-IVsEndogenous independent
ETBEEthyl Tertiary-Butyl Ether
ETHEthanol
EPAEnvironmental Protection Agency
°FFahrenheit
FCCFuel catalytic cracker
GCCGulf Cooperation Countries
GHGGreenhouse gases
H2Hydrogen
HNHeavy naphtha
HTHydrotreating unit
HTLCNHydrotreated light cracked naphtha
HVGOHeavy vacuum gasoil
ISOIsomerate stream
ISOUIsomerate unit
LCNLight cycle naphtha
LH2Liquid hydrogen
LNLight naphtha
LNGLiquid natural gas
LPLinear programming
LPGLiquified petroleum gas
LVGOLight vacuum gasoil
MANManufacturing
MILPMixed-integer linear programming
MILPMixed-integer nonlinear programming
MONMotor octane number
MTBEMethyl Tertiary Butyl Ether
NLPNonlinear programming
OLEOlefin
ONOctane number
POLYPolymerate stream
POLYUPolymerate unit
PPRGPure petroleum-refined gasoline
QTB-GCQuantity-basic gasoline component
QLB-GCQuality-basic gasoline component
REFReformer unit (reforming units)
REFORReformate stream
RFCCResidue fuel catalytic cracker
RFNReformed naphtha
RONResearch octane number
RVPReid vapor pressure
RWNRaw naphtha
SCSupply chain
SC-IVsSupply chain independent variables
SGSpecific gravity
SULSulfur
USAUnited States of America
TAMETertiary-Amyl Methyl Ether
VDUVacuum distillation unit
1G1 Generation (ethanol made from seeds (wheat corn)
1.5G1.5 Generation (ethanol made from cassava
2G2 Generation (ethanol made from biomass and lignin)
a ,   b ,   c ,   d ,   e ,   f ,   g Coefficients representing molecular interaction effects
ARO i , OLE i Aromatic and olefin content of component i
ARO B , OLE B Volume-based aromatic and olefin content of the blend
ARO B , 2 Secondary aromatic content property of the blend
R ¯ L N / I S O Ratio of LN diverted to isomerate
R ¯ P O L Y Ratio of the Q C C , GASES stream diverted to the polymerate unit
Q ¯ F C D U Refinery throughputs
Q i Volume flow of component i
Q i , C 4 Butane flowrate to the gasoline pool
Q i , L N Light naphtha flowrate to the gasoline pool
Q i , I S O Isomerate flowrate to the gasoline pool
Q i , R E F Reformate flowrate to the gasoline pool
Q C D U , C 4 Butane output from distillation column
Q C D U , L N Light naphtha output from distillation column
Q C D U , H N Heavy naphtha output from distillation column
Q C D U , A T R Atmospheric residue output from distillation column
Q C C F Total feed flow rate to the conversion complex (CC)
Q C C , GASES Flow rate of GASES from the CC
Q C C , LCN Flow rate of LCN from the CC
Q i , HT , LCN Flow rate of hydrotreated light cycle naphtha (HT LCN)
Q HT , LCN Total HT LCN contribution to the gasoline pool
Q C C , LCN Light cycle naphtha feed flow rate from the conversion complex
Q i , POLY Flow rate of the polymerate stream
Q C C , GASES GASES feed flow rate from the conversion complex
y R F C C Discrete-event selection when ATR route is via RFCC
y F C C Discrete-event selection when ATR route is via FCC
y G Discrete-event selection for gasoline mode in the CC (RFCC or FCC)
y D Discrete-event selection for diesel mode in the CC (RFCC or FCC)
y Low Discrete-event selection for low-severity operational modes of the REFU
y High Discrete-event selection for high-severity operational modes of the REFU
y ISO Discrete-event selection for the isomerate unit inclusion
y POLY Discrete-event selection for the polymerate unit inclusion
Y ¯ C 4 L Butane yield for light petroleum (when light crude is selected)
Y ¯ L N L Light naphtha yield for light petroleum
Y ¯ H N L Heavy naphtha yield for light petroleum
Y ¯ A T R L Atmospheric residue yield for light petroleum
Y ¯ C 4 H Butane yield for heavy petroleum
Y ¯ L N H Light naphtha yield for heavy petroleum
Y ¯ H N H Heavy naphtha yield for heavy petroleum
Y ¯ A T R H Atmospheric residue yield for heavy petroleum
Y ¯ R E F L o w Reformate yield for low severity
Y ¯ R E F H i g h Reformate yield for high severity
Y ¯ G O Yield of ATR converted to vacuum gas oil (VGO) in the vacuum distillation unit.
Y ¯ G , G A S E S Yield of GASES in gasoline mode
Y ¯ D , G A S E S Yield of GASES in diesel mode
Y ¯ G , L C N Yield of LCN in gasoline mode
Y ¯ D , L C N Yield of LCN in diesel mode
Y ¯ D , H T L C N Yield of HT LCN from the Q C C , LCN stream
S G B Blended specific gravity
R V P B 1.25 Blended Reid vapor pressure (transformed as R V P 1.25 )
S U L B Blended sulfur concentration
S G i Specific gravity of input i
R V P i 1.25 Transformed RVP property index of input i
S U L i Sulfur concentration of input i
INSet of all inputs considered in the blend
RON i , MON i Fixed RON and MON values for component i
J i Octane number sensitivity ( RON i MON i )
J v Sensitivity for the blend
RON G , MON G Blended RON and MON values of gasoline
P REF RON , P REF MON Shifts in RON and MON due to REFU operational severity
P CC RON , P CC MON Shifts in RON and MON due to CC operational mode
P HTLCN RON , P HTLCN MON RON and MON reductions due to hydrotreating

References

  1. Foong, T.M.; Morganti, K.J.; Brear, M.J.; da Silva, G.; Yang, Y.; Dryer, F.L. The octane numbers of ethanol blended with gasoline and its surrogates. Fuel 2014, 115, 727–739. [Google Scholar] [CrossRef]
  2. Government of Canada. Deployment of Mid-Level Ethanol Blends; Government of Canada: Ottawa, ON, Canada, 2024.
  3. Ethanol Producer Magazine. Brazil to Increase Ethanol Blend to 27 Percent. 2015. Available online: https://ethanolproducer.com/articles/brazil-to-increase-ethanol-blend-to-27-percent-12020 (accessed on 27 October 2023).
  4. Concave. Gasoline Ether Oxygenate Occurrence in Europe, and a Review of Their Rate and Transport Characteristics in the Environment; Technical Report 4/12; Concave: Brussels, Belgium, 2012. [Google Scholar]
  5. Menezes, B.C.; Moro, L.F.L.; Lin, W.O.; Medronho, R.A.; Pessoa, F.L.P. Nonlinear Production Planning of Oil-Refinery Units for the Future Fuel Market in Brazil: Process Design Scenario-Based Model. Ind. Eng. Chem. Res. 2014, 53, 4352–4365. [Google Scholar] [CrossRef]
  6. International Energy Agency (IEA). Oil Market Report—April 2021; International Energy Agency (IEA): Paris, France, 2021. [Google Scholar]
  7. U.S. Energy Information Administration (EIA). Refinery Capacity Report; U.S. Energy Information Administration (EIA): Washington, DC, USA, 2021.
  8. BP. BP Statistical Review of World Energy 2021; BP: London, UK, 2021. [Google Scholar]
  9. QatarEnergy. Super Gasoline 95 RON. 2024. Available online: https://www.qatarenergy.qa/en/MarketingAndTrading/Marketing/Pages/OurProducts.aspx (accessed on 19 August 2024).
  10. Jiao, J.; Li, J.; Bai, Y. Ethanol as a vehicle fuel in China: A review from the perspectives of raw material resource, vehicle, and infrastructure. J. Clean. Prod. 2018, 180, 832–845. [Google Scholar] [CrossRef]
  11. IEA Advanced Motor Fuels. Ethanol Properties. Available online: https://www.iea-amf.org/content/fuel_information/fuel_info_home/ethanol/e10/ethanol_properties (accessed on 30 October 2023).
  12. SP Global. Brazil to Study Increase in Ethanol-Gasoline Pump Blend to 30Minister. 2023. Available online: https://www.spglobal.com/commodityinsights/en/market-insights/latest-news/agriculture/050123-brazil-to-study-increase-in-ethanol-gasoline-pump-blend-to-30-minister (accessed on 30 October 2023).
  13. International Energy Agency (IEA). Global Ethanol Production Statistics. IEA Rep. 2022, 1, 1–50. [Google Scholar]
  14. U.S. Department of Energy. Alternative Fuels Data Center. 2021. Available online: https://afdc.energy.gov/data/10331 (accessed on 27 October 2023).
  15. Oil & Gas Journal. Persian Gulf Crisis Revives Alcohol Fuels Program in Brazil. Oil Gas J. 1990. Available online: https://www.ogj.com/refining-processing/article/17213479/persian-gulf-crisis-revives-alcohol-fuels-program-in-brazil (accessed on 27 October 2023).
  16. Aba, M.M.; Le Roux, G.A.; Menezes, B.C. Integrated ethanol and gasoline supply chain planning under environmental constraints: A case study of Brazil. Comput. Chem. Eng. 2022, 164, 107875. [Google Scholar] [CrossRef]
  17. U.S. Grains Council. United Arab Emirates Ethanol Market Profile. 2019. Available online: https://grains.org/bioethanol/ethanol-market-profiles/united-arab-emirates/ (accessed on 31 October 2023).
  18. IEA. Share of Global Ethanol Output by Country Between 2017 and 2023. 2024. Available online: https://www.iea.org/data-and-statistics/charts/share-of-global-ethanol-output-by-country-between-2017-and-2023 (accessed on 9 September 2024).
  19. Zhang, Y. Biofuel Integration in China: Challenges and Opportunities. Energy Policy Inst. 2021, 45, 123–135. [Google Scholar]
  20. Liu, J. Sustainable Biofuel Crops for Marginal Lands. Renew. Energy J. 2019, 45, 123–135. [Google Scholar]
  21. Ministry of Industry and Information Technology of China. Pilot Program for E10 Gasoline Implementation. MIIT Rep. 2020, 1, 1–20. [Google Scholar]
  22. Wang, L. Subsidy Policies for Biofuel Production in China. Energy Policy 2021, 156, 112–120. [Google Scholar]
  23. Badra, J.; Alowaid, F.; Alhussaini, A.; Alnakhil, A.; AlRamadan, A.S. Understanding of the octane response of gasoline/MTBE blends. Fuel 2022, 318, 123647. [Google Scholar] [CrossRef]
  24. Hamid, S.H.; Ali, M.A. Effect of MTBE blending on the properties of gasoline. Fuel Sci. Technol. Int. 1995, 13, 509–544. [Google Scholar] [CrossRef]
  25. Kostin, A.; Macowski, D.H.; Pietrobelli, J.M.; Guillén-Gosálbez, G.; Jiménez, L.; Ravagnani, M.A. Optimization-based approach for maximizing profitability of bioethanol supply chain in Brazil. Comput. Chem. Eng. 2018, 115, 121–132. [Google Scholar] [CrossRef]
  26. Akbarian-Saravi, N.; Mobini, M.; Rabbani, M. Development of a comprehensive decision support tool for strategic and tactical planning of a sustainable bioethanol supply chain: Real case study, discussions and policy implications. J. Clean. Prod. 2020, 244, 118871. [Google Scholar] [CrossRef]
  27. Gary, J.H.; Handwerk, J.H.; Kaiser, M.J. Petroleum Refining: Technology and Economics, 4th ed.; CRC Press: Boca Raton, FL, USA, 2001. [Google Scholar]
  28. Speight, J.G. The Chemistry and Technology of Petroleum, 5th ed.; CRC Press: Boca Raton, FL, USA, 2014. [Google Scholar]
  29. Jones, D.S.; Pujadó, P.R. Handbook of Petroleum Processing; Springer: Berlin/Heidelberg, Germany, 2006. [Google Scholar]
  30. Maples, R.E. Petroleum Refinery Process Economics; PennWell Books: Tulsa, OK, USA, 2000. [Google Scholar]
  31. Anderson, J.E.; Leone, T.G.; Shelby, M.H.; Wallington, T.J.; Bizub, J.J.; Foster, M.; Lynskey, M.G.; Polovina, D. Octane Numbers of Ethanol-Gasoline Blends: Measurements and Modeling. SAE Int. J. Fuels Lubr. 2012, 5, 647–659. [Google Scholar]
  32. Gholami, Z.; Gholami, F.; Tišler, Z.; Tomas, M.; Vakili, M. A Review on Production of Light Olefins via Fluid Catalytic Cracking. Energies 2021, 14, 1089. [Google Scholar] [CrossRef]
  33. Sadeghbeigi, R. Fluid Catalytic Cracking Handbook: An Expert Guide to the Practical Operation, Design, and Optimization of FCC Units; Butterworth-Heinemann: Oxford, UK, 2012. [Google Scholar]
  34. Antos, G.J.; Aitani, A.M. Catalytic Naphtha Reforming; CRC Press: Boca Raton, FL, USA, 2004. [Google Scholar]
  35. Stratiev, D.; Nikolaychuk, E.; Shishkova, I.; Bonchev, I.; Marinov, I.; Dinkov, R.; Yordanov, D.; Tankov, I.; Mitkova, M. Evaluation of accuracy of literature gasoline blending models to predict octane numbers of gasoline blends. Pet. Sci. Technol. 2017, 35, 1146–1153. [Google Scholar] [CrossRef]
  36. Owen, K.; Coley, T. Gasoline and Diesel Fuel Additives; Wiley: Hoboken, NJ, USA, 1995. [Google Scholar]
  37. Kelly, J.D.; Mann, J.L. Crude Oil Blend Scheduling Optimization: An Application with Multi-Million Dollar Benefits. Hydrocarb. Process. 2003, 82, 47–53. [Google Scholar]
  38. Ali, T.; Franzoi, R.E.; Menezes, B.C. Surrogate modeling for nonlinear gasoline blending operations. In Proceedings of the 14th International Symposium on Process Systems Engineering, Kyoto, Japan, 19–23 June 2022; Computer Aided Chemical Engineering. Yamashita, Y., Kano, M., Eds.; Elsevier: Amsterdam, The Netherlands, 2022; Volume 49, pp. 1783–1788. [Google Scholar] [CrossRef]
  39. Menezes, B.C.; Kelly, J.D.; Grossmann, I.E. Improved Swing-Cut Modeling for Planning and Scheduling of Oil-Refinery Distillation Units. Ind. Eng. Chem. Res. 2013, 52, 18324–18333. [Google Scholar] [CrossRef]
  40. Franzoi, R.E.; Ali, T.; Al-Hammadi, A.; Menezes, B.C. Surrogate Modeling Approach for Nonlinear Blending Processes. In Proceedings of the 2021 1st International Conference on Emerging Smart Technologies and Applications (eSmarTA), Sana’a, Yemen, 10–12 August 2021; pp. 1–8. [Google Scholar] [CrossRef]
Figure 1. Petroleum refinery network. Data adapted from [5].
Sustainability 17 04884 g001
Figure 3. Primary or main manufacturer-made scenarios of pure PPRG.
Sustainability 17 04884 g003
Figure 4. Main gasoline production tree scenarios and roots based on the inclusion of the secondary PPRG and SC options.
Sustainability 17 04884 g004
Figure 5. Gasoline production based on primary variations in the manufacturer-made scenarios for PPRG.
Sustainability 17 04884 g005
Figure 11. MTBE at 5% and ETH at 10% in the full PPRG.
Sustainability 17 04884 g011
Figure 12. ETH at 10% and REF2 at 20% in the full PPRG.
Sustainability 17 04884 g012
Figure 13. State of Qatar refineries.
Sustainability 17 04884 g013
Figure 14. MTBE at 5%, ETH at 10%, and REF2 at 25% in the full PPRG.
Sustainability 17 04884 g014
Figure 15. Stock of 60% of the RLN at 25% maximum ARO concentration.
Sustainability 17 04884 g015
Figure 16. Stock of 90% of the RLN, and ETH at 10%; the mix is 25% maximum ARO concentration.
Sustainability 17 04884 g016
Figure 17. Stock of 20% of the RLN, ETH at 10%, and REF2 at 18%; the mix is 25% maximum ARO concentration.
Sustainability 17 04884 g017
Figure 18. Stock of 20% of the RLN, MTBE at 5%, ETH at 10%, and REF2 at 22%; the mix is 25% maximum ARO concentration.
Sustainability 17 04884 g018
Figure 19. Stock of RLN combined with ETH at 5% to 25%.
Sustainability 17 04884 g019
Figure 20. CO2 emissions in the total amount and per liter.
Sustainability 17 04884 g020
Table 1. Properties of the gasoline components [38].
Components (i)RONRVP (Psi)MONARO (v%)OLE (v%)
C493.87.47049000
Light Naphtha69.113.084867.100
Isomerate8712.3258200
Reformate989.425905420
Polymerate967.5481.78029
Light Cracked Naphtha937.975822510
ETH10810.00590.700
MTBE1162.46510100
Disclaimer/Publisher’s Note: The statements, opinions and data contained in all publications are solely those of the individual author(s) and contributor(s) and not of MDPI and/or the editor(s). MDPI and/or the editor(s) disclaim responsibility for any injury to people or property resulting from any ideas, methods, instructions or products referred to in the content.

