Abstract
Exploration practice has proved that preservation conditions are one of the critical factors contributing to shale gas enrichment in the Middle Yangtze area. Well Yidi2 is the discovery well of Cambrian shale gas in this area. The paleo-fluid evolution and its implication for preservation conditions of shale gas remains unclear, posing challenges for shale gas exploration and development. In this study, through systematic analysis of fluid inclusions in fractrue-filling vein of the entire core section of this well, combined with carbon and oxygen isotope tests of veins and host rocks, a paleo-fluid profile was established to explore the formation environment of Cambrian paleo-fluids and their implications for the preservation conditions of the Shuijingtuo Formation (SJT Fm.) shale gas. The results suggest that fractures in the SJT Fm. shale at the base of Cambrian Series 2 mainly formed during the deep burial hydrocarbon generation stage, trapping a large number of liquid hydrocarbon inclusions. Subsequently, numerous high-density methane inclusions and a few of gas-liquid two-phase inclusions were trapped. The SO42−, Ca2+ and Mg2+ content of fluid inclusion groups in the veins decreased from the Qinjiamiao Formation (QJM Fm.) at the bottom of Cambrian Series 3 upward and downward respectively, and the rNa+/rCl− ratio was the lowest in the SJT Fm. and increased overall upward. The δ13C values of calcite veins in Tianheban Formation (THB Fm.)-Shipai Formation (SP Fm.) of the middle Cambrian Series 2 and the Loushanguan Formation (LSG Fm.) of the Cambrian Series 3 were lighter compared to the host rocks. Results indicate the later tectonic activities in this area were relatively weak, and the shale interval remained in a state of high gas saturation for a long time. The QJM Fm. was the main source of high-salinity brine, and the SJT Fm. had strong self-sealing properties and was relatively less affected by external fluids. However, the pressure evolution of high-density methane inclusions in the SJT Fm. indicated that the pressure coefficient of the shale section significantly decreased during the Indosinian uplift and erosion stage. The veins in the THB-SP and LSG Fms. were closely related to the oxidation of hydrocarbon gases by TSR (thermochemical sulfate reduction) and the infiltration of atmospheric water, respectively. Therefore, the paleo-fluid in the fractures of Well Yidi2 have integrally recorded the whole geological process including the evolution from oil to gas, the backflow of high-salinity formation water, the upward escape of shale gas, and the process of shale gas reservoirs evolving from overpressure to normal pressure. Considering that Well Yidi2 area is located in a relatively stable tectonic setting, widely distributed fracture veins probably enhance the self-sealing ability, inhibiting the rapid escape of SJT Fm. shale gas. And the rapid deposition of Cretaceous also delayed the loss of shale gas to some extent. The combination of these two factors creates favorable preservation conditions of shale gas, establishing the SJT Fm. as the primary exploration target in this area.
1. Introduction
The Mesoproterozoic to Lower Paleozoic in Upper-Central Yangtze area is characterized by multiple sets of marine organic-rich shales, which positions it as one of the key areas for shale gas exploration in China [1,2,3]. Currently, significant progress has been made in the shale gas exploration in the Upper Ordovician Wufeng Formation and Lower Silurian Longmaxi Formation in the Upper Yangtze region [4,5]. Previous studies have confirmed that the Cambrian shales are distinguished by great thickness, widely distribution, and high organic carbon content, indicating its vast potential for shale gas resources [6,7]. However, many wells have revealed that the gas content in Cambrian shales is relatively low and enriched with nitrogen [8], indicating the factors controlling shale gas enrichment in the study area were diverse and complex, with significant ongoing debate. Many scholars argued that tectonic preservation conditions were key factors in shale gas enrichment, with faults and erosion being the primary causes of shale gas loss [1,8,9,10]. In contrast, others highlighted the self-sealing capacity of shales due to their extremely low porosity and permeability, and the horizental permeability is much greater than the vertical permeability. Therefore, they suggested that lateral diffusion was the main pathway for shale gas loss [11,12].
Throughout geological history, thermal events and fluid activities have been essential components in the process of tectonic evolution [13]. Geological fluids not only transfer heat and promote fault development but also carry valuable information about oil and gas migration and preservation [14]. Currently, the analysis of fluid inclusions and stable isotopes of cement and factures-filling veins in sandstone reservoirs is widely used to reconstruct the history of ancient fluid activities, the process of oil and gas accumulation, and the evaluation of oil and gas preservation conditions [15,16,17,18]. There were abundant studies on the periods and preservation significance of the paleo-fluid activities in the Yangtze area [19,20,21], whereas the primary channel for the loss of shale gas in the Central Yangtze area still lack paleo-fluid evidence, which hinder the understanding of the preservation conditions of the Cambrian shale gas.
The Well Yidi2 located in the Yichang slope belt of the Central Yangtze area, (Figure 1), is the first discovery well for Cambrian shale gas in this area [22]. The well has been fully cored, and fractures and vein fillings are well developed, providing excellent materials for the study of the relationship between paleo-fluid evolution and preservation conditions. This study focuses on characterizing the development of fractures and veins in the Cambrian strata, conducting geochemical analyses of paleo-fluids to their nature and origin, and identifying primary pathways for shale gas dissipation and preservation in the Yichang area. The findings aim to provide a scientific basis for understanding the mechanism of shale gas preservation and enrichment in marine strata of the Middle and Upper Yangtze area.
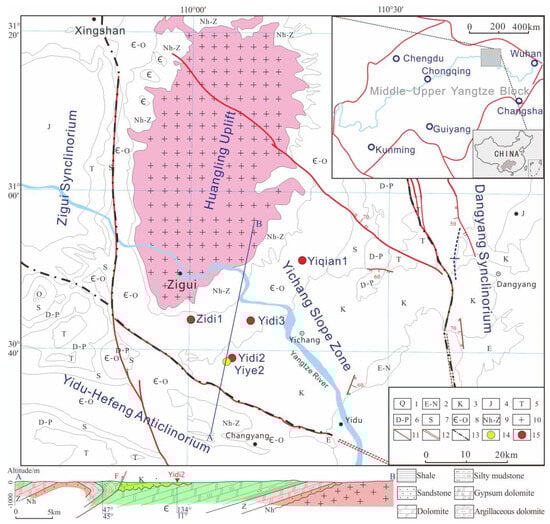
Figure 1.
The regional geologic setting of study area. 1: Quaternary; 2: Paleogene; 3: Cretaceous; 4: Jurassic; 5: Tertiary; 6: Devonian—Permian; 7: Silurian; 8: Cambrian—Ordovician; 9: Nanhua—Ediacaran; 10: Granite; 11: Fault; 12: Supposed fault; 13: Tectonic boundary; 14: Parameter well; 15 Survey well.
2. Geological Setting
Since the formation of the basement, the Central Yangtze area has undergone a stable subsidence during the Caledonian-Hercynian periods as part of the Yangtze Craton, during which a set of marine strata mainly composed of carbonate and clastic sediments were regionally deposited. From the Indosinian period onwards, the area experienced tectonic deformation and displacement. The Early Yanshanian period established the fundamental tectonic framework for the Paleozoic-Mesozoic strata in this region, marking the onset of the current tectonic stability. The Late Yanshanian was characterized by local modifications, and since the Himalayan period, the region has remained relatively stable [23,24].
The Yichang area in Hubei Province is situated on the southeastern slope of the Huangling Uplift in the northern part of the Central Yangtze region, commonly named Yichang Slope Belt. This belt exposes a series of strata, ranging from the Nanhua Period to the Triassic and Cretaceous periods, which encircle the Huangling Uplift (Figure 1). It has also developed multiple sets of organic-rich shale, including Sinian Doushantuo Formation, Cambrian Shuijingtuo Formation (SJT Fm.), Upper Ordovician Wufeng Formation and Lower Silurian Longmaxi Formation. These shales are characterized by great thickness, extensive distribution, high thermal maturity (Ro = 2.0–2.6%) and moderate burial depth. The strata The strata exhibit gentle dips and significantly less structural deformation compared to other areas in the Central Yangtze region, presenting promising prospects for shale gas exploration [25,26].
Well Yidi2 successively encountered several formations from top to bottom, including the Cretaceous Shimen Formation, the Cambrian Loushanguan Formation Tianheban Formation (THB Fm.), Shipai Formation (SP Fm.), Shuijingtuo Formation (SJT Fm.) and Yanjiahe Formation (YJH Fm.) (Figure 2). The well was drilled to a total depth of 1806 m, with the final drilling layer being the Cambrian Denying Formation. Among these, the LSG Fm. consists mainly of dolomite, the QJM Fm. is composed of dolomite interbedded with gypsum-salt layers and marlite, the SLD Fm. features dolomite with dissolved pores. The THB Fm. is a mud-banded limestone, while the SP Fm. is a set of clastics rock mainly made up of mudstone. The SJT Fm. develops limestones in the upper part and carbonaceous shale in the lower part, while the YJH Fm. is mainly composed of marlite with thin shale. Abundant natural gas has been discovered in the THB and QJM Fms. of Well Yidi2 [27]. Specifically, the total organic carbon (TOC) in the shale of SJT Fm. ranges from 0.52% to 5.96%, with an average of 2.26%, and the Ro value is 2.25%. The thickness of gas-bearing shale in this layer up to 72 m, with desorption gas content ranging from 0.19 to 3.65 m3/t. The shale gas is composed of over 95% methane and trace of ethane and nitrogen, reflecting typical characteristics of dry gas [28].
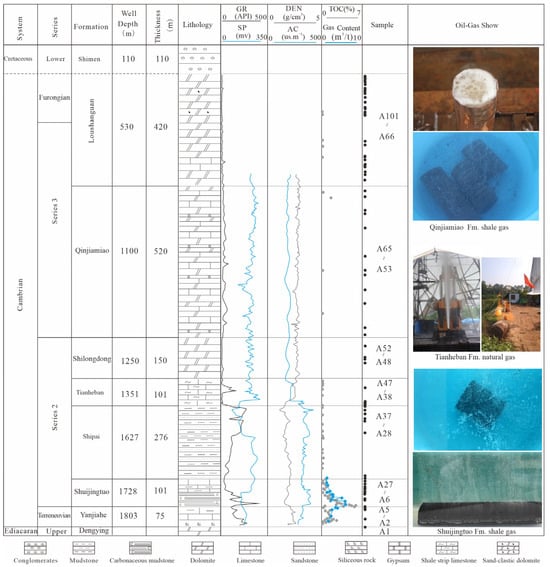
Figure 2.
Comprehensive column and sampling positions of Well Yidi2.
3. Samples and Methods
This study involved the description of fractures in the core samples of Well Yidi2. A total of 101 samples with fracture veins were systematically collected from bottom to top. The samples with veins were polished as thin sections for petrographic observations and laser Raman compositional analysis, followed by homogenization temperature and salinity tests of fluid inclusions. Meanwhile, 5–10 g monominerals are selected from wider veins (>1 cm) to analyze the composition of inclusion assemblage. Powder sample from wider carbonate veins and their host rocks were drilled for carbon and oxygen isotope testing. Pyrites fillings in fracture and monomineral from gypsum were selected for sulfur isotope analysis. The isotopic tests were conducted at the Central South Mineral Resources Supervision and Inspection Center of the Ministry of Land and Resources, laser Raman analysis at China University of Geosciences (Wuhan), and inclusion analysis at Beijing Research Institute of Uranium Geology.
3.1. Homogenization Temperature, Salinity and Component Test
The homogenization temperature and salinity of inclusion were determined using the Linkam THMS 600 micro cold-hot stage (Linkam Scientific Instruments Ltd., Manchester, UK). The stage was calibrated with standard substances of known temperature prior to use. The measurement errors in the temperature range of −56.6 to 0 °C and 100 to 600 °C were ±0.1 °C and ±2 °C, respectively.
The analysis of the gaseous and liquid components of the inclusion assemblages was measured using the vacuum explosion. The explosion temperatures were 550 °C for quartz, and 450 °C for calcite and dolomite, with an explosion time of 10 min. Gaseous component analysis was performed with a PE.Clarus 600 gas chromatograph, using argon (Ar) as the carrier gas, a flow rate of 25 mL/min, and a pressure of 100 kPa. The minimum detection limit was 10−6. The analysis of anion and cation components in the liquid phase of the inclusion assemblages was conducted using a Thermo DIONEX-500 ion chromatograph (Thermo Fisher Scientific, Waltham, MA, USA). The detection limit for cations was 10−6, and for anions, it was 10−9.
3.2. Laser Raman Analysis
The Raman spectroscopy analysis of inclusions was conducted using a Renishaw MKI-1000 Micro-Raman spectrometer (Renishaw, New Mills, Gloucestershire, UK), which employs a 514.5 nm argon-ion laser as the light source. The calibration and testing methods of the instrument refer to the literature of previous researchers [29]. For pure methane inclusions, the Raman shift of the C-H symmetric stretching band (v1) of methane is utilized to calculate the pressure and density of methane in the fluid inclusions [30]. Using the calculated density of methane inclusions and the homogenization temperature of the coexisting two-phase inclusions, the capture pressure of pure methane inclusions can be determined using the supercritical state equation for methane [31,32].
3.3. Carbon and Oxygen Isotopic Analysis
After grinding the samples to 200 mesh and heating them to remove adsorbed water, they were placed in a vacuum reactor and reacted with phosphoric acid at 25 °C for 24 h. The resulting CO2 gas was purified and collected, and the carbon and oxygen isotope compositions were determined using a Thermo Fisher MAT253 mass spectrometer (Thermo Fisher Scientific, Waltham, MA, USA). The results are reported as relative δ-values (V-PDB). During the analysis, standard samples GBW04417 and NBS19 were used for quality control, with an analytical error of ±0.2‰ [33].
3.4. Sulfur Isotope Analysis
The sulfide monomineral is mixed with copper oxide powder and ground to approximately 200 mesh using an agate mortar. Under vacuum conditions, the mixture was heated to generate SO2 gas. The sulfur isotope composition of the collected SO2 gas was then analyzed using a stable isotope mass spectrometer (MAT-251), with the results reported as delta values relative to the V-CDT standard. Throughout the analysis, standard samples LTB-2 and NBS127 were employed for quality control, ensuring an analytical precision of ±0.2‰ [33].
3.5. Basin Modeling
The PetroMod (version 2016) was used to reconstructed the burial and thermal history of the Well Yidi2. The formation thickness and lithology are based on the drilling core and logging data from Well Yidi 2, while the heat flow and erosion thickness refer to the existing research results of previous studies [34,35,36,37]. The sediment-water interface temperature is obtained from the system built into the software based on latitude and longitude. Maturation model is reconstructed using the model of Easy%Ro and calibrated by the vitrinite reflectance in the Well Yidi2. The equivalent virtrinite reflectance was calculated from bitumen reflectance (Rb) following the common formulation Roeq = 0.618Rb + 0.4 [38]. The paleo-geothermal heat flow values in the study area are controlled by basin evolution. During the Cambrian extensional stage, the heat flow peaked at 80 mW/m2, while in other stages, it generally ranged from 40 to 60 mW/m2, showing an overall decreasing trend [35].
4. Results
4.1. Fractures and Veins Petrography
Fractures within the SJT Fm. in Well Yidi2 show an increasing trend from bottom to top. In the lower shale section, fractures are relatively underdeveloped, primarily consisting of horizontal and irregular fractures. Vertical or high-angle fractures are occasionally observed in certain limestone interbeds, predominantly filled with quartz, calcite, asphalt and other minerals (Figure 3a,b and Figure 4a,b). These fractures are mainly diagenetic in origin [12], as evidenced by the dating of veins in the SJT Fm.of Well YY1 on the Yichang Slope, indicating their formation during the diagenetic stage, associated with hydrocarbon generation overpressure fracturing [39]. In contrast, fractures in the upper limestone section are more developed, predominantly vertical fractures (Figure 3c), with some exhibiting low filling degrees, indicative of typical tectonic fractures. The fracture-filling minerals grow inward from the vein walls, with larger calcite crystals forming at the center (Figure 4c,d).
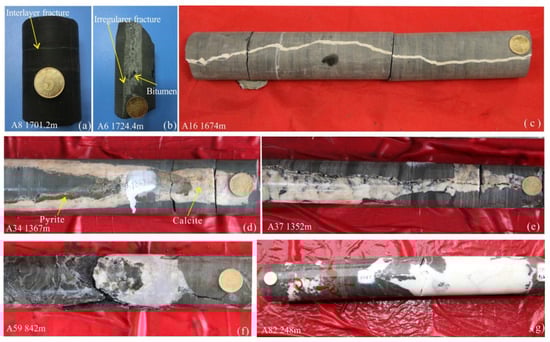
Figure 3.
Typical photos showing characteristics of fractures of Well Yidi2. (a) horizontal fracture in SJT Fm., sample A8, 1701.2 m; (b) irregular fracture within calcite interlayer in SJT. Fm., sample A6, 1724.4 m; (c) vertical fracture in upper calcite section of SJT Fm., sample A16, 1674 m; (d) vertical fracture, calcite and pyrite veins at the top of SP. Fm., sample A34, 1367 m; (e) partially filled fractures in THB Fm., sample A37, 1352 m; (f) irregular fracture filled with gypsum in QJM Fm., sample A59, 842 m; (g) fractures filled with coarsely crystalline calcite in LSG Fm., sample A82, 248 m.
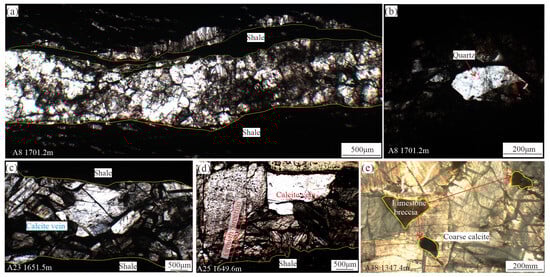
Figure 4.
Photomicrograph showing the fracture fillings of Well Yidi2. (a) Horizontal fractures filled with calcite and euhedral quartz (b), SJT Fm., sample A8, 1701.2 m; (c) fracture filled with calcite, sample A8, 1701.2 m; (d) vein grows from the fracture wall toward the center in a partially filled fracture, sample A23, 1651.5 m; (e) the fractures are filled with coarse-grained calcite and fragmented limestone breccia. THB Fm., sample A38, 1347.7 m.
Vertical fractures are predominantly developed at the base of the SP and THB Fms., with some exceeding 3 cm in width. These fractures are primarily filled with calcite, occasionally accompanied by breccia (Figure 4e), and in some cases, quartz and pyrite. Certain fractures exhibit a relatively low degree of mineral infill (Figure 3d,e). In contrast, fracture development is less pronounced from the middle to upper sections of the THB Fm. through the SLD Fm. However, the QJM Fm exhibits relatively well-developed fractures, mainly filled with calcite, with some occurrences of gypsum (Figure 3f).
In the LSG Fm. high-angle and vertical fractures are widespread, with localized multi-phase fractures intersecting. Some broken breccia could be found in the layer and the fractures are mainly filled with calcite. Additionally, the lower section contains numerous fractures with low filling degrees, while some late-stage calcite crystals are distinctly coarse-grained (Figure 3g).
4.2. Fluid Inclusions Petrography
Statistical analysis of thin sections indicates that brown hydrocarbon and gray methane inclusions dominate the vein from the YJH-SJT Fms. Two-phase (gas-liquid) inclusions are relatively scarce, especially in horizontal and irregular fractures, which are primarily filled with brown hydrocarbon and methane inclusions. Some methane inclusions exhibit distinct negative crystal morphologies (Figure 5a,b). In the SJT Fm., fluid inclusions display a clear spatial distribution trend from the vein walls toward the center of fracture fillings. Liquid hydrocarbon and high-density methane inclusions are concentrated along the vein walls, while a small number of gas-liquid two-phase inclusions and occasional aqueous inclusions appear at the fracture centers (Figure 5c). Inclusions in the lower SP Fm. and THB Fm. resemble those in the upper SJT Fm. but show an increased presence of two-phase and aqueous inclusions (Figure 5d). Samples from the QJM Fm. contain two-phase inclusions with subcrystal (Figure 5e). The LSG Fm. is characterized by abundant two-phase and aqueous inclusions (Figure 5f), along with a minor occurrence of gaseous inclusions and significant variations in the gas-liquid ratios of two-phase inclusions. Occasionally, two-phase inclusions with subcrystal are also observed. The petrographic characteristics of different inclusion types are detailed as follows.
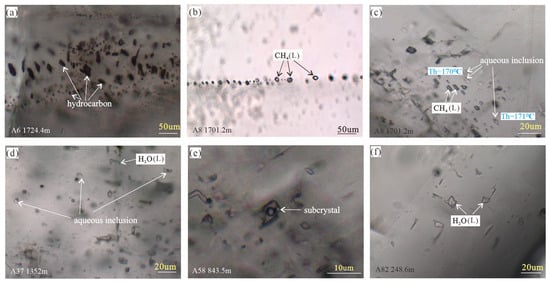
Figure 5.
Photomicrograph showing diverse fluid inclusions in fracture veins of Well Yidi2. (a) brown hydrocarbon inclusions, SJT Fm., sample A6, 1724.4 m; (b) methane inclusions exhibiting quartz negative crystal morphology, SJT Fm., sample A8, 1701.2 m; (c) dark gray methane inclusions coexist with gas-liquid two-phase inclusions, sample A8, SJT Fm., 1701.2 m; (d) gas-liquid two-phase inclusions, sample A37, SP Fm., 1352 m; (e) inclusion with subcrystal, sample A58, QJM Fm., 843.5 m; (f) aqueous inclusions, sample A82, LSG Fm., 248.6 m.
4.2.1. Hydrocarbon Inclusions
These inclusions are predominantly scattered freely or aligned along fractures, ranging in size from 2 to 4 µm, with round or irregular shapes. Using transmitted light, they appear yellow-brown (Figure 5a) and exhibit to no fluorecence, indicating a high degree of thermal evolution of the liquid hydrocarbons. Samples containing liquid hydrocarbon inclusions rarely show an association with aqueous inclusions.
4.2.2. Methane Inclusions
The methane inclusions are primarily distributed in an oriented manner, and range from 3 to 15 µm in size and exhibit elliptical or irregular shapes. Some display distinct quartz-nagative crystal morphologies (Figure 5b). Under transmitted light, they appear gray-black or gray-white, with some showing prominent bright lines at the center, indicative of high-density methane. Methane inclusions occur either independently or in association with liquid hydrocarbon inclusions, with a small portion coexisting with two-phase inclusions.
4.2.3. Two-Phase Inclusions
These inclusions are either randomly distributed or directionally aligned, ranging in size from 5 to 20 µm, and typically appearing as elongated strips, rectangles, or ellipses. The gas-liquid ratio varies from 5% to 45%, with significant variations observed within the same sample. When heated to the bursting point, these inclusions fail to reach phase uniformity, suggesting they were trapped by non-homogeneous fluid.
4.2.4. Gas-Liquid Inclusions with Subcrystals
These inclusions occur within quartz and calcite minerals, exhibiting either a directional arrangement or clustering in small groups. The range in size from 8 to 20 µm, with subcrystal measuring approximately 1 µm in diameter. The gas-liquid ratio is around 5% (Figure 5e). Notably, the subcrystal dissolved when the temperature reaches approximately 200 °C.
4.2.5. Aqueous Inclusions
At room temperature, aqueous inclusions exist as a single liquid phase and are distributed either directionally or in small clusters. They range from 2 to 10 µm in size and appear colorless under transmitted light. Morphologically, they are typically quadrilateral, irregular, or rice-grain shaped, and are particularly abundant along microscopic fractures (Figure 5f).
4.3. Homogenization Temperature, Salinity of Inclusions
The homogenization temperature of two-phase inclusions in Well Yidi2 ranges from 60 to 240 °C (Figure 6). Limited test data are available for two-phase inclusions within the shale gas interval of the SJT Fm. Based on petrographic characteristics and analytical results, the fluid inclusions in SJT Fm can be classified into four distinct stages. The first stage is dominated by hydrocarbon inclusions and high-density methane inclusions, with only a few two-phase inclusions, forming at temperatures between 170 and 180 °C. The second stage also consist primarily of hydrocarbon and high-density methane inclusions, forming at temperatures ranging from 210 to 240 °C. These two stages exhibit lower abundance compared to coeval two-phase inclusions. The third stage is characterized by gaseous and two phase inclusions, with homogenization temperatures ranging from 130 to 150 °C. The fourth stage consist of secondary fluid inclusion, formed at temperatures between 100 and 120 °C. Additionally, fluid inclusions with homogenization temperatures of 130–150 °C and 170–180 °C were identified within vertical fractures between the top of the SJT Fm. and the SP Fm.
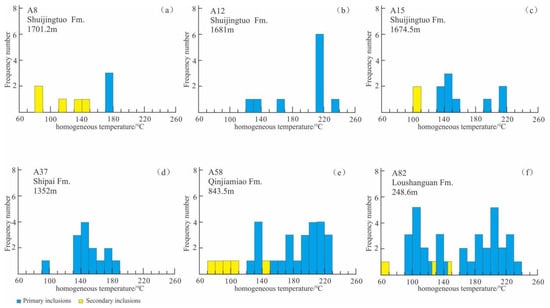
Figure 6.
Histogram of homogenization temperatures for fluid inclusions in Well Yidi2. (a)sample A8, 1701.2 m, SJT Fm; (b)sample A12, 1681 m, SJT Fm; (c) sample A15, 1674.5 m, SJT Fm; (d) sample A37, 1352 m, SP Fm; (e) sample A58, 843.5 m, QJM Fm; (f) sample A82, 248.6 m, LSG Fm.
The salinity of two-phase and aqueous inclusions within fractures in Well Yidi2 generally ranges from 5% to 35% (Figure 7). Inclusions from SJT and SP Fms. primarily exhibit salinity values between 15% to 22%. The QJM Fm. shows a wider salinity variation, ranging from 5% to 35%, and most inclusions fall within the 10–16% range. Some samples contain subcrystal inclusions with salinity levels as high as 30–33%. Inclusions from the LSG Fm. predominantly have salinity values between 15% and 23%.
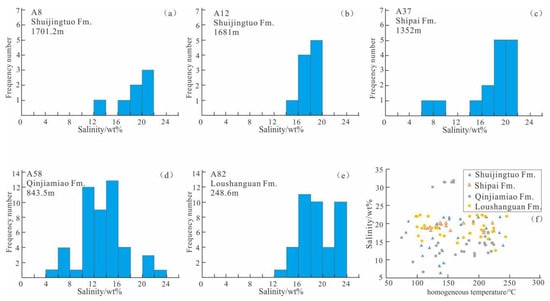
Figure 7.
The salinity histograms and the correlation between homogenization temperatures and salinities for vein inclusions in Well Yidi2. (a) sample A8, 1701.2 m, SJT Fm; (b) sample A12, 1681 m, SJT Fm; (c) sample A15, 1674.5 m, SJT Fm; (d) sample A58, 843.5 m, QJM Fm; (e) sample A82, 248.6 m, LSG Fm; (f) the correlation between homogenization temperatures and salinities for vein inclusions in Well Yidi2.
4.4. Laser Raman Analysis
The Raman spectra of hydrocarbon inclusions from the SJT Fm. exhibit distinct “D” (1250–1450 cm−1) and “G” (1500–1605 cm−1) peaks, indicating a high degree of thermal evolution [40]. Some highly evolved hydrocarbon inclusions also contain distinct methane peaks (Figure 8a).
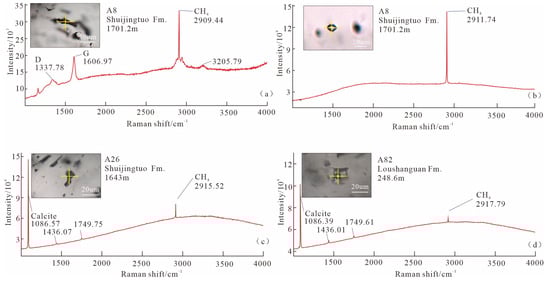
Figure 8.
Charts of Raman-shift for vein inclusions of Well Yidi2. (a) sample A8, 1701.2 m, SJT Fm; (b) sample A8, 1701.2 m, SJT Fm; (c) Sample A26, 1643 m, SJT Fm; (d) sample A82, 248.6 m, LSG Fm.
The Raman scattering peak positions of methane inclusions show a relatively wide range, primarily between 2911.23 and 2916.47 cm−1 (Figure 8b,c). In contrast, the gaseous methane Raman scattering peak positions in two-phase inclusions are relatively narrower, mostly ranging from 2915.64 to 2917.79 cm−1 (Figure 8d). For the first stage fluid inclusions (Th = 170–180 °C) in sample A8 from the STJ Fm., the corresponding synchronous methane inclusions have densities ranging from 0.257 to 0.26 g/cm3. For the second-stage fluid inclusions (Th = 210–240 °C) recorded in samples A12 and A15, the densities of synchronous methane inclusions range from 0.279 to 0.299 g/cm3. The third-stage fluid inclusions (Th = 130–150 °C) correspond to synchronous methane inclusions with densities of 0.202–0.23 g/cm3 and captured pressures of 52.59–65.28 MPa (Table 1).

Table 1.
Raman Quantitative Analysis Statistics of methane inclusion.
4.5. Gas-Liquid Composition of Inclusion Assemblage
The gaseous composition of calcite vein inclusion assemblages exhibits a clear vertical distribution pattern of methane content. With increasing burial depth, CH4 content generally shows an upward trend. Specifically, the methane content in inclusion assemblages is as follows: SJT Fm. (2.89–11.00 µL/g), SP-THB Fm (0.68–5.30 µL/g), QJM Fm. (0.26–0.42 µL/g), and LSG Fm. (0.28–2.24 µL/g) (Table 2).
Table 2.
Gase and ionic components of inclusion assemblage in Well Yidi2.
The sulfate ion (SO42−) content in the liquid phase of the inclusion assemblages also exhibits a significant vertical distribution pattern. With increasing burial depth, SO42− content increases from the LSG Fm. (0.92–10.9 µg/g) to the QJM Fm. (207–240 µg/g). However, from the QJM Fm. downward to the underlying SP-THB Fm (6.98–18.6 µg/g) and the SJT Fm. (4.62–11.3 µg/g), SO42− content gradually decreases. The concentrations of Ca2+ and Mg2+ also exhibit similar distribution trends.
4.6. Stable-Isotope of Fracture Veins
Fluid inclusion microthermometry results indicates that paleo-fluid activities occurred in multiple stages, with late-stage fluid activity carrying more information regarding shale gas preservation. Therefore, during isotopic sampling, powders were primarily collected form the central portions of fully or partial filled fractures, where vein minerals grew from both sides toward the center, to maximize the acquisition of late-stage fluid activity records.
Overall, the carbon isotopic composition of calcite veins filling fractures in the LSG and SP Fms. differs significantly from that of the host rock, whereas in other formations, the isotopic differences between calcite veins and surrounding rocks are not pronounced. Specifically, the δ13C values of calcite veins in the YJH and SJT Fms. range from 1.27‰ to 3.77‰, which is similar to the δ13C values of the coeval limestone layers (1.35‰ to 3.49‰). The δ18O values of the calcite veins range from −9.70‰ to −6.73‰, while those of the limestone range from −8.66‰ to −5.69‰, also showing a close match (Table 3).
Table 3.
Isotopic Compositions of Host Rocks and Veins Collected from Well Yidi2.
The δ13C values of calcite veins in the SP and the LSG Fms. are significantly lower than those of the coeval limestones, with minimum values reaching −8.78‰ and −4.96‰, respectively. In contrast, the δ13C values of limestones throughout the Cambrian show a trend of increasing from top to bottom, with the minimum value in the LSG Fm. being −2.16‰. Therefore, the δ13C values of the calcite veins are also lower than those of any other limestones within the entire Cambrian and are significantly different from the δ13C values of limestones since the Phanerozoic (−4‰ to 8‰) [33].
Additionally, the δ34S values of pyrite filling fractures in the SP Fm. range from 30.99‰ to 31.57‰, while those of gypsum-salt interlayers in the QJM Fm. range from 31.78‰ to 33.34‰, indicating a relatively similar sulfur isotopic composition (Table 4).
Table 4.
Sulfur isotopic characteristic of gypsum and pyrite veins, from well Yidi2.
4.7. Basin Modeling
The burial and thermal evolution history of Well Yidi2 was reconstructed. The results indicate that the SJT Fm. shale of the Cambrian reached a vitrinite reflectance (Ro) of 0.5% in the Middle Devonian, entering the oil generation stage. By the Early Jurassic, it had entered the oil-cracking gas generation stage. The formation reached its maximum burial depth (6700 m) in the late period of Middle Jurassic. During the Late Jurassic, intense uplift and erosion halted hydrocarbon generation, with a maximum erosion thickness of nearly 5000 m. Subsequently, approximately 3000 m of sediment was deposited during the Cretaceous. Since the Late Cretaceous, further uplift and erosion have occurred.
5. Discussion
5.1. Features and Origins of Paleo-Fluids
The hydrogeological cycle of basins often undergoes centrifugal flow during the sedimentary compaction stage and centripetal flow during the uplift and erosion stage [41,42], leading to the complexity of paleo-fluid origins. The origins can be classified into interlayered sedimentary water, meteoric water, or retained sedimentary water [42,43]. In this study, the stratigraphic profiles of fluid inclusions composition and veins isotopic was established from Well Yidi2 (Figure 9) to comparatively analyze the properties and origins of paleo-fluids.
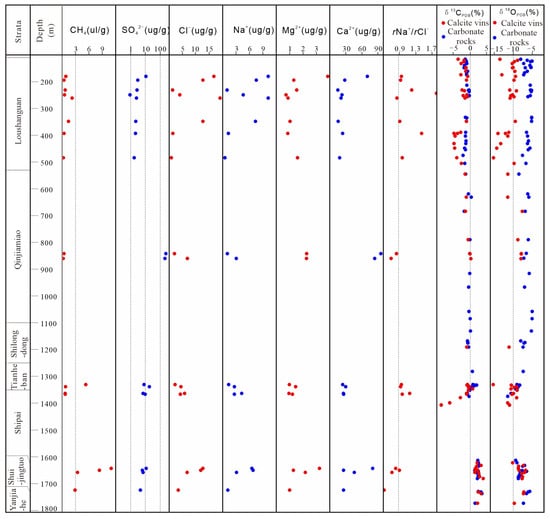
Figure 9.
Composition of gas- and liquid- inclusions, and the stable isotopes of calcite veins and carbonate rocks of Well Yidi2.
5.1.1. Indication of Fluid Inclusions Composition for Paleo-Fluid Origin
The proportion of hydrocarbon inclusions in fracture veins, along with the methane content in inclusion assemblages, show a decreasing tend from the base to the shallower parts of the SJT Fm., indicating the upward migration of hydrocarbons along fractures from source rocks. The decreasing SO42− content in the ion composition of vein inclusion assemblages from the QJM Fm. downward suggests that the QJM Fm. is the source of SO42− ions. In the Yichang area, the SJT-THB Fms. primarily represent basin-shelf to open-platform deposits, whereas only the QJM Fm. exhibits lagoon evaporite deposition [44]. During the uplift and erosion stage, it is common that the downward migration of formation water or meteoric water along faults or fractures under gravitational influence [45]. The low SO42− ion content in vein inclusions within the shale interval of the SJT Fm. suggests that the influence of shallow fluids decrease with depth.
Hydrochemical parameters are widely used in analyzing fluid sources and are also applicable to the study of liquid-phase components in fluid inclusions [17]. Due to the development of evaporite layers, the desulfurization coefficient (rSO42− × 100/rCl−) is generally high and loses significance. Hence, this study focuses on the Na-Cl coefficient (rNa+/rCl−). It is well known that seawater has a Na-Cl coefficient of 0.85, while sedimentary water undergoing intense water-rock interaction has a coefficient of less than 0.85, and formation water influenced by meteoric water leaching has a coefficient greater than 1 [45,46]. The Na-Cl coefficient in liquid-phase calcite vein inclusions from the QJM and SJT Fms. is relatively low, with a decreasing trend from top to bottom in the SJT Fm. The lowest value, recorded at the bottom of SJT Fm., is only 0.52, indicating strong sealing properties of shales in the QJM and SJT Fms. And the bottom shale section of the SJT Fm. is the most sealed and unaffected by ancient meteoric water. Some calcite veins from the THB Fm. exhibit high Na-Cl coefficient, with individual values exceeding 1, which possibly attributed to late-stage secondary inclusion mixed with meteoric water captured trapped by veins. The Na-Cl coefficient of fracture-filling vein inclusions in the LSG Fm. varies significantly, mostly between 0.90 and 1.2, with a maximum of 1.79, furthering indicating the infiltration of ancient meteoric water into the LSG Fm. during geological history.
5.1.2. Indications of Isotopic Signatures for Paleo-Fluid Origins
During migration, paleo-fluids undergo complex fluid-rock interations with host rocks, forming cements or veins. By comparing the isotopic geochemistry of veins and host rocks the nature and origin of fluids can be determined [15,47].
The δ13C values of calcite veins in the YJH and SJT Fms. are similar to those of the host rocks and significantly higher than that of overlying carbonate formations (Figure 9 and Figure 10). This suggests that the carbonate veins in the YJH and SJT Fms result from the dissolution and recrystallization of carbonate rocks within the same stratigraphic units. The δ1⁸O values of the calcite veins are also similar to those of the corresponding limestones, possibly indicating that during the late hydrocarbon generation stage, the formations were characterized by low water saturation, weak water-rock interactions, and minimal oxygen isotope fractionation in a closed environment. Previous studies have shown that the oxygen isotopes of altered rocks and hydrothermal fluids depend on temperature and the water/rock ratio. Under the same water/rock ratio conditions, closed system exhibit less oxygen isotope depletion in rocks compared to open system [48]. Therefore, oxygen isotopes can also serve as indicators of environmental closure. The isotopic and fluid inclusion characteristics of veins in the YJH and SJT Fms. suggest that they formed in a highly sealed environment with an ultra-low water/rock ratio, lacking external fluid influence. The low water saturation of the source rocks primarily resulted from hydrocarbon generation-driven water expulsion and vaporization-induced liquid transport [49,50]. The SJT Fm. veins formed at significant burial depths, where shales underwent extensive hydrocarbon generation and drainage.
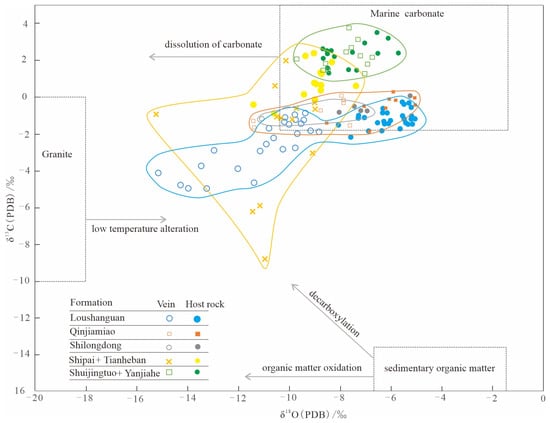
Figure 10.
Correlation between carbon and oxygen isotopes of calcite veins and host rock in Well Yidi2.
The δ13C values of calcite veins in the SP Fm. are lower than those of the corresponding limestones, while the δ34S values of fracture-filling pyrite veins are similar to those of gypsum-salt layer in the QJM Fm. but significantly higher than δ34S values of pyrite in Early Cambrian shale (<30‰) [51]. This suggests that sulfur in the SP Fm. pyrite originates from the QJM Fm. evaporite layers. As mentioned above, the SO42− content in vein inclusions decreases from the QJM Fm. downward to the SJT Fm., whereas CH4 content increase. It can be inferred that high-salinity fluids migrated downward from the QJM Fm. along fractures, while hydrocarbons migrated upward from the SJT Fm., triggering thermochemical sulfate reduction (TSR) in the SP Fm [52,53]:.
SO42− + CH4 → H2S + CO32− + H2O
The oxidation of methane produces CO32− with depleted δ13C, which then combines with Ca2⁺ to form carbonate veins, while H2S reacts with Fe2⁺ to precipitate pyrite. Typically, TSR-derived H2S exhibits δ34S values that are 10–20‰ lighter than the original sulfate [54]. However, the δ34S values of fracture-filling pyrite in the SP Fm. are consistent with those of gypsum-salt interlayers in the QJM Fm., suggesting that deliquescent sulfate supply was limited during TSR. In a relatively closed environment, nearly all sulfate was reduced to H2S, resulting in minimal isotopic fractionation (Figure 11).
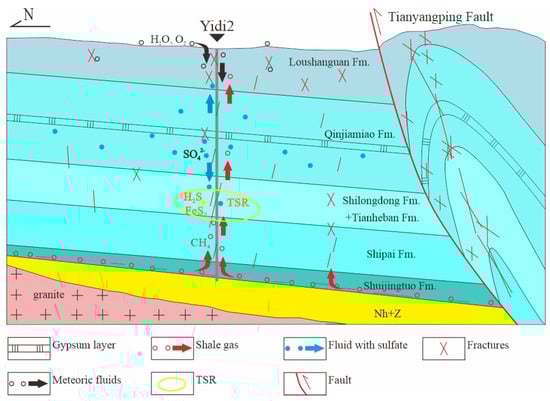
Figure 11.
Model of Cambrian paleo-fluid migration in Yichang area.
The δ13C and δ18O values of calcite veins in the LSG Fm. are lower than those of the corresponding limestones, with the most depleted samples occurring in fractures with low filling degrees, particularly in the central parts of veins formed during the latest stages. However, no pyrite veins were found in the LSG Fm., so it is difficult to explain the isotopic composition using the TSR model. Fluid inclusion liquid-phase analysis confirms that meteoric water infiltration occurred in the LSG Fm. during geological history. The infiltration of meteoric water can lead to methane oxidation, producing CO2 with depleted δ13C, with the extent of depletion depending on the proportion of oxidized methane [47]. Additional, meteoric water typically has low δ18O values, which may explain the lower oxygen isotope values in the calcite veins.
The Na-Cl coefficient of inclusion assemblages exhibits a certain correlation with Δ18O, the difference between 18O value of vein and that of limestones (Figure 12), indicating that reducing fluids with low water/rock ratio originate from a close system, whereas fluids with meteoric water mixing typically exist in high water/rock ratio, open environments. However, the correlation is not very pronounced, as isotopes primarily reflect the mineralization environment of veins, whereas ion compositions can also indicate the formation environment of secondary inclusions after the veins formation.
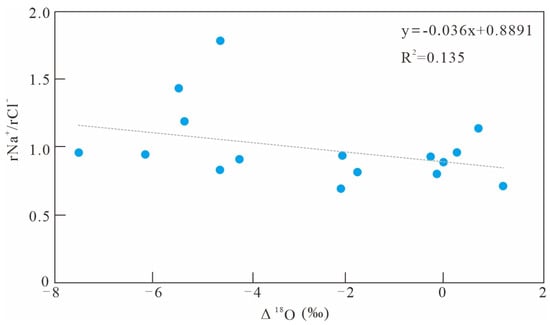
Figure 12.
Relationship between Na-Cl coefficient and Δ18O.
5.2. Shale Sealing Capacity and Analysis of Shale Gas Escape Pathways
Great sealing capacity is one of the key geological factors for high shale gas productivity. Commercially exploited shale gas fields are often overpressured reservoirs [32,55,56]. The properties and source of paleo-fluids reveal differences in the sealing capacity of Cambrian formations. Generally, intra-layer fluids indicate better sealing capacity, followed by interlayer fluids, while late-stage meteoric water infiltration signifies the weakest sealing conditions [17,45].
Overall, the sealing capacity of the Cambrian formations in Well Yidi2 increases with depth. Among different formations, the QJM Fm. and the SJT-YJH Fm. exhibit great self-sealing properties. The formations below the QJM Fm. evaporite layers have better overall sealing capacity compared to those above, demonstrating the strong regional caprock effectiveness of the evaporite layers [44]. This corresponds well with shale gas indications in the QJM Fm., hydrocarbon shows in fractures of the THB-SP Fms, and the discovery of high gas saturation shale layers in the SJT Fm. Geochemical analyses of paleo-fluids in the LSG Fm indicate that its fracture veins formed in a relatively open oxidizing environment with meteoric water infiltration. In contrast, the SJT-YJH Fms exhibit the highest sealing capacity, with fractures forming in a high gas-saturation, reducing environment where fluids originated from within the formation, with minimal interaction with external fluids.
Laser Raman spectroscopy reveals the presence of abundant high-density methane inclusions in the SJT Fm, indicating a significant overpressure history. However, the present reservoir is at normal pressure, suggesting a substantial pressure dissipation process accompanied by shale gas escape after overpressure formation. The discussion here focuses on whether shale gas escaped primarily through vertical fractures or horizontal fractures (bedding parallel fractures).
Some hydrocarbon inclusions exhibit not only typical “D” and “G” peaks in Raman spectra but also characteristic high-density methane peak (Figure 8a), suggesting that early oil inclusions underwent high-temperature cracking, forming high-density methane. This process is a key reason why high thermally mature organic-rich shales generate high-pressure conditions [31]. In contrast, the QJM and LSG Fms., located farther from the source rock, lack significant high-density methane inclusions. In the SJT Fm., both horizontal and vertical fractures contain hydrocarbon and high-density methane inclusions, indicating that fractures formation occurred under relatively sealed high-pressure conditions, and the fractures formation was related to overpressure fracturing caused by oil cracking. The paleo-fluid environment showed no significant difference between these two fracture types.
However, in horizontal fractures of the SJT Fm., hydrocarbon and methane inclusions dominate, while two-phase inclusions are significantly less developed compared to vertical fractures. The Raman shift data for methane inclusions in horizontal fractures tend to cluster closer to the 2910 cm⁻1 range, as observed in sample A8. This suggests that, during later fracture activities, horizontal fractures maintained their sealing capacity, whereas vertical fractures gradually opened, leading to decreased sealing capacity. The internal pressure of captured methane inclusions in vertical fractures decreased over time (e.g., sample A15), and fluids from overlying formations infiltrated the SJT Fm through vertical fractures.
These observations indicate that vertical fractures serve as the primary pathways for shale gas escape in the Cambrian formations. Shale gas initially diffuses along bedding planes into fractures, from which it subsequently dissipates outward. Typically, shale exhibits higher horizontal permeability than vertical permeability, leading to widespread horizontal diffusion of shale gas. However, pressure dissipation and compaction reduce shale porosity and permeability, causing a decline in reservoir quality from the basin center toward the basin margins [57]. This lateral sealing effect can reactivate previously sealed vertical fractures, enabling vertical migration of shale gas, making vertical fractures the most direct escape pathway.
5.3. Evolution of Paleo-Fluid Activity and Shale Gas Preservation Conditions
In Well Yidi2, the Cambrian shale reached a vitrinte reflectance (Ro) of 0.7% at 240 Ma, marking the onset of large-scale oil and associated gas generation. By 200 Ma, during deep burial in the Triassic, the Ro value reached 1.3%, entering the oil-cracking stage. During continued Jurassic burial, hydrocarbon cracking led to increased formation pressure, inducing abundant overpressure-induced fractures formation. The first-generation fluid inclusions (formed at ~190 Ma) are primarily high-maturity hydrocarbons, with some methane inclusions. The formation pressure coefficient of the methane inclusions during this stage was 1.48–1.68. The second-generation fluid inclusions formed at ~170 Ma, with similar composition to the first generation, and a formation pressure coefficient of 1.78–2.1 (Table 1). During the formation of the first and second-generation inclusions, hydrocarbon generation-driven water expulsion and vaporization-induced liquid transport resulted in extremely low water saturation in the shale. High-maturity hydrocarbon and methane were primarily trapped as immiscible phases, with minimal two-phase inclusion. The Cambrian formations exhibited good sealing capacity during this stage, and the geological fluids forming calcite veins primarily originated from the dissolution of coeval limestone (Figure 13).
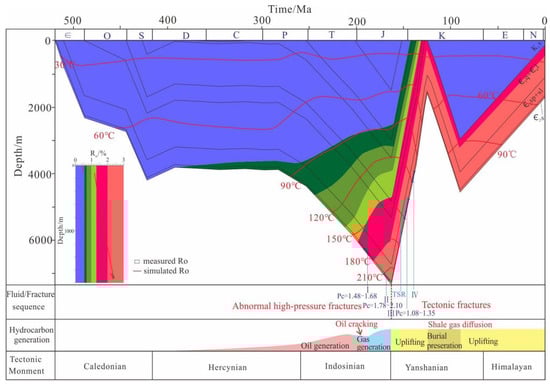
Figure 13.
The model of Cambrian paleo-fluids activities in Well Yidi2.
Influenced by the northwestward progressive deformation caused by the Mesozoic Jiangnan-Xuefeng intracontinental orogeny [58], the structural deformation in the Central Yangtze region is significantly more intense than that in the Upper Yangtze region. Since the Late Jurassic (160–98 Ma), the Yichang region experienced rapid uplift [37]. Tectonic compression and uplift facilitated vertical structural fracture development, with fractures extending from the QJM Fm. to the upper part of the SJT Fm. And it also caused substantial shale gas dissipation in the SJT Fm., leading to pressure loss. The third-generation fluid inclusion formed at ~4950 m depth, with formation temperatures of 130–150 °C and a declining formation pressure coefficient of 1.0–1.35. The fourth-generation fluid activity occurred at 110–120 °C. The fracture system not only facilitated rapid upward migration of shale gas, reducing formation pressure, but also enabled downward migration of high-salinity brine from the QJM Fm. These two fluids interacted within fractures of the SP Fm., triggering thermochemical sulfate reduction (TSR). TSR promoted the formation of calcite and pyrite veins, partially sealing fractures and inhabiting rapid shale gas dissipation from the SJT Fm. [18].
By the Late Cretaceous, sedimentary strata developed in a wedge-like pattern around the Huangling Uplift [37], and rapid sedimentation in the Cretaceous inhibited further shale gas escape (Figure 13). Since the Himalayan orogeny, the region has undergone overall uplift and erosion. The shallower burial depth of Cambrian formations allowed meteoric water infiltration into fractures of the SP-THB Fms., where late-stage aqueous inclusions with low Na-Cl coefficients were captured. However, the SJT Fm., with its great self-sealing nature, did not develop such inclusions, consistent with its low water and high gas saturation characteristics [10].
In summary, the SJT Fm in Well Yidi2 exhibits relatively favorable shale gas preservation conditions. This area lies within a relatively stable tectonic zone, where early overpressure-related high-density methane inclusions were not extensively destroyed. Late-stage fluid inclusions still contain abundant methane inclusions. The development of fracture-filling veins enhanced the self-sealing capacity of the shale, reducing the rate of shale gas dissipation. Additionally, rapid Cretaceous sedimentation further delayed shale gas migration, making the Cambrian SJT Fm a prime target for shale gas exploration.
6. Conclusions
Through geological observations of fracture characteristics in core samples from Well Yidi2, compositional and isotopic analyses of fluid inclusions, homogenization temperature and salinity measurements, and gaseous and ionic composition analyses, a paleo-fluid profile was established. Following conclusions can be drawn:
Fluid inclusions in Cambrian fracture-filling veins recorded the complete process of liquid hydrocarbon cracking into gas, formation water backflow along vertical fractures, shale gas upward migration, meteoric water infiltration, and the transition of the shale gas reservoir from overpressure to normal pressure. Therefore, the vertical fractures are the main channels for shale gas dissipation in the Cambrian strata in the Yichang area.
The SJT Fm. in Well Yidi2 exhibits relatively favorable shale gas preservation conditions. The area is within a structurally stable zone, and fracture-filling veins enhanced shale self-sealing capacity, reducing gas escape. Rapid Cretaceous sedimentation further inhibited gas diffusion, making the SJT Fm. a key target for shale gas exploration.
Author Contributions
Conceptualization, A.L. and K.W.; methodology, Q.X.; software, Q.C.; validation, H.H., formal analysis, S.Q.; investigation, A.L.; resources, A.L.; data curation, A.L.; writing—original draft preparation, A.L.; writing—review and editing, S.Q. and A.L.; visualization, X.Z.; supervision, Q.X.; project administration, P.L.; funding acquisition, P.L. All authors have read and agreed to the published version of the manuscript.
Funding
This research was funded by National Science and Technology Major Projects of China [No. 2016ZX05034001-002] and the Geological Survey Projects of the China Geological Survey [No. DD20240047]. And The APC was funded by [No. DD20240047].
Institutional Review Board Statement
Not applicable.
Informed Consent Statement
Not applicable.
Data Availability Statement
The datasets used in this study are available from the corresponding author upon reasonable request.
Acknowledgments
We thank Xiancai Sheng and Dengfeng Ma from Exploration and Development Research Insititute of Jianghan Oilfield Branch of SINOPEC for the sampling work. We also thank Guangxi Ou from Bejing Research Insititute of Uranium Gelology and Fang Li from Wuhan Centre of China Geological Survey for the experimental analysis.
Conflicts of Interest
The authors declare no conflict of interest.
References
- Zou, C.N.; Dong, D.Z.; Wang, Y.M.; Li, X.J.; Huang, J.L. Shale Gas in China: Characteristics, Challenges and Prospects. Pet. Explor. Dev. 2015, 42, 753–767. [Google Scholar] [CrossRef]
- Ju, Y.W.; Wang, G.C.; Bu, H.L.; Li, Q.G.; Yan, Z.F. China Organic-Rich Shale Geologic Features and Special Shale Gas Production Issues. J. Rock Mech. Geotech. Eng. 2014, 6, 196–207. [Google Scholar] [CrossRef]
- Wu, Z.R.; Ralf, L.; Qin, S.; Huang, Y.H.; He, S.; Zhai, G.Y.; Huang, Z.Q.; Wang, K.M. Multi-Scale Pore Structure of Terrestrial, Transitional, and Marine Shales from China: Insights into Porosity Evolution with Increasing Thermal Maturity. J. Mar. Sci. Eng. 2025, 13, 609. [Google Scholar] [CrossRef]
- Guo, T.L.; Zhang, H.R. Formation and Enrichment Mode of Jiaoshiba Shale Gas Field, Sichuan Basin. Pet. Explor. Dev. 2014, 41, 28–36. [Google Scholar] [CrossRef]
- Qiao, J.Q.; Luo, Q.Y.; Guo, S.X.; Tang, X.L.; Ludmila, K.; Ralf, L. Organic petrology and geochemistry of the late Neogene Shizigou Formation in the Qaidam Basin, China: Characteristics of a prospective microbial gas source rock. Int. J. Coal Geol. 2024, 296, 104658. [Google Scholar] [CrossRef]
- Yan, J.F.; Men, Y.P.; Sun, Y.Y.; Yu, Q.; Liu, W.; Zhang, H.Q.; Liu, J.; Kang, J.W.; Zhang, S.N.; Bai, H.H.; et al. Geochemical and Geological Characteristics of the Lower Cambrian Shales in the Middle-Upper Yangtze Area of South China and Their Implication for the Shale Gas Exploration. Mar. Pet. Geol. 2016, 70, 1–13. [Google Scholar] [CrossRef]
- Qiao, J.Q.; Luo, Q.Y.; Zhang, K.H.; Zhang, G.L.; Duan, J.C.; Wang, D.D.; Yu, H.Z.; Wang, S.Z.; Qu, Y.S.; Ludmila, K. Geochemistry and organic petrography of the Middle Permian Lucaogou alkaline lacustrine oil shale in the southern Junggar Basin, China: Implications for formation conditions and organic matter accumulation. Int. J. Coal Geol. 2023, 268, 104198. [Google Scholar] [CrossRef]
- Liu, Y.; Zhang, J.C.; Ren, J.; Liu, Z.Y.; Huang, H.; Tang, X. Stable Isotope Geochemistry of the Nitrogen-Rich Gas from Lower Cambrian Shale in the Yangtze Gorges Area, South China. Mar. Pet. Geol. 2016, 77, 693–702. [Google Scholar] [CrossRef]
- Hao, F.; Zou, H.Y.; Lu, Y.C. Mechanisms of Shale Gas Storage: Implications for Shale Gas Exploration in China. Am. Assoc. Pet. Geol. Bull. 2013, 97, 1325–1346. [Google Scholar] [CrossRef]
- Feng, W.P.; Wang, F.Y.; Guan, J.; Zhou, J.X.; Wei, F.B.; Dong, W.J.; Xu, Y.F. Geologic Structure Controls on Initial Productions of Lower Silurian Longmaxi Shale in South China. Mar. Pet. Geol. 2018, 91, 163–178. [Google Scholar] [CrossRef]
- Hu, D.F.; Zhang, H.R.; Ni, K.; Yu, G.C. Main Controlling Factors for Gas Preservation Conditions of Marine Shales in Southeastern Margins of the Sichuan Basin. Nat. Gas Ind. 2014, 7, 905–915. [Google Scholar]
- Zhang, K.; Song, Y.; Jiang, S.J.; Jiang, Z.; Jia, C. Shale Gas Accumulation Mechanism in a Syncline Setting Based on Multiple Geological Factors: An Example of Southern Sichuan and the Xiuwu Basin in the Yangtze Region. Fuel 2019, 241, 468–476. [Google Scholar] [CrossRef]
- Hensen, C.; Wallmann, K. Methane Formation at Costa Rica Continental Margin—Constraints for Gas Hydrate Inventories and Cross-Décollement Fluid Flow. Earth Planet. Sci. Lett. 2005, 236, 41–60. [Google Scholar] [CrossRef]
- Parnell, J. Geofluids: Origin Migration and Evolution of Fluids in Sedimentary Basins; Geological Society Special Publication: London, UK, 1994; p. 78. [Google Scholar]
- Cooley, M.A.; Price, R.A.; Kyser, T.K.; Dixon, J.M. Stable-Isotope Geochemistry of Syntectonic Veins in Paleozoic Carbonate Rocks in the Livingstone Range Anticlinorium and Their Significance to the Thermal and Fluid Evolution of the Southern Canadian Foreland Thrust and Fold. Am. Assoc. Pet. Geol. Bull. 2011, 95, 1851–1882. [Google Scholar] [CrossRef]
- Katarzyna, J.S.; Lukasz, K.; Leszek, M. Fluid Circulation and Formation of Minerals and Bitumens in the Sedimentary Rocks of the Outer Carpathians- Based on Studies on the Quartz-Calcite-Organic Matter Association. Mar. Pet. Geol. 2012, 33, 138–158. [Google Scholar]
- Liu, A.; Ou, W.J.; Huang, H.L.; Wei, K.; Li, H.; Chen, X.H. Significance of Paleo-Fluid in the Ordovician–Silurian Detachment Zone to the Preservation of Shale Gas in Western Hunan–Hubei Area. Nat. Gas Ind. 2018, 38, 34–43. [Google Scholar] [CrossRef]
- Li, H.L.; You, D.H.; Han, J.; Qian, Y.X.; Sha, X.G.; Xi, B.B. The origin of fluid in calcite veins and its implications for hydrocarbon accumulation in the Shunnan-Gucheng area of the Tarim Basin, China. J. Nat. Gas Geosci. 2020, 5, 341–353. [Google Scholar] [CrossRef]
- Dong, M.; Zhang, L.Y.; Wang, Z.X. Accumulation Characteristics and Preservation Conditions of Niutitang Formation of Lower Cambrian Series Shale Gas in West Hubei: A Case Study of Well XD1. Earth Sci. 2019, 44, 3616–3627. [Google Scholar]
- Tian, H.; Zeng, L.B.; Ma, S.J.; Li, H.; Mao, Z.; Peng, Y.M.; Xu, X.; Feng, D.J. Effects of different types of fractures on shale gas preservation in Lower Cambrian shale of northern Sichuan Basin: Evidence from macro-fracture characteristics and microchemical analysis. J. Pet. Sci. Eng. 2022, 218, 110973. [Google Scholar] [CrossRef]
- Fan, Q.Q.; Liu, D.D.; Du, W.; Li, Y.M.; Liang, F.; Zhao, F.P.; Feng, X.; Chen, Y.; Zhang, Z.Y.; Zhang, Y.X.; et al. In situ U-Pb dating of carbonate veins in Cambrian shales constrains fluid flow and hydrocarbon evolution at the southeastern margin of the Upper Yangtze platform, southwestern China. GSA Bull. 2024, 136, 2875–2890. [Google Scholar] [CrossRef]
- Chen, X.H.; Wang, C.S.; Liu, A.; Luo, S.Y.; Li, H.; Wei, K. The Discovery of Shale Gas in the Cambrian Shuijingtuo Formation of Yichang Area, Hubei Province. Geol. China 2017, 44, 188–189. [Google Scholar]
- Yan, D.P.; Zhou, M.F.; Song, H.L.; Wang, X.W.; John, M. Origin and Tectonic Significance of a Mesozoic Multi-Layer Over-Thrust System Within the Yangtze Block (South China). Tectonophysics 2003, 361, 239–254. [Google Scholar] [CrossRef]
- Fu, Y.X.; Zhang, P.; Li, Z.X.; Yang, Z.W.; Liu, X.M.; Wang, S.H. The Tectonic Characteristics and Their Significance for Hydrocarbon Exploration in Mid-Yangtze Area. Geotecton. Metallog. 2007, 31, 308–314. [Google Scholar]
- Chen, X.H.; Luo, S.H.; Tian, J.Q.; Wang, Z.H.; Li, P.H.; Chen, L.; Schulz, H.; Shahzad, A.; Jan, I.U. Assessing the gas potential of the lower Paleozoic shale system in the Yichang area, Middle Yangtze region. Energy Fuels 2021, 35, 5889–5907. [Google Scholar] [CrossRef]
- Liu, A.; Chen, X.H.; Li, P.J.; Zhou, P.; Li, H.; Cai, Q.S.; Luo, S.Y. A Comparative Study of Shale Gas Preservation Conditions on Both Sides of Tianyangping Fault in Yichang Area. Geol. Sci. Technol. Inf. 2020, 39, 10–19. [Google Scholar]
- Zeng, X.W.; Wang, C.S.; Liu, A.; Wei, K. On the Sedimentary Facies of Middle Cambrian Tianheban Formation in Yichang, Hubei Province and Its Hydrocarbon Significance. Geol. Miner. Resour. S. China 2016, 32, 142–148. [Google Scholar]
- Chen, X.H.; Wei, K.; Zhang, B.M.; Li, P.J.; Li, H.; Liu, A.; Luo, S.Y. Main Geological Factors Controlling Shale Gas Reservoir in the Cambrian Shuijingtuo Formation in Yichang of Hubei Province as Well as Its Enrichment Patterns. Geol. China 2018, 45, 207–226. [Google Scholar]
- Lu, W.J.; Chou, I.M.; Burruss, R.C.; Song, Y.C. A Unified Equation for Calculating Methane Vapor Pressures in the CH4–H2O System with Measured Raman Shifts. Geochim. Cosmochim. Acta 2007, 71, 3969–3978. [Google Scholar] [CrossRef]
- Zhang, J.; Qiao, S.; Lu, W. An Equation for Determining Methane Densities in Fluid Inclusions with Raman Shifts. J. Geochem. Explor. 2016, 171, 20–28. [Google Scholar] [CrossRef]
- Gao, J.; He, S.; Zhao, J.X.; Yi, J.Z. Geothermometry and Geobarometry of Overpressured Lower Paleozoic Gas Shales in the Jiaoshiba Field, Central China: Insight from Fluid Inclusions in Fracture Cements. Mar. Pet. Geol. 2017, 83, 124–139. [Google Scholar] [CrossRef]
- Gao, J.; Zhang, J.K.; He, S. Overpressure Generation and Evolution in Lower Paleozoic Gas Shales of the Jiaoshiba Region, China: Implications for Shale Gas Accumulation. Mar. Pet. Geol. 2019, 102, 844–859. [Google Scholar] [CrossRef]
- Veizer, J.; Davin, A.; Karem, A. 87Sr/86Sr, δ13C and δ18O Evolution of Phanerozoic Seawater. Chem. Geol. 1999, 161, 59–88. [Google Scholar] [CrossRef]
- Guo, T.L.; Li, G.X.; Zeng, Q.L. From the Borehole Temperature Log and Thermal Conductivity Measurements of Core Samples from Well Dangshen 3 in the Dangyang Synclinorium, Jianghan Basin and Its Exploration Implications. Chin. J. Geol. 2005, 40, 570–578. [Google Scholar]
- Li, T.Y.; He, S.; He, Z.L. Reconstruction of Tectonic Uplift and Thermal History Since Mesozoic in the Dangyang Synclinorium of the Central Yangtze Area. Acta Pet. Sin. 2012, 33, 213–224. [Google Scholar]
- Shi, H.C.; Shi, X.B. Exhumation Process of Middle-Upper Yangtze Since Cretaceous and Its Tectonic Significance: Low-Temperature Thermochronology Constraints. Chin. J. Geophys. 2014, 57, 2608–2619. [Google Scholar]
- Shen, C.B.; Mei, L.F.; Peng, L.; Chen, Y.Z.; Yang, Z.; Hong, G.F. LA-ICPMS U-Pb Zircon Age Constraints on the Provenance of Cretaceous Sediments in the Yichang Area of the Jianghan Basin, Central China. Cretac. Res. 2012, 34, 172–183. [Google Scholar] [CrossRef]
- Jacob, H.; Jacob, H. Classification, structure, genesis and practical importance of natural solid bitumen. Int. J. Coal Geol. 1985, 11, 65–79. [Google Scholar] [CrossRef]
- Gao, J.; Li, Y.Q.; He, S.; He, Z.L.; Li, S.J.; Wo, Y.J. Exploration Discovery of Shale Gas and Its Indicative Significance to Mineralization of MVT Lead-Zinc Deposit in Yichang Area, Western Hubei. Earth Sci. 2021, 46, 2230–2245. [Google Scholar]
- Liu, D.H.; Xiao, X.M.; Tian, H.; Min, Y.S.; Zhou, Q.; Cheng, P.; Shen, J.G. Sample Maturation Calculated Using Raman Spectroscopic Parameters for Solid Organics: Methodology and Geological Applications. Chin. Sci. Bull. 2013, 58, 1285–1298. [Google Scholar] [CrossRef]
- Garven, G. The Role of Regional Fluid Flow in the Genesis of the Pine Point Deposit, Western Canada Sedimentary Basin. Econ. Geol. 1985, 80, 307–324. [Google Scholar] [CrossRef]
- Lou, Z.H.; Zhu, R.; Jin, A.M.; Sun, M.M. Evolution of Hydrodynamic Field, Oil-Gas Migration and Accumulation in Songliao Basin, China. Chin. J. Oceanol. Limnol. 2004, 22, 105–123. [Google Scholar]
- Tóth, J. Gravity-Induced Cross-Formational Flow of Formation Fluids, Red Earth Region, Alberta, Canada: Analysis, Patterns, and Evolution. Water Resour. Res. 1978, 14, 805–843. [Google Scholar] [CrossRef]
- Jin, Z.J.; Zhou, Y.; Yun, J.B.; Sun, D.S.; Long, S.X. Distribution of Gypsum-Salt Cap Rocks and Near-Term Hydrocarbon Exploration Targets in the Marine Sequences of China. Oil Gas Geol. 2010, 31, 715–724. [Google Scholar]
- Li, M.; Lou, Z.H.; Jin, A.M.; Zhu, R.; Shang, C.J.; Ye, Y.; Zhu, Z.H. Origin, Flow of Formation Water and Hydrocarbon Accumulation in the Zhenwu Area of the North Jiangsu Basin, China. Acta Geol. Sin. Engl. Ed. 2013, 87, 819–829. [Google Scholar]
- Zeng, J.H.; Wu, Q.; Yang, H.J.; Qian, S.Y.; Kong, X.; Ma, Z.L. Chemical Characteristics of Formation Water in Tazhong Area of the Tarim Basin and Their Petroleum Geological Significance. Oil Gas Geol. 2008, 29, 223–229. [Google Scholar]
- Li, Q.; Wang Hb Cai, F.; Luo, D.; Kong, F.X.; Li, A.; Liu, X.T. Influence of methane seep activities and sea-level changes on elemental and isotopic compositions and abundance of carbonates in sediments of the Okinawa Trough since the last glacial period. J. Asian Earth Sci. 2024, 260, 105942. [Google Scholar] [CrossRef]
- Zhao, Y.Y.; Zheng, Y.F. Diagenesis of carbonate sediments. Acta Petrol. Sin. 2011, 27, 501–519. [Google Scholar]
- Lewan, M.D. Experiments on the Role of Water in Petroleum Formation. Geochim. Cosmochim. Acta 1997, 61, 3691–3723. [Google Scholar] [CrossRef]
- Fang, C.H.; Huang, Z.L.; Wang, Q.Z.; You, L.J.; Kang, Y.L.; Wang, Y.F. Simulation of Ultra-Low Water Saturation in Shale Gas Reservoirs and Its Significance. Geochimica 2015, 44, 267–274. [Google Scholar]
- Lei, J.J.; Li, R.W.; Tobschall, H.J.; Fang, J.H. Characteristics of Morphological Sulfur and Its Genetic Significance in Early Cambrian Black Rock Series on the Southern Margin of Yangtze. Sci. China Earth Sci. 2000, 30, 592–601. [Google Scholar]
- Wilson, L.O. Changes in Sulfur Content and Isotopic Ratios of Sulfur During Petroleum Maturation—Study of Big Horn Basin Paleozoic Oils. Am. Assoc. Pet. Geol. Bull. 1974, 58, 2295–2318. [Google Scholar]
- Worden, R.H.; Smalley, P.C. H2S-Producing Reactions in Deep Carbonate Gas Reservoirs: Khuff Formation, Abu Dhabi. Chem. Geol. 1996, 133, 157–171. [Google Scholar] [CrossRef]
- Machel, H.G.; Krouse, H.R.; Sassen, R. Products and Distinguishing Criteria of Bacterial and Thermochemical Sulfate Reduction. Appl. Geochem. 1995, 10, 373–389. [Google Scholar] [CrossRef]
- Bowker, K.A. Barnett Shale Gas Production, Fort Worth Basin: Issues and Discussion. Am. Assoc. Pet. Geol. Bull. 2007, 91, 523–533. [Google Scholar] [CrossRef]
- Ambrose, R.J.; Hartman, R.C.; Diaz-Campos, M.; Akkutlu, I.Y.; Sondergeld, C.H. Shale Gas-In-Place Calculations Part I: New Pore-Scale Considerations. SPEJ 2012, 17, 219–229. [Google Scholar] [CrossRef]
- Nie, H.K.; Wang, H.; He, Z.L.; Wang, R.Y.; Zhang, P.X. Formation Mechanism, Distribution and Exploration Prospect of Normal Pressure Shale Gas Reservoir: A Case Study of Wufeng Formation-Longmaxi Formation in Sichuan Basin and Its Periphery. Acta Pet. Sin. 2019, 40, 131–144. [Google Scholar]
- Mei, L.F.; Liu, Z.Q.; Tang, J.G.; Shen, C.B.; Fan, Y.F. Mesozoic Intra-Continental Progressive Deformation in Western Hunan-Hubei-Eastern Sichuan Provinces of China: Evidence from Apatite Fission Track and Balanced Cross-Section. Earth Sci. J. China Univ. Geosci. 2010, 35, 161–174. [Google Scholar]
Disclaimer/Publisher’s Note: The statements, opinions and data contained in all publications are solely those of the individual author(s) and contributor(s) and not of MDPI and/or the editor(s). MDPI and/or the editor(s) disclaim responsibility for any injury to people or property resulting from any ideas, methods, instructions or products referred to in the content. |
© 2025 by the authors. Licensee MDPI, Basel, Switzerland. This article is an open access article distributed under the terms and conditions of the Creative Commons Attribution (CC BY) license (https://creativecommons.org/licenses/by/4.0/).