Article

Optimal and Sustainable Scheduling of Integrated Energy System Coupled with CCS-P2G and Waste-to-Energy Under the “Green-Carbon” Offset Mechanism

1
School of Electrical and Information Engineering, Changsha University of Science and Technology, Changsha 410114, China
2
School of Electrical and Electronic Engineering, North China Electric Power University, Beijing 102206, China
*
Author to whom correspondence should be addressed.
Sustainability 2025, 17(11), 4873; https://doi.org/10.3390/su17114873
Submission received: 16 April 2025 / Revised: 18 May 2025 / Accepted: 20 May 2025 / Published: 26 May 2025

Abstract

:
Waste-to-energy (WTE) is considered the most promising method for municipal solid waste treatment. An integrated energy system (IES) with carbon capture systems (CCS) and power-to-gas (P2G) can reduce carbon emissions. The incorporation of a “green-carbon” offset mechanism further enhances renewable energy consumption. Therefore, this study constructs a WTE-IES hybrid system, which conducts multi-dimensional integration of IES-WTP, CCS-P2G, photovoltaic (PV), wind turbine (WT), multiple energy storage technologies, and the “green-carbon” offset mechanism. It breaks through the limitations of traditional single-technology optimization and achieves the coordinated improvement of energy, environmental, and economic triple benefits. First, waste incineration power generation is coupled into the IES. A mathematical model is then established for the waste incineration and CCS-P2G IES. The CO2 produced by waste incineration is absorbed and reused. Finally, the “green-carbon” offset mechanism is introduced to convert tradable green certificates (TGCs) into carbon emission rights. This approach ensures energy demand satisfaction while minimizing carbon emissions. Economic incentives are also provided for the carbon capture and conversion processes. A case study of an industrial park is conducted for validation. The industrial park has achieved a reduction in carbon emissions of approximately 72.1% and a reduction in the total cost of approximately 33.5%. The results demonstrate that the proposed method significantly reduces carbon emissions. The energy utilization efficiency and system economic performance are also improved. This study provides theoretical and technical support for the low-carbon development of future IES.

1. Introduction

Against the backdrop of global energy transition, waste-to-energy (WTE) utilization has attracted widespread attention. This field has become a cutting-edge and hot research topic both domestically and internationally [1].
Current research on WTE primarily focuses on co-generation with other energy sources to improve thermal efficiency. An integrated scheme of municipal solid waste incineration with solar thermal systems was proposed and designed [2]. Khan, M.S. et al. investigated the optimal configuration of solar-integrated WTE plants [3]. An advanced WTE system combined with coal-fired power plants was developed [4]. Although the combined power generation has improved the efficiency, it has not fundamentally reduced the CO2 emissions. The integration with biomass combustion power plants was proposed to enhance waste incineration power generation [5]. Scholars have researched the applications of various WTE and have achieved certain results in the protection of the ecological environment [2,3,4,5]. However, in the context of multi-energy coordinated dispatching, there is a lack of attention paid to carbon dioxide emissions. A novel system combining reheat, recompression, and the intercooling supercritical CO2 cycle with organic Rankine cycle (ORC) was introduced for WTE recovery [6], which effectively improved the ecological efficiency of the factory. Scholars proposed new schemes for hybrid waste incineration power generation that included biogas power generation, thus promoting low-carbon development and green energy transformation and achieving sustainable urban waste management [7,8,9]. However, they did not directly treat and utilize the CO2 in the incineration flue gas. Ćurčić, S. et al. analyzed and optimized the system of combining biomass in solid waste with combined heat and power (CHP) [10]. Wijesekara, D. et al. examined the biogas production capacity of various raw materials used in CHP, highlighting the energy potential of WTE power generation using waste [11]. Scholars combined WTE with IES-related equipment and explored their carbon reduction capabilities [7,8,9,10,11]. However, unlike this study, they did not propose a comprehensive strategy for CO2 capture, conversion, and IES integration during the waste incineration process. Unlike internal equipment optimization for thermal efficiency improvement, recent studies have incorporated WTE into multi-energy coordinated dispatch. The multi-energy coupling problem in integrated energy systems (IES) has been extensively investigated. However, limited attention has been paid to CO2 emissions during waste incineration processes. Carbon capture systems (CCS) and power-to-gas (P2G) technology are commonly employed for CO2 capture and conversion to synthetic natural gas. The integration of WTE with CCS-P2G technology enables carbon resource recycling. System flexibility and resilience are simultaneously enhanced through this integration.
CCS and P2G are some of the most promising means to reduce carbon emissions [12]. CCS was incorporated into IES as a subsystem, effectively reducing carbon emissions [13]. Low-carbon economic operation is achieved through the coupling of P2G, combined heat and power (CHP), gas boiler (GB), and CCS technologies in the P2G-CCS-CHP microgrid energy system [14,15,16]. Li, J. et al. investigated the roles of CCS and P2G in IES and proposed a particle swarm optimization-based solution method [17]. The integration of CCS into IES with electric vehicles was examined [18]. Wang, L. et al. conducted a combined study of ladder-type carbon emission trading (CET), demand response (DR), and CCS-P2G [19]. Scholars respectively mentioned the applications of CO2, hydrogen, photovoltaic (PV), and wind turbine (WT) in the IES, but none of them conducted relevant research on the combination with CCS-P2G [20,21,22]. Zhang, S. et al. proposed a new multi-time scale matching method to fine-tune the interaction between Power Storage systems (PSs) and Heat Storage systems (HSs) [23]. Its key lies in the analytical temperature mapping function of HSs in the continuous space. However, the analysis with the combination of CCS-P2G was not considered. Existing research has made valuable explorations in CCS coordination with other equipment and system carbon reduction. However, few studies have considered the operational impacts of coordination between CCS-P2G, CET, and green certificate trading (GCT) offset mechanisms in IES.
Regarding research on CET-GCT: In the international community, CET is regarded as an effective mitigation method for reducing CO2 emissions, while GCT is regarded as an important form of multi-attribute certificate trading, playing a benchmark role in certifying and tracking the environmental attributes of renewable energy. And the CET-GCT can be regarded as a new and more integrated framework [24,25]. A two-stage trading method for “green-carbon” IES was proposed based on the Stackelberg game [26]. The integration of GCT and CET markets with P2G and CCS was shown to effectively enhance system low-carbon performance [27,28]. The impacts of CET and GCT on park-level IES were investigated, confirming their positive effects on system operation [29,30]. A joint certificate–carbon trading model was designed to overcome CET-GCT mechanism barriers and enhance market trading flexibility [31]. An optimal dispatch model combining CET and GCT was developed for virtual power plants, improving the Virtual Power Plant (VPP) economic performance [32,33]. The incorporation of CET and GCT into Cement-Industrial IES was shown to enhance the system economic efficiency [34]. The conversion mechanism between carbon emissions and TGC requires further investigation. The coordinated offset mechanism of ladder-type CET-GCT warrants significant research attention under increasing waste generation scenarios.
The deficiencies of the above-mentioned studies can be briefly summarized as follows:
(1)
There are few studies on the combination of WTE and IES. How should the optimal scheduling of the WTE-IES be carried out?
(2)
Considering the market mechanism and low-carbon measures, when CCS-P2G is applied to the WTE-IES coupling system, enabling it to utilize the CO2 generated from waste incineration, what are the specific effects?
(3)
How to design an effective ladder-type CET-GCT offset mechanism, and at the same time, make it improve the low-carbon economic efficiency of the WTE-IES coupling system incorporating CCS-P2G?
Thus, this study investigates WTE with CCS-P2G integration under the “green-carbon” offset mechanism. The key contributions are presented as follows:
(1)
An IES-WTE hybrid system is developed, incorporating CHP, CCS, P2G, photovoltaic (PV), wind turbine (WT), and multiple energy storage technologies. This system is designed for optimal municipal solid waste utilization amid increasing urban waste generation.
(2)
A multi-energy system model incorporating CCS and two-stage P2G is established, where the optimal solution is obtained under given parameters and capacity constraints while considering the time-varying characteristics of energy prices, thereby enhancing the renewable energy utilization efficiency of the IES-WTE coupled system. The simulation results show that, compared with Case 2, the carbon emissions in Case 3 are reduced by approximately 17.25%.
(3)
A ladder-type “green-carbon” offset mechanism is proposed, enabling TGC-to-carbon emission rights conversion. Effective coordination between CCS-P2G and ladder-type CET-GCT offset mechanisms is achieved. This approach significantly improves both economic performance and low-carbon characteristics of the IES. Sensitivity analysis is conducted on the proposed ladder-type “green-carbon” offset mechanism. After the introduction of ladder-type CET-GCT offset mechanisms, the total cost of Case 6 has decreased by approximately 33.5% compared with that of Case 3.

2. Modeling of IES

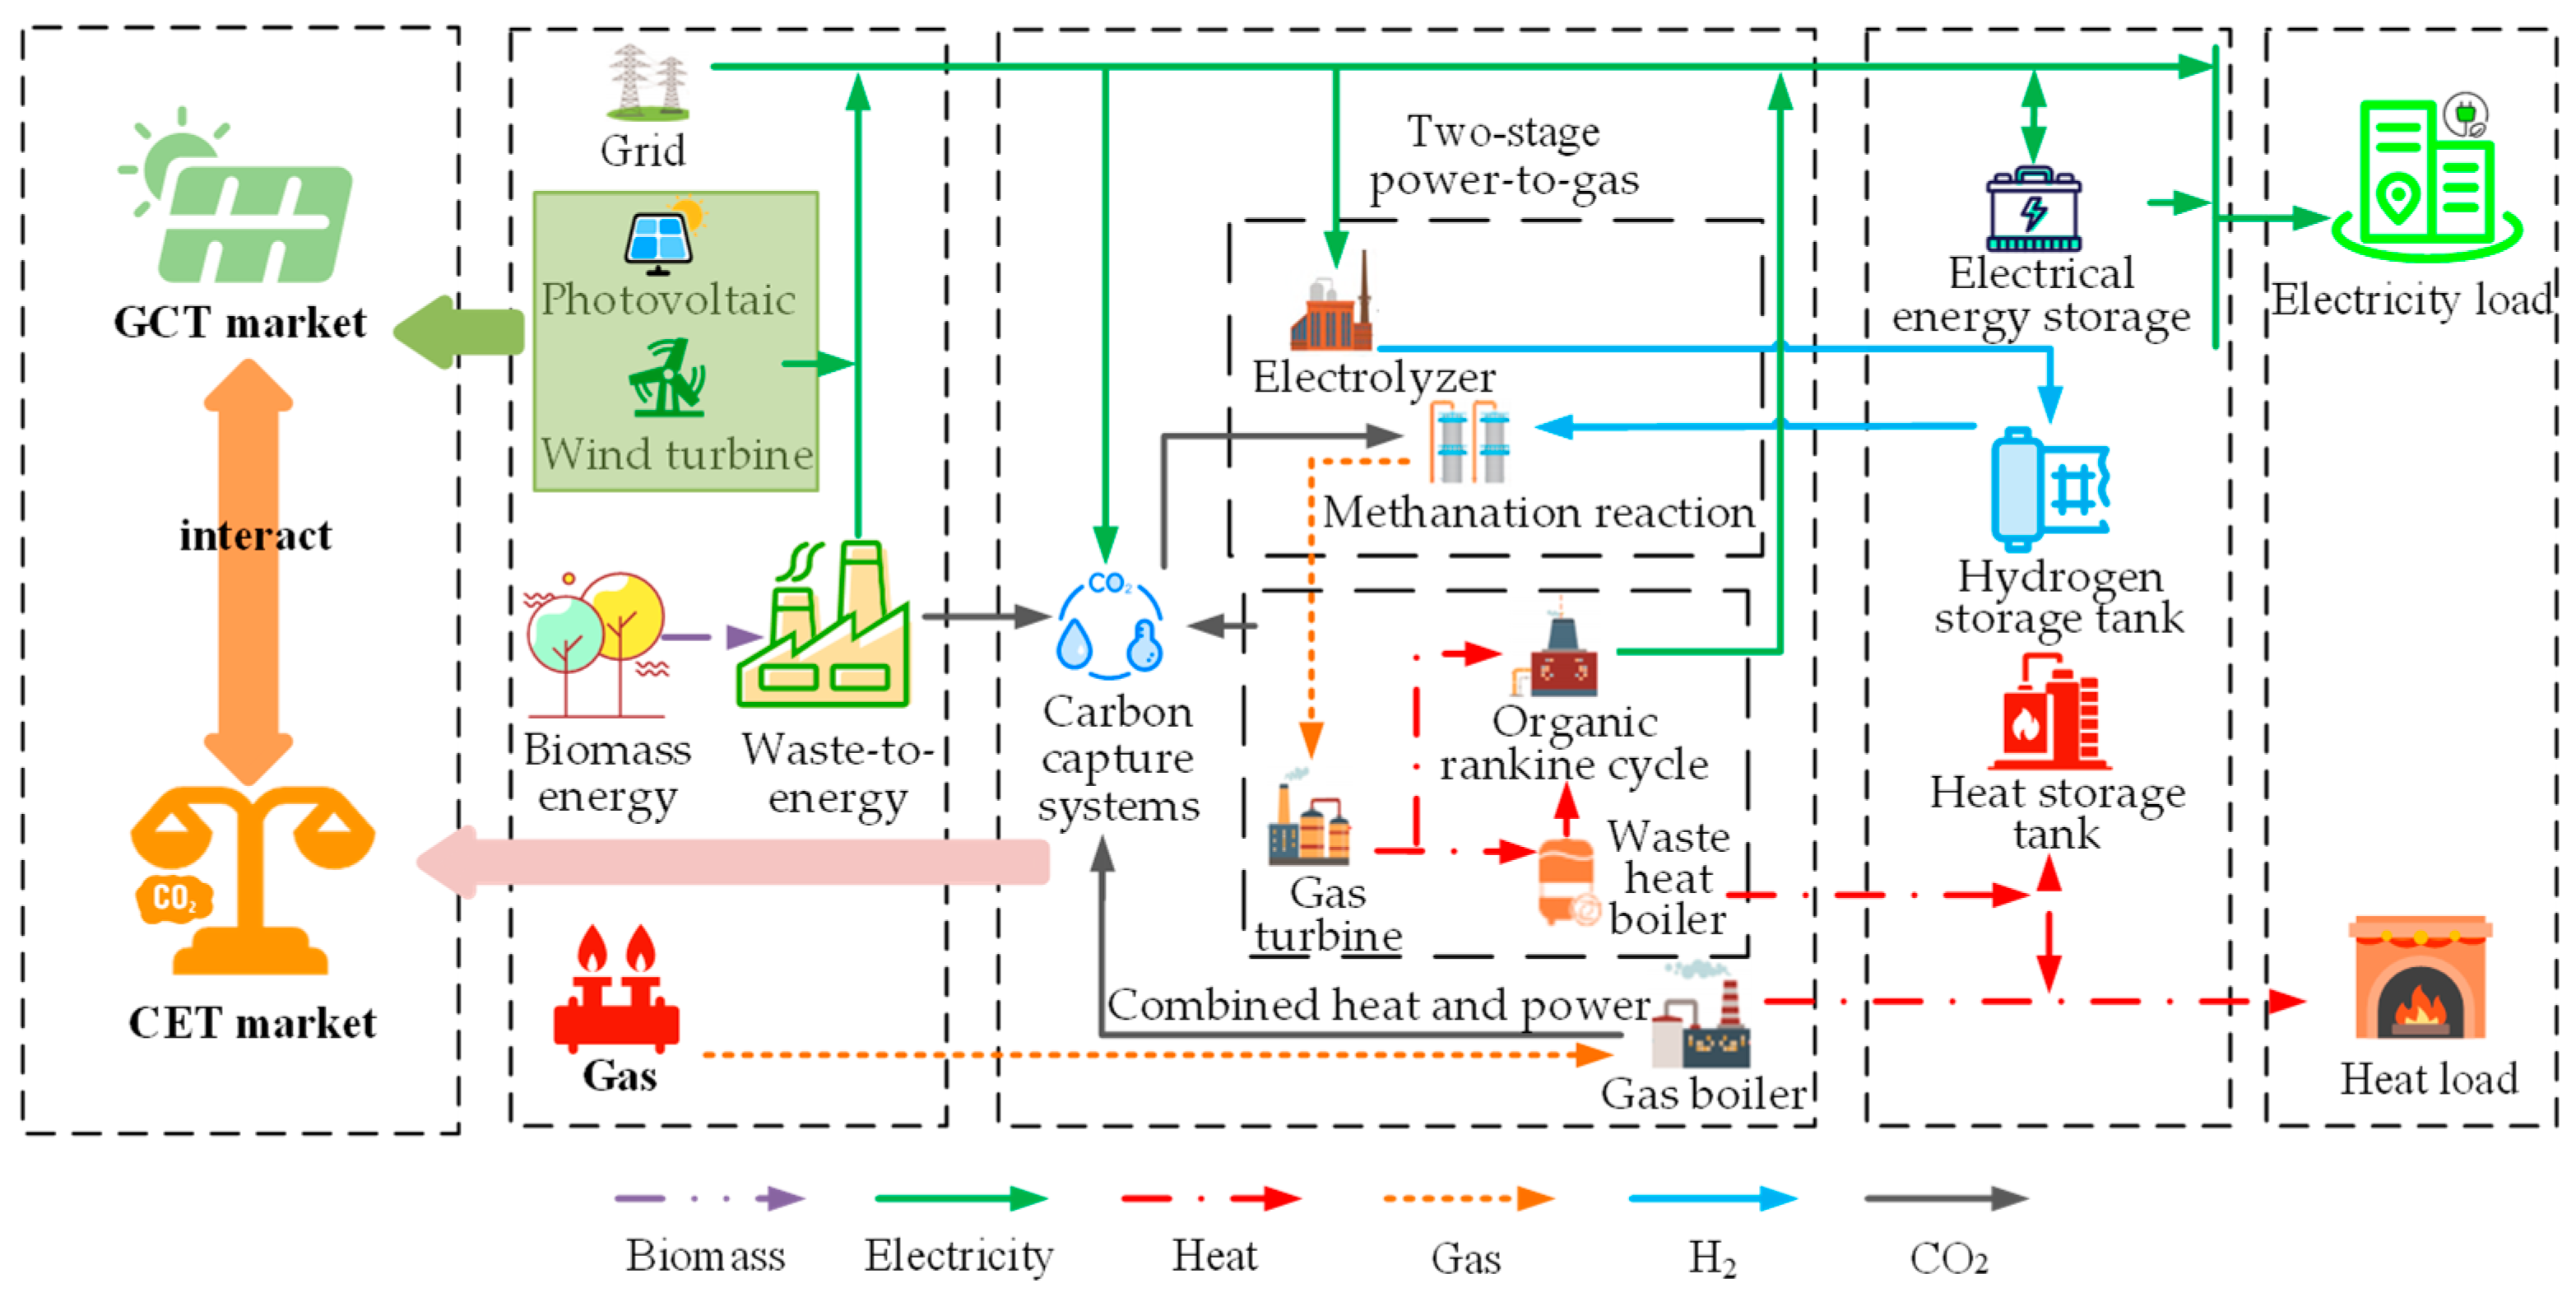
2.1. Basic Structure of IES

An IES model is developed to serve multiple regions, based on renewable power generation from WT and PV, biomass energy (BE) recycling, and multi-energy storage scenarios, as shown in Figure 1.

2.2. Equipment Mathematical Model

2.2.1. The Modeling of CCS with Liquid Storage Tanks

Currently, the three major main capture technologies for CO2 include pre-combustion, oxy-fuel combustion, and post-combustion technologies. Considering the great diversity in CCS, it is not realistic to perform overall research on various CCS in a single research paper. Thus, we only study the CCS with a liquid storage tank under ideal conditions [35,36]. The operational energy consumption of CCS installations refers to the electrical power required by various equipment during CO2 absorption, desorption, and compression processes [37,38]. The specific mathematical expression is provided in Equation (1).
P C C S ( t ) = P C C S D + η c o 2 E re , c o 2 ( t ) E re , c o 2 ( t ) = E H 2 G ( t ) + E s t o r a g e ( t )
In the equation, P C C S ( t ) represents the electrical power consumption of the CCS unit; P C C S D denotes the fixed operational energy consumption; η c o 2 is the energy consumption coefficient for CO2, η c o 2 = 0.269   KW . h / kg [37];  E re , c o 2 ( t ) indicates the mass of CO2 processed by the regeneration tower of CCS; E H 2 G ( t ) stands for the mass of CO2 supplied to the P2G unit for methanation; and E s t o r a g e ( t ) corresponds to the mass of CO2 sequestered.
Since the energy consumption of CCS is mainly concentrated in the regeneration tower, installing liquid storage equipment in CCS can effectively decouple the processes of CO2 absorption and regeneration [39,40]. The liquid storage system consists of lean-solution and rich-solution storage facilities. To avoid nonlinear modeling complexities, a linear assumption is adopted. The rich solution is assumed to absorb CO2 at 25 times its volume capacity, while the lean solution absorbs only an equivalent volume of CO2 [41,42]. This relationship is mathematically expressed in Equation (2).
V F ( t ) = V F ( t 1 ) + v F , in ( t ) v F , out ( t ) V P ( t ) = V P ( t 1 ) + v P , in ( t ) v P , out ( t ) v F , out ( t ) = v P , in ( t ) v P , out ( t ) = v F , in ( t ) 25 v F , in ( t ) = η c E as , c o 2 ( t ) / ρ CO 2 25 v F , out ( t ) = E re , c o 2 ( t ) / ρ CO 2
In the equation, V F ( t ) and V P ( t ) represent the storage capacities of rich and lean solution tanks, respectively. v F , in ( t ) and v F , out ( t ) denote the inflow and outflow volumetric flow rates of the rich solution storage tank at time t. v P , in ( t ) and v P , out ( t ) are defined as the inflow and outflow volumetric flow rates of the lean solution storage tank at time t. E as , c o 2 ( t ) indicates the mass of CO2 captured by the absorption tower in the CCS. η c represents the carbon capture efficiency. ρ CO 2 is defined as the density of CO2.

2.2.2. P2G Modeling

The electrolyzer operation model is expressed by Equation (3).
Q EL , H 2 ( t ) = η EL P EL ( t ) Q EL , H 2 ( t ) = L H 2 m p , H 2 ( t ) / e h
In the equation, Q EL , H 2 ( t ) is defined as the hydrogen production power. P EL ( t ) denotes the electrolytic hydrogen production power consumption. η EL expresses the electrolytic hydrogen production conversion efficiency. e h is introduced as the energy conversion coefficient between electrical and thermal energy, e h = 3.6 × 10 6   J / KW . h . L H 2 is measured in joules per kilogram (J/kg), representing the hydrogen calorific value. m p , H 2 ( t ) represents the hydrogen production mass.
The methanation reaction (MR) operational model is formulated as shown in Equation (4).
Q H 2 G , out ( t ) = η H 2 G Q H 2 G , in ( t ) Q H 2 G , out ( t ) = L C H 4 m p , C H 4 ( t ) / e h Q H 2 G , in ( t ) = L H 2 m u , H 2 ( t ) / e h V p , C H 4 ( t ) = m p , C H 4 ( t ) / ρ C H 4
In the equation, Q H 2 G , out ( t ) is defined as the gas generation power of the unit; Q H 2 G , in ( t ) is characterized as the hydrogen consumption power of the unit; η H 2 G represents the methanation conversion efficiency; L C H 4 denotes the calorific value of natural gas; m p , C H 4 ( t ) is expressed as the MR mass; m u , H 2 ( t ) is described as the hydrogen consumption mass; and V p , C H 4 ( t ) is quantified as the natural gas volume generated by the P2G process.
The mass of CO2 required is determined by Equation (5) since the volumetric demand of CO2 for methanation equals that of the methane produced.
E H 2 G ( t ) = e h Q H 2 G , out ( t ) L CH 4 ρ C O 2 ρ CH 4
In the equation, E H 2 G ( t ) is defined as the required CO2 mass for methanation, and ρ CH 4 represents the density of methane.

2.2.3. WTE Power Plant Modeling

This study focuses on a WTE power generation system based on the incineration of Municipal Solid Waste (MSW). That is, it realizes the recovery of heat energy and power generation through the incineration of MSW. The study emphasizes the optimization of the combination of WTE and IES, researches how to utilize the CO2 generated during the waste incineration process, and explores the low-carbon benefits of the combination of WTE and IES. The power output model of WTE plants is characterized by Equation (6).
P g p ( t ) = λ g R g ( t )
In the equation, P g p ( t ) is defined as the power generation capacity of the waste incineration plant. λ g is calculated as the fixed operational energy consumption, which complies with national technical specifications. According to national standards, the electricity conversion rate for combustible household waste is specified as 280 kW·h per ton, corresponding to λ g = 0.28 kW·h/kg. R g ( t ) is determined as the mass flow rate of incinerated combustible waste.
The net electricity generation of the WTE system is calculated in Equation (7), with the energy consumption required for flue gas treatment being comprehensively considered.
P g p , n ( t ) = P g p ( t ) P g p , s ( t ) V s m o k e ( t ) = P g p ( t ) e s P g p , s ( t ) = μ g p , s V s m o k e ( t )
In the equation, P g p , n ( t ) is defined as the net electricity generation of the WTE plant. P g p , s ( t ) is calculated as the total power consumption of flue gas treatment in the same period. V s m o k e ( t ) expresses the volumetric flow rate of flue gas produced by waste incineration. e s is characterized as the specific flue gas emission rate per unit output of the WTE system. μ g p , s is determined as the energy consumption coefficient per unit volume of flue gas treatment.
The carbon emissions from waste incineration are calculated in Equation (8).
m g p , c o 2 ( t ) = β g R g ( t )
In the equation, m g p , c o 2 ( t ) is defined as the CO2 mass generated by WTE incineration, where β g represents the CO2 mass produced per ton of municipal solid waste incineration.

2.2.4. CHP and GB Modeling

The CHP system is primarily composed of two major components: a gas turbine (GT) and a waste heat boiler (WHB). The mathematical model describing the input–output relationship between GT and WHB is expressed in Equation (9).
P chp ( t ) = P GT ( t ) = Q CH 4 , chp ( t ) η chp P H GT ( t ) = Q CH 4 , chp ( t ) ( 1 η chp P η chp l o s s ) = Q CH 4 , chp ( t ) η chp H Q CH 4 , chp ( t ) = L C H 4 m chp , C H 4 ( t ) / e h V chp , C H 4 ( t ) = m c h p , C H 4 ( t ) / ρ C H 4 H chp ( t ) = ( 1 + η w h b ) H GT ( t )
In the equation, P GT ( t ) is defined as the power generation of the GT, which equals the total power generation ( P chp ( t ) ) of the CHP unit. Q CH 4 , chp ( t ) represents the equivalent power of natural gas consumed by the GT. η chp P , η chp H , η chp l o s s , and η w h b denote the electrical efficiency, thermal efficiency, energy loss rate of the GT, and the heat recovery efficiency of WHB, respectively. H chp ( t ) corresponds to the thermal output of the CHP unit, whereas V chp , C H 4 ( t ) indicates the volume of natural gas consumed by the CHP unit in the same period.
The heating model of the GB is described as follows.
H GB ( t ) = Q CH 4 , G B ( t ) η G B Q CH 4 , G B ( t ) = L C H 4 m G B , C H 4 ( t ) / e h V GB , C H 4 ( t ) = m G B , C H 4 ( t ) / ρ C H 4
In the equation, H GB ( t ) is defined as the thermal output generated by the GB. Q CH 4 , G B ( t ) represents the equivalent combustion power corresponding to the natural gas consumed by the GB. η G B denotes the heating efficiency of the GB. V GB , C H 4 ( t ) corresponds to the volume of natural gas consumed by the GB.
The actual carbon emissions generated by the combined heat and power generation of the CHP unit and GB are calculated using Equation (11).
m c h p , c o 2 ( t ) = V chp , C H 4 ( t ) β C H 4 m G B , c o 2 ( t ) = V GB , C H 4 ( t ) β C H 4
In the equation, m c h p , c o 2 ( t ) and m G B , c o 2 ( t ) are defined as the CO2 mass generated by the CHP unit and the GB, respectively. β C H 4 is defined as the CO2 mass produced per cubic meter of natural gas combustion.

2.2.5. The Various Energy Storage Devices Modeling

The models of various energy storage devices are established in Equation (12).
S ES , e ( t ) = S ES , e ( t 1 ) + [ η ES , e cha P ES , e cha ( t ) 1 η ES , e dis P ES , e dis ( t ) ] Δ t S ES , h ( t ) = S ES , h ( t 1 ) + [ η ES , h cha H ES , h cha ( t ) 1 η ES , h dis H ES , h dis ( t ) ] Δ t S ES , H 2 ( t ) = S ES , H 2 ( t 1 ) + [ η ES , H 2 cha Q ES , H 2 cha ( t ) 1 η ES , H 2 dis Q ES , H 2 dis ( t ) ] Δ t
In the equation, S ES , e ( t ) , S ES , h ( t ) , and S ES , H 2 ( t ) are defined as the storage capacities of the electrical energy storage (EES), heat storage tank (HST), and hydrogen storage tank (HYS), respectively. P ES , e cha ( t ) and P ES , e dis ( t ) represent the charging and discharging power values of the EES, respectively. H ES , h cha ( t ) and H ES , h dis ( t ) denote the heat charging and discharging power values of the HST, respectively. Q ES , q cha ( t ) and Q ES , q dis ( t ) indicate the hydrogen charging and discharging power values of the HYS in period t, respectively. η ES , e cha and η ES , e dis correspond to the electrical energy charge/discharge efficiencies, respectively, whereas η ES , h cha and η ES , h dis are associated with the thermal energy charge/discharge efficiencies, respectively. η ES , H 2 cha and η ES , H 2 dis relate to the hydrogen energy charge/discharge efficiencies, respectively.

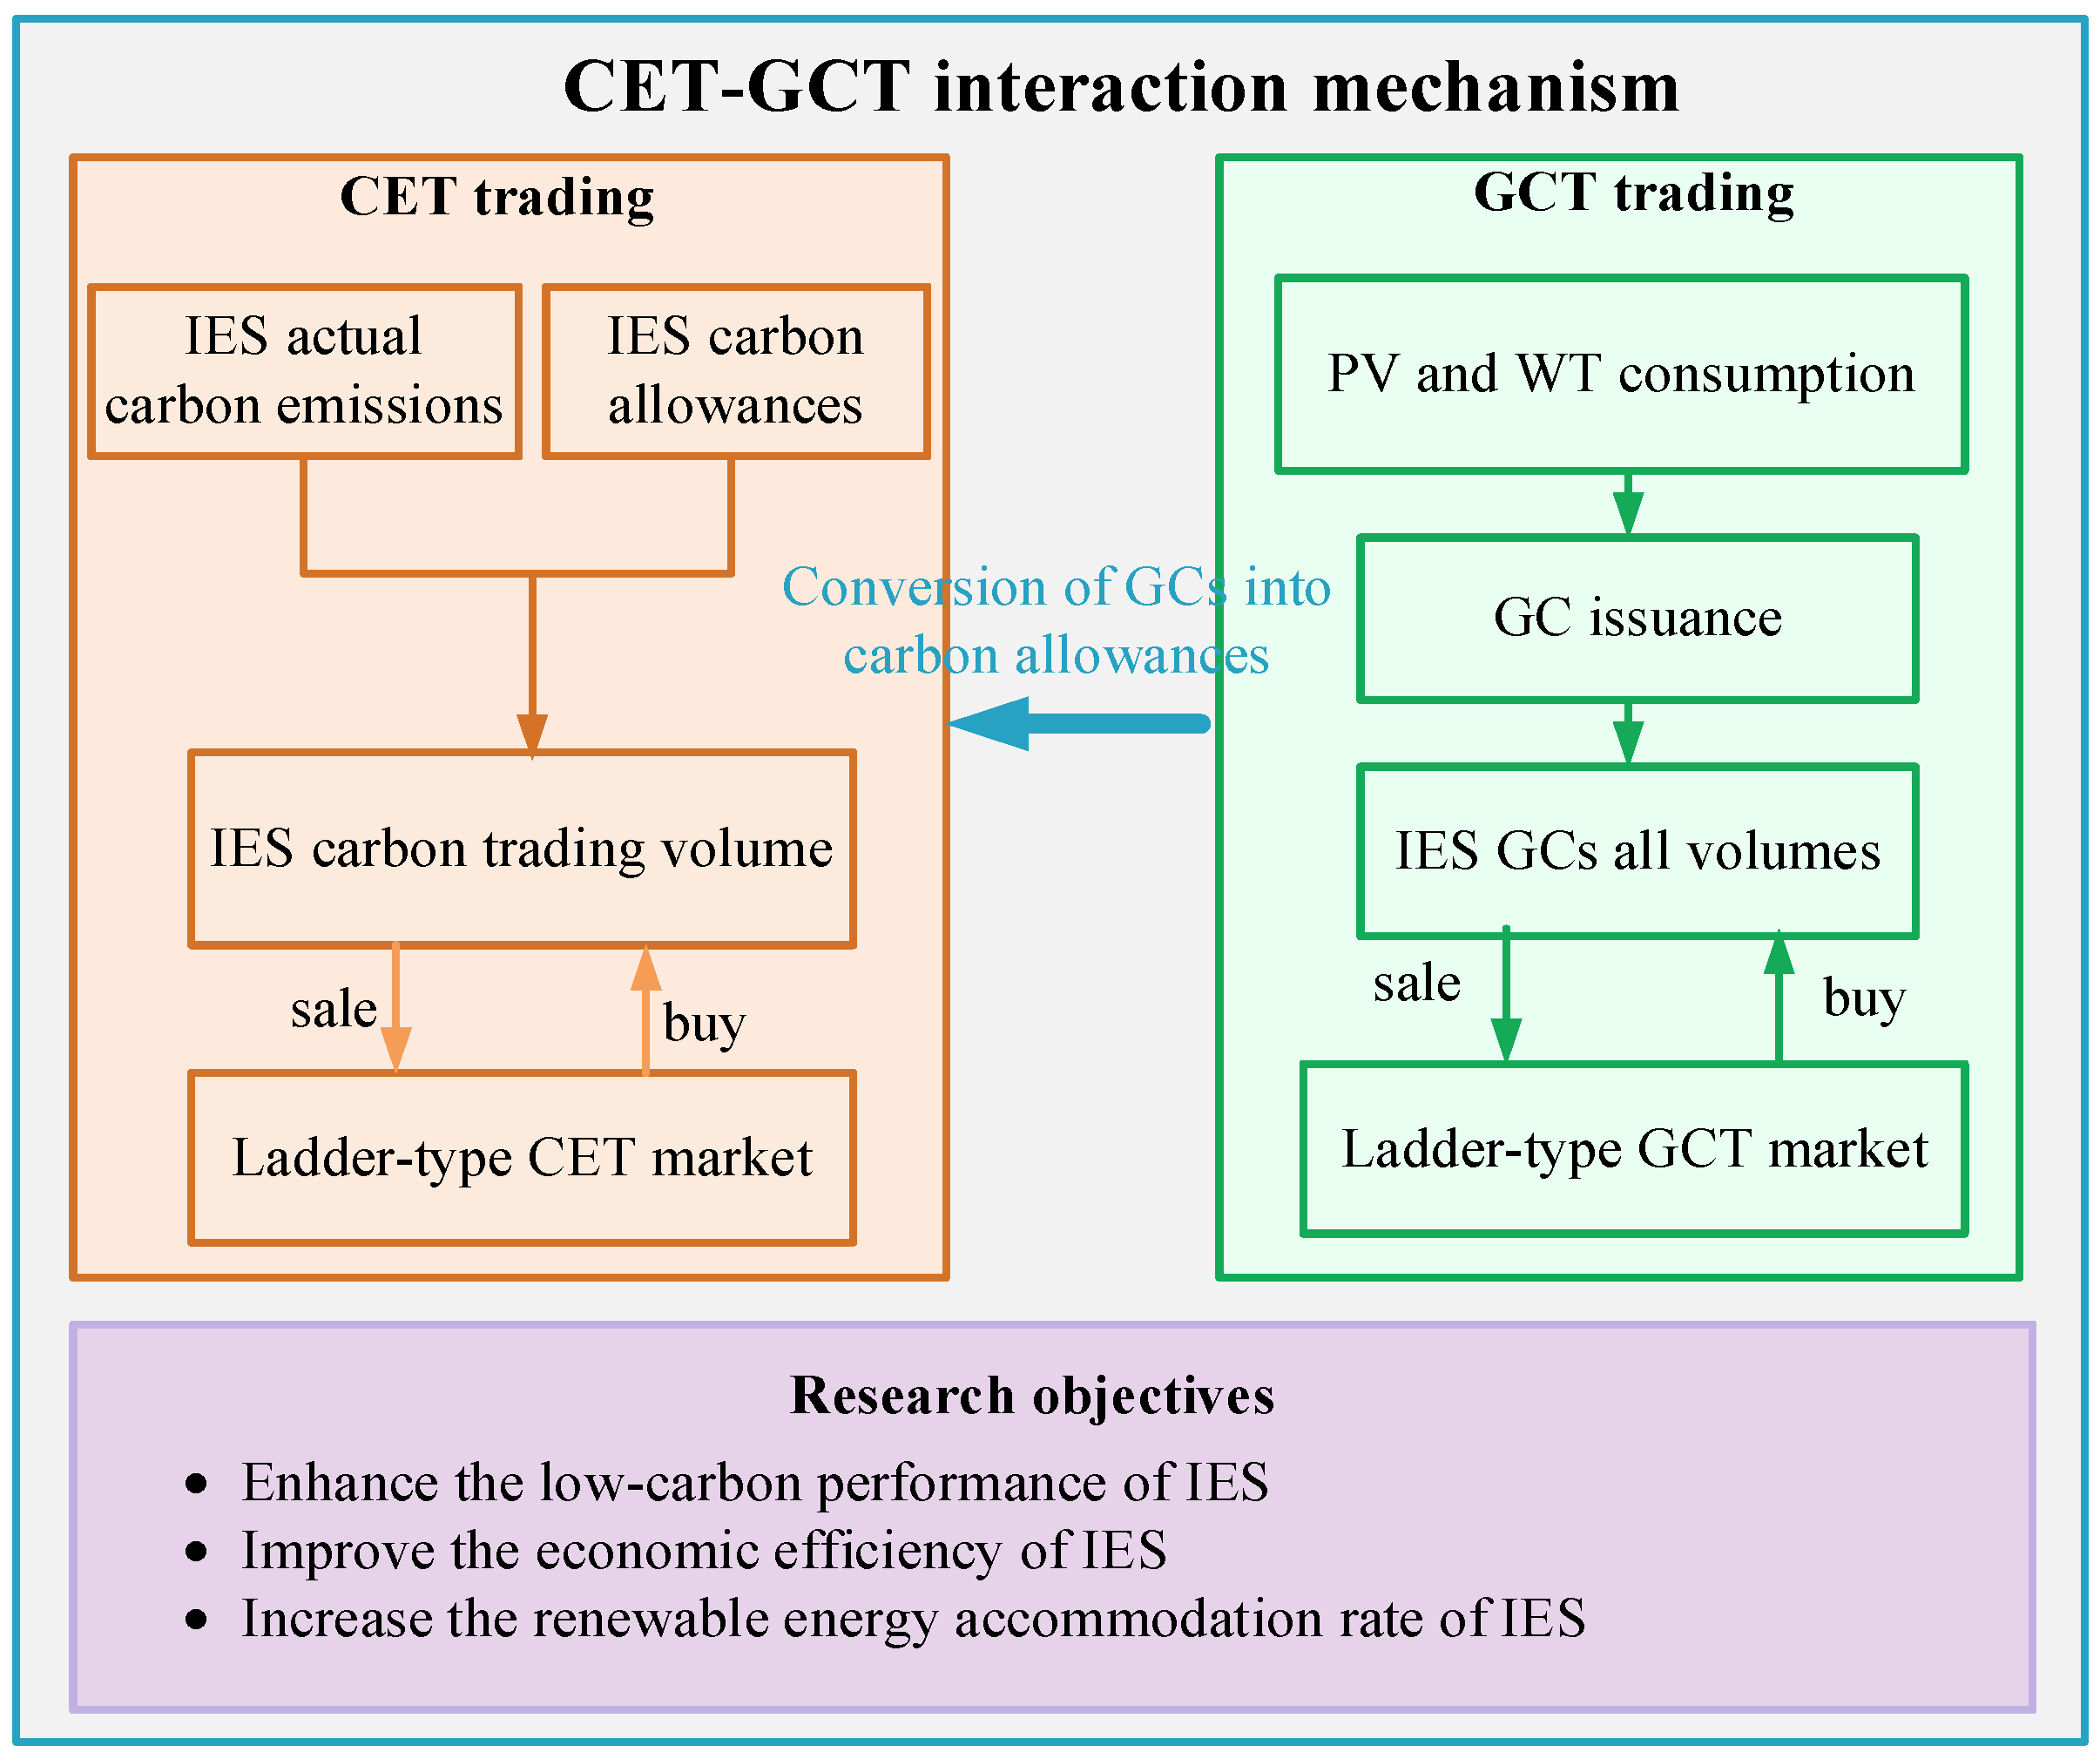
2.3. Ladder-Type “Green-Carbon” Offset Mechanism

The GCT mechanism and CET mechanism are recognized as two core strategies for enhancing renewable energy utilization and reducing carbon emissions. Their transaction mechanism models are described below.

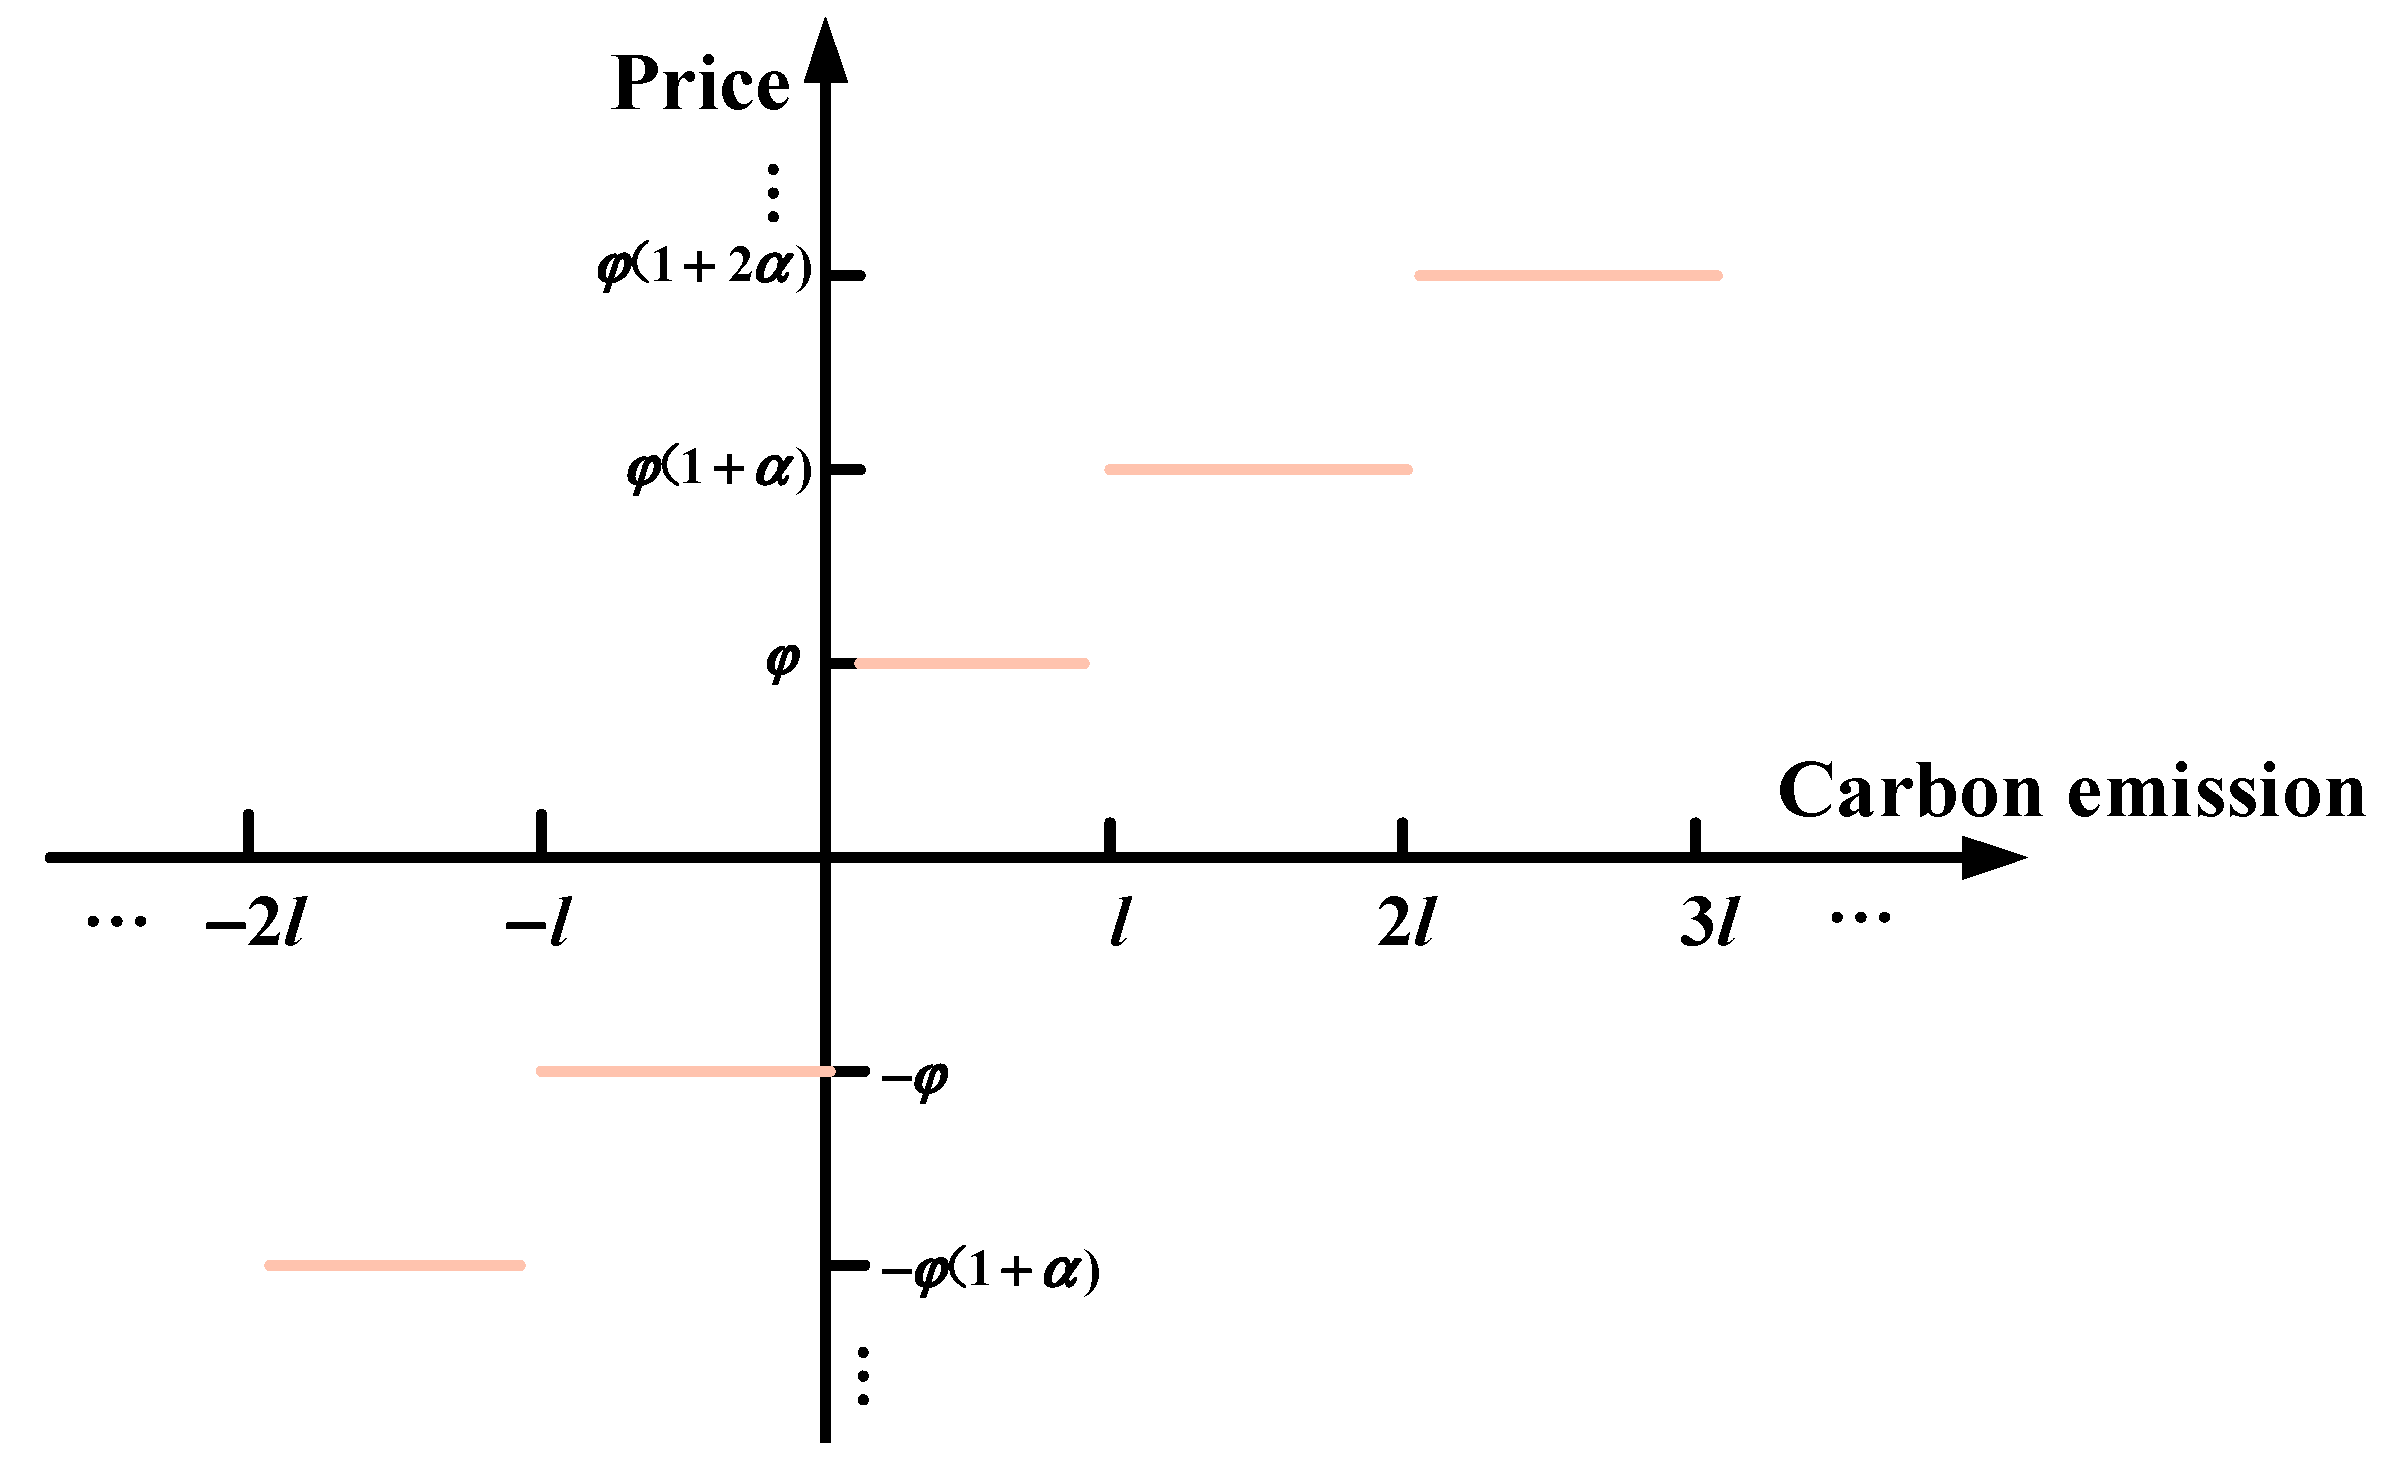
2.3.1. Ladder-Type CET Mechanism

The initial carbon emission allowance allocation model is established in Equation (13).
E credit ( t ) = E g p ( t ) + E e , gird ( t ) + E C H P ( t ) + E GB ( t ) E g p ( t ) = δ e , gp P g p ( t ) E e , gird ( t ) = δ e , gird P e , grid ( t ) E C H P ( t ) = δ e , chp P CHP ( t ) + δ h , chp H CHP ( t ) e h E GB ( t ) = δ h , gb H GB ( t ) e h
In the formula, the free baseline carbon allowance E credit ( t ) for the IES is composed of the WTE unit allowance E g p ( t ) , grid-purchased electricity allowance E e , gird ( t ) , GT allowance E C H P ( t ) , and GB allowance E GB ( t ) . The carbon allowances δ e , gp and δ e , gird are assigned to per-unit power generation from the WTE unit and grid-purchased electricity, respectively. The allowances δ e , chp and δ h , chp are allocated to per-unit power generation and heat generation of the GT. The allowance δ h , gb is defined for per-unit heat generation of the GB.
The actual system carbon emissions are calculated using Equation (14).
M reality ( t ) = M g p ( t ) + M e , gird ( t ) + M CHP ( t ) + M G B ( t ) M C C S ( t ) M g p ( t ) = m g p , c o 2 ( t ) M e , gird ( t ) = a 1 + b 1 P e , grid ( t ) + c 1 P e , grid 2 ( t ) M CHP ( t ) = m c h p , c o 2 ( t ) M G B ( t ) = m G B , c o 2 ( t ) M C C S ( t ) = E re , c o 2 ( t )
In the equation, the actual carbon emission M reality ( t ) of the IES at time t is mainly composed of the carbon emission M e , gird ( t ) from power grid purchases, the emission M CHP ( t ) from CHP units, the emission M G B ( t ) from GB, the carbon emission reduction M C C S ( t ) by CCS, and the emission from WTE power generation units. Parameters a 1 , b 1 , and c 1 are the carbon emission calculation parameters for purchased electricity considered as thermal power unit emissions.
The part participating in the carbon trading market is:
E t r a d e ( t ) = M reality ( t ) E c r e d i t ( t )
In the equation, E t r a d e ( t ) is the carbon emission right for the IES at time t to participate in the CET market.
The reward–punishment ladder-type CET mechanism, based on traditional CET, sets corresponding ladder-type carbon prices for negative carbon trading volumes [43]. Its schematic diagram is presented in Figure 2. The mathematical expression of this mechanism is shown in Equation (16):
f c o 2 ( t ) = φ ( 1 + 2 α ) ( E t r a d e + 2 l ) φ ( 2 + α ) l , E t r a d e ( t ) 2 l φ ( 1 + α ) ( E t r a d e + l ) φ l , 2 l < E t r a d e ( t ) l φ E t r a d e , l E t r a d e ( t ) 0 φ E t r a d e , 0 E t r a d e ( t ) l φ ( 1 + α ) ( E t r a d e l ) + φ l , l < E t r a d e ( t ) 2 l φ ( 1 + 2 α ) ( E t r a d e 2 l ) + φ ( 2 + α ) l , 2 l < E t r a d e ( t )
In the equation, φ is the unit carbon trading price, with a value of CNY 250/t. l is the length of the carbon emission interval, taking a value of 1t. α is the increased range of the carbon trading price, set at 25% [44,45].
The total CET cost is obtained by summing the CET costs of each time within the scheduling cycle, as shown in Equation (17):
F c o 2 = t = 1 T f c o 2 ( t )

2.3.2. Ladder-Type GCT Mechanism

The brief explanation of the GCT mechanism is as follows: Renewable energy consumption responsibilities are allocated to consumers, and GCs serve as compliance credentials. Energy enterprises that fail to meet the standards must purchase certificates through the trading market to meet quota requirements. A market-based renewable energy promotion mechanism is formed [46]. Enterprises with excess can obtain tradable certificate surpluses. Based on the ladder-type CET framework, a ladder-type GCT model is constructed. The certificate holdings are positively correlated with transaction pricing, specifically, the transaction price increases proportionally with the certificate holdings and the gap.
F green = τ green N GCT , trade , N GCT , trade d τ green ( 1 + β green ) ( N GCT , trade - d ) + τ green d , d N GCT , trade 2 d τ green ( 1 + 2 β green ) ( N GCT , trade - 2 d ) + ( 2 + β green ) τ green d , 2 d N GCT , trade 3 d τ green ( 1 + 3 β green ) ( N GCT , trade - 3 d ) + ( 3 + 3 β green ) τ green d , 3 d N GCT , trade 4 d τ green ( 1 + 4 β green ) ( N GCT , trade - 4 d ) + ( 4 + 6 β green ) τ green d , 4 d N GCT , trade
N GCT , trade = N IES , reality N IES , quota
In the equation, F green represents the GC revenue; τ green is the GCT market base price, τ green = 0.13 CNY/kWh; β green is the price growth rate for ladder-type GCT trading, β green = 0.15 ; d is the ladder-type GCT interval, d = 10,000 kWh; N GCT , trade is the GC trading volume; N IES , reality is the actual GC holdings of the system; and N IES , quota is the GC quota of the system [46].
N IES , quota = μ g r e e n t = 1 T P L ( t )
In the equation, μ g r e e n is the GC quota coefficient of the IES, μ g r e e n = 0.52 . P L ( t ) is the electricity demand on the load side.
N IES , reality = γ g r e e n t = 1 T [ P w ( t ) + P v ( t ) ]
In the equation, γ g r e e n is the quantification coefficient for converting renewable energy power generation into GCs, γ g r e e n = 1 . P w ( t ) and P v ( t ) are the predicted power supply capacities of the WT unit and the PV unit, respectively.

2.3.3. Ladder-Type CET-GCT Mechanism

As can be obtained from what is shown in the Figure 3, the trading volumes of GCs and carbon emission allowances under the ladder-type GCT-CET interaction mechanism are as follows:
N GCT , trade = N GCT , trade N tran , g - c E t r a d e = E t r a d e μ g c N tran , g - c
In the equation, N tran , g - c is the number of GCs participating in the conversion. μ g c is the conversion coefficient between GCs and carbon emission allowances, μ g c = 0.70 [26].

3. IES Low-Carbon Economic Dispatch Model

3.1. Objective Function

The objective function is to minimize the sum of the economic cost and the carbon trading cost.
min F = F c o 2 + F f + F g p + F buy + F cut + F o m F green
In the equation, F represents the total operating cost of the system; F c o 2 represents the CET cost; F f represents the carbon sequestration cost; F g p represents the operating cost of the WTE power plant; F buy represents the total energy purchase cost, including the cost of purchasing electricity from the power grid and gas from the gas grid; F cut represents the cost of curtailed WT and PV; F o m represents the equipment operation and maintenance cost. The detailed expressions for each part are as follows:
(1)
Carbon sequestration cost
F f = t = 1 T ( c f E 2 , storage ( t ) )
In the equation, F f represents the cost of sequestering the unit mass of CO2 [47].
(2)
Operating cost of the WTE power plant
F g p = F gp 1 + F gp 2 F gp , sub F gp 1 = S g p t = 2 T ( u gp ( t ) ( 1 u g p ( t 1 ) ) + u g p ( t 1 ) ( 1 u g p ( t ) ) ) F gp 2 = S t r a t = 1 T R g ( t ) F gp , sub = S sub t = 1 T R g ( t )
In the equation, F gp 1 represents the start–stop cost of the WTE generator set. S g p represents the cost required for a single start–stop, which is CNY 15,000. u gp ( t ) is a 0–1 variable, indicating the operating or stopped state of the unit. F gp 2 represents the transportation cost of waste burned by the WTE generator set. S t r a is the waste transportation cost coefficient, with the unit of CNY/t. R g ( t ) is the amount of waste incinerated. F gp , sub represents the government subsidy revenue for waste treatment. S sub is the waste treatment subsidy coefficient.
(3)
Energy purchase cost
F b u y = F e , grid + F g , grid F e , grid = t = 1 T χ e ( t ) P e , grid ( t ) F g , grid = t = 1 T χ g ( V chp , C H 4 ( t ) + V GB , C H 4 ( t ) V p , C H 4 ( t ) )
In the equation, F e , grid is the cost of purchasing electricity from the power grid. χ e ( t ) is the electricity price of the power grid. P e , grid ( t ) is the power purchase rate. F g , grid is the cost of purchasing gas from the gas grid. χ g is the price per cubic meter of purchased gas. V chp , C H 4 ( t ) , V GB , C H 4 ( t ) , and V p , C H 4 ( t ) are the volumes of natural gas consumed by the GT and GB, and the volume of natural gas produced by P2G, respectively.
(4)
Curtailed WT and PV cost
F c u r = F wcur + F vcur F wcur = t = 1 T ( c wcur P wcur ( t ) ) F vcur = t = 1 T ( c vcur P vcur ( t ) )
In the equation, F wcur represents the cost of curtailed WT. c wcur is the cost coefficient of curtailed WT. P wcur ( t ) is the curtailed WT during the t time period. F vcur represents the cost of curtailed PV. c vcur is the cost coefficient of curtailed PV. P vcur ( t ) is the curtailed PV.
(5)
Equipment operation and maintenance cost
F o m = t = 1 T ( K chp P c h p ( t ) + K g b H G B + K c c s P C C S ( t ) + K e l P EL ( t ) +        K g p P g p ( t ) + K e s , e P ES , e cha ( t ) + K e s , h H ES , h cha ( t ) + K e s , H 2 Q ES , H 2 cha ( t ) )
In the equation, K chp , K g b , K c c s , K e l , K g p , K e s , e , K e s , h , and K e s , H 2 , respectively, represent the operation and maintenance cost coefficients of the CHP unit, GB, CCS, electrolyzer, WTE generator set, EES, HST, and HYS.

3.2. Constraints

  • Power balance constraint
To ensure the supply–demand balance of each load within the system, the power balance constraints are as follows:
P chp ( t ) + P g p ( t ) + P e , grid ( t ) + P w p f ( t ) + P v p f ( t ) + P ES , e d i s ( t ) = P EL ( t ) + P C C S ( t ) + P L ( t ) + P ES , e c h a ( t ) Q CH 4 , chp ( t ) + Q CH 4 , GB ( t ) = Q H 2 G , ou t ( t ) + Q b u y ( t ) H chp ( t ) + H GB ( t ) + H HS , h d i s ( t ) = H L ( t ) + H HS , h c h a ( t ) Q EL , H 2 ( t ) + Q ES , H 2 dis ( t ) = Q H 2 G , in ( t ) + Q ES , H 2 cha ( t )
In the equation, P w p f ( t ) and P v p f ( t ) represent the actual power supply capacities of the WT unit and the PV unit, respectively. H L ( t ) is the thermal demand on the load side.
2.
WT and PV power supply constraints
P w ( t ) = P Wcur ( t ) + P w p f ( t ) P v ( t ) = P v c u r ( t ) + P v p f ( t ) 0 P w p f ( t ) P w ( t ) 0 P v p f ( t ) P v ( t )
3.
CHP unit ramp rate and output constraints
P pH ( t ) = P chp ( t ) + H chp ( t ) P chp min P chp ( t ) P chp max H chp min H chp ( t ) H chp max Δ P PH down P PH ( t ) P PH ( t 1 ) Δ P PH up
In the equation, P pH ( t ) represents the total output of the CHP unit. P chp max and P chp min represent the lower and upper limits of the power generation capacity of the CHP unit, respectively. H chp max and H chp min represent the lower and upper limits of the heat generation capacity of the CHP unit, respectively. Δ P PH up and Δ P PH down represent the lower and upper limits of the ramping rate of the CHP unit, respectively.
4.
GB ramp rate and output constraints
H GB min H GB ( t ) H GB max Δ H GB down H GB ( t ) H GB ( t ) Δ H GB up
In the equation, H GB max and H GB min are the lower and upper limits of the heat output power of the gas boiler, respectively. Δ H GB up and Δ H GB down are the climbing limit and descending limit of the gas boiler’s output, respectively.
5.
WTE generator set constraints
u gp ( t ) P gp min P gp t u gp ( t ) P gp max Δ P gp down P gp ( t ) P gp ( t 1 ) Δ P gp up t = 1 T R g ( t ) R d
In the equation, P gp max and P gp min are the lower and upper limits of the power generation capacity of the WTE generator set, respectively. Δ P gp up and Δ P gp down are the ramping-up limit and ramping-down limit of the WTE generator set’s output, respectively. R d is the daily maximum waste processing capacity of the WTE generator set.
6.
CCS constraints
The operating energy consumption of CCS cannot exceed the maximum operating condition P CCS max .
0 P CCS t P CCS max
Capacity constraints for the liquid storage equipment configured in CCS
V F min V F ( t ) V F max V P min V P ( t ) V P max t = 1 T ( v P , in ( t ) v P , out ( t ) ) = 0 t = 1 T ( v F , in ( t ) v F , out ( t ) ) = 0
In the equation, V F max and V F min are the lower and upper limits of the rich-liquid tank’s capacity, respectively. V P max and V P min are the lower and upper limits of the lean-liquid tank’s capacity, respectively.
7.
Multi-type energy storage constraints
In this IES, similar constraint conditions are adopted for the modeling of electric, heat, and hydrogen energy storage. The energy storage capacity constraints are as follows:
S ES , n ( 0 ) = S ES , n ( 24 ) 0.1 S ES , n max S ES , n ( t ) 0.9 S ES , n max
In the equation, S ES , n ( t ) represents the stored energy of the nth type of energy storage. S ES , n max is the upper limit of the stored energy of the nth type of energy storage.
The charging and discharging constraints for different types of energy storage devices are as follows:
0 P ES , e cha ( t ) U ES , e cha ( t ) P ES , e c h a , max 0 P ES , e dis ( t ) U ES , e dis ( t ) P ES , e d i s , max 0 H ES , h cha ( t ) U ES , h cha ( t ) H ES , h c h a , max 0 H ES , h dis ( t ) U ES , h dis ( t ) H ES , h d i s , max 0 Q ES , H 2 cha ( t ) U ES , H 2 cha ( t ) Q ES , H 2 c h a , max 0 Q ES , H 2 dis ( t ) U ES , H 2 dis ( t ) Q ES , H 2 d i s , max U ES , n cha ( t ) + U ES , n dis ( t ) 1
In the equation, P ES , e c h a , max and P ES , e d i s , max are the maximum charging and discharging powers of the EES, respectively. H ES , h c h a , max and H ES , h d i s , max are the maximum charging and discharging powers of the HST, respectively. Q ES , H 2 c h a , max and Q ES , H 2 d i s , max are the maximum charging and discharging powers of the HYS for hydrogen, respectively. U ES , n cha ( t ) and U ES , n dis ( t ) represent the operating states of the nth type of energy storage device, which are 0–1 variables to mainly restrict the simultaneous charging and discharging of the energy storage device.
8.
P2G energy consumption upper and lower limits constraints
P EL min P EL ( t ) P EL max Δ P EL down P EL ( t ) P EL ( t 1 ) Δ P EL up P MR min P MR ( t ) P MR max Δ P MR down P MR ( t ) P MR ( t 1 ) Δ P MR up
In the equation, P EL max and P EL min are the upper and lower limits of the power consumption of the water electrolysis device, respectively. Δ P EL down and Δ P EL up are the descending limit and climbing limit of the water electrolysis device output, respectively. P MR max and P MR min are the upper and lower limits of the power consumption of the MR, respectively. Δ P MR down and Δ P MR up are the descending limit and climbing limit of the MR output, respectively.

3.3. Model Transformation

The low-carbon economic dispatch model of the IES considering waste incineration and CCS-P2G established in this chapter is a mixed-integer nonlinear model, which contains both continuous variables and integer variables. Therefore, it is necessary to introduce binary variables through the Big-M method to transform this problem into a mixed-integer linear programming problem. Finally, the Yalmip toolbox is used to call the CPLEX commercial solver for the solution. Equation (16) is piece-wise linearized by introducing 0–1 variables. For other nonlinear cases where decision variables are multiplied, the Big-M method is used for linearization. Here, the linearization transformation of Equation (16) is introduced, and the specific process and method are as follows:
First, rewrite Equation (16) into the standard piece-wise function form as follows:
F c o 2 = φ ( 1 + 2 α ) E t r a d e + 3 α φ l , E t r a d e 2 l φ ( 1 + α ) E t r a d e + α φ l , 2 l < E t r a d e l φ E t r a d e , l E t r a d e 0 φ E t r a d e , 0 E t r a d e l φ ( 1 + α ) E t r a d e α φ l , l < E t r a d e 2 l φ ( 1 + 2 α ) E t r a d e 3 α φ l , 2 l < E t r a d e
Introduce binary variables D i (i = 1, 2, 3, 4, 5) and continuous variables E t , i (i = 1, 2, 3, 4, 5) to transform the standard piece-wise form of the reward–punishment ladder-type CET cost function into Equation (40).
F c o 2 = φ ( 1 + 2 α ) E t , 1 + 3 α φ l D 1 + φ ( 1 + α ) E t , 2 + α φ l D 2 φ E t , 3 + + φ E t , 4 + φ ( 1 + α ) E t , 5 α φ l D 5 + φ ( 1 + 2 α ) E t , 6 3 α φ l D 6 E t r a d e = E t , 1 + E t , 2 + E t , 3 + E t , 4 + E t , 5 + E t , 6 D 1 + D 2 + D 3 + D 4 + D 5 + D 6 = 1 M D 1 E t , 1 2 l D 1 2 l D 2 E t , 2 l D 2 l D 3 E t , 3 0 0 E t , 4 l D 4 l D 5 E t , 5 2 l D 5 2 l D 6 E t , 6 M D 6
In the equation, M is a sufficiently large value used to equivalently describe infinity.
The piece-wise effect of the original function is achieved by introducing the 0–1 variable D i . The problem of the interval where the variables of the original function are located is handled by the continuous variable E t , i . The piece-wise segment D i is determined by comparing E t , i with the two endpoints of each interval. And because the two constraints E t r a d e = i = 1 5 E t , i and 1 = i = 1 5 D i limit the uniqueness of the interval and the decision variable, the function value is finally solved.

4. Case Analysis

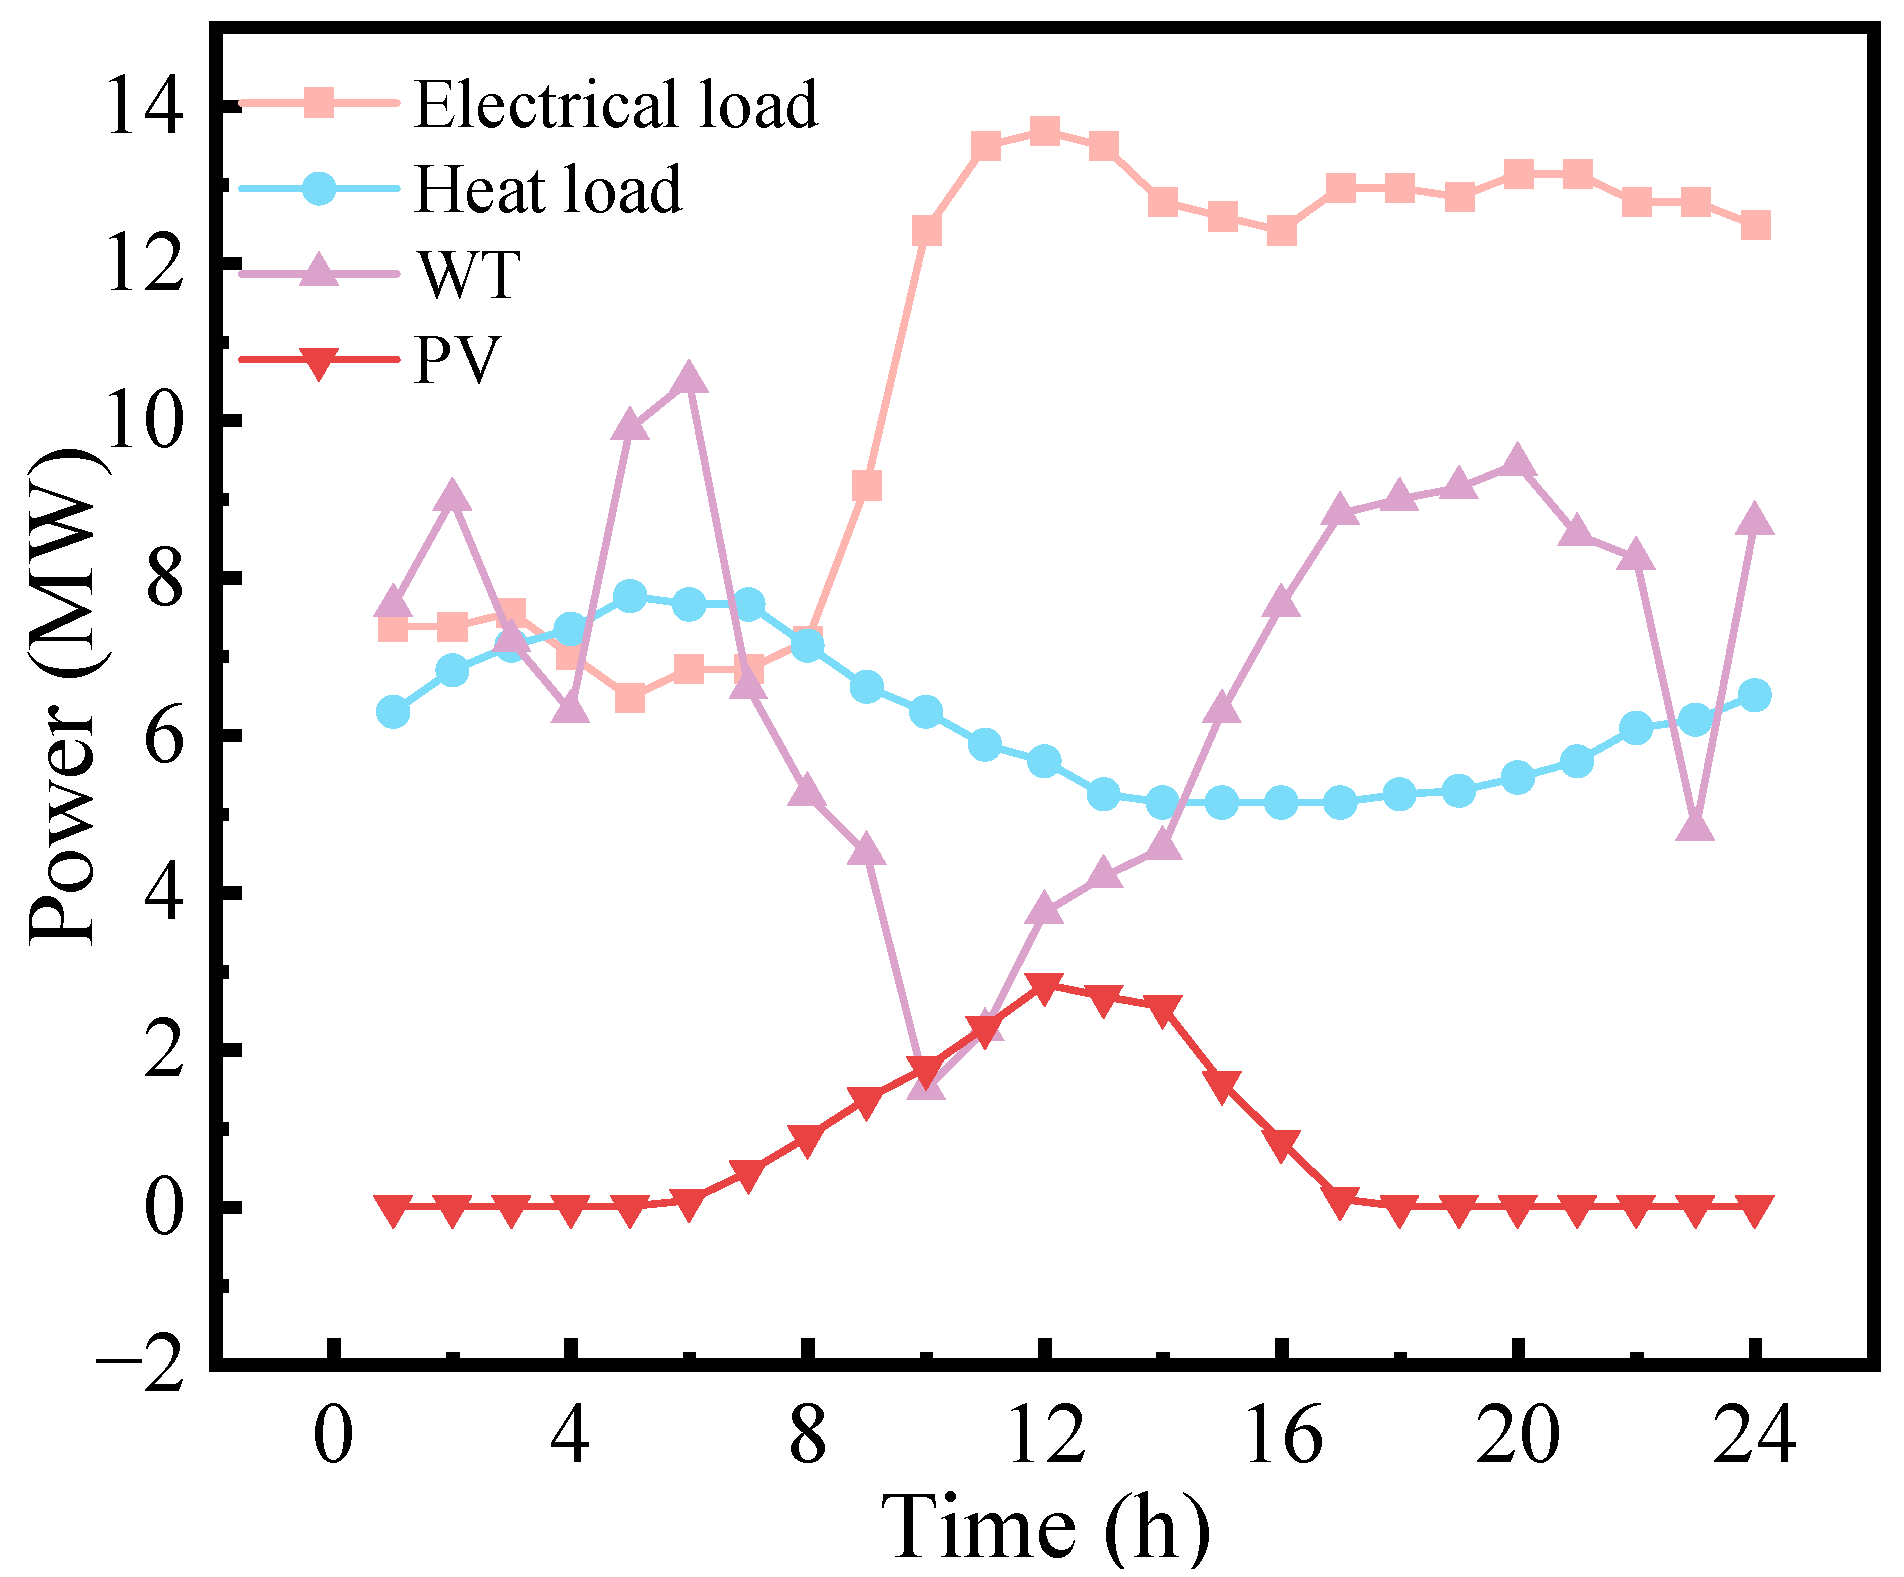
4.1. Case Conditions

Based on the actual operation data of multiple energy sources and waste treatment data of a traditional city in Northeast China, the output of renewable energy and the load curve are shown in Figure 4. In this study, 12 WT with a capacity of 1 MW each are used, and the installed capacity of PV is 3 MW. The solar panels are installed on the rooftops of houses and in large-scale open areas. The rated power generation capacity of the WTE power plant is 6 MW. The equipment and operation parameters of this IES are shown in Table 1, and the energy purchase prices are shown in Table 2.

4.2. Analysis of the Optimal Scheduling Results for Typical Daily Scenarios

To verify the economic efficiency and low-carbon characteristics of the proposed method, six cases are set up for research based on different operating mechanisms of the IES in typical daily scenarios. The settings of different case studies are shown in Table 3.
Case 1: CCS and P2G are not considered in the scheduling.
Case 2: CCS is not considered in the scheduling. The emitted CO2 is directly discharged into the atmosphere. The CO2 for methanation in P2G is purchased externally, and the price of externally purchased CO2 is 2.6 CNY/m3.
Case 3: The coordinated participation of CCS-P2G in the scheduling is considered, and the HYS is not considered. That is, hydrogen production from the water electrolyzer and hydrogen-consuming methanation are synchronous.
Case 4: The flexible operation of CCS-P2G participating in the scheduling is considered. That is, the HYS is considered to decouple the two stages of P2G.
Case 5: The flexible operation of CCS-P2G, ladder-type GCT, and ladder-type CET are considered in the scheduling. That is, a HYS is considered to achieve two-stage decoupling of P2G.
Case 6: The flexible operation of CCS-P2G and the ladder-type “green-carbon” offset mechanism are considered in the scheduling. That is, a HYS is considered to achieve two-stage decoupling of P2G.

4.3. Economic Benefit Analysis of IES

The proportion of different costs under six different cases is shown in Figure 5. The final results of various costs, carbon emissions, and the consumption rate of WT and PV are shown in Table 4.
It can be seen from Figure 5 that in the operation cost of the IES, F buy accounts for the largest proportion, with an average cost proportion of 70.6%. Secondly, it is F g p , accounting for 13.483%, and the proportion is relatively stable in different cases. The proportions of F cut and F co 2 vary greatly among different cases. Since the GCT technology is not considered, the GC revenues of Cases 1−4 are all zero, while the proportions of GC revenues in Cases 5−6 are 4.1% and 4.5%, respectively. In addition, in Case 6, more carbon emission allowances are exchanged through the “green-carbon” offset mechanism to reduce the carbon emission cost and achieve substantial profits. Therefore, the total cost of Case 6 is the lowest. The average cost proportion of F o m is 5.21%.
It can be seen from Figure 5 and Table 4 that, compared with Case 1, Case 2 has the same carbon emissions because neither of them has CCS. The proportion of F cut in Case 1 is much higher than that of F cut in Cases 2−6. The reason is that, based on the consideration of the P2G technology, Case 2 completes the methanation gas production by purchasing CO2 externally. It consumes more WT and PV power to supply energy for the water electrolysis equipment. The consumption rate of WT and PV power has increased by 17.94% compared with that in Case 1. Moreover, the produced methane has also reduced the energy purchase cost of the IES. The energy purchase cost has decreased by CNY 5262.5592. However, the cost of externally purchased CO2 is also quite high. Additionally, the P2G devices put into operation more incur more operation and maintenance costs. As a result, the total daily operation cost has only decreased by CNY 20,396.43 compared with that in Case 1. From this, it can be seen that the P2G device has a better promoting effect on improving the utilization rate of renewable energy in the system than on enhancing the economic benefits of the IES.
Case 3 adopts CCS-P2G collaborative scheduling. Compared with Case 2 and Case 1, the inclusion of CCS in scheduling significantly reduces the CET cost. Moreover, due to the adoption of a ladder-type CET mechanism with rewards and penalties, the operation of CCS may cause carbon emissions to be lower than the carbon quota in some periods. Therefore, the excess carbon emission allowances can be sold to obtain benefits, making the daily CET cost lower or even more profitable. The result of the collaborative scheduling of CCS and P2G is that, compared with Case 1, carbon emissions are reduced by 16,764.3048 kg, the CET cost is reduced by CNY 5770.9326, and the WT and PV consumption rate is increased by 18.26%. It can be seen from Figure 5 and Figure 6 that among the six Cases, Case 1, which does not consider P2G and CCS, has the lowest WT and PV power output, and its WT and PV curtailment cost accounts for the highest proportion. The WT and PV power output of Case 3, which considers the collaboration of CCS and P2G, is slightly higher than that of Case 2, which only considers P2G. The highest output occurs in Cases 4−6, which consider the decoupled two-stage P2G with HYS. However, the total operation cost of Case 3, which has no carbon purchase cost, is still reduced by CNY 6382.439 compared with Case 2, representing a savings of 4.59%.
Case 4 has a carbon emission reduction of 2098.071 kg and CET cost reduction of CNY 360.3411 compared with Case 3. It can be seen from Figure 7 that under the ladder-type CET mechanism with rewards and penalties, the carbon trading intervals in each period where the carbon trading volume is located have the greatest impact on CET costs. Due to the consideration of HYS to decouple the two-stage P2G in Case 4, the reverse peak-shaving characteristics of WT appear in the 0−7 o’clock period at night. When a large amount of WT exceeding the load is generated, it is preferentially absorbed to supply the energy consumption of the CCS. Then, the P2G device is considered for absorption, directly absorbing most of the curtailed WT at night. This thereby reduces the WT and PV curtailment cost by CNY 2780.203.
It can be more clearly seen from Figure 8 regarding the operating status of the CCS in Case 4 and Case 3. The CCS in Case 4 is mainly in the capture and absorption state during the 0−7 o’clock period. Moreover, the carbon capture device with rich- and lean-liquid storage tanks exhibits energy time-shifting characteristics, enabling more curtailment WT to be consumed for CCS at night. However, since Case 3 does not consider the HYS, more curtailment WT is consumed for water electrolyzer at night. Then, it produces methane with the CO2 captured and absorbed at 0 o’clock, which is used for heat and power generation by GT and GB.
Case 5 introduces GCT, allowing the sale of excess GCs to obtain profits. Since other costs remain the same, the total cost is reduced by CNY 6598.6314 compared with Case 4. Although the GCT and CET mechanisms are simply introduced, there is a lack of interaction between them. This means that the revenue obtained by the system from participating in the GCT market is insufficient to offset the costs paid for participating in the CET market. This indicates that without an interaction mechanism, the economic benefits of the system are not fully optimized. Case 6 introduces combined ladder-type GCT and ladder-type CET, which reduces the carbon trading volume by 64.589%. After the introduction of the “green-carbon” offset mechanism in Case 6, its carbon emissions decreased significantly because the excess TGCs were converted into carbon allowances, resulting in a substantial reduction in the carbon emissions of Case 6 compared to Case 5. As shown in Table 4, when the carbon trading volume of each device’s emissions is less than its rated quota, revenue can be obtained by selling carbon trading quotas. Therefore, its CET revenue is CNY 13,750. Since the WT consumption rate in Cases 5 and 6 is already relatively high, it is difficult to significantly improve it. However, due to the introduction of GCT, the proportion of WT and PV curtailment costs relative to the total cost continues to decrease in Cases 5 and 6. Case 5 only provides relatively large help for improving economic benefits, while Case 6 brings substantial improvements in both economic and environmental benefits. In general, IES can generate income by selling excess GCs and use these revenues to purchase or offset the required carbon emission quotas. Thereby, it achieves effective cost control while meeting environmental compliance requirements.

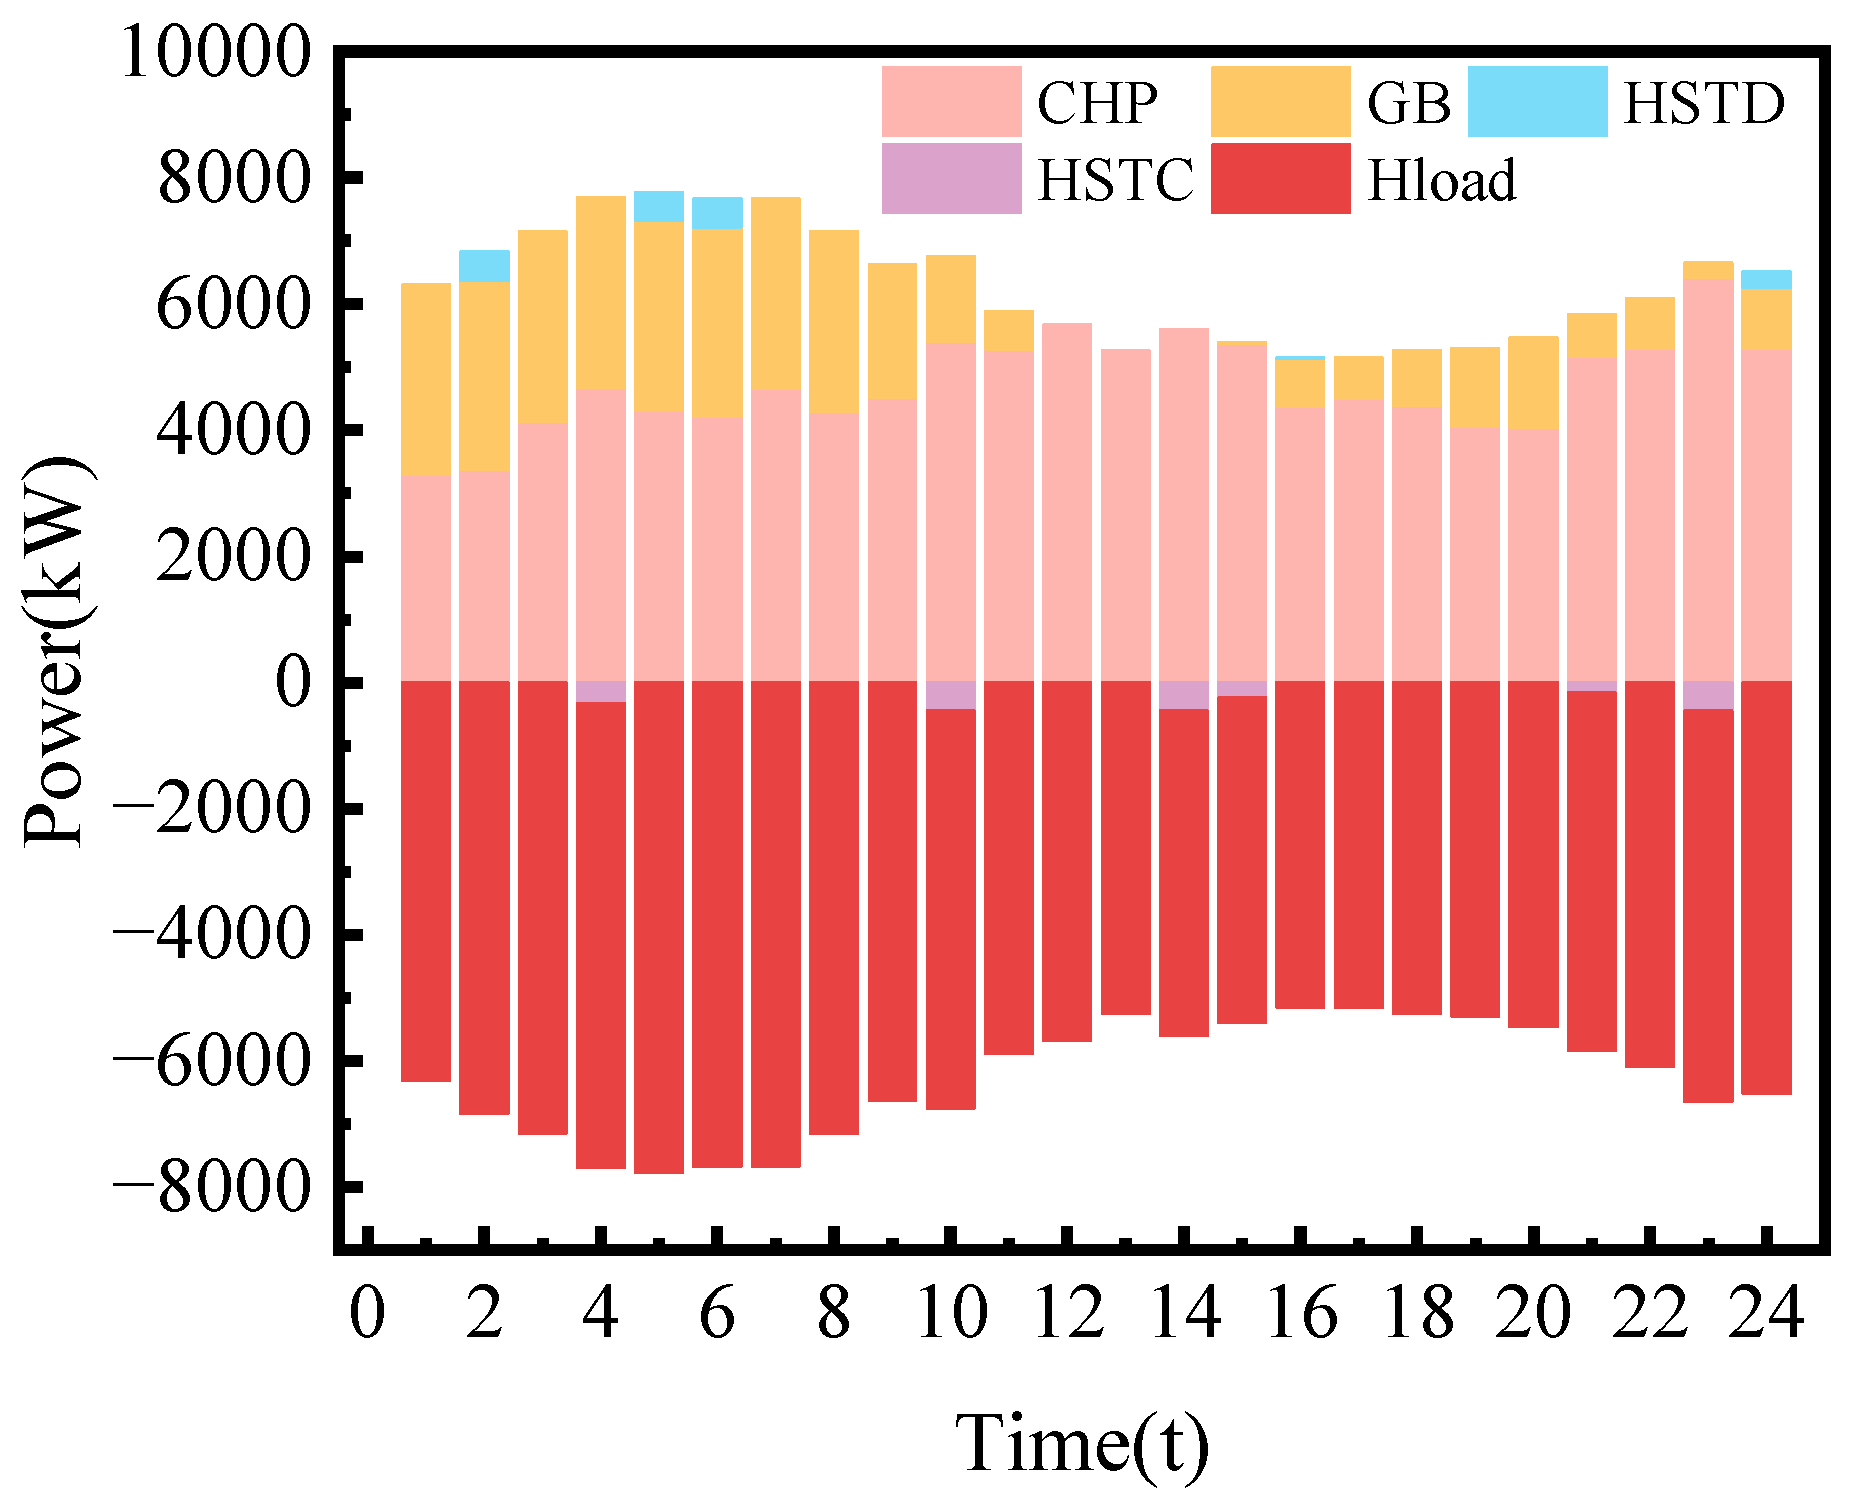
4.4. Analysis of IES Scheduling Results

It can be seen from Figure 9 that electricity is mainly supplied by PV, WT, EM, and CHP systems. The EES discharges during peak load periods and charges during valley periods, playing a role in energy supplementation. It can be seen from Figure 10 that the hydrogen energy supply is mainly provided by P2G. Therefore, the main power consumption is from P2G, and the operation of CCS only consumes a small amount of electricity. Specifically, during the power valley period from 23:00 to 6:00, the electricity price is also at a valley level. The electricity load is mainly supplied by WT, and the insufficient part is supplemented by CHP and EM. Meanwhile, due to low-power-generation pressure, excess electricity is transferred to the EES. During the flat period, power demand gradually rises. WT and PV power generation is fully absorbed, CHP power generation increases, and the insufficient energy supply is supplemented by EM.
At night, WT in traditional regional IES may encounter peak output periods, usually when the ambient temperature is low. Due to the “power determined by heat” operation constraint of CHP units, both their electricity and heat outputs are relatively high, while the electricity load demand is relatively low. This limits the consumption capacity of WT and PV, leading to WT and PV curtailment. However, according to the data in Figure 9, during the early morning 0−8 h and late night 23−24 h, when the electricity load demand is small (in flat or valley periods), the total output of WT and PV units is large. With the combined operation of all power generation units, after adding CCS and P2G in Case 3, the system’s electricity production not only meets the basic electricity load demand but also uses the remaining WT and PV for P2G and CCS at night, significantly increasing the consumption of WT and PV. In addition, in Figure 11, the methane synthesized by P2G technology in Case 3 provides energy for CHP and GB. This not only reduces the system’s demand for purchased gas but also improves the economic operation efficiency of the system.
In the IES optimal scheduling diagrams shown in Figure 9 and Figure 11, it can be observed that the gas consumption of CHP is higher during the day than at night, especially from 10 to 15 noon. During this period, the electricity load is large, while the output limits of WTE and PV units are insufficient, and WT exhibits reverse peak-shaving characteristics with the lowest output of the day. To meet the electricity load demand, CHP increases its output. Meanwhile, as shown in Figure 12, due to the “power determined by heat” nature of CHP units composed of GT and WHB, their heat output increases simultaneously with increased power generation. Even though their heating efficiency is lower than that of GB, they still bear more heat power demand, which is why GB stopped operating during this period. The volume of methane synthesized in the P2G process changes with the output of WT/PV and the operation status of CCS. In Figure 10, which shows the hydrogen storage and release status of the HYS, the synthesis and use of hydrogen are mainly concentrated during 0−8 h at night. Due to the time-shifting characteristics of the HYS, the water electrolyzer hydrogen production device operates at full power when WT is excessive at night, fully consuming excess WT and providing MR with natural gas to meet the energy consumption of CHP and GB for large thermal loads at night. In contrast, since Case 1 does not introduce P2G technology, most of its nighttime WT is wasted, leading to significant WT curtailment costs.

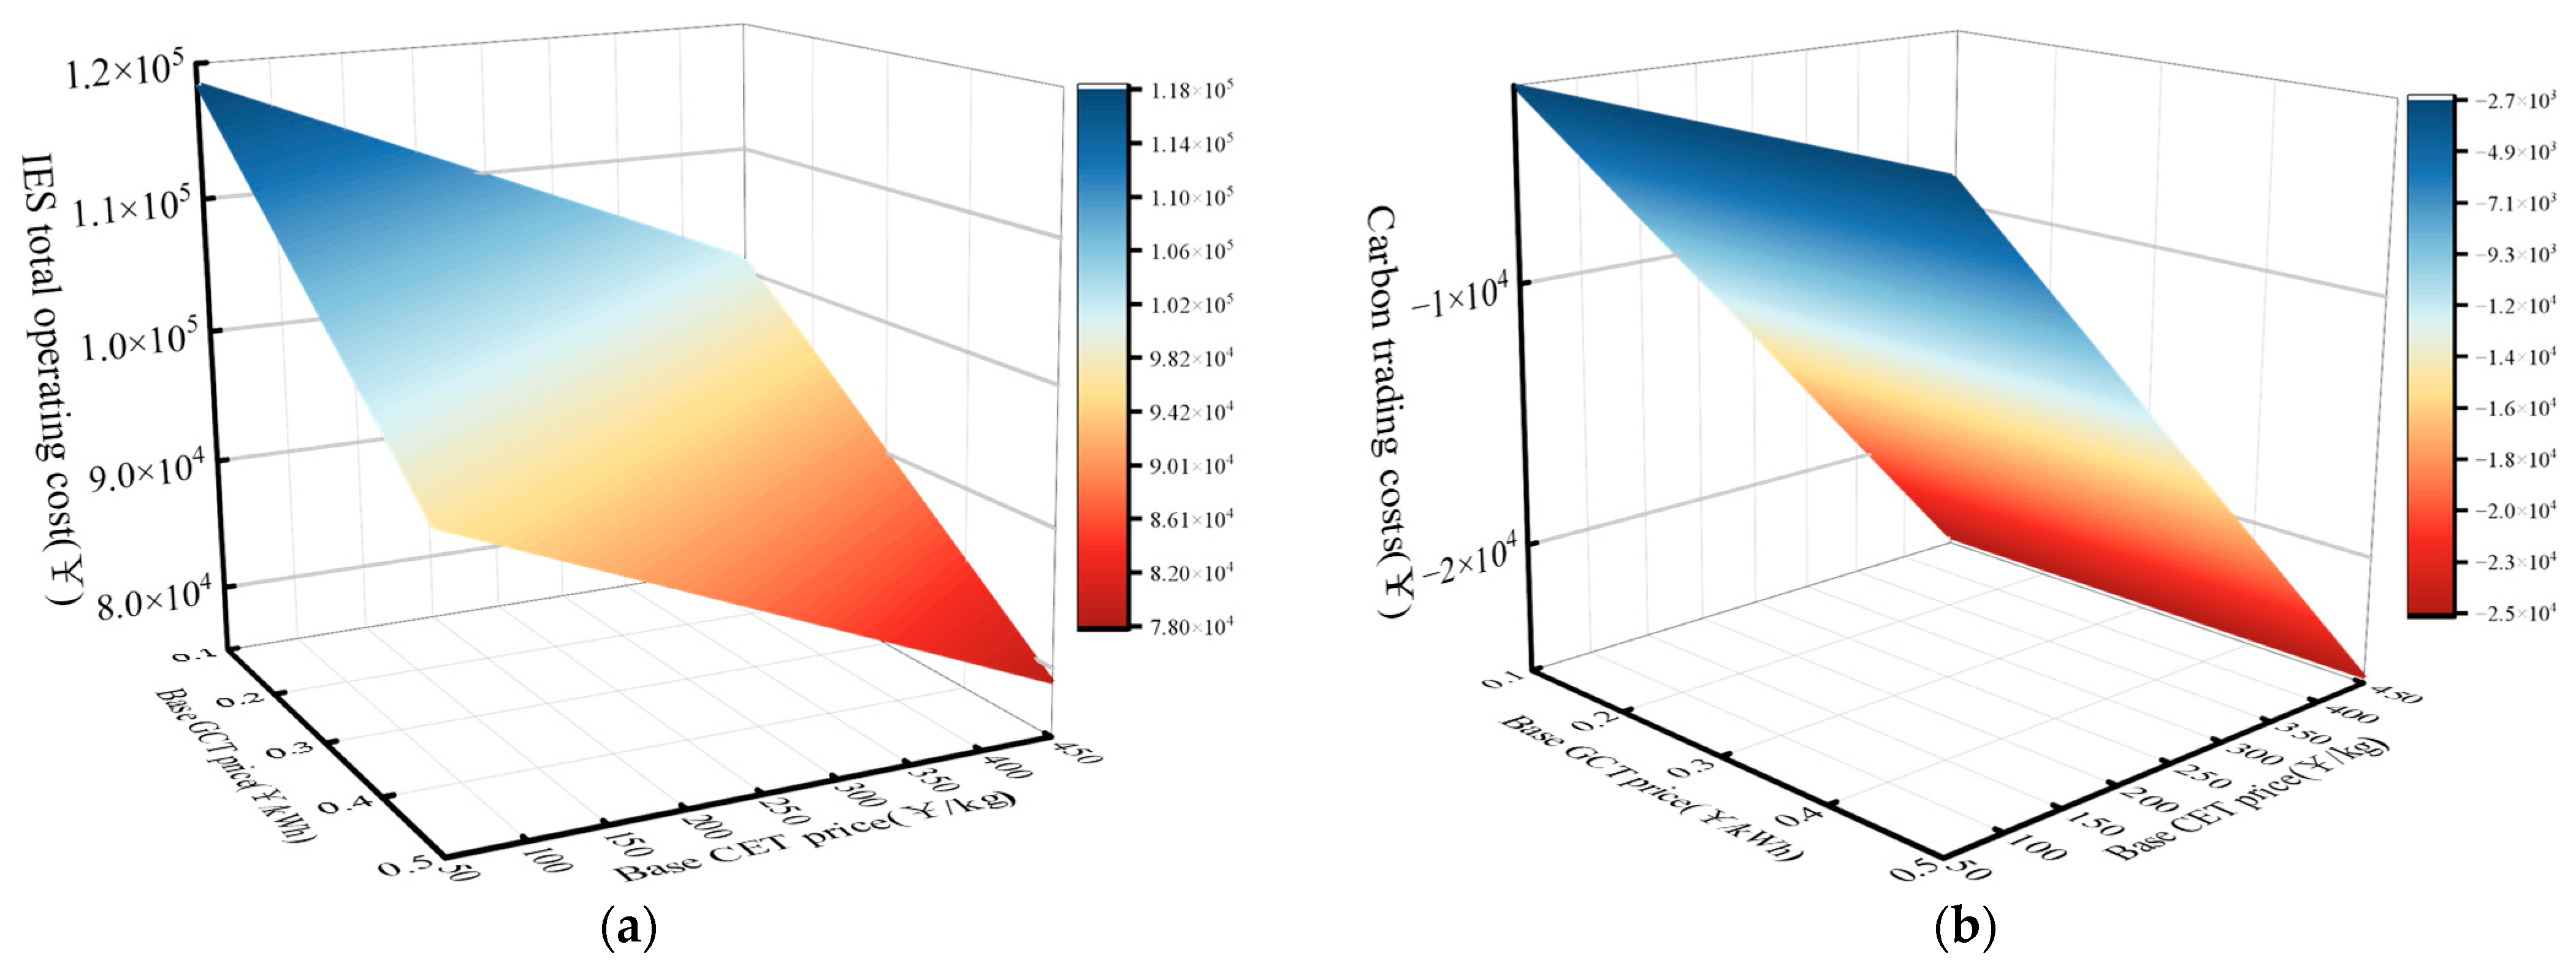
4.5. Sensitivity Analysis of the ”Green-Carbon” Offset Mechanism

Taking Case 6 as an example, this section explores the impacts of various CET and GCT prices on the “green-carbon” offset mechanism. Figure 13a shows the total cost of the IES under different basic CET and GCT prices. Figure 13b shows the carbon trading costs under different basic CET and GCT prices. It can be seen from Figure 13a that as the basic GCT price increases from 0.1 (CNY/kWh) to 0.5 (CNY/kWh) in increments of 0.1 (CNY/kWh), the total system cost decreases. This is because GCs, as an important means for the system to meet renewable energy quota requirements, have a significant impact on the overall revenue of the system. However, as the CET price gradually increases from 50 (CNY/kg) to 450 (CNY/kg), the total IES cost shows an unusual decreasing trend instead of the expected increase. Generally, higher CET prices should lead to higher CET costs, but the IES exhibits a downward trend. Figure 13b reveals that since the CO2 emissions of the system itself are less than the specified carbon quota, excess carbon quotas are sold for profits according to the principle of the reward-based ladder-type CET mechanism. Therefore, as the basic CET price increases, the total system cost continues to decrease. Meanwhile, it can be observed that an increase in the GCT price has almost no impact on system carbon emissions. This is because, in most IES systems, GCT reduces carbon emissions by increasing the proportion of new energy sources such as PV and WT in system electricity consumption. The model in this paper achieves full absorption of WT and PV through devices such as CCS-P2G and EES, which echoes the consistent curtailment costs and consumption rates of WT and PV in Cases 5, 6, and 4 mentioned earlier. Therefore, for the system proposed in this paper, changes in the GCT price do not affect the consumption rates of WT and PV, so there is no obvious change in the system’s carbon emissions.

5. Conclusions

This study mainly discusses the carbon emission issues and optimal operation cost of IES-WTE with CCS-P2G under the “green-carbon” offset mechanism. First, based on the coupling relationship among electricity, carbon, and gas, a flexible operation mode for CCS-P2G is proposed. Decoupling the two-stage P2G through hydrogen storage, it solves the problem of asynchronous operation times between CCS and P2G. Meanwhile, the system adopts a reward–penalty ladder-type CET and ladder-type GCT to further promote low-carbon economic operation. Finally, a “green-carbon” offset mechanism is constructed to effectively achieve high-efficiency interaction between the CET market and the GCT market. The following conclusions are obtained through simulation analysis:
(1)
Compared with considering P2G alone or CCS-P2G collaborative operation, the flexible operation mode with decoupled two-stage P2G achieves the highest consumption of WT and PV—the consumption rate of wind and solar energy is 97.25%; the lowest system operation cost—the total cost is CNY 127,987.9559; and the lowest carbon emission level—the carbon emissions are 73,446.2553 kg.
(2)
The sensitivity analysis of the reward–penalty ladder-type CET further indicates that under the flexible operation mode of CCS and P2G, WT and PV consumption is maximized, and hydrogen storage plays a significant role in consuming renewable energy.
(3)
After introducing the ladder-type GCT, the system cost is further reduced. However, since the WT and PV rates have reached a relatively high value, the promotion effect on renewable energy is not obvious.
(4)
With the introduction of the GCT offset mechanism, both the system cost and carbon emissions are significantly reduced. Specifically, compared with Case 5 without the introduction of the offset mechanism, the total cost of Case 6 with the introduction of the offset mechanism decreased by approximately 12.71%, and the carbon emissions were reduced by approximately 64.59%. Meanwhile, profits are successfully achieved by selling carbon emission allowances.

6. Discussion

Although this paper has studied the operation of CCS-P2G and the ladder-type CET-GCT offset mechanism in the context of WTE-IES, and analyzed the optimal scheduling of the IES, there are still many areas that require further investigation and exploration.
(1)
The optimal scheduling model of WTE-IES, which combines CCS-P2G with the ladder-type CET-GCT constructed in this paper, does not take into account the thermal and gas inertia during the optimal scheduling of the IES. In the next step, the impact of thermal and gas inertia on the optimal scheduling of the IES will be investigated.
(2)
The model constructed in this paper assumes that the CO2 emission coefficient; the dynamic energy consumption of CCS; the cost of sequestering a unit mass of CO2; the efficiencies of the electrolyzer, methanation, etc. are fixed; and the liquid storage equipment follows a linear model. However, in actual industrial production, these factors may vary. Therefore, we will discuss them in future research.
(3)
The research did not take into account the uncertainties of the load, as well as the WT and PV. Therefore, in subsequent research, uncertain prediction methods such as robustness will be attempted to be incorporated.

Author Contributions

Conceptualization, X.H. and M.X.; methodology, X.H.; software, X.H.; validation, X.H., J.Z. and B.Z.; formal analysis, X.H. and Y.Z.; investigation, X.H. and H.Z.; resources, X.H.; data curation, X.H.; writing—original draft preparation, X.H.; writing—review and editing, X.H.; visualization, J.Z.; supervision, J.Z.; project administration, J.Z.; funding acquisition, X.H. and J.Z. All authors have read and agreed to the published version of the manuscript.

Funding

This research was funded by the Natural Science Foundation of Hunan Province of China (2025JJ60372); the Open Research Fund of Key Laboratory of Modern Power System Simulation and Control & Renewable Energy Technology, Ministry of Education (Northeast Electric Power University) (MPSS2025-08); and the Open Research Fund of Science and Technology Innovation Platform of 2024Kfjj01, Changsha University of Science & Technology.

Institutional Review Board Statement

Not applicable.

Informed Consent Statement

Not applicable.

Data Availability Statement

The original contributions presented in the study are included in the article. Further inquiries can be directed to the corresponding author.

Conflicts of Interest

The authors declare no conflicts of interest.

References

  1. Zhao, X.; Jiang, G.; Li, A.; Wang, L. Economic Analysis of Waste-to-Energy Industry in China. Waste Manag. 2016, 48, 604–618. [Google Scholar] [CrossRef] [PubMed]
  2. Sajid Khan, M.; Huan, Q.; Lin, J.; Zheng, R.; Gao, Z.; Yan, M. Exergoeconomic Analysis and Optimization of an Innovative Municipal Solid Waste to Energy Plant Integrated with Solar Thermal System. Energy Convers. Manag. 2022, 258, 115506. [Google Scholar] [CrossRef]
  3. Khan, M.S.; Huan, Q.; Yan, M.; Ali, M.; Noor, O.U.; Abid, M. A Novel Configuration of Solar Integrated Waste-to-Energy Incineration Plant for Multi-Generational Purpose: An Effort for Achieving Maximum Performance. Renew. Energy 2022, 194, 604–620. [Google Scholar] [CrossRef]
  4. Chen, H.; Zhang, M.; Xue, K.; Xu, G.; Yang, Y.; Wang, Z.; Liu, W.; Liu, T. An Innovative Waste-to-Energy System Integrated with a Coal-Fired Power Plant. Energy 2020, 194, 116893. [Google Scholar] [CrossRef]
  5. Pan, P.; Zhang, M.; Xu, G.; Chen, H.; Song, X.; Liu, T. Thermodynamic and Economic Analyses of a New Waste-to-Energy System Incorporated with a Biomass-Fired Power Plant. Energies 2020, 13, 4345. [Google Scholar] [CrossRef]
  6. Pan, M.; Chen, X.; Li, X. Multi-Objective Analysis and Optimization of Cascade Supercritical CO2 Cycle and Organic Rankine Cycle Systems for Waste-to-Energy Power Plant. Appl. Therm. Eng. 2022, 214, 118882. [Google Scholar] [CrossRef]
  7. Chen, S.C.; Dang, X.; Xu, Q.; Own, C.-M. Transforming Waste into Value: Sustainable Recycling of Agricultural Resources Under the ‘Carbon Peak and Carbon Neutrality’ Vision. Sustainability 2025, 17, 55. [Google Scholar] [CrossRef]
  8. Armoo, E.A.; Narra, S.; Mohammed, M.; Boahemaa, B.; Beguedou, E.; Kemausuor, F.; Agyenim, F.B. Hybrid Waste-to-Energy Solutions within a Circular Economy Framework Directed towards Sustainable Urban Waste Management in Ghana. Sustainability 2024, 16, 4976. [Google Scholar] [CrossRef]
  9. Roa, I.D.; Henriquez, J.R.; Dutra, E.D.; Menezes, R.S.C.; Andrade, M.M.M.; Santos Junior, E.P.; Rocha, L.C.S.; Rotella Junior, P. Economic Feasibility of Biogas Microgeneration from Food Waste: Potential for Sustainable Energy in Northeastern Brazil. Sustainability 2024, 16, 10238. [Google Scholar] [CrossRef]
  10. Ćurčić, S.; Milićević, D.; Kilibarda, N.; Peulić, A. Assessing Biogas Production Potential from Organic Waste and Livestock Byproducts in a Serbian Municipality: Implications for Sustainable Food Systems. Sustainability 2025, 17, 3144. [Google Scholar] [CrossRef]
  11. Wijesekara, D.; Amarasinghe, P.; Induranga, A.; Vithanage, V.; Koswattage, K.R. Energy, Exergy, and Environmental Impact Analysis and Optimization of Coal–Biomass Combustion Combined Cycle CHP Systems. Sustainability 2025, 17, 2363. [Google Scholar] [CrossRef]
  12. Li, X.; Zhang, R.; Bai, L.; Li, G.; Jiang, T.; Chen, H. Stochastic Low-Carbon Scheduling with Carbon Capture Power Plants and Coupon-Based Demand Response. Appl. Energy 2018, 210, 1219–1228. [Google Scholar] [CrossRef]
  13. Lei, D.; Zhang, Z.; Wang, Z.; Zhang, L.; Liao, W. Long-Term, Multi-Stage Low-Carbon Planning Model of Electricity-Gas-Heat Integrated Energy System Considering Ladder-Type Carbon Trading Mechanism and CCS. Energy 2023, 280, 128113. [Google Scholar] [CrossRef]
  14. Ding, X.; Yang, Z.; Zheng, X.; Zhang, H.; Sun, W. Effect of Decision-Making Principle on P2G–CCS–CHP Complementary Energy System Based on IGDT Considering Energy Uncertainty. Int. J. Hydrogen Energy 2024, 81, 986–1002. [Google Scholar] [CrossRef]
  15. Zhang, Y.; Sun, P.; Ji, X.; Yang, M.; Ye, P. Low-Carbon Economic Dispatch of Integrated Energy Systems Considering Full-Process Carbon Emission Tracking and Low Carbon Demand Response. IEEE Trans. Netw. Sci. Eng. 2024, 11, 5417–5431. [Google Scholar] [CrossRef]
  16. Ma, Y.; Wang, H.; Hong, F.; Yang, J.; Chen, Z.; Cui, H.; Feng, J. Modeling and Optimization of Combined Heat and Power with Power-to-Gas and Carbon Capture System in Integrated Energy System. Energy 2021, 236, 121392. [Google Scholar] [CrossRef]
  17. Li, J.; Ai, Q.; Chen, M. Strategic Behavior Modeling and Energy Management for Electric-Thermal-Carbon-Natural Gas Integrated Energy System Considering Ancillary Service. Energy 2023, 278, 127745. [Google Scholar] [CrossRef]
  18. Wang, L.; Luo, L.; Yu, M.; Pei, X. Low-Carbon Integrated Energy System Scheduling Considering Electric Vehicle Demand Response. J. Clean. Prod. 2024, 480, 144073. [Google Scholar] [CrossRef]
  19. Wang, L.; Ren, X.; Ma, Y.; Liu, Z.; Dong, W.; Ni, L. Optimal Low-Carbon Scheduling of Integrated Energy Systems Considering Stepped Carbon Trading and Source-Load Side Resources. Energy Rep. 2024, 12, 3145–3154. [Google Scholar] [CrossRef]
  20. Huang, Q.; Song, Y.; Sun, Q.; Ren, X.; Wang, W. Integrating Compressed CO2 Energy Storage in an Integrated Energy System. Energies 2024, 17, 1570. [Google Scholar] [CrossRef]
  21. Mochi, P. Perspective on Challenges and Opportunities in Integrated Electricity-Hydrogen Market. Energy Sustain. Dev. 2025, 87, 101728. [Google Scholar] [CrossRef]
  22. Su, Y.; Tan, M.; Teh, J. Short-Term Transmission Capacity Prediction of Hybrid Renewable Energy Systems Considering Dynamic Line Rating Based on Data-Driven Model. IEEE Trans. Ind. Appl. 2025, 61, 2410–2420. [Google Scholar] [CrossRef]
  23. Zhang, S.; Pan, G.; Li, B.; Gu, W.; Fu, J.; Sun, Y. Multi-Timescale Security Evaluation and Regulation of Integrated Electricity and Heating System. IEEE Trans. Smart Grid 2025, 16, 1088–1099. [Google Scholar] [CrossRef]
  24. Wang, Z.; Wu, J.; Kou, Y.; Zhang, M.; Jiang, H. Collaborative Optimization Scheduling of Source-Network-Load-Storage System Based on Ladder-Type Green Certificate–Carbon Joint Trading Mechanism and Integrated Demand Response. Sustainability 2024, 16, 10104. [Google Scholar] [CrossRef]
  25. Fan, M.; Liu, L. Portfolio of China’s Renewable Energy Legal Measures: Conflicts in Application and Functional Harmonization. Energy 2025, 320, 135377. [Google Scholar] [CrossRef]
  26. Hou, H.; Ge, X.; Yan, Y.; Lu, Y.; Zhang, J.; Dong, Z.Y. An Integrated Energy System “Green-Carbon” Offset Mechanism and Optimization Method with Stackelberg Game. Energy 2024, 294, 130617. [Google Scholar] [CrossRef]
  27. Liu, D.; Luo, Z.; Qin, J.; Wang, H.; Wang, G.; Li, Z.; Zhao, W.; Shen, X. Low-Carbon Dispatch of Multi-District Integrated Energy Systems Considering Carbon Emission Trading and Green Certificate Trading. Renew. Energy 2023, 218, 119312. [Google Scholar] [CrossRef]
  28. Yan, Q.; Ai, X.; Li, J. Low-Carbon Economic Dispatch Based on a CCPP-P2G Virtual Power Plant Considering Carbon Trading and Green Certificates. Sustainability 2021, 13, 12423. [Google Scholar] [CrossRef]
  29. Yang, S.; Tan, Z.; Lin, H.; Li, P.; De, G.; Zhou, F.; Ju, L. A Two-Stage Optimization Model for Park Integrated Energy System Operation and Benefit Allocation Considering the Effect of Time-Of-Use Energy Price. Energy 2020, 195, 117013. [Google Scholar] [CrossRef]
  30. Tan, J.; Pan, W.; Li, Y.; Hu, H.; Zhang, C. Energy-Sharing Operation Strategy of Multi-District Integrated Energy Systems Considering Carbon and Renewable Energy Certificate Trading. Appl. Energy 2023, 339, 120835. [Google Scholar] [CrossRef]
  31. Zhang, Y.; Wu, Q.; Ren, H.; Li, Q.; Zhou, W. Optimal Operation of Multi-Microgrid Systems Considering Multi-Level Energy-Certificate-Carbon Coupling Trading. Renew. Energy 2024, 227, 120505. [Google Scholar] [CrossRef]
  32. Zhang, L.; Liu, D.; Cai, G.; Lyu, L.; Koh, L.H.; Wang, T. An Optimal Dispatch Model for Virtual Power Plant That Incorporates Carbon Trading and Green Certificate Trading. Int. J. Electr. Power Energy Syst. 2023, 144, 108558. [Google Scholar] [CrossRef]
  33. Wang, Y.; Wu, X.; Liu, M.; Zhang, C.; Wang, H.; Yue, Y.; Luo, X. Bidding Strategy of the Virtual Power Plant Considering Green Certificates and Carbon Trading. Energy Rep. 2023, 9, 73–84. [Google Scholar] [CrossRef]
  34. Guo, Z.; Zhou, S. Modeling and Multi-Stage Planning of Cement-IIES Considering Carbon-Green Certificate Trading. Processes 2023, 11, 1219. [Google Scholar] [CrossRef]
  35. He, L.; Lu, Z.; Zhang, J.; Geng, L.; Zhao, H.; Li, X. Low-Carbon Economic Dispatch for Electricity and Natural Gas Systems Considering Carbon Capture Systems and Power-to-Gas. Appl. Energy 2018, 224, 357–370. [Google Scholar] [CrossRef]
  36. Chen, Q.; Kang, C.; Xia, Q. Modeling Flexible Operation Mechanism of CO2 Capture Power Plant and Its Effects on Power-System Operation. IEEE Trans. Energy Convers. 2010, 25, 853–861. [Google Scholar] [CrossRef]
  37. Cui, Y.; Xu, Y.; Huang, T.; Wang, Y.; Cheng, D.; Zhao, Y. Low-Carbon Economic Dispatch of Integrated Energy Systems That Incorporate CCPP-P2G and PDR Considering Dynamic Carbon Trading Price. J. Clean. Prod. 2023, 423, 138812. [Google Scholar] [CrossRef]
  38. Haslbeck, J.L.; Kuehn, N.J.; Lewis, E.G.; Pinkerton, L.L.; Simpson, J.; Turner, M.J.; Varghese, E.; Woods, M.C. Cost and Performance Baseline for Fossil Energy Plants. In Bituminous coal and Natural Gas to Electricity; US Department of Energy: Washington, DC, USA, 2010; Volume 1. [Google Scholar]
  39. Huang, Y.; Liu, W.; Zhang, X.J.; Wang, T.; Fang, M.X.; Gonzalez-Diaz, A.; Jiang, L. Flexibility Analysis on Absorption-Based Carbon Capture Integrated with Energy Storage. Fuel 2024, 372, 132279. [Google Scholar] [CrossRef]
  40. Baudoux, A.; Demeyer, F.; Paepe, W.D. Advanced Configurations of Amine Based Post-Combustion Carbon Capture Process Applied to Combined Cycle Gas Turbine. Energy Convers. Manag. X 2024, 22, 100537. [Google Scholar] [CrossRef]
  41. Chen, D.; Liu, F.; Liu, S. Optimization of Virtual Power Plant Scheduling Coupling with P2G-CCS and Doped with Gas Hydrogen Based on Stepped Carbon Trading. dwjs 2022, 46, 2042–2053. [Google Scholar]
  42. Liu, Y.; Zeng, L.; Zeng, J.; Yang, Z.; Li, N.; Li, Y. Scheduling Optimization of IEHS with Uncertainty of Wind Power and Operation Mode of CCP. Energies 2023, 16, 2157. [Google Scholar] [CrossRef]
  43. Wang, R.; Wen, X.; Wang, X.; Fu, Y.; Zhang, Y. Low Carbon Optimal Operation of Integrated Energy System Based on Carbon Capture Technology, LCA Carbon Emissions and Ladder-Type Carbon Trading. Appl. Energy 2022, 311, 118664. [Google Scholar] [CrossRef]
  44. Zhong, J.; Li, Y.; Wu, Y.; Cao, Y.; Li, Z.; Peng, Y.; Qiao, X.; Xu, Y.; Yu, Q.; Yang, X.; et al. Optimal Operation of Energy Hub: An Integrated Model Combined Distributionally Robust Optimization Method with Stackelberg Game. IEEE Trans. Sustain. Energy 2023, 14, 1835–1848. [Google Scholar] [CrossRef]
  45. Lin, B.; Jia, Z. Impacts of Carbon Price Level in Carbon Emission Trading Market. Appl. Energy 2019, 239, 157–170. [Google Scholar] [CrossRef]
  46. Li, X.; Deng, J.; Liu, J. Energy–Carbon–Green Certificates Management Strategy for Integrated Energy System Using Carbon–Green Certificates Double-Direction Interaction. Renew. Energy 2025, 238, 121937. [Google Scholar] [CrossRef]
  47. Xuan, A.; Shen, X.; Guo, Q.; Sun, H. Two-Stage Planning for Electricity-Gas Coupled Integrated Energy System with Carbon Capture, Utilization, and Storage Considering Carbon Tax and Price Uncertainties. IEEE Trans. Power Syst. 2023, 38, 2553–2565. [Google Scholar] [CrossRef]
  48. Zhong, J.; Zhao, Y.; Li, Y.; Yan, M.; Peng, Y.; Cai, Y.; Cao, Y. Synergistic Operation Framework for the Energy Hub Merging Stochastic Distributionally Robust Chance-Constrained Optimization and Stackelberg Game. IEEE Trans. Smart Grid 2025, 16, 1037–1050. [Google Scholar] [CrossRef]
Figure 1. Considered ladder-type GCT-CET mechanism and CCS-P2G for IES.
Sustainability 17 04873 g001
Figure 2. Reward and punishment ladder-type CET.
Sustainability 17 04873 g002
Figure 3. Ladder-type GCT-CET interaction mechanism.
Sustainability 17 04873 g003
Figure 4. Load profiles diagram.
Sustainability 17 04873 g004
Figure 5. Results diagram of different operational schemes.
Sustainability 17 04873 g005
Figure 6. (a) WT output for Cases 1−4; (b) PV output for Cases 1−4.
Sustainability 17 04873 g006
Figure 7. (a) Carbon trading diagram for Case 3; (b) Carbon trading diagram for Case 4.
Sustainability 17 04873 g007
Figure 8. The internal liquid storage volumes of CCS in Case 3 and Case 4 (denoted as (a) and (b), respectively).
Sustainability 17 04873 g008
Figure 9. Optimal power supply scheduling results.
Sustainability 17 04873 g009
Figure 10. Optimal hydrogen consumption scheduling results.
Sustainability 17 04873 g010
Figure 11. Optimal gas supply scheduling results.
Sustainability 17 04873 g011
Figure 12. Optimal heating scheduling results.
Sustainability 17 04873 g012
Figure 13. (a) IES cost under different basic CET and GCT prices; (b) Carbon trading cost under different basic CET and GCT prices.
Sustainability 17 04873 g013
Table 1. Simulation parameters.
ParametricValueParametricValue
P CCS max (MW)1.2 Δ P EL down / Δ P EL up [14]2/−2
V F max / V F min (m3)292/0 H GB max / H GB min (MW)3/0
V P max / V P min (m3)292/0 Δ H GB up / Δ H GB down (MW)0.75/−0.75
V F ( 0 ) / V P ( 0 ) (m3)146/146 η ES , e cha / η ES , h cha / η ES , H 2 cha [21,23,48]0.9/0.95/0.98
η c 0.9 P ES , e c h a , max / P ES , e d i s , max (MW) [21,23,48]0.45/−0.45
ρ CO 2 (kg/m3)1.964 H ES , h c h a , max / H ES , h d i s , max (MW) [21,23,48]0.45/0.45
L H 2 (J/kg)1.4 × 108 Q ES , H 2 c h a , max / Q ES , H 2 d i s , max (MW) [21,23,48]2.5/−2.5
η EL 0.85 S ES , e max / S ES , h max / S ES , H 2 max (MW) [21,23,48]1.8/3.6/10
L C H 4 (J/kg)5.071 × 107 δ e , gp (t MWh)0.472
ρ CH 4 (kg/m3)0.71428 δ e , gird (t/MWh)0.7159
η H 2 G 0.65 δ e , chp (t/MWh) [14]0.2201
P EL , in max / P EL , in min (MW)3.6/0 δ h , chp (t/GJ) [14]0.0557
e s / μ g p , s 0.4/0.5 δ h , gb (t/GJ) [3] 0.0557
β g [3]0.69 c f (CNY/t)50
P gp max / P gp min (MW)6/1.05 S t r a / S sub (CNY/t)180/60
Δ P gp up / Δ P gp down (MW)2.5/−2.5 c wcur / c vcur (CNY/kWh) [14]0.6/0.6
η chp P 0.35 K chp / K g b / K g p (CNY/kW)0.05/0.03/0.03
η chp H / η w h b 0.3/0.5 K c c s / K e l (CNY/kW)0.02/0.01
P chp max / P chp min (MW)7.5/0 K e s , e / K e s , h / K e s , H 2 (CNY/kW)0.02/0.02/0.02
H chp max / H chp min (MW)7.5/0 R d (t)200
Δ P PH up / Δ P PH down (MW)2/−2 η G B 0.92
P MR max / P MR min [14]2.5/0 Δ P MR up / Δ P MR down [14]0.5/−0.5
Table 2. Cost of system energy purchases.
TypePeriodPrice
Electricity pricePeak period8:00~11:0018:00~21:001.2104 (CNY/kWh)
Flat period6:00~7:0012:00~17:000.6759 (CNY/kWh)
Valley period1:00~5:0022:00~24:000.4111 (CNY/kWh)
Gas price24 h3.5 (CNY/m3)
Table 3. Six different deterministic cases.
CaseCCSP2GHYSCCS-P2GLadder-Type CETLadder-Type GCT“Green-Carbon”
1
2
3
4
5
6
Table 4. Results of six different operational schemes.
Case 1Case 2Case 3Case 4Case 5Case 6
F c o 2 /CNY7649.41287475.88821878.48021526.85121526.8028−13,750
F g p /CNY18,571.43617,732.864218,892.686118,456.078818,456.078819,825.4644
F buy /CNY10,0675.427995,412.867898,779.824497,705.69497,705.69495,458.7748
F cut /CNY25,619.43626105.09545766.6032986.42986.42986.4
Carbon Purchase Cost /CNY05087.21270000
F o m /CNY6831.59297136.94767250.84237311.43417311.43417369.02
F /CNY159,347.3058138,950.8759132,568.4361127,987.9559121,389.3245105,966.6922
M reality /kg93,214.223492,390.121476,449.918673,446.255373,446.255326,008.2817
F green /00006597.13325922.9671
WT and PV Consumption Rate0.76440.94380.94700.97250.972530.97253
Disclaimer/Publisher’s Note: The statements, opinions and data contained in all publications are solely those of the individual author(s) and contributor(s) and not of MDPI and/or the editor(s). MDPI and/or the editor(s) disclaim responsibility for any injury to people or property resulting from any ideas, methods, instructions or products referred to in the content.

