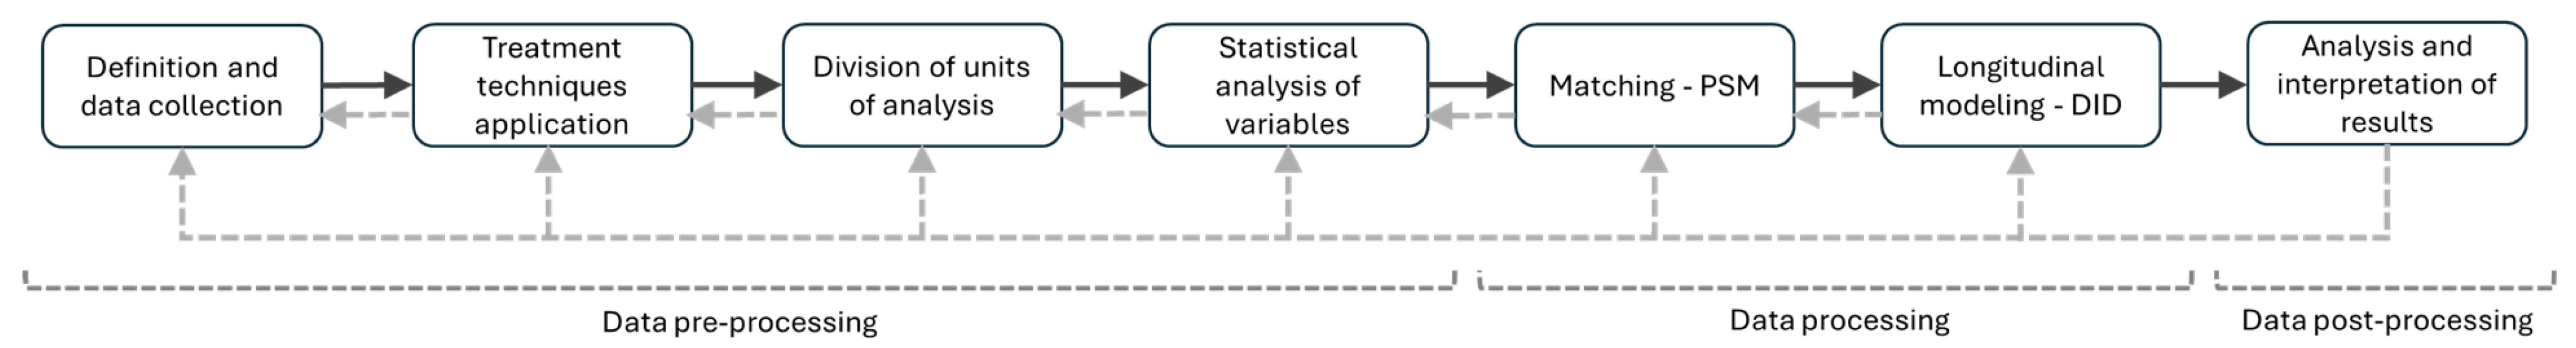
4.1. Data Pre-Processing
After the data collection, six of the 5570 municipalities (0.11%) were eliminated from the study due to missing data. The treatment variables encompass Brazil’s three most relevant types of renewable energy plants (hydro, wind, and PV) and were used to divide the control and treatment groups, applying the premises presented in
Section 3.1.
Thus, 244 units were allocated to the treatment group and 4720 to the potential control group.
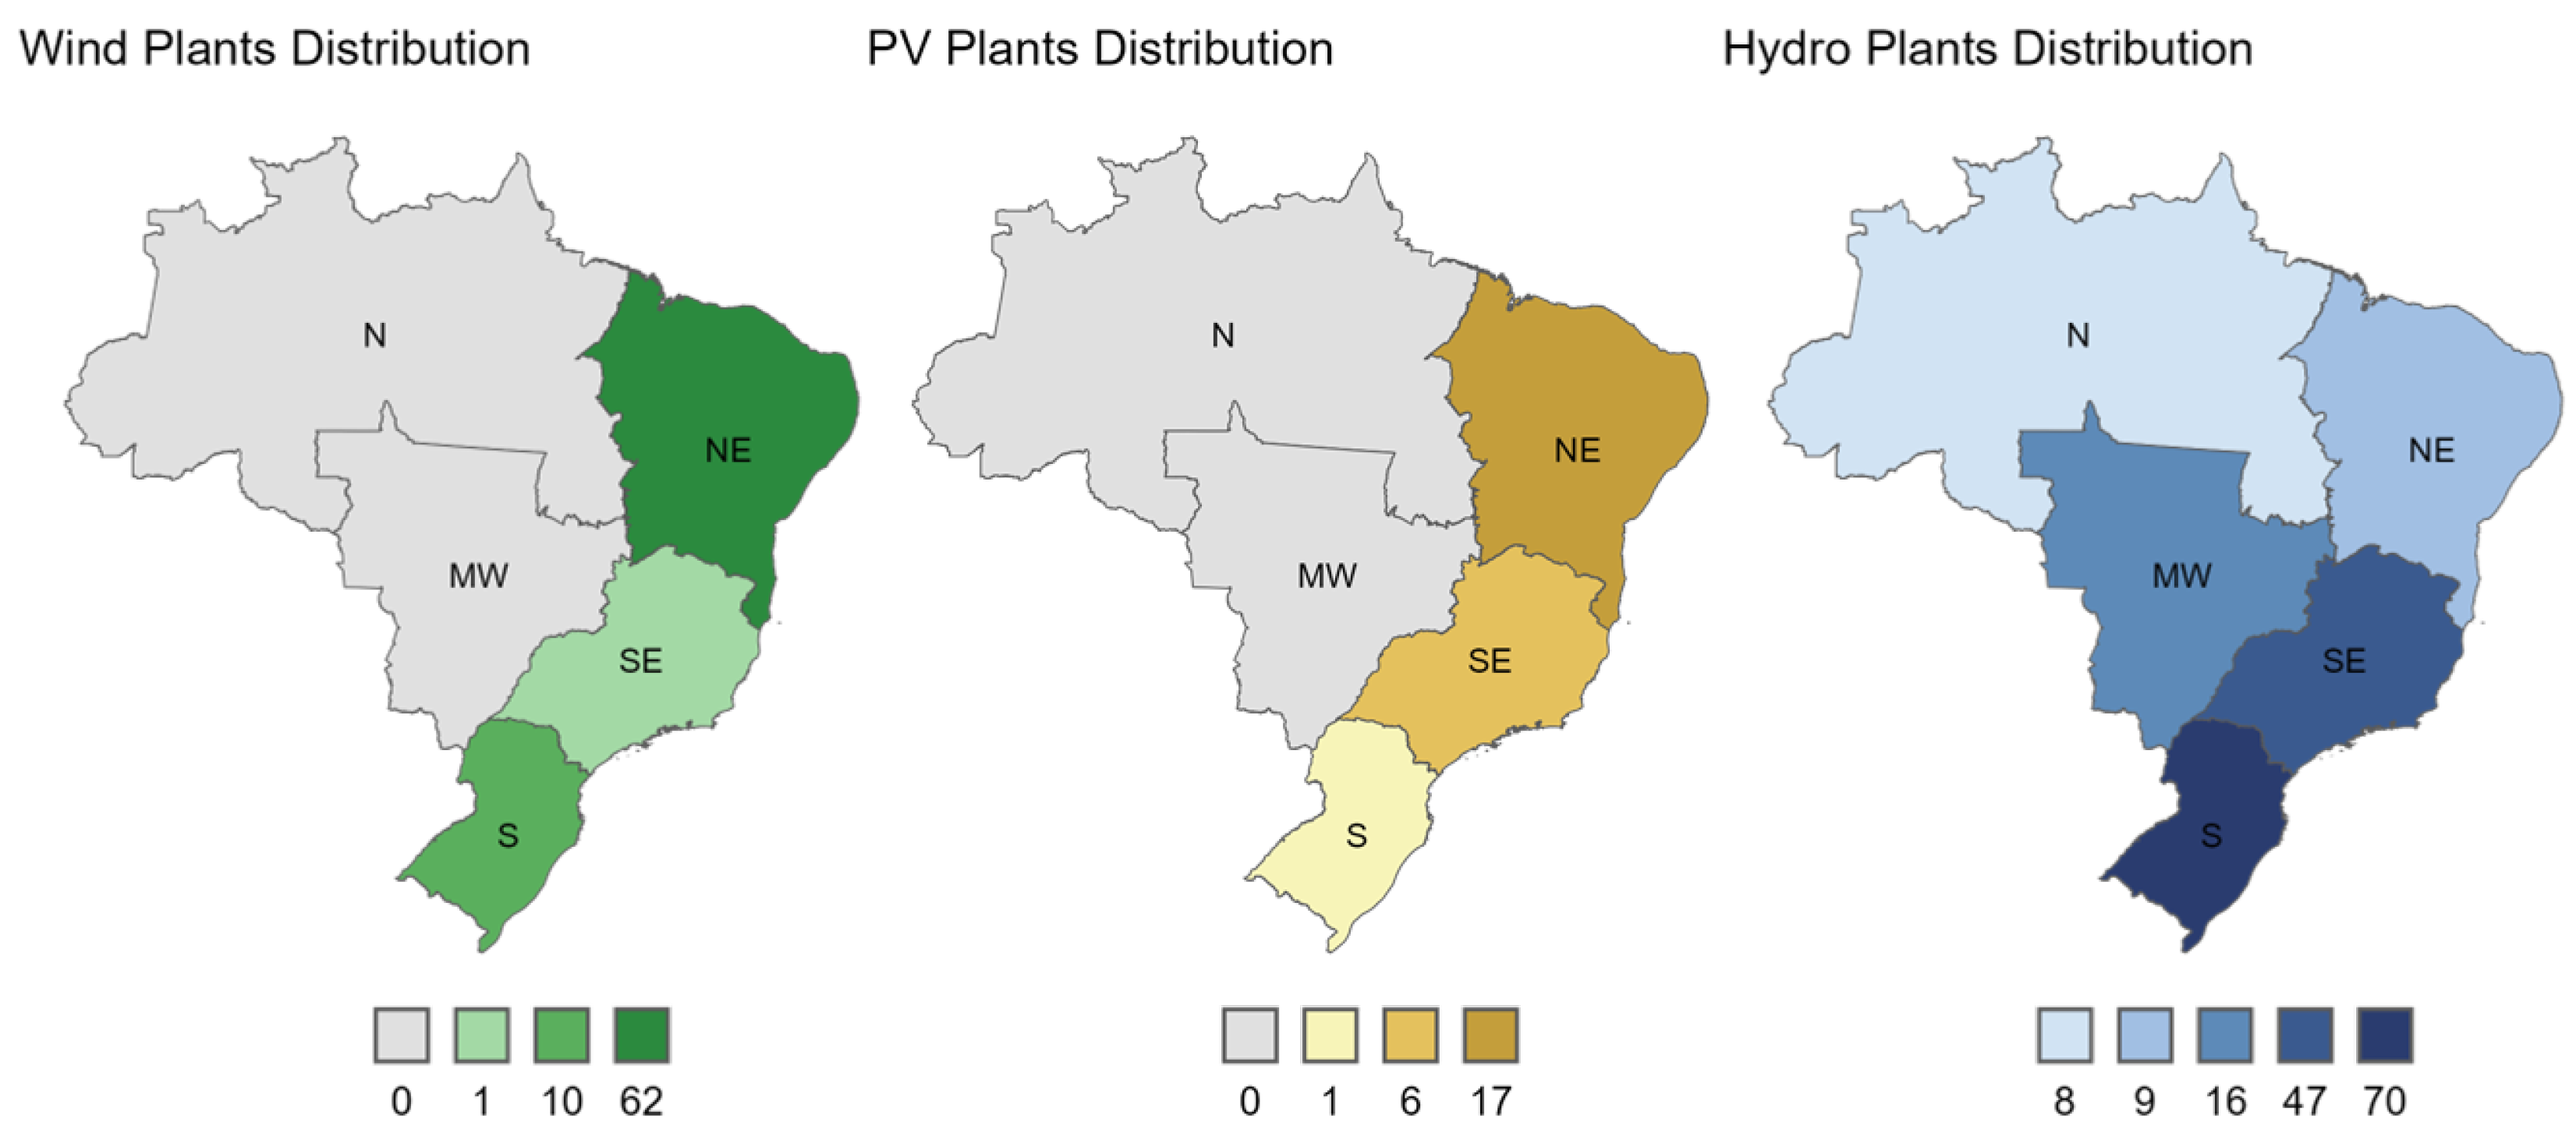
Figure 2 details the number of municipalities that received new projects by RES and region during the treatment period, and for the first time. Brazil is divided into five geographical regions: Northeast (NE), Southeast (SE), South (S), Midwest (MW), and North (N). Most of the Brazilian municipalities that received wind and PV installations are in the Northeast, 85% and 71%, respectively, highlighting the region concerning these RESs. Meanwhile, for the hydro source, the majority of the municipalities are in the South (47%) and Southeast (31%).
The average installed production capacities per municipality and source were 280.9 MW (wind), 173.6 MW (PV), and 89.6 MW (hydro). The hydro number is comparatively lower. Despite remaining the predominant renewable source in Brazil, hydropower’s share has been declining in the electrical matrix of the country (from over 70% in 2014 to around 51% in 2024) [
8]. Recent investments have focused on small- and medium-sized plants, driven by environmental sustainability concerns, as large projects require storage reservoirs that significantly impact the environment and local communities [
55]. Proceeding with the treatment group analysis, only three municipalities, all located in the Northeast region, received more than one type of RES, specifically wind and PV. None received the three types of projects.
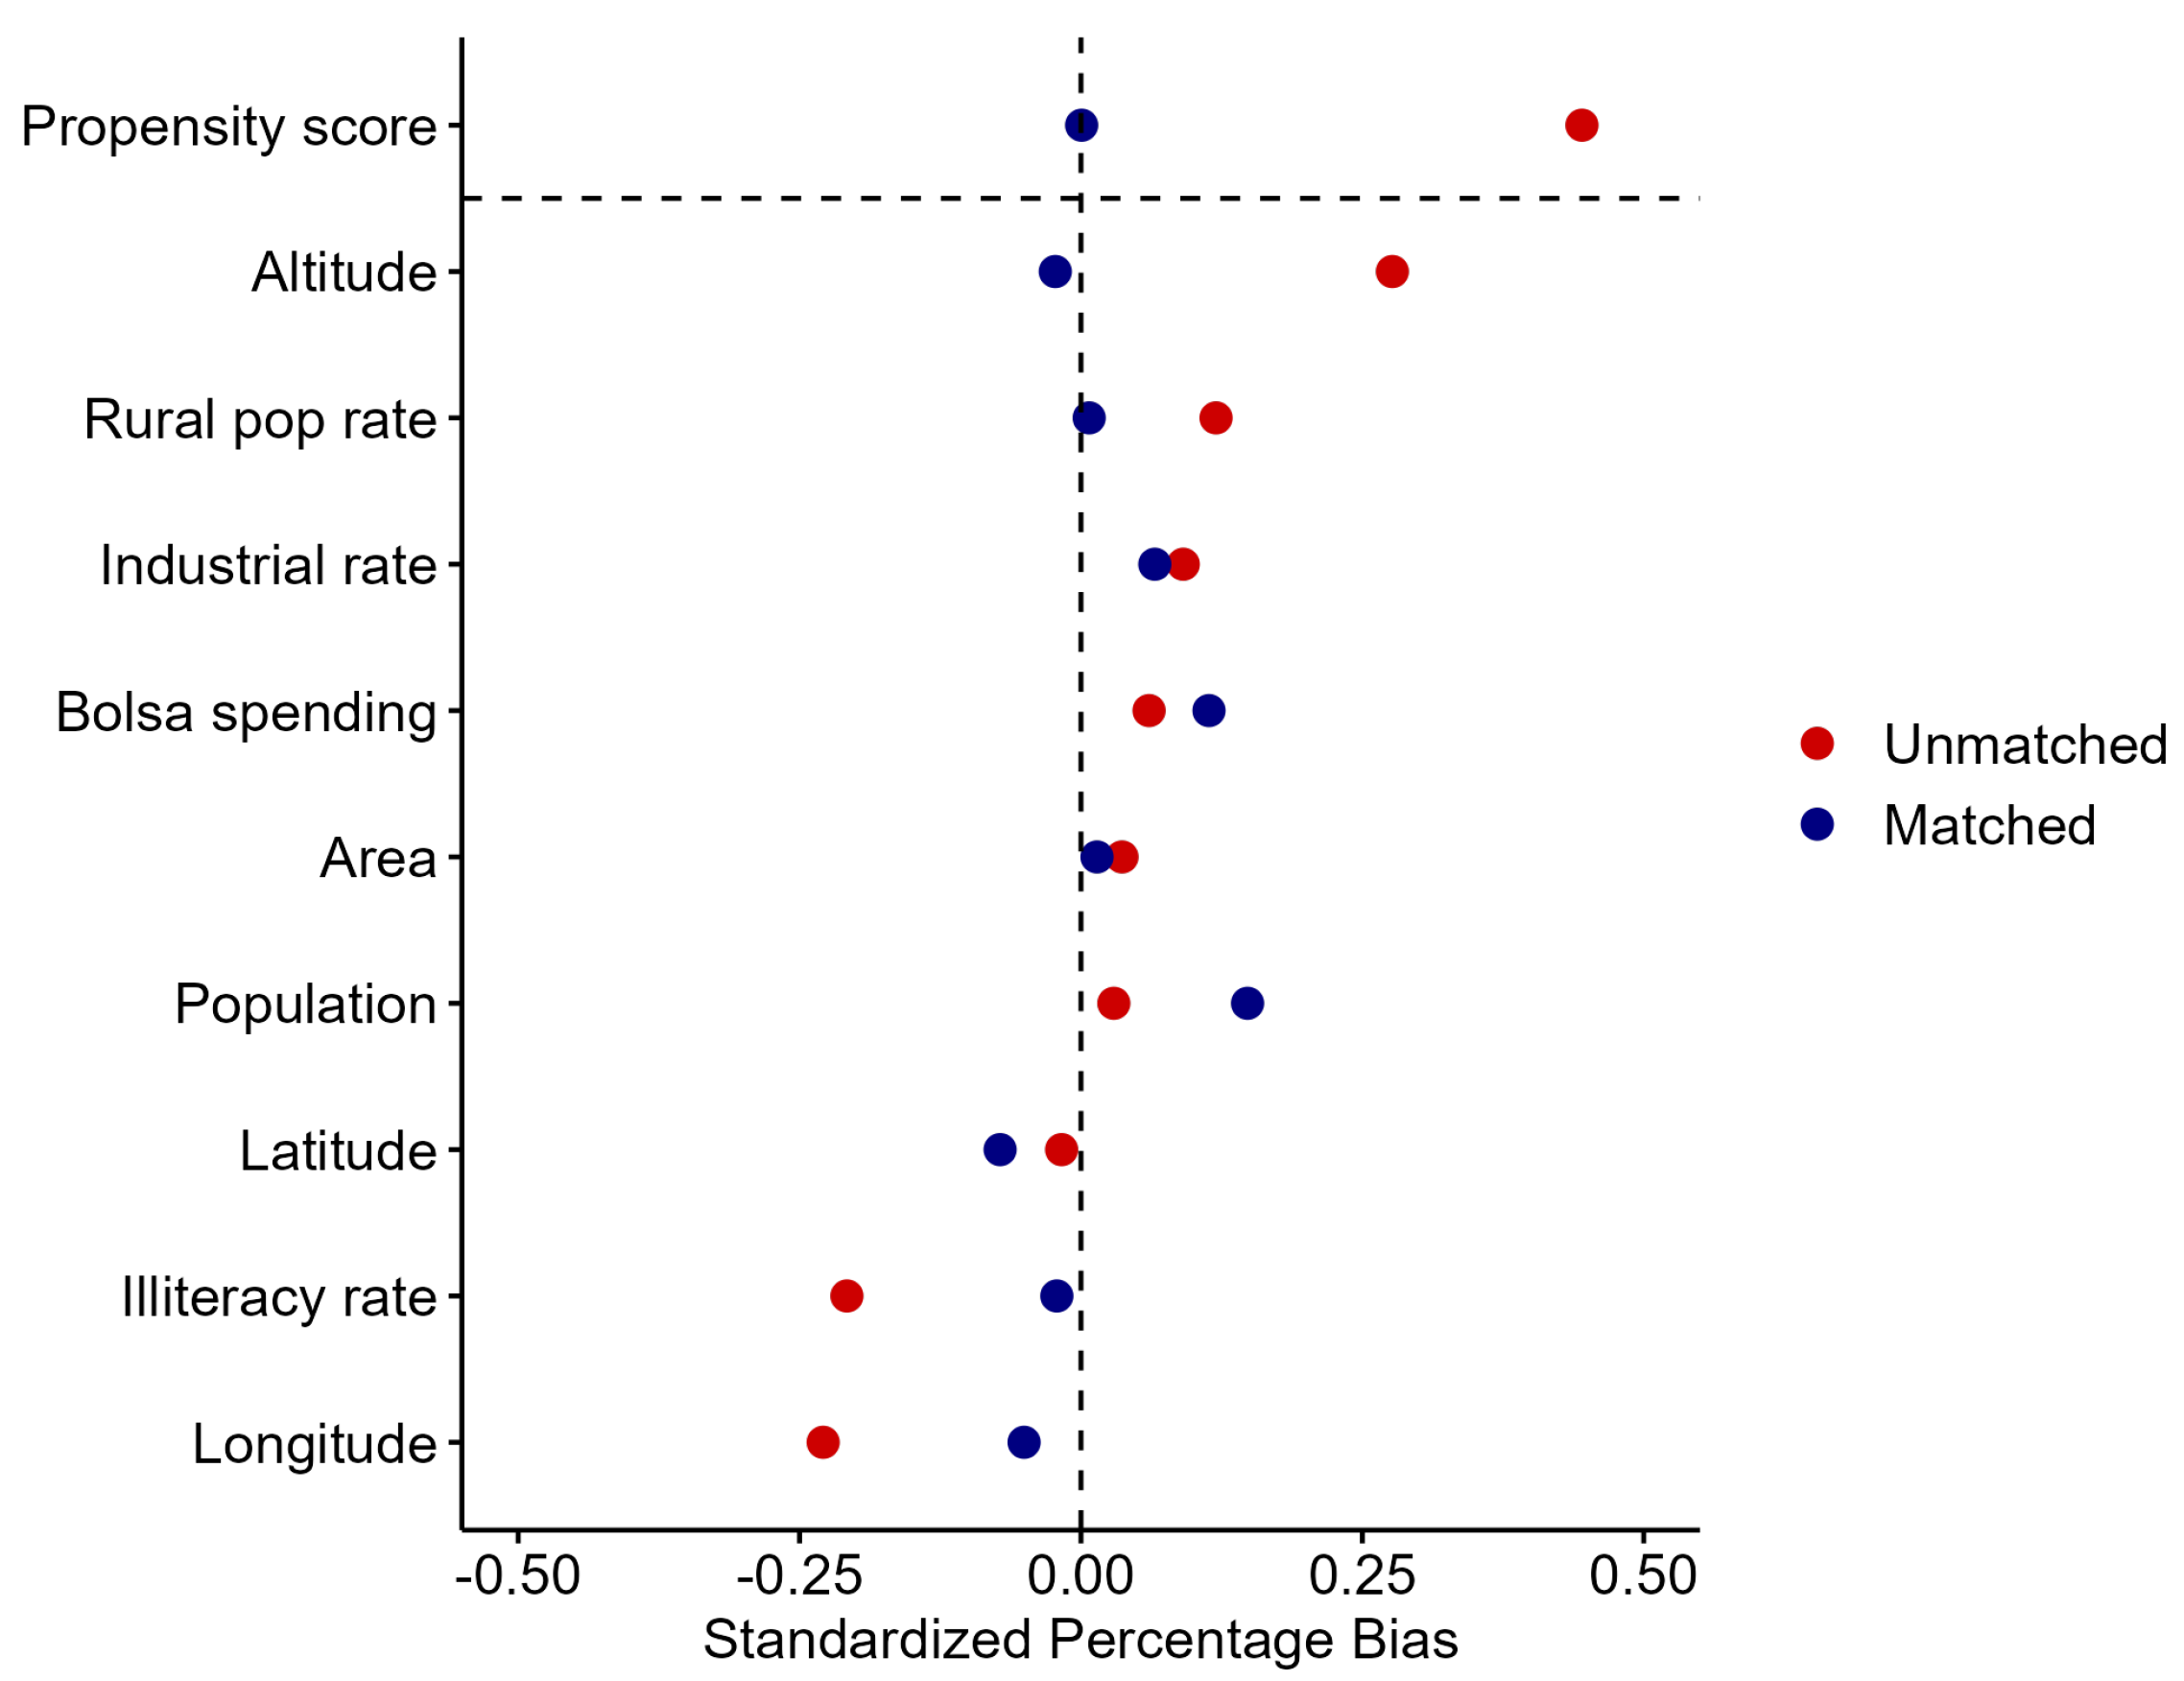
Table 3 presents the covariates’ descriptive statistics during the pre-treatment period. According to the Kolmogorov–Smirnov test [
44], most of the variables exhibit different distributions between the two groups, underscoring the need for applying the matching method.
The outcome variables analyzed in this study are ‘GDP per capita’ and ‘Employed population’. It should be noted that there is a delay in the release of the 2020 Brazilian demographic census, which is the source of other socioeconomic indicators covering the entire national territory. Therefore, this study is limited to the indicators available in the post-treatment period. Since the research aims to compare the social benefits before and after the plants’ installation, a statistical analysis of the outcome variables is conducted after balancing the control and treatment groups in
Section 4.2, encompassing both periods, 2010 and 2020.
4.3. Difference-in-Differences Models
As defined in
Section 3.2.2, different DID models were estimated for each outcome variable to assess the general and specific impacts of the renewable sources on the evaluated indicators.
Table 6 presents the results for GDP per capita. There are four models in total. The first one considers installing any RES plant as the treatment, encompassing all municipalities from the treatment and control groups, each with 244 units of analysis.
The other models consider each renewable source individually as the treatment, i.e., wind (model 2), PV (model 3), and hydro (model 4), each with, respectively, 70, 21, and 150 treated municipalities and, consequently, the same numbers as the control. The three municipalities with more than one plant type were considered only in model (1) since the sample is insufficient to estimate a fifth model considering only places with more than one RES.
In
Table 6, each renewable variable (RES, wind, PV, and hydro) corresponds to the DID estimator of the model; in other words, the effect of the treatment over time. Notably, without distinguishing the source type (model 1), installing a RES plant has a positive and significant effect on GDP per capita, contributing to an increase of 3476.71 BRL, on average, compared with untreated municipalities. Considering that the monthly minimum wage in the country was 1039 BRL in 2020 [
57], the average impact on GDP per capita is significant, amounting to more than three times that value. Moreover, it represents an average increase of 16.8% compared with the pre-treatment period.
Each source’s specific effects are positive, highlighting the wind plants, whose average effect is 5745.78 BRL more on GDP per capita. Although more prominent than RES plants in general (model 1), the average effect of PV plants has a relatively high standard error, making the coefficient insignificant according to the
t-test [
58]. However, it is essential to emphasize that the sample for the photovoltaic model is relatively smaller than the others, including only 21 treated municipalities; therefore, a larger sample is needed for more robust results. The DID coefficients of the other three models are statistically significant based on the
t-test for various significance levels, as indicated in
Table 6. Furthermore, confidence intervals can be constructed from the standard errors provided in parentheses. For example, the values [1414.48; 5538.94] constitute the 90% confidence interval for the DID estimator of model (1), which allows us to infer that the average treatment effect lies between these values with this confidence level.
The positive effects are explained through various channels. Developing renewable energy projects requires private and public investments, enhancing local infrastructure and stimulating the municipal economy. These investments increase the capacity to produce goods and services, directly contributing to the rise in GDP per capita. Growth occurs not only through energy generation but also due to the positive impact the installation of these plants can have on other economic sectors, such as real estate, commerce, and service provision, which also benefit from improvements in energy infrastructure.
The most prominent impact of wind projects can be interpreted by the larger average size of wind plants compared with other sources, in terms of installed capacity, as presented in
Section 4.1. In the past decade, wind energy was the fastest-growing source in the country [
59]. The larger the installed capacity of power plants is, the more energy they tend to produce, resulting in a greater impact on GDP per capita. Large land areas are also leased for wind project installation, significantly affecting the local real estate sector [
60].
The remaining coefficients of the models represent the common time trend for the control and treatment groups and two covariates:
Bolsa Família spending and industrial production, both in millions of reais (BRL). These covariates were selected because they could influence the response variable [
61]. The common time trend and industrial production are positive and statistically significant in all models. Although
Bolsa Família spending presents positive values in all cases, its coefficients are not always statistically significant, as seen in the wind and hydro cases. This can be explained by the variability in the benefit distribution among the municipalities in these samples.
Regarding the adjusted , the models generally exhibit substantial values for this metric, with most close to 0.80, indicating a significant proportion of GDP per capita variability explained by the selected models. Finally, we emphasize that the fixed effects account for the intercept by absorbing it within the entity-specific effects. This approach allows for the control of unobserved heterogeneity by capturing the intercept variations unique to each municipality, thereby improving the accuracy of the estimated coefficients for the other variables.
The other indicator analyzed is the employed population. The employment opportunities of renewable plants can be classified into three groups: (i) direct, involving activities related to the plant’s construction, operation, and maintenance; (ii) indirect, created in the supply chain and support services, such as suppliers of materials, transportation, and logistics services; and (iii) induced, created due to the increase in demand for local goods and services [
62]. It is important to highlight that the aim is to analyze aggregated impacts rather than the specific effects on each type of employment.
The models of the employed population are presented in
Table 7. Similarly to GDP per capita, they were estimated with fixed effects for the same reasons as the GDP case. The first (1) considers all treated municipalities without distinguishing by source; the remaining were estimated for each plant. However, the model calculated for the photovoltaic project’s sample is not presented, as it yielded nonsensical coefficients, occasionally negative, due to relatively lower growth in municipalities that received PV plants compared with the specific control group for this source. It is noteworthy that, in addition to the relatively small photovoltaic sample, it was necessary to analyze these cases individually to elucidate the particular reasons for the observed discrepancy, which is beyond the scope of this study.
Analyzing the results, municipalities receiving any RES projects experienced an average increase of 451.84 in the employed population, which corresponds to a 6.7% rise. Specifically, the impact on municipalities receiving wind plants is an average increase of 353.74 formal jobs compared with the control group. The highlight is for the hydro source, where the DID estimator indicates an average of 622.74 more people employed. It is emphasized that the DID estimators for models (1) and (3) are statistically significant. However, the same cannot be said for the wind model, whose standard error for the treatment effect over time is relatively high.
In short, implementing renewable energy projects can increase municipalities’ labor demand. In this sense, the construction/installation phase is the most labor-intensive, offering temporary and diverse employment opportunities [
60,
63]. In contrast, the operation and maintenance phases typically experience reduced labor demand, focusing on technical and often automated activities [
63].
Regarding specific effects, we observe a relatively greater impact from hydropower. One of the possible reasons for this is that, in general, the construction cycle for hydroelectric plants tends to be longer than for wind power, particularly due to complex activities such as building dams, canals, transmission infrastructure, and site adaptation [
64,
65]. It is important to emphasize that these estimated effects represent the average impacts of the plants. However, a case-by-case analysis would be needed to capture the specificities of each municipality, which falls outside the goals of this research.
The other variables considered are the same as those in the GDP per capita models. The common time trend for the control and treatment groups has a positive and statistically significant effect in the general model (1). Furthermore, although positive, the coefficient for the Bolsa Família variable does not reach statistical significance. Meanwhile, industrial production exhibited a negligible coefficient in models (1) and (3), reducing the adjusted ; thus, it is not presented for these cases. Regarding the adjusted , the metric is notably high, consistently above 0.98, demonstrating a significant proportion of the variability of the dependent variable explained by the models.
4.4. Implications and Innovations
All the research questions formulated at the end of the Literature Overview (
Section 2) are answered with the results of this work. In summary, without distinguishing between the plant types, the average effects on the social benefits evaluated are positive and significant: 16.8% on GDP per capita and 6.7% on formal employment. In the most recent study found in the literature analyzing Brazilian data up to the time of this work, Nunes et al. [
22] estimated a 10% rise in per capita income and a 13.8% increase in the number of formal workers, focusing on projects under the PROINFA program. While the results are also positive, the differences can be explained by different sets of projects and periods. That is, we include plants beyond those linked to PROINFA and consider indicators measured from 2020 onwards, reflecting the greater maturity of renewable plants installed in the country over the past decade.
Moreover, although [
22] estimated overall average impacts, the authors did not calculate the specific effects of different renewable plants. In this context, the present work highlights the impact of wind farms on GDP per capita and hydropower on the employed population, as well as the different channels that explain the outcomes. As for the PV source, a larger sample is necessary to obtain more generalized and robust results. Nevertheless, in this context, ref. [
25] estimated that a solar thermal power plant installed in Brazil could generate between 45 and 61 jobs (direct, indirect, and induced) per MW installed.
Compared with other works focusing on Brazil, ref. [
26] suggests that wind farm implementation may be associated with a 27% increase in employment and a 34% increase in wages, figures more optimistic than those found in the present study and in [
22]. The work [
4] estimated socioeconomic impacts of hydro projects and, according to the analyzed sample, the author did not find significant effects on labor/income. At the same time, ref. [
19] pointed out that hydro projects are associated with a reduction of 1.6% in the percentage of individuals in poverty. However, this finding is not directly comparable to our results, since we are not evaluating this indicator in the present research. The authors also estimated that wind farms are associated with a reduction of 2.1% in unemployment and a slight decrease of 0.5% in income derived from work (opposite to the direction expected).
It is important to underscore that the demand for labor in renewable energy plants generally decreases after the start of operations and, even post-installation, often requires highly specialized and qualified labor, frequently sourced externally—particularly in many rural cities in Brazil [
63]. This highlights the need for more investment in local workforce qualification and better distribution of benefits from the renewable energy industry.
In this sense, research in this area aims to stimulate sustainable development and support the implementation of public policies encouraging local industry, as it quantitatively demonstrates its potential. Brazil, an underdeveloped and less industrialized country, has great potential to develop a high-tech production chain linked to the non-conventional energy sector. Based on the insights from this study, considering the specific development objectives of each location, public policies and tax incentives can be used to strategically implement infrastructure and install power plants in municipalities with renewable energy potential but lacking the required facilities. However, compensatory policies should also be implemented to ensure that the benefits generated are more equitably distributed among the local population, including creating professional qualification programs and reducing energy costs for the community. Still, from the results of this research, companies in the sector can leverage the presented results to demonstrate different impacts that can be generated by their actions, improving their ESG ratings and showing commitment to social responsibility and long-term sustainability.
Furthermore, this work’s results can be used to construct probabilistic counterfactual scenarios related to socioeconomic benefits in municipalities that have not received renewable power plants but have the potential to do so.
Figure 4 and
Figure 5 present the cases of GDP per capita and employed population, respectively. Considering the control group, both show their respective index real evolution, the average counterfactual scenario, and the 90% confidence interval of the counterfactual scenarios. The intervals were constructed using the robust standard errors of the DID estimators, as exemplified by the GDP per capita case from model (1) in
Section 4.3. In more detail, to simulate the counterfactual scenarios for each case, the mean values of the DID estimator, along with their respective lower and upper confidence interval bounds, were added to the actual values of the control group in the post-treatment period. Notably, the real values are mostly below the counterfactual confidence intervals. Therefore, these probabilistic forecasting scenarios can be used to estimate, on average, the evolution of the indices had such municipalities received investments in renewable plants.
Regarding the main innovations of this study, we can list:
The impacts on the GDP per capita and employed population resulting from investments in renewable energy plants in Brazilian municipalities were quantified after the installation of these projects, analyzing the evolution of these indices between 2010 and 2020. It is important to note that most of Brazil’s wind and solar power plants were installed in the last decade, and there is a lack of studies evaluating their impacts on indices from 2020 onward. This study, therefore, provides relevant results on the effects of the significant integration of non-conventional plants over the last decade on recently measured indices.
Not only were the overall average effects of renewable plants (without distinction by source) on the indicators estimated, but also the individual effects of the three primary renewable sources in the country (hydro, wind, and PV), which provide insights and results not found in the literature.
A robust observational data method was applied in a generalized and systematic manner to all Brazilian municipalities. As of the publication of this research, no studies have been identified that simultaneously address the specific levels of coverage—spatial, temporal, and renewable types—considered in this study.
Counterfactual scenarios were introduced, providing practical tools to assess how socioeconomic indicators could probabilistically evolve in municipalities with potential for renewable energy production.
Notably, potential endogeneity issues were addressed by using DID with fixed effects, controlling for unobserved factors of the municipalities that could be correlated with both the treatment and the dependent variables. Additionally, using different covariates, common time trends, and group-specific effects in the DID models further reduces the risk of bias due to omitted variables.
Finally, potential limitations include the small sample size for solar plants, which hampers the robustness of results for this source compared with others. Another point is that this study focuses on Brazil’s specific regions and characteristics. Nevertheless, the methodological framework can be applied in other national contexts—with the necessary adaptations—to assess the consistency of socioeconomic impacts across different renewable energy strategies and institutional settings. In this sense, the availability of public data on the three required groups of variables (treatment, covariates, and outcome) is a key prerequisite. Furthermore, although the model incorporates various mechanisms to address endogeneity issues, the response variables may still be influenced by uncontrolled external factors, such as economic crises or changes in the labor market. Nonetheless, it is important to highlight that the purpose is to estimate the general average effects and those specific to each type of plant. Examining the particularities of each municipality lies beyond the scope of this work.


 ,
, 


