1. Introduction
The global energy market is experiencing significant paradigm shifts. As climate change mitigation and carbon emission reduction have become critical international priorities, many countries consider renewable energy expansion as a core strategy [
1,
2,
3]. In line with the reduction targets proposed by international frameworks, such as the Paris Agreement, renewable energy has moved from being an option to becoming an essential energy source. Technological advances have enabled renewable energy to reach grid parity and reshape market structures, and governments have intensified policy and economic efforts to secure leadership in energy transitions [
4,
5]. The International Energy Agency (IEA) projects that the share of renewables will exceed earlier forecasts within the next decade, suggesting that international technological competition will intensify further [
6,
7].
The United States, China, Europe, Japan, and Korea—the five leading energy nations—are competing vigorously to secure dominance in the energy sector [
8]. These countries are accelerating renewable energy innovation and rapidly commercializing new technologies [
9,
10]. Consequently, renewable energy technology portfolios vary according to domestic policy environments and industrial foundations, underscoring the need for systematic cross-national comparisons [
11,
12]. Therefore, assessing the difference in technological competitiveness is crucial for understanding global energy market dynamics and formulating effective national policies and strategies [
13,
14]. Prior cross-country analyses have shown that wider patent portfolios translate into stronger export performance in renewable energy equipment [
13], while a mismatch between patent specialization and domestic deployment can slow green technology diffusion [
14]. Failure to grasp a nation’s true technological position can cause misallocation of resources and misaligned investment priorities, with negative implications for energy security and sustainable growth [
15,
16]. Because patent filings record both the occurrence and qualitative impact of invention, they provide a uniquely quantifiable lens for benchmarking national strengths, tracking technology diffusion, and detecting capability gaps that are otherwise obscured in trade or publication statistics.
Technological competitiveness can be measured through diverse indicators, such as R&D expenditure, scientific publications, standardization activities, market share, and trade statistics [
17]. However, R&D and publication metrics do not directly capture commercialization readiness, whereas market share and trade data are heavily influenced by industrial structure and policy support [
18,
19]. Several studies report that patent indicators—particularly forward-citation counts and IPC-diversity indices—correlate more closely with subsequent market uptake than do academic publications or gross trade values [
18,
19]. In contrast, patents represent legally protected technological outputs, thereby offering a relatively objective lens to gauge the pace and quality of innovation across countries [
20]. Accordingly, patent-based analyses have become a standard tool for benchmarking national innovative capacity and forecasting technology trajectories. For example, longitudinal patent mapping has revealed first-mover advantages in wind turbine design [
20] and identified emerging niches such as perovskite photovoltaics ahead of commercial scale-up [
21].
Therefore, patent data analysis has become a proxy indicator approach for tracking national and corporate technology trends, R&D directions, and competitive strengths [
21]. Given the large volume of available patent data, robust criteria and systematic methods are essential [
22]. Prior studies have often relied on keyword searches; however, evolving terminology and translation inconsistencies can undermine comparability [
23]. Analyses based on patent applications may also misrepresent competitiveness because the legal status has not yet been confirmed [
24]; similarly, studies focused on the triadic patents of the United States, Europe, and Japan may overlook global trends [
25] and underrepresent major markets, such as China and Korea [
26].
For a more precise assessment, this study employs granted patent data classified under the IPC system [
27]. IPC provides a globally standardized taxonomy that minimizes linguistic and classification ambiguities [
28]. Compared with alternative schemes such as the Cooperative Patent Classification (CPC) or legacy national codes (e.g., USPC or FI/F-term), the IPC is the only WIPO-mandated, fully harmonized taxonomy applied uniformly by patent offices worldwide. Its hierarchical structure offers finer technological granularity, long-term notation stability, and one-to-one class equivalence across jurisdictions, enabling statistically robust cross-country comparisons and consistent trend analyses. Granted patents, having undergone substantive examination, reflect technological maturity and commercial potential [
29]. Thus, an IPC-based analysis of granted patents offers an effective means of correcting cross-national classification inconsistencies and objectively comparing technological competitiveness [
30,
31].
Various methods, such as Delphi surveys, Porter’s Diamond model, and portfolio analyses based on publications and patents, have been used to evaluate technological competitiveness [
32,
33]. Delphi surveys are prone to subjectivity and bias, whereas the Diamond model is limited to microlevel analysis [
34,
35]. To overcome these limitations, this study integrates traditional patent portfolio analysis with a technology portfolio approach, enabling both quantitative comparisons of patent performance and qualitative assessments of specific technology areas and R&D trajectories. This combined framework provides a comprehensive view of the competitiveness of renewable energy across the country.
The objectives of this study are twofold. First, using IPC-based granted-patent data, we compare the technological competitiveness of major countries not only across the entire renewable energy sector but also within key subsectors—solar, wind, geothermal, and water. This dual perspective enables the systematic evaluation of national strengths and R&D orientations, thereby informing future energy policies and industrial strategies. Second, by merging patent and technology portfolio analyses, we present a holistic approach that complements the predominantly quantitative focus of prior studies and yields a more balanced competitiveness assessment. This integration reveals emerging high-impact technologies that patent-count-only studies overlook and highlights over-concentration risks that standalone portfolio charts fail to capture. The derived insights aim to support policymakers and industry stakeholders in strategic decision-making.
The remainder of this paper is organized as follows. First, the study surveys the relevant literature, presents the theoretical foundations and methodological framework for assessing technological competitiveness, and details the scope of analysis and the procedures for collecting and processing patent data. Next, it reports the renewable energy patent trend results and a comparative evaluation of national technological competitiveness, highlighting the distinctive technological strengths of each country. Finally, it synthesizes the findings, draws policy and industrial implications, summarizes the principal contributions of the study, and outlines avenues for future research.
2. Literature Review
2.1. Concept and Analytical Methods of Technological Competitiveness
Technological competitiveness refers to the capability of a nation or firm to secure sustained competitive advantage through continuous innovation [
36]. Building on Schumpeter’s view of technological innovation as the engine of economic development, international organizations, such as the OECD and UNCTAD, have, since the 1990s, treated technological competitiveness as a key driver of economic growth, commonly measured through indicators such as R&D investment, publication counts, patent applications, and grant statistics [
37,
38,
39]. Various approaches, including qualitative expert assessments (e.g., the Delphi method), macro-level analyses using Porter’s Diamond model, and portfolio analyses based on publications or patents, have been employed to evaluate technological competitiveness.
The Delphi method collects and analyzes expert opinions and is widely used to forecast technological trends, prioritize R&D topics, and inform policy designs [
40,
41]. However, its reliance on qualitative judgment introduces the risks of group-think, subjectivity, and uncertainty [
42]. Porter’s Diamond model combines R&D outputs with macroeconomic indicators, such as GDP, trade balances, and human capital metrics; it underpins the competitiveness rankings published by the IMD and the World Economic Forum [
43,
44,
45]. Although these studies illuminate the interplay between industrial policy and technological growth, they struggle to capture the interactions among the factors and lack granularity at the level of specific technologies [
46,
47].
Publication-based analyses evaluate competitiveness using metrics such as article counts and citations. These studies are useful for tracking research trends, comparing national or institutional performance, and assessing university–industry collaboration [
48,
49]. However, they offer limited insight into industrial applicability, understate the real-world impact of technologies, and lag behind the latest developments because of publication delays [
50,
51]. Patent- and technology-based analyses, which draw on the most critical quantitative data—patent records—are, therefore, the most preferred option [
52,
53]. Patent portfolio analysis excels at benchmarking nations or firms but is less effective at probing fine-grained technology trends [
54,
55]. Conversely, technology portfolio analysis is well-suited for identifying strengths and weaknesses within specific technologies, guiding R&D investment, and monitoring trends but is less appropriate for cross-industry or cross-country comparisons [
56,
57]. Accordingly, this study integrates patent portfolio benchmarking, which situates countries within the global competitive landscape, with technology portfolio mapping, which exposes strengths and weaknesses at the IPC-class level, thereby overcoming the individual limitations of each method and providing a comprehensive assessment of technological competitiveness.
As each method has distinct advantages and limitations, selecting an appropriate analytical framework must align with the research objectives and units of analysis [
58,
59]. To obtain a more comprehensive picture of cross-national competitiveness in renewable energy, this study parallelly employs patent and technology portfolio analyses, thereby addressing the shortcomings of prior research and furnishing policymakers and industry stakeholders with actionable intelligence.
2.2. Existing Studies and Limitations of Patent Portfolio Analysis
Patent portfolio analysis, rooted in the 1973 portfolio matrix of the Boston Consulting Group, is a leading method for assessing technological competitiveness [
60]. Ernst pioneered a two-dimensional model using patent activity on the x-axis and patent quality on the y-axis. Subsequent refinements in 2003 incorporated variables such as grant ratio, international scope, technological breadth, and citation frequency, establishing a systematic framework [
61,
62]. Whereas Ernst’s maturity–impact grid positions technologies by patent volume and quality, and Porter’s Diamond attributes national advantage to factor, demand, and institutional conditions, our dual-layer framework unites these perspectives—coupling patent indicators with technology portfolio metrics—to provide both quantitative benchmarking and contextual diagnostic power. This model has since been validated through empirical studies across industries, ranging from nutraceuticals and automotive to computing [
52,
63,
64,
65].
More recent adaptations have extended patent portfolio analysis to R&D capability assessment and technology–market analysis. Ernst and Soll introduced an integrated patent–market portfolio that factors in market performance [
66], while Cho examined how large and small firms deploy divergent patent strategies [
67]. Zhang proposed a model that incorporates technology risk, enabling a quantitative assessment of commercialization challenges [
68].
Despite these advances, several gaps remain in the literature. First, most studies focus on industry-level portfolios, leaving individual technology niches under-explored [
69,
70]. Second, keyword-based patent searches can yield inconsistent coverage, raising doubts about whether all relevant technologies are captured or not [
71]. Third, reliance on patent applications may overstate competitive positions before legal rights are secured, while triadic-patent analyses risk bias toward the United States, Europe, and Japan, underrepresenting emerging markets, such as China and Korea [
72].
2.3. Existing Studies and Limitations of Technology Portfolio Analysis
Technology portfolio analysis provides a systematic framework for evaluating the technologies possessed by a firm or nation and formulating R&D investment strategies [
73]. Assessing growth potential, market acceptance, competitiveness, and risk supports the selection of an optimal technology mix [
74]. Rooted in investment portfolio theory—which seeks to minimize risk and maximize return—this approach applies analogous principles to technology management [
75].
The concept was operationalized when the Boston Consulting Group introduced the BCG matrix, classifying technologies into four categories—Star, Cash Cow, Problem Child, and Dog—based on market-growth rate and market share, thereby guiding decisions on whether to invest in, maintain, or withdraw from particular technologies [
76]. McKinsey later proposed an evaluation model based on technological competitiveness and market attractiveness, thereby informing corporate R&D priorities [
77,
78]. Additional studies analyzed technology life cycles to shape corporate and governmental R&D and market entry strategies and forecast long-term technological trajectories [
79].
Despite its value, previous research on technology portfolio analysis demonstrates several limitations. First, most studies examine portfolios at the individual country or firm level, with cross-national or cross-firm comparisons remaining scarce [
80,
81]. Second, the analyses typically cover broad technological areas, with relatively few studies probing intra-industry niches [
82]. Third, inconsistent or ambiguous criteria for selecting technologies arising from divergent classification schemes or multiple names for the same technology can lead to overlaps or omissions [
83]. To close these gaps, we (i) replace keyword queries with a fully IPC-driven retrieval protocol that eliminates naming ambiguities and ensures exhaustive coverage; (ii) disaggregate the renewable energy domain into four IPC-defined subsectors—solar, wind, geothermal, and water—to probe intra-industry niches; and (iii) benchmark countries with a dual-layer framework that combines granted-patent indicators with Boston Matrix technology portfolio metrics, thus avoiding the premature optimism of application data and enabling bias-reduced cross-national comparisons.
2.4. Gaps in Renewable Energy Technology Analysis
Although renewable energy technologies are advancing rapidly, research remains limited [
84]. Existing studies tend to focus on entire industries industry or on single countries, leaving subsector-level analyses underrepresented, thereby hindering a balanced understanding of the overall technology portfolio [
85,
86].
Moreover, many investigations have failed to assess the technologies in depth [
87]. Rather than distinguishing specific capabilities or innovation outcomes within each subsector, they often rely on simple quantitative indicators, such as patent or publication counts, or on economic metrics alone, which constrains an accurate evaluation of technological maturity and future R&D directions [
88]. To overcome these limitations, our study pairs an industry-wide, cross-national benchmark with granular IPC-based analyses of solar, wind, geothermal, and water technologies, delivering an integrated yet fine-grained perspective on renewable energy competitiveness.
Given the prevalence of topic-specific studies and the shortage of comprehensive technology-focused analyses, it is difficult to obtain an integrated view of cross-national competitiveness in renewable energy. Therefore, this study examines both industry-wide and subsector-specific technological performances and industrial implications. By simultaneously illuminating national strengths and weaknesses and mapping broader growth prospects and detailed technology trajectories, the analysis aims to deliver actionable insights for future energy policies and industrial strategies.
3. Methods
3.1. Research Procedure
To provide a comprehensive assessment of the technological competitiveness of renewable energy, this study follows the three-step procedure illustrated in
Figure 1: trends analysis, patent portfolio analysis, and technology portfolio analysis. Trends analysis quantified total granted-patent volumes, year-by-year growth, and the concentration of activity by country and technology field, thereby revealing overall developmental trajectories and major inflection points. Patent portfolio analysis compared national competitiveness both for the entire sector and for each subsector, clarifying the competitive landscape among countries. Technology portfolio analysis then quantified the concentration and technological maturity of detailed technologies within each subsector (solar, wind, geothermal, and water), providing a fine-grained view of their strengths and weaknesses. Taken together, these sequential analyses move from macro-level trend mapping to national benchmarking and finally to micro-level technology diagnostics, yielding an integrated snapshot of renewable energy competitiveness that informs targeted policy and investment decisions. This study focuses on four renewable energy technologies—solar, wind, geothermal, and water (hydropower)—which are clearly defined in international patent classification systems (e.g., IPC, CPC), account for most renewable energy patents, and are prioritized in the policy.
3.2. Data Collection and Pre-Processing
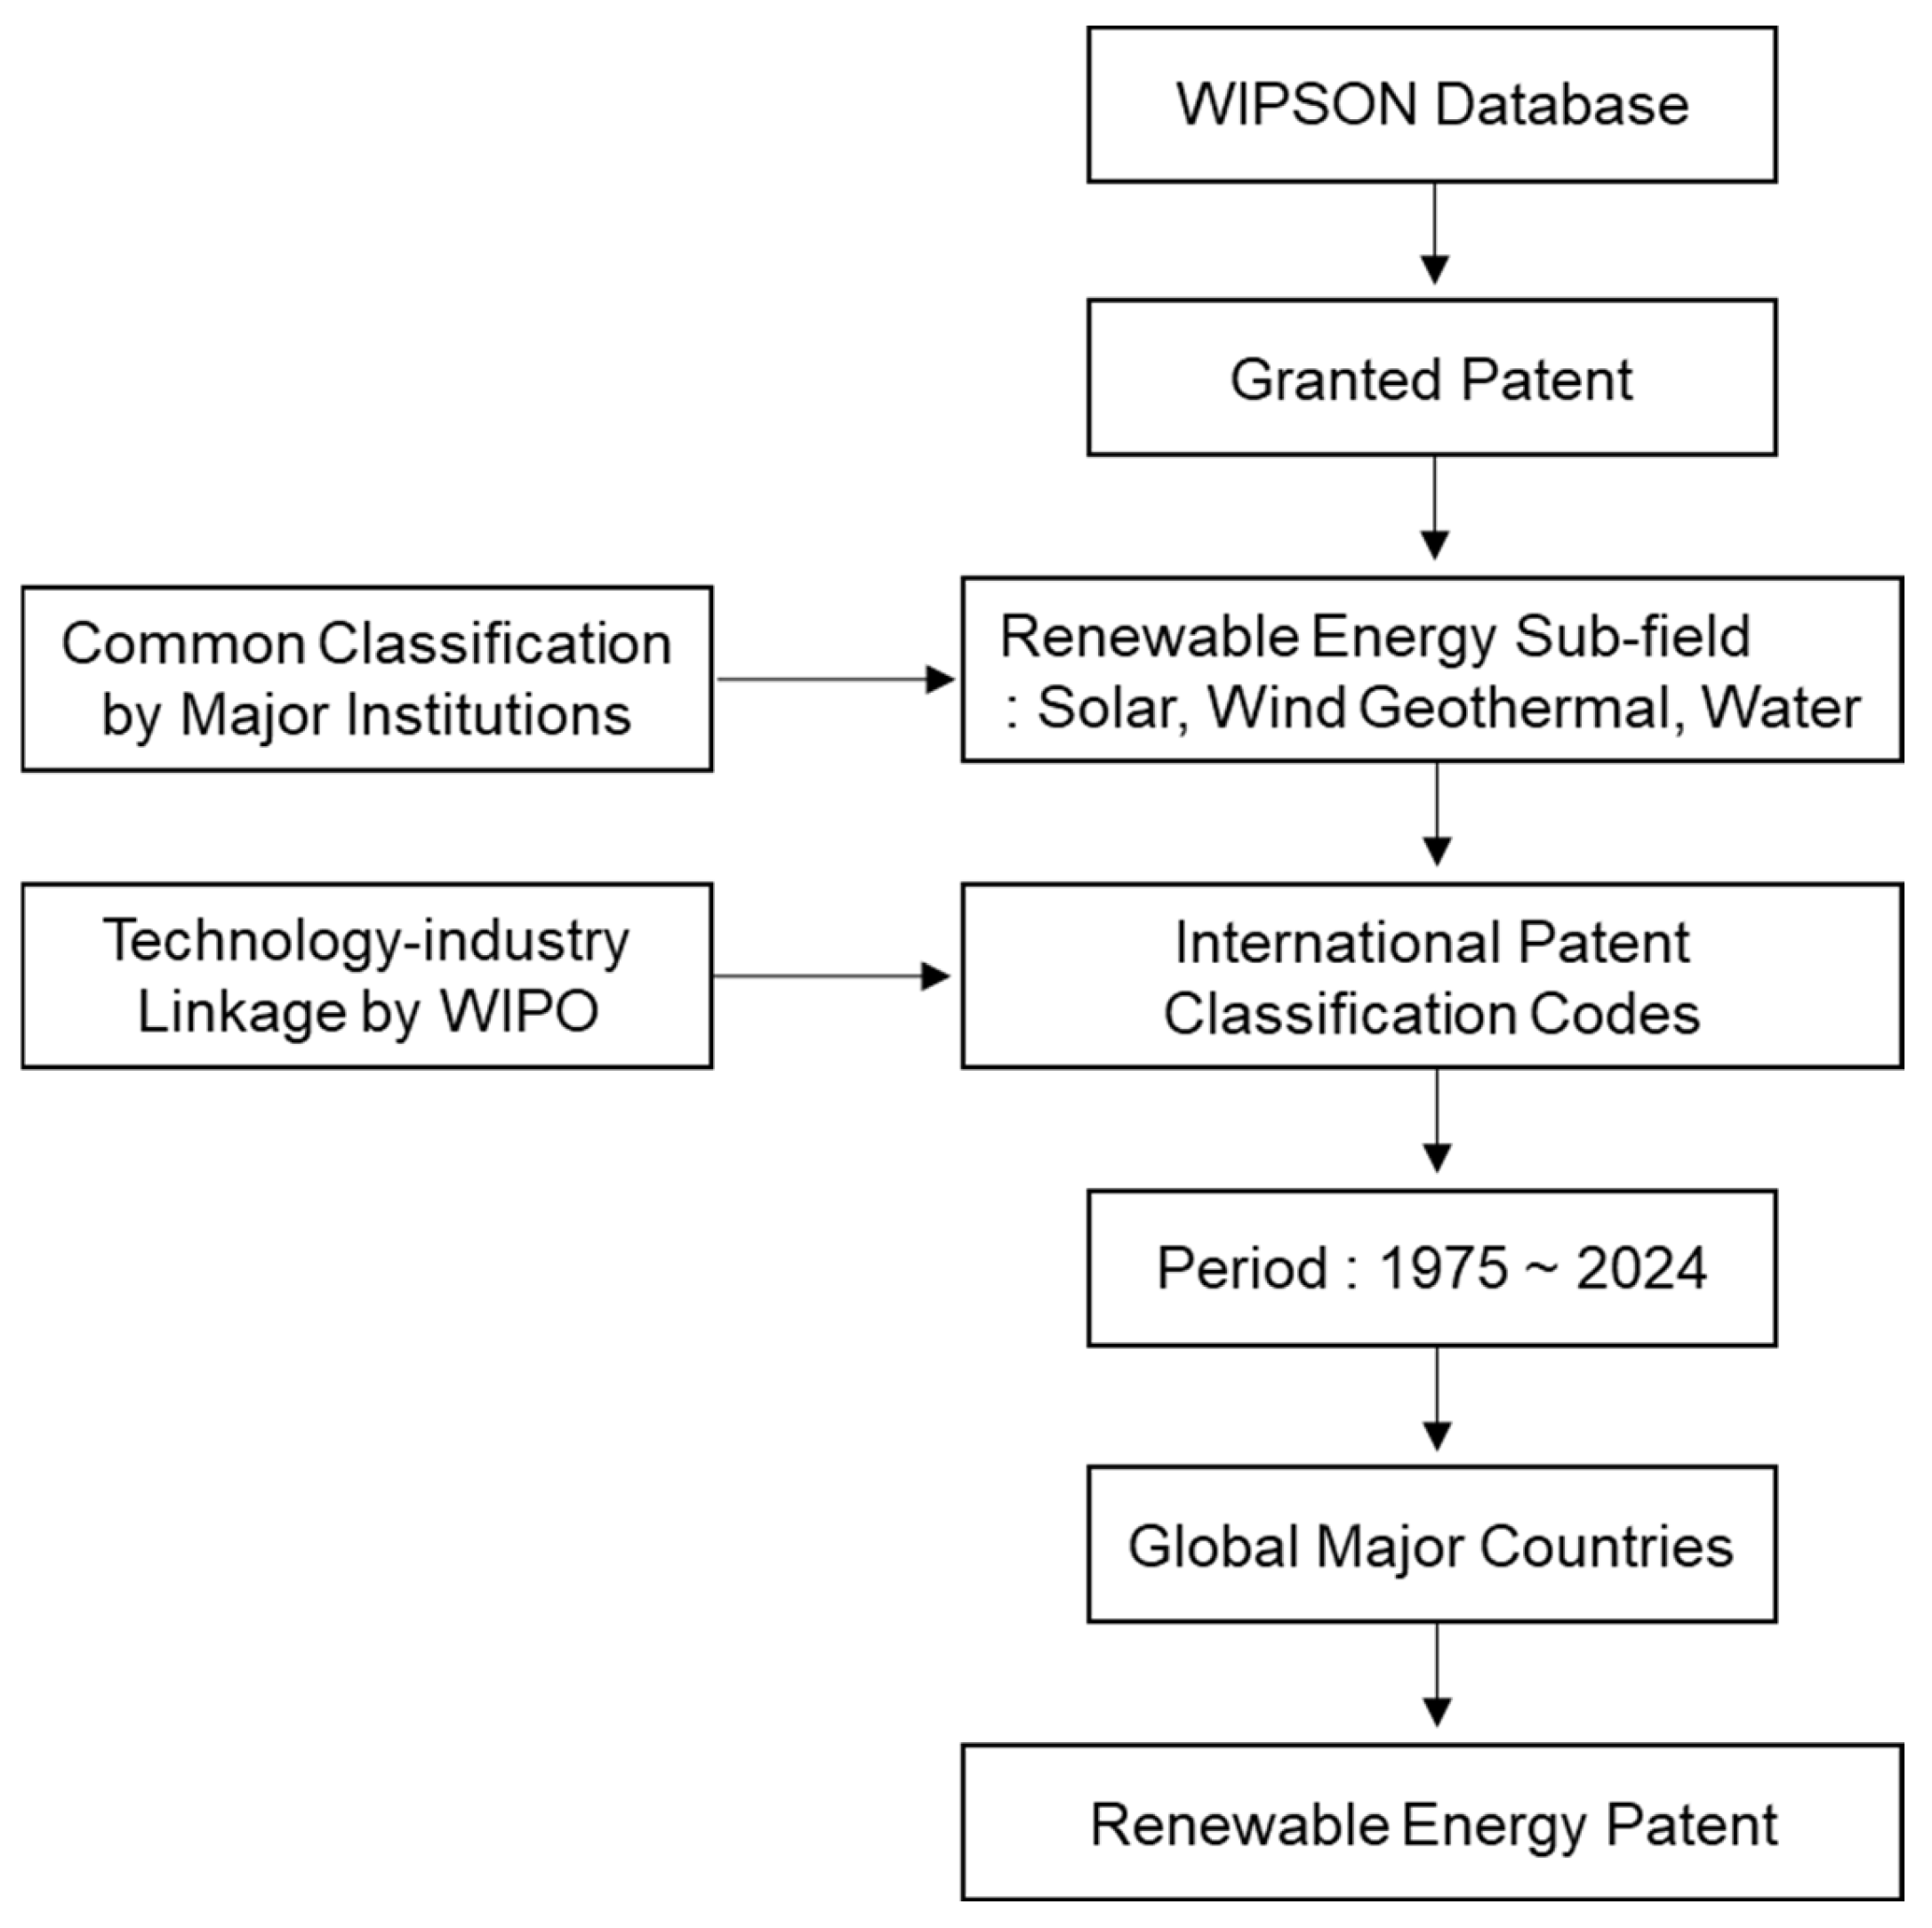
Patent data were gathered according to the procedures illustrated in
Figure 2. As patents simultaneously reflect technological performance and commercial value and carry legal certainty, they constitute a robust primary data source [
89].
All records were retrieved from WIPS ON, a proprietary global database that offers extensive, curated patent data and ready access to detailed fields, such as IPC classifications and citation links [
90]. Although the USPTO and EspaceNet databases are widely used, differences in the national data structures hinder the application of uniform analytical criteria [
91,
92]. In contrast, WIPS ON aggregates over 150 million full-text records, normalizes assignee names across jurisdictions, and supplies granular, readily exportable fields—including IPC subclasses, forward- and backward-citation links, and legal-status events—enabling uniform, cross-country analyses without additional data cleaning. Free services, such as WIPO PatentScope and Google Patents, provide global coverage but lack the depth required for fine-grained analysis [
93].
Patents can be classified as applications, grants, or triadic patents. Applications can still be amended, rejected, or withdrawn, whereas granted patents that have passed substantive examinations exhibit higher technological and commercial viability and ensure analytical consistency [
94]. Triadic patents, limited to grants in the United States, Europe, and Japan, often lag behind emerging technologies and underrepresent other major jurisdictions [
95]. Therefore, this study focused on granted patents as the most reliable basis for evaluating technological competitiveness.
To delineate the analytical scope, this study first conducted a comprehensive review of the classification schemes adopted by leading international energy organizations (the IEA, IRENA, EIA, and the EU). Although each institution applies slightly different taxonomies, they share a set of broadly accepted renewable energy categories [
96]. Where identical technologies were listed separately or redundantly, duplicates were removed; for instance, photovoltaic and solar-thermal technologies—treated independently by some agencies—were consolidated under the single heading of solar-energy technologies. Bioenergy was excluded because its environmental credentials remain disputed (e.g., carbon emissions from wood harvesting and combustion), reflecting the growing emphasis on sustainability criteria in the global energy transition policy. On this basis, four renewable energy domains were selected for analysis: solar, wind, geothermal, and water.
To classify technologies quantitatively, this study relied on IPC codes published by the WIPO. To construct the patent dataset for each renewable energy type, relevant IPC codes were selected based on the WIPO IPC Green Inventory and cross-referenced with classifications used in prior studies. A subsequent manual validation process, conducted in consultation with domain experts, involved filtering out overly broad or marginally relevant codes to ensure the final dataset reflected technology-specific and directly related patents. IPC provides a globally harmonized taxonomy that structures technical content for comparative and statistical analyses. As summarized in
Table 1, the IPC codes corresponding to the four focal domains (solar, wind, geothermal, and water) were extracted, enabling consistent cross-national comparisons of technology concentration and patent performance.
The dataset comprised all granted patents filed between 1975 and 2024. The mid-1970s marked the point at which major patent offices began digitizing records to ensure reliable and consistent data [
97]. A long-term horizon is also essential for tracking shifts in technological trajectories and periods of intensified activity [
98], while the inclusion of the most recent grants captures cutting-edge developments.
Five nations with pivotal roles in the global energy market were selected: the United States, the European Union, Japan, China, and Korea. These countries exert a significant influence on energy production, consumption, and renewable energy investments, making them suitable comparators [
99]. Collectively, these five nations command the lion’s share of renewable energy installations, channel the bulk of global clean-energy R&D investment, and export policy frameworks that other countries replicate—making them the most influential reference group for cross-national comparisons of technological competitiveness. In this study, patents are attributed to countries based on the jurisdiction of the priority filing office. This method ensures consistency across the full time span of the dataset (1975–2024) and avoids double-counting by considering only the earliest filing within each patent family.
Using the scope and criteria above, we retrieved 194,485 granted patents. Solar technologies dominated with 119,721 patents, followed by wind (38,724), geothermal (19,524), and water technologies (16,516). The marked variation in patent volumes underscores divergent R&D emphasis across the four domains. This dataset enables a nuanced comparison of the overall industry trends and domain-specific patterns of technological competitiveness.
3.3. Procedure for Trends Analysis
To capture the overarching patent trends in renewable energy, this study followed a stepwise procedure. First, the total granted patents were aggregated by filing year to chart temporal growth and decline. Next, patents were disaggregated by technology domain to identify the fields driving the expansion. Time- and field-specific market share calculations were then used to quantify surges in particular years and shifts in the relative standing of each domain. To clarify the evolving competitive landscape, national trends were examined by comparing the annual patent trajectories of the five nations. Finally, IPC subclasses were used to map the granularity of technological diversification within solar, wind, geothermal, and water, revealing the growth paths and concentrations of core technology clusters. These trend metrics formed a systematic baseline for the subsequent patent- and technology portfolio analyses. In this study, a “surge” is operationally defined as a year-on-year increase in granted-patent counts sustained for at least three consecutive years or a notable peak appears, whereas a “shift in relative standing” refers to a change of two or more rank positions in the domain-specific global patent leaderboard within a rolling five-year window.
3.4. Procedure for Patent Portfolio Analysis
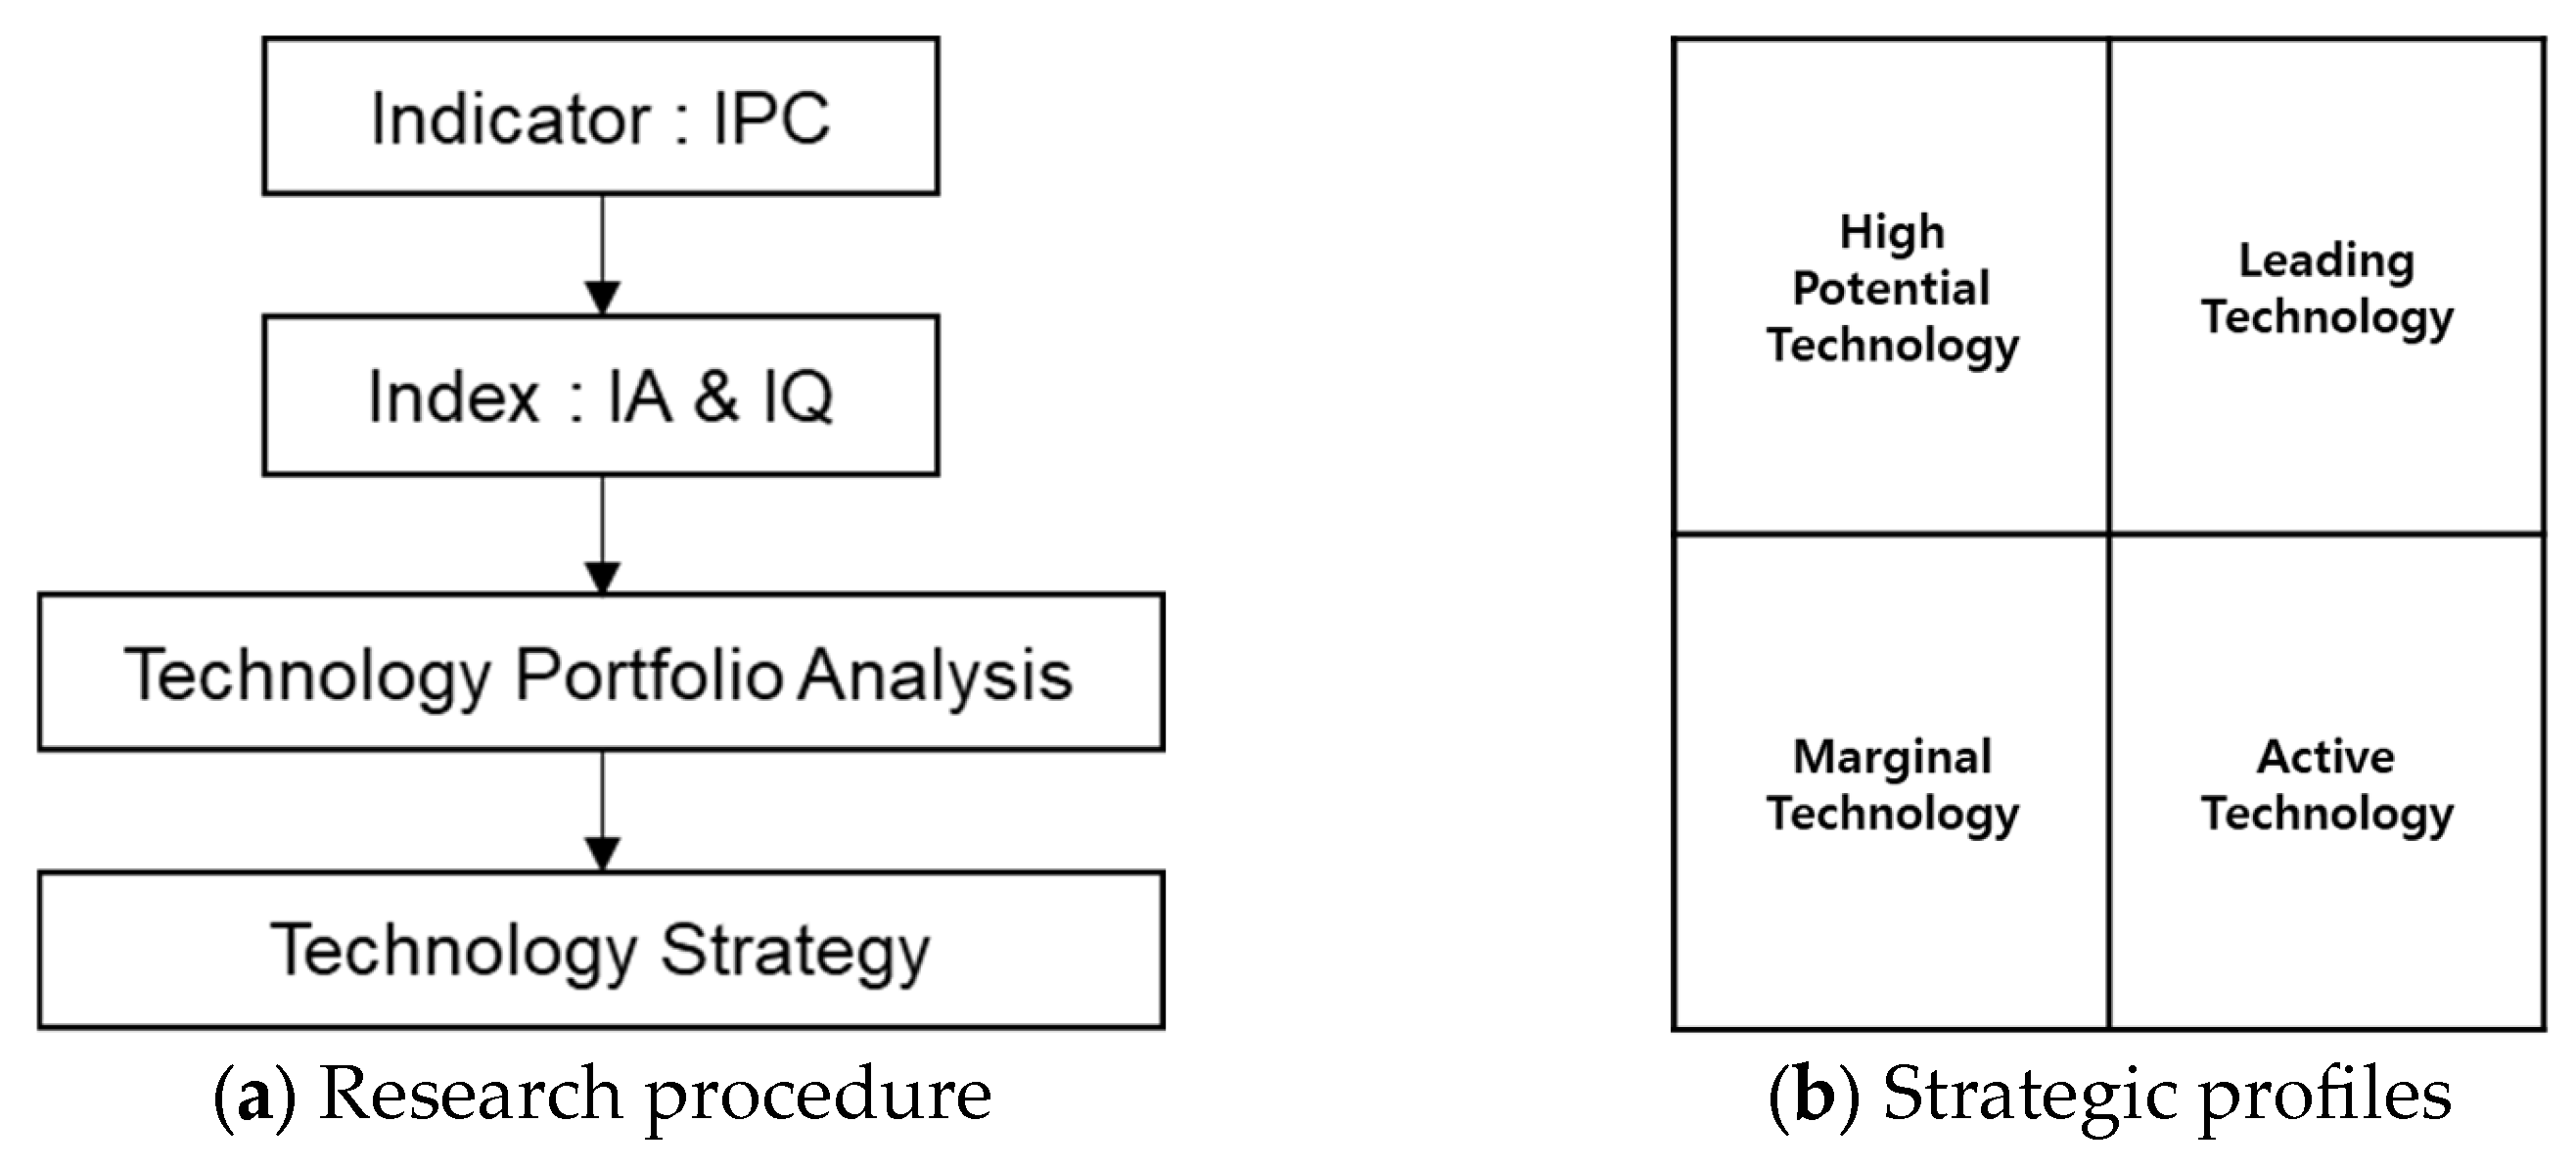
As shown in
Figure 3a, the patent portfolio analysis for gauging national competitiveness in renewable energy technologies begins by filtering the pool of granted patents to retain only those relevant to the study. National performance was benchmarked using the four indicators listed in
Table 2.
Patent count captures the scale of inventive activity in each field; therefore, a larger portfolio suggests a stronger strategic focus. The average number of claims per patent represents the legal breadth and strength of the protection; broader claim sets imply more robust market exclusivity. The forward citation ratio serves as a proxy for technological impact because frequent citations indicate that later inventors build on patented knowledge. Finally, the patent–family ratio gauges economic value by measuring how widely protection is sought across jurisdictions, signaling greater international commercial potential [
100,
101,
102].
Taken together, these metrics quantify patent activity and quality, enabling a comparative assessment of each country’s technological competitiveness. Plotting activity on the horizontal axis and quality on the vertical axis produces a scatter diagram that visually positions the countries for direct comparison. Depending on their coordinates, nations fall into one of four strategic profiles: technology leaders, high-potential players, activities, or passive players, as illustrated in
Figure 3b.
The quantity score was derived from the number of granted patents, calculated as each country’s deviation from the total average. The quality score was computed as the average deviation from the total mean across three indicators: number of claims, forward citations, and patent family size. All values were normalized to ensure comparability across countries and scaled to a uniform range.
Countries located in the “activities” quadrant (bottom right of
Figure 3b) demonstrate relatively high levels of patenting activity, but their patents tend to have fewer claims, lower citation counts, or smaller family sizes, resulting in below-median quality scores. This profile typically represents nations that are actively engaged in renewable energy technology development yet whose innovations may be incremental, domestically oriented, or still in the process of gaining international recognition. These countries are often in a stage of expanding their R&D capacity and contributing to the diffusion of applied technologies.
3.5. Procedure for Technology Portfolio Analysis
As
Figure 4a illustrates, technology portfolio analysis proceeds stepwise to diagnose each country’s strengths and weaknesses in renewable energy technologies and to gauge the concentration of effort across subsectors. Granted patents are first grouped by IPC code, and patent activity and quality metrics are calculated to reveal the technical areas prioritized by the nations and the value those technologies are likely to generate. While patent portfolio analysis compares countries’ relative advantages, technology portfolio analysis focuses on the intrinsic value of a country’s key technologies and their potential synergies. Using the IPC codes listed in
Table 3, patent counts served as an activity metric, indicating the scale of investment and R&D intensity in each field. Quality was assessed across three dimensions. From a legal perspective, a broader claim scope implies stronger market protection. Technological quality was proxied by the forward citation ratio, which indicates whether a technology is pivotal to subsequent research and patenting. Economic quality was captured by the patent–family ratio, reflecting the extent to which the same invention is protected in multiple jurisdictions and, thus, its prospects for international commercialization [
27,
103].
Plotting activity on the horizontal axis and quality on the vertical axis produces a scatter map that systematically highlights the competitive advantages and vulnerable areas within each country’s portfolio. Cross-country comparisons can then identify opportunities for collaboration, while the quadrant positions—leading technology, high-potential technology, active technology, and marginal technology, as shown in
Figure 4b, inform future R&D investment priorities and policy decisions. Using both tools creates a macro-to-micro lens: patent portfolio analysis benchmarks countries, while technology portfolio analysis pinpoints IPC-level niches—together exposing hidden high-quality fields and over-concentration risks that either method would miss on its own.
4. Results
4.1. Results of the Trend Analysis
4.1.1. Results of Renewable Energy Patent Trends
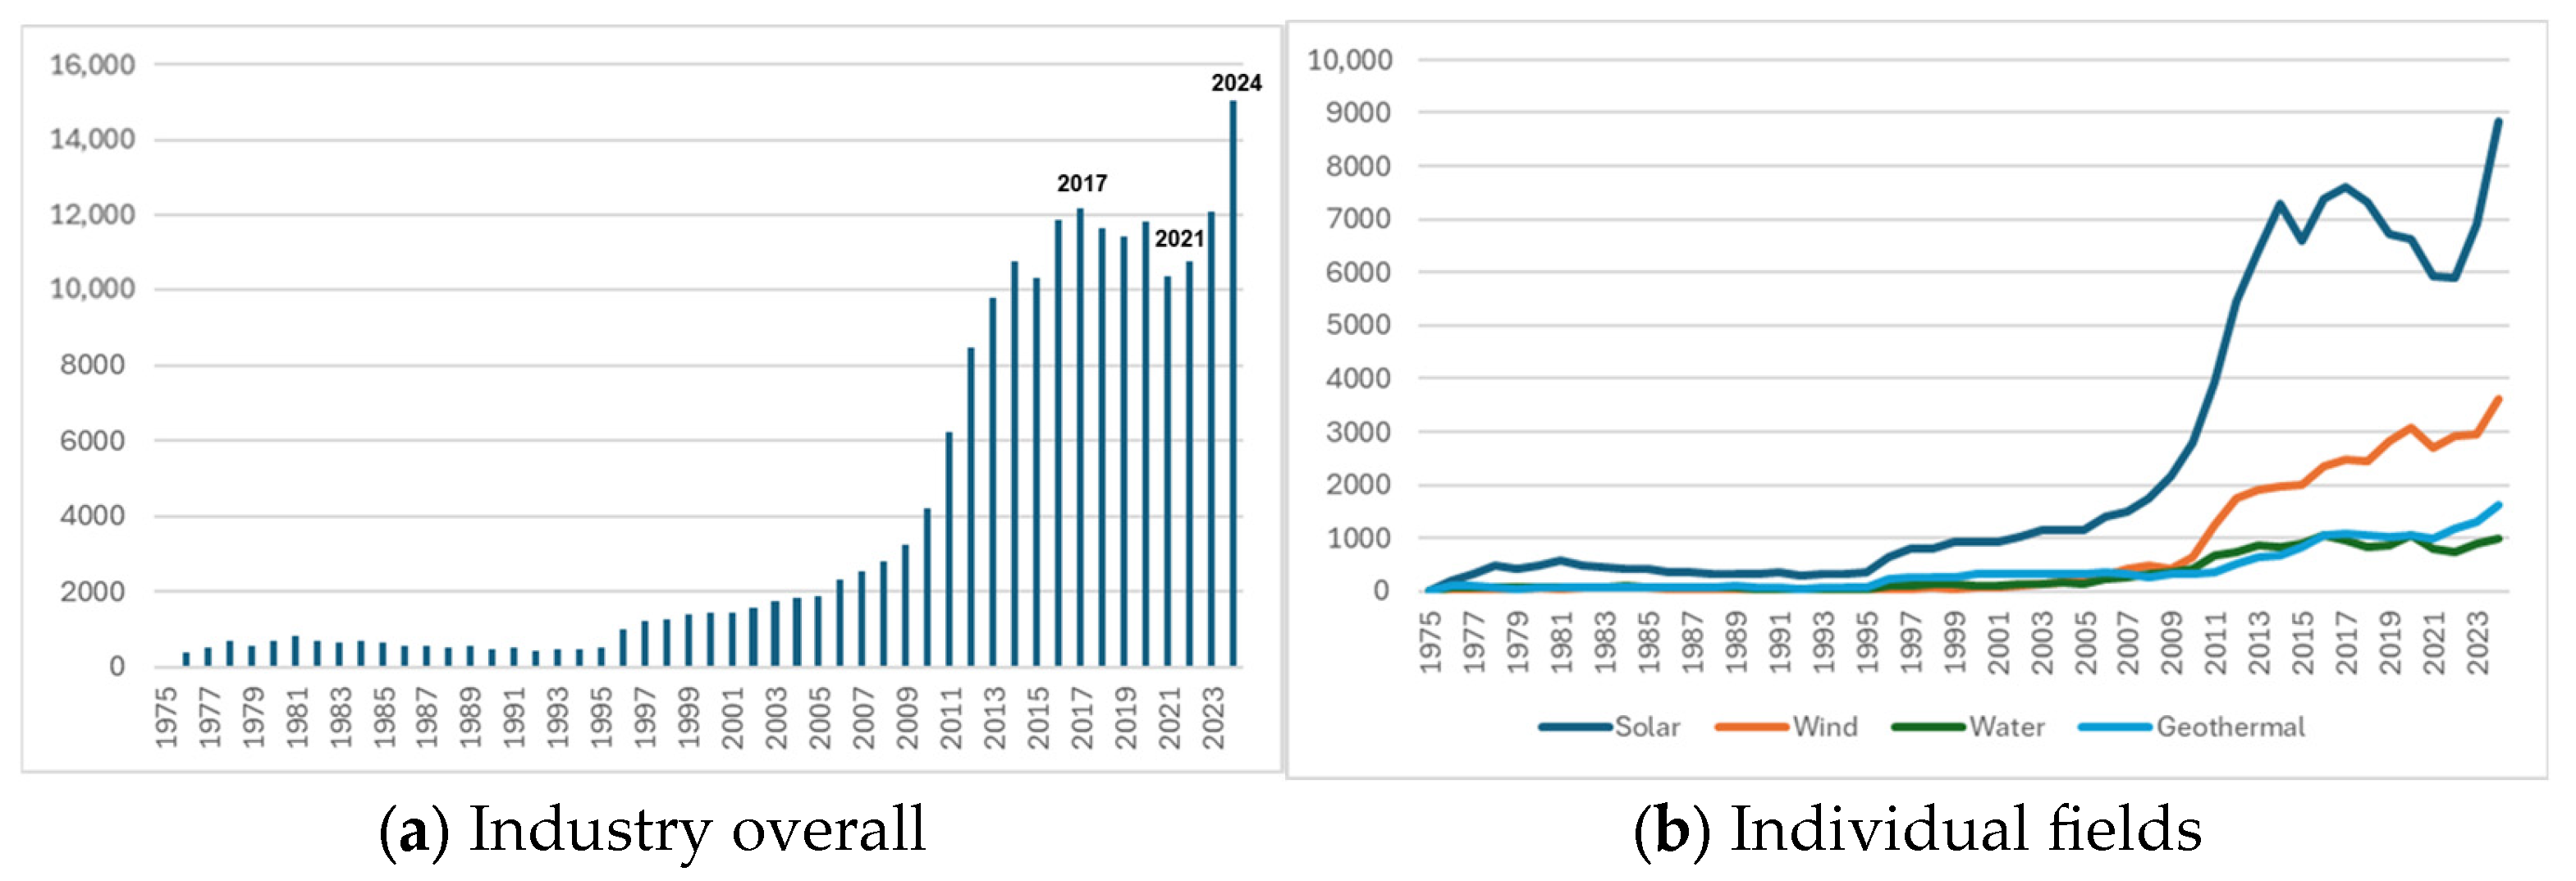
Patents granted for renewable energy increased sharply after 2010. As shown in
Figure 5a, the activity peaked in 2017 and again in 2024, with a temporary dip in 2021. The surge in 2024 underscores renewed momentum in the field. The surge in 2024 underscores renewed momentum in the field, driven largely by recent policy incentives, technological breakthroughs, and strengthened international collaboration. Although digitized records prior to 1975 are sparse, the data suggest that patenting remained modest throughout the 1980s, began to climb in the 1990s, and accelerated markedly from the early 2000s onward, an upswing that continued through the 2010s.
As shown in
Figure 5b, the domain view reveals distinct trajectories. Solar patents, which were virtually flat until the early 2000s, soared after 2010, slipped briefly around 2018, and rebounded strongly in 2024. Wind patents have followed a steadier trend, with a gradual increase since the 2010s. Geothermal and water technologies demonstrate comparatively stable growth, maintaining consistent, albeit smaller, annual patent counts.
The intervals in
Table 4 were aligned with major policy milestones—such as the Kyoto Protocol (2005–2012) and the implementation phase of the Paris Agreement (2016–2020)—to contextualize significant technological and policy-driven shifts, including the dramatic patent growth observed from 2020 to 2024. As listed in
Table 4, breaking the timeline into intervals highlights the shift in research intensity. Only 3 percent of all patents date from 1975 to 1984, but the share increases steadily thereafter. From 2000 to 2009, patents accounted for more than 10 percent of the total; between 2010 and 2019, roughly 20–30 percent were filed, and from 2020 onward, 30.9 percent of all patents were granted, indicating unprecedented R&D activity in recent years.
As listed in
Table 5, the domain further underscores solar dominance. Solar technologies account for approximately 62 percent of all granted patents, followed by wind at 20 percent. Geothermal and water technologies contribute approximately 10 percent and 8 percent, respectively, confirming substantial disparities in patenting emphasis across renewable energy subsectors. These figures reinforce earlier trend observations—for instance, the high volume of solar patents aligns with major increases in global R&D funding and breakthroughs in photovoltaic efficiency, indicating that patent growth closely tracks technological and investment momentum in the sector.
4.1.2. Results of Country-Specific Patent Trend
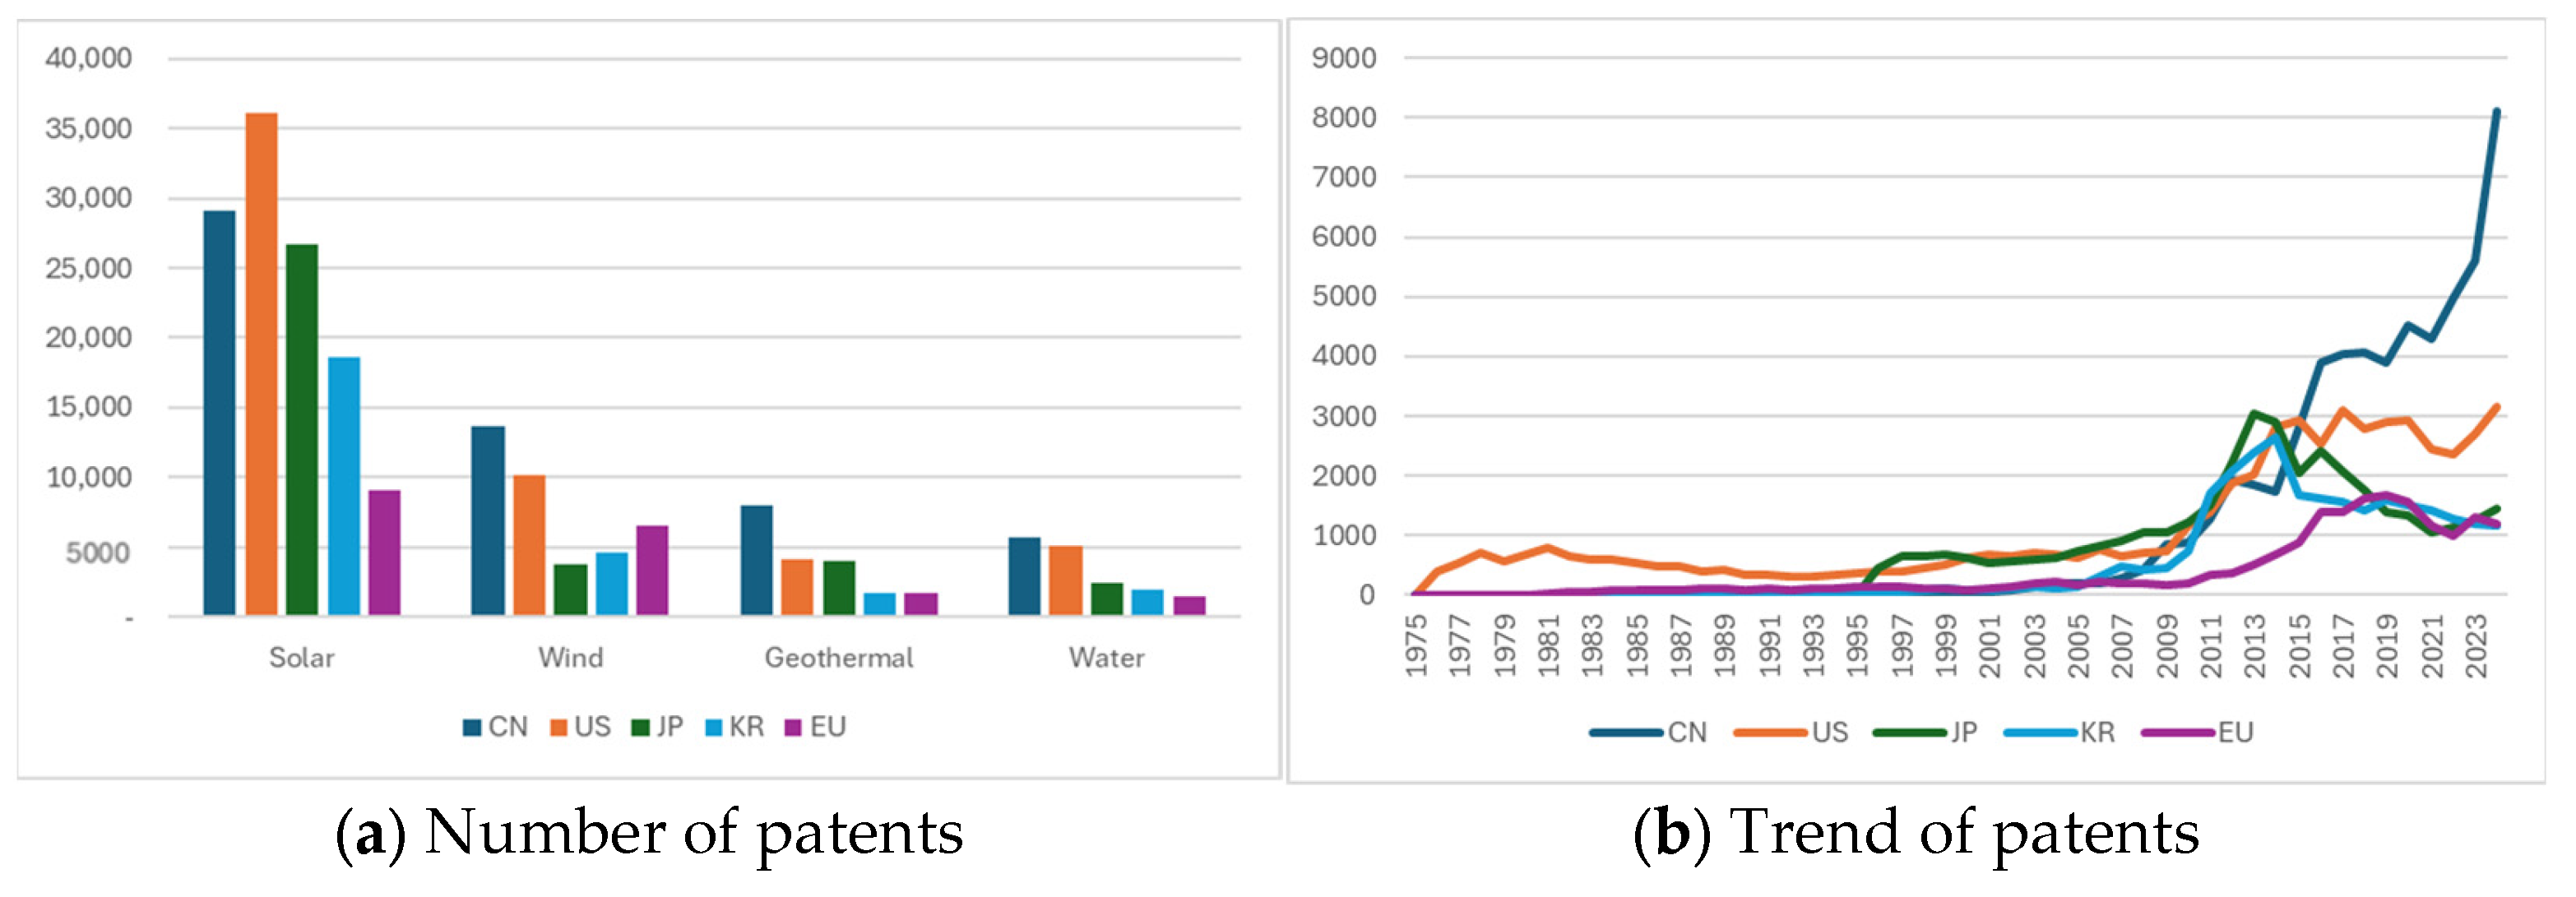
As shown in
Table 6, China and the United States hold the largest shares of renewable energy patents, whereas Japan and Korea maintain sizeable portfolios. Solar technology dominates patenting activity in every country, as shown in
Figure 6a, with strong engagement in the United States, China, and Japan. Wind patents are concentrated in China and the United States, whereas geothermal and water technologies attract far fewer filings overall, although China still leads in these two fields.
Taken together, these patterns indicate that the United States and China have set the pace of global renewable energy patent competitiveness, followed by Japan, Korea, and Europe. Solar energy remains the most active arena worldwide; wind activity is particularly pronounced in China and the United States, and both geothermal and water technologies continue to witness relatively modest levels of patenting.
Country-specific growth trajectories, illustrated in
Figure 6b, reinforced this hypothesis. China has posted the steepest rise in patent counts over the past decade, whereas the United States, which was already active in its early years, has steadily expanded its portfolio and consolidated its technological leadership. Europe has shown a gradual but stable increase, whereas Japan and Korea experienced rapid growth from the mid-2000s before leveling off or declining slightly after 2015.
4.1.3. Results of Technology-Specific Patent Trends
A hierarchical review of the IPC codes, as shown in
Table 7, confirms that solar technology has exhibited the most intense patent activity to date. Solar patents dominate every IPC tier (section, class, and subclass) and branch into 294 distinct subgroups, reflecting an exceptional technological breadth. Wind technology features fewer IPC codes overall but shows a strong concentration in selected niches. Geothermal and water technologies display still fewer codes; while both possess a modest spread at the subclass and main-group levels, they diversify only minimally at the subgroup tier.
As shown in
Figure 7a, in the solar domain, semiconductor-based solar cell fabrication (H01L) and power conversion systems (H02S) experienced explosive growth around 2010, dominating the market. H01L surged sharply in the early 2010s, peaked around 2015, and dipped briefly before rebounding in recent years. H02S also rose markedly from the mid-2010s onward, establishing itself as a critical supporting technology for photovoltaic systems. In contrast, construction and installation technologies (E04D) and solar thermal heating systems (F24D, F24S) account for a smaller share overall but have exhibited steady, gradual growth.
In the wind domain, as shown in
Figure 7b, wind turbine and generation systems (F03D) lead overwhelmingly, entering a robust growth phase after 2005, spiking around 2010, and continuing to climb—most recently with renewed momentum. Other subclasses—design and installation (B63B), civil construction (E04H), efficiency improvement (H02K), control systems (B60L), and propulsion units (B60K)—remain smaller in absolute terms but display a consistent upward trajectory.
In geothermal technologies, as illustrated in
Figure 7c, building heating and hot water systems (F01K, F24F) drove market expansion, with F01K showing a pronounced rise from 2010 to 2017 before plateauing and then resuming growth and F24F following a similar pattern to reach comparable levels. By contrast, pipework and plant engineering (F25B), heat transfer and storage systems (F24T), and other auxiliary technologies (H02N and F03G) grew steadily over the same period.
Finally, in water technologies, as shown in
Figure 7d, hydropower devices and systems (F03B) have exhibited clear growth since 2005, especially through the mid-2010s, and have maintained high activity with indications of a recent rebound. Water-resource management and civil-engineering technologies (E02B, B63H) show a gentler increase and hold a limited market share, while auxiliary subclasses (F03C, F03G, F16K) follow a similar supportive, incremental growth trend.
4.2. Results of Patent Portfolio Analysis
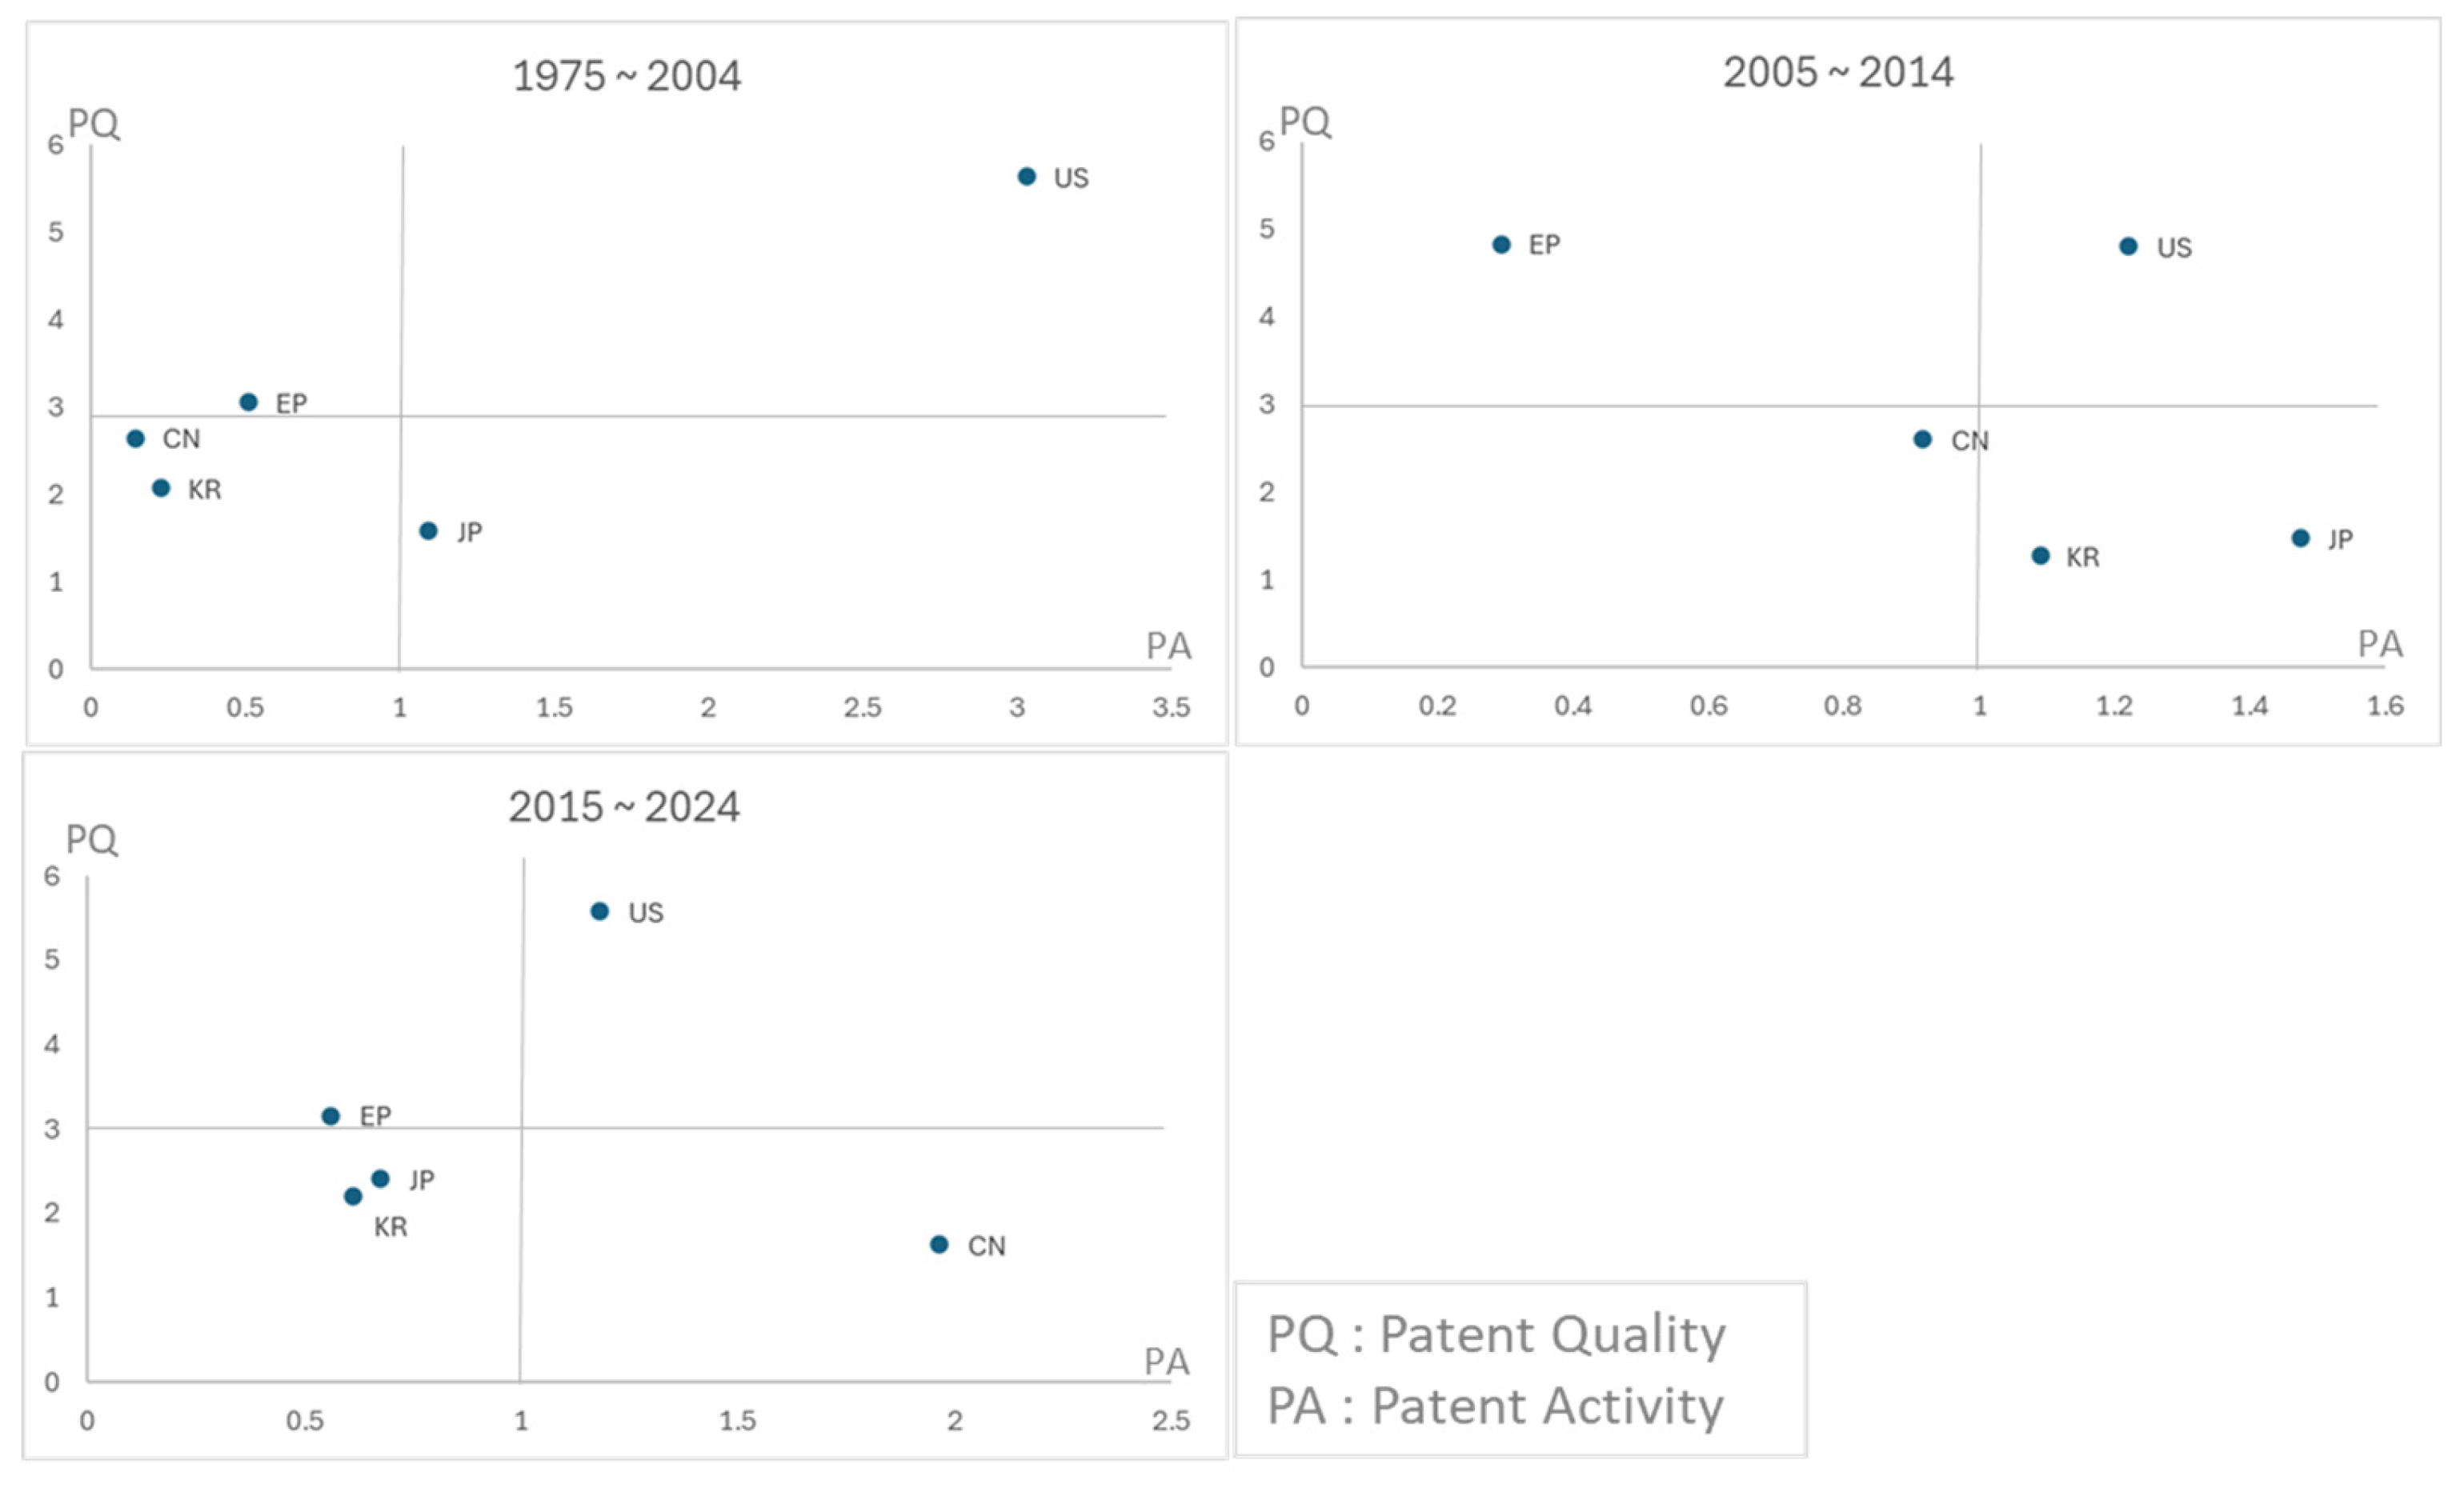
Patent activity shows the scale of innovation, while patent quality reflects impact. For instance, China leads in volume, but the U.S. shows stronger citation performance—highlighting the need to balance quantity with quality in future R&D and industrial strategies. As shown in
Figure 8 and
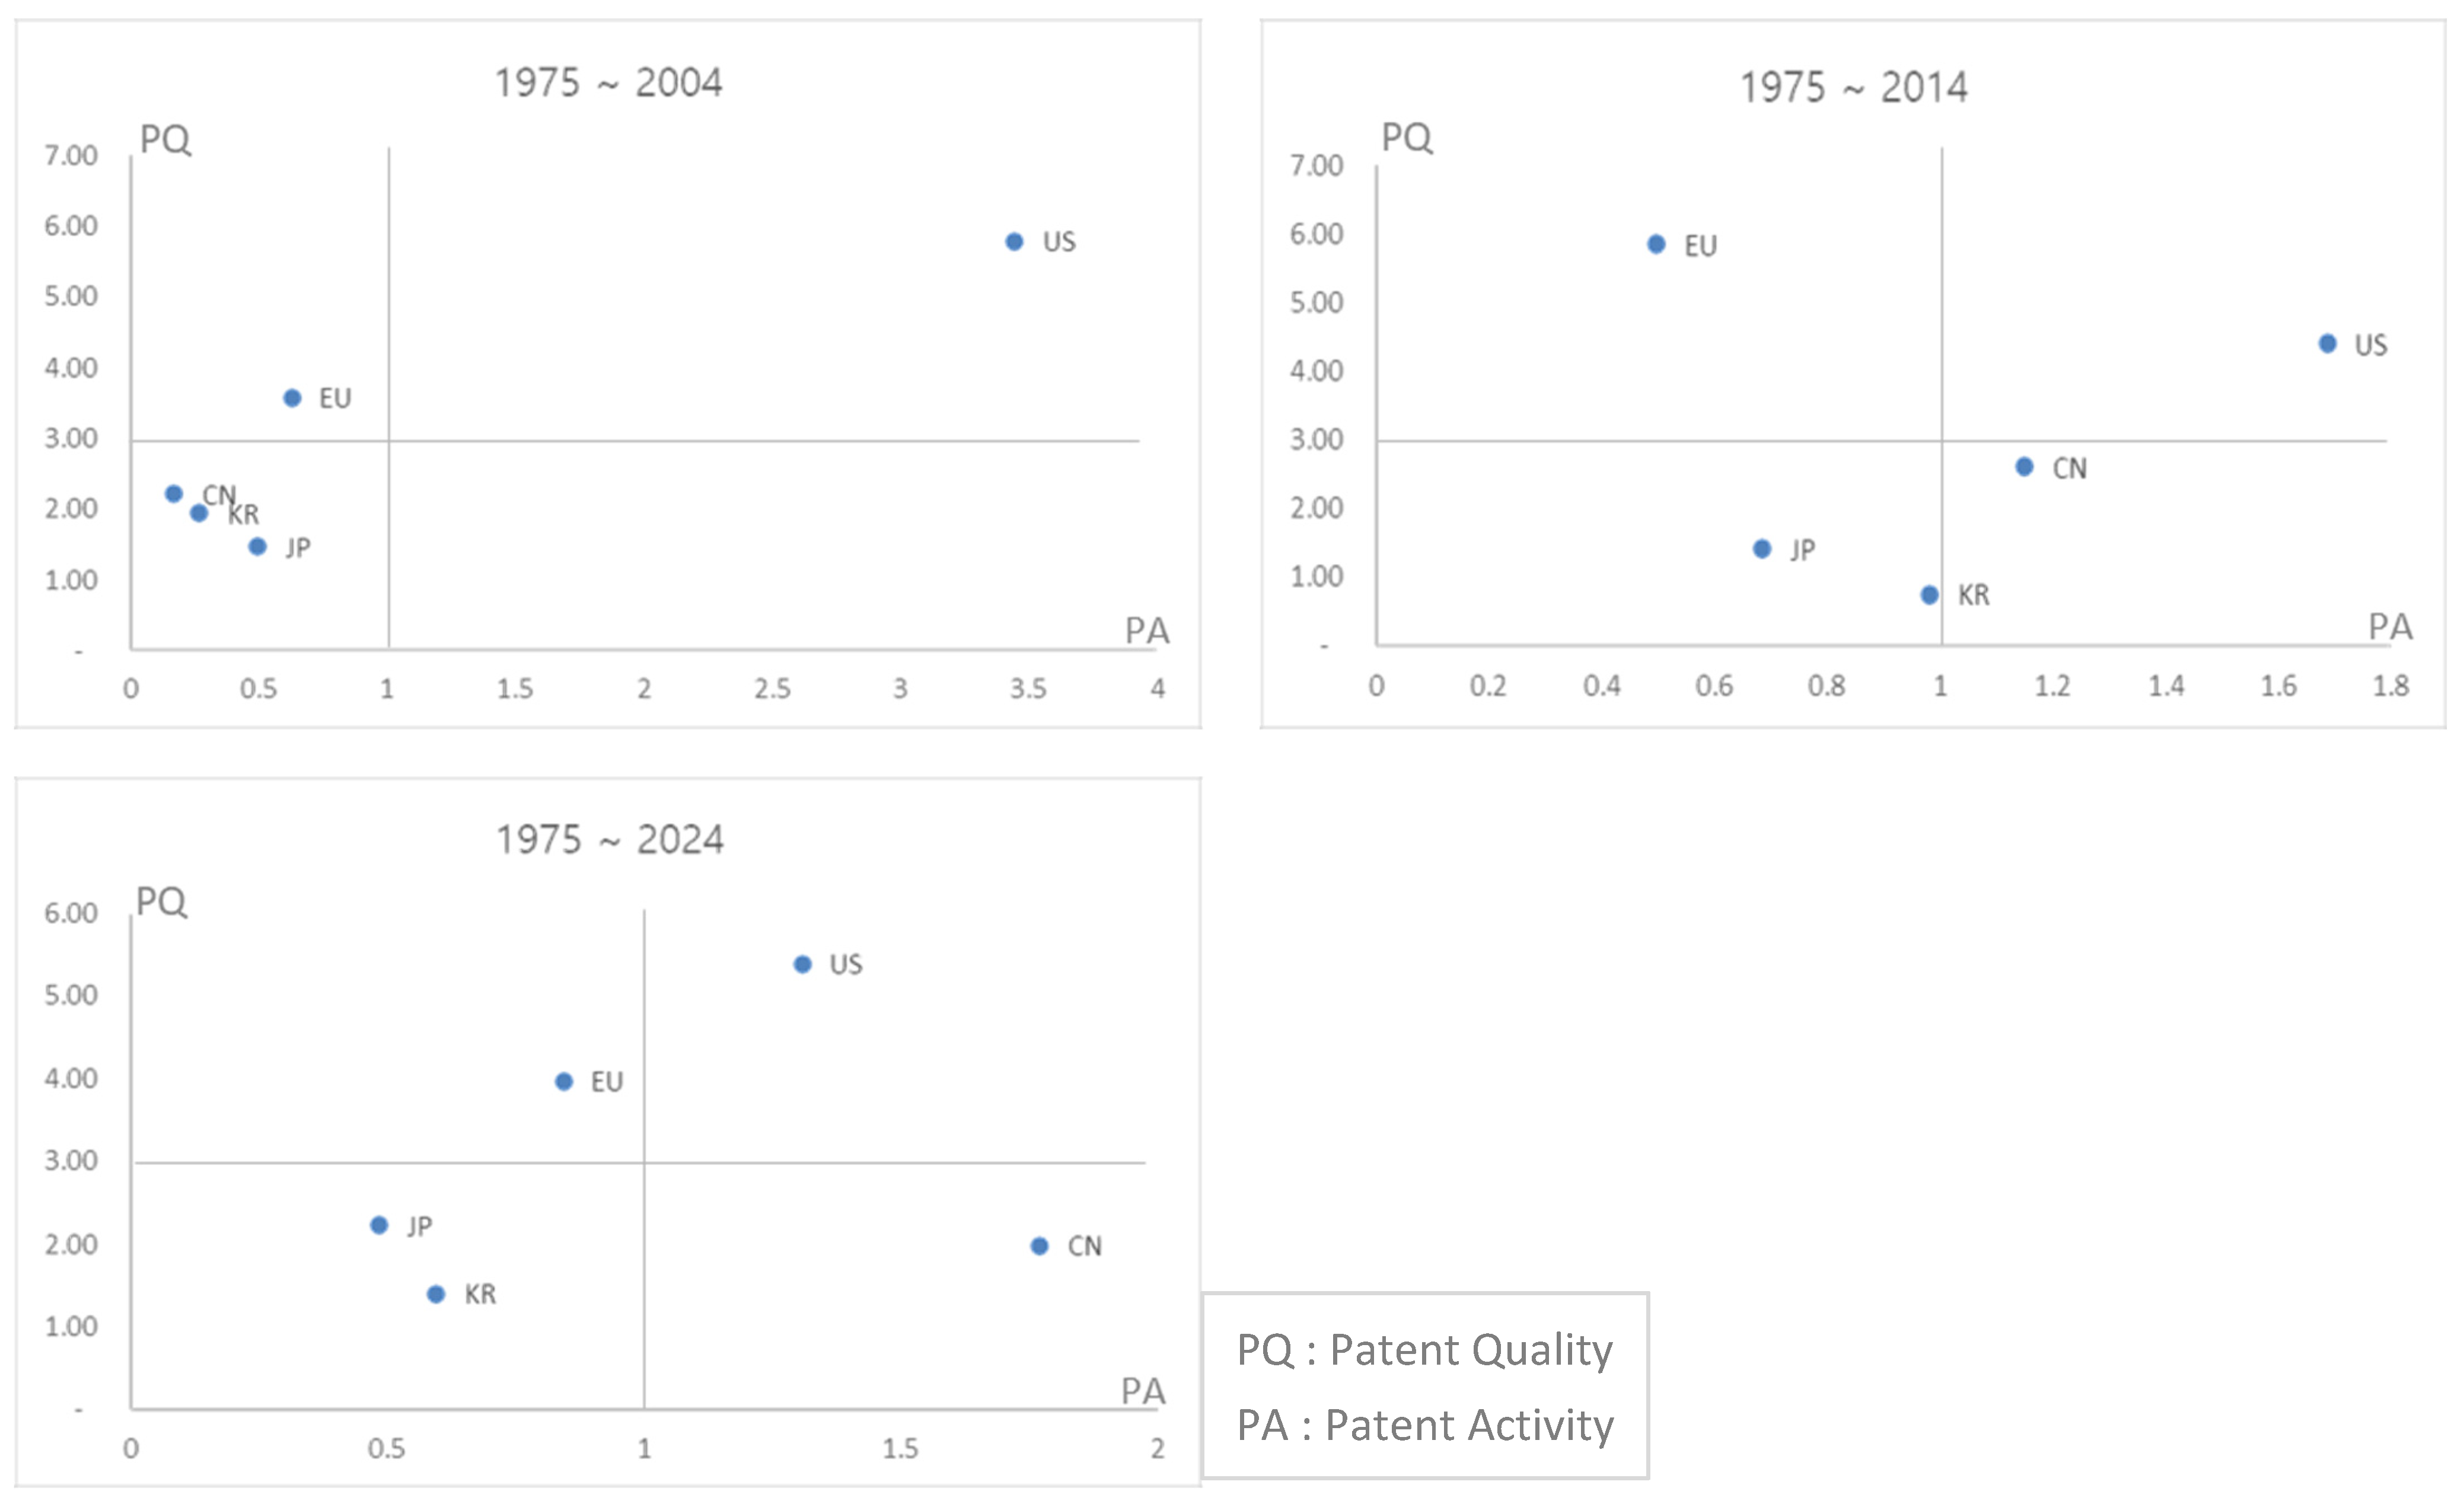
Appendix A Table A1, the patent portfolio analysis for the renewable energy sector positions the United States as the Technology Leader; from 2004 to 2024, it maintained high scores on both patent activity and quality, effectively steering global innovation. China and Japan fall into the Activity quadrant. China remained a Passive Player until approximately 2004, but its activity rose sharply around 2014, reaching a level comparable to the United States by 2024, although quality indicators still lagged. Japan recorded substantial activity until 2014, after which its momentum tapered. Europe is classified as having High Potential, sustaining consistently strong patent quality despite modest volumes. Korea exhibited low activity and quality throughout the period; although it continued to add patents, qualitative improvement has been slow.
To address historical asymmetries in intellectual property systems—particularly China’s limited patent infrastructure prior to the 1990s—the analysis was additionally conducted using the following revised temporal segmentation: 1975–2004, 2005–2014, and 2015–2024, as indicated in
Figure 9. These intervals allow for a more balanced and context-sensitive comparison across countries. The results based on this segmentation have been incorporated to enhance interpretability and reduce structural bias in cross-national comparisons.
A technology-specific comparison of the solar domain, presented in
Appendix A Figure A1, again confirms the United States as the leading country, maintaining a wide gap with its rivals across the entire 1975–2024 period. China, once in a low position, experienced a surge in patent activity around 2014, eventually rivaling the United States in terms of volume, although its average quality remains low. Europe files fewer solar patents but retains high quality. Japan’s activity declined after 2014, and Korea, while growing gradually, still trails far behind the United States and China.
In the wind domain (
Appendix A Figure A2), the United States leads along both axes. China has dramatically increased its number of patent filings; however, it must still improve its technological quality. Europe’s activities have eased slightly, yet its patents remain of high quality. Japan, once ahead of Korea in both volume and quality, has recently slipped to a level similar to that of Korea; Korea shows some improvement in quality but continues to lag well behind the United States, Europe, and an increasingly dominant China.
The geothermal results (
Appendix A Figure A3) show that the United States has consistently maintained high activity and quality, reflecting the steady patenting of power generation and heat recovery systems. Europe, although filing fewer patents, scores well on quality and occupies a high-potential quadrant. China’s activity has grown since 2014 but still leaves room for qualitative gains. Japan and Korea have conducted limited research on geothermal technologies, and both activity and quality remain low relative to the front-runners.
Finally, water (
Appendix A Figure A4) again places the United States at the forefront, combining high patent volumes with strong quality, particularly in large-scale infrastructure, such as dams, gates, and turbines. Europe sustains high quality but is now focusing more on maintenance and efficiency upgrades than on new mega-projects. China’s filings are rising alongside large hydrofacility construction, yet further investment is needed to enhance technical sophistication. Japan and Korea, which have comparatively low activity and quality, fall under the passive-player category.
4.3. Results of Technology Portfolio Analysis
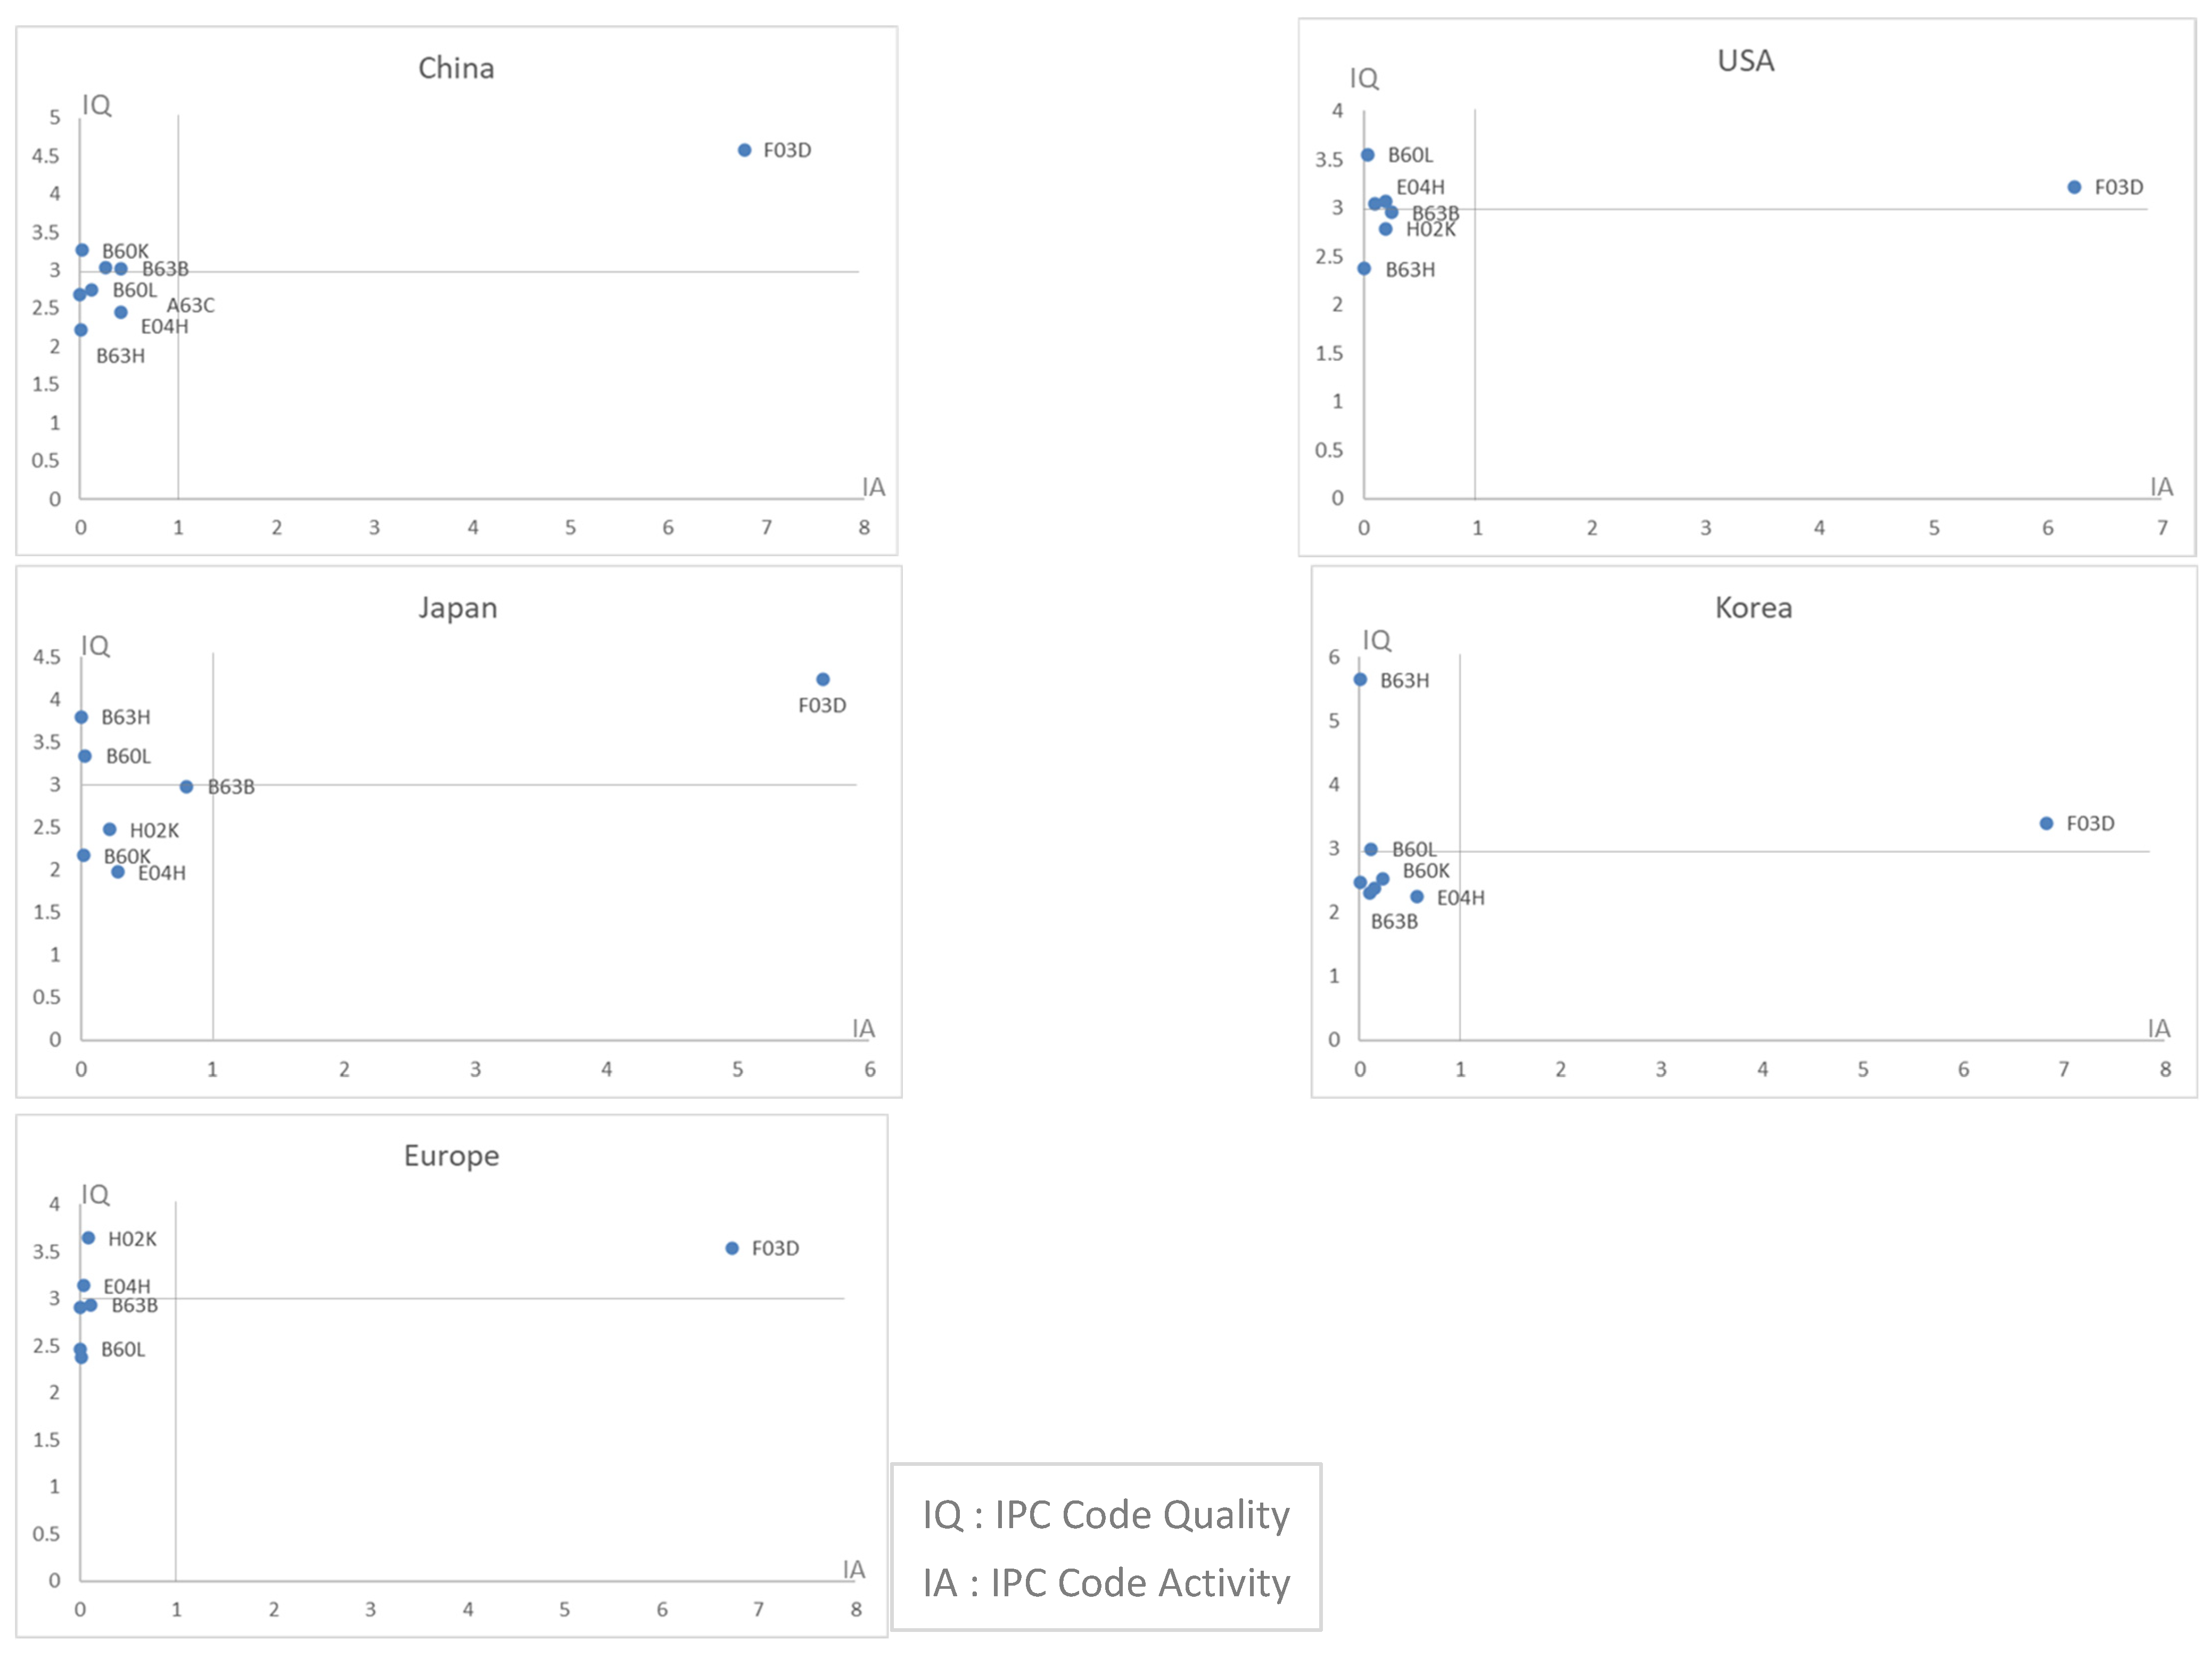
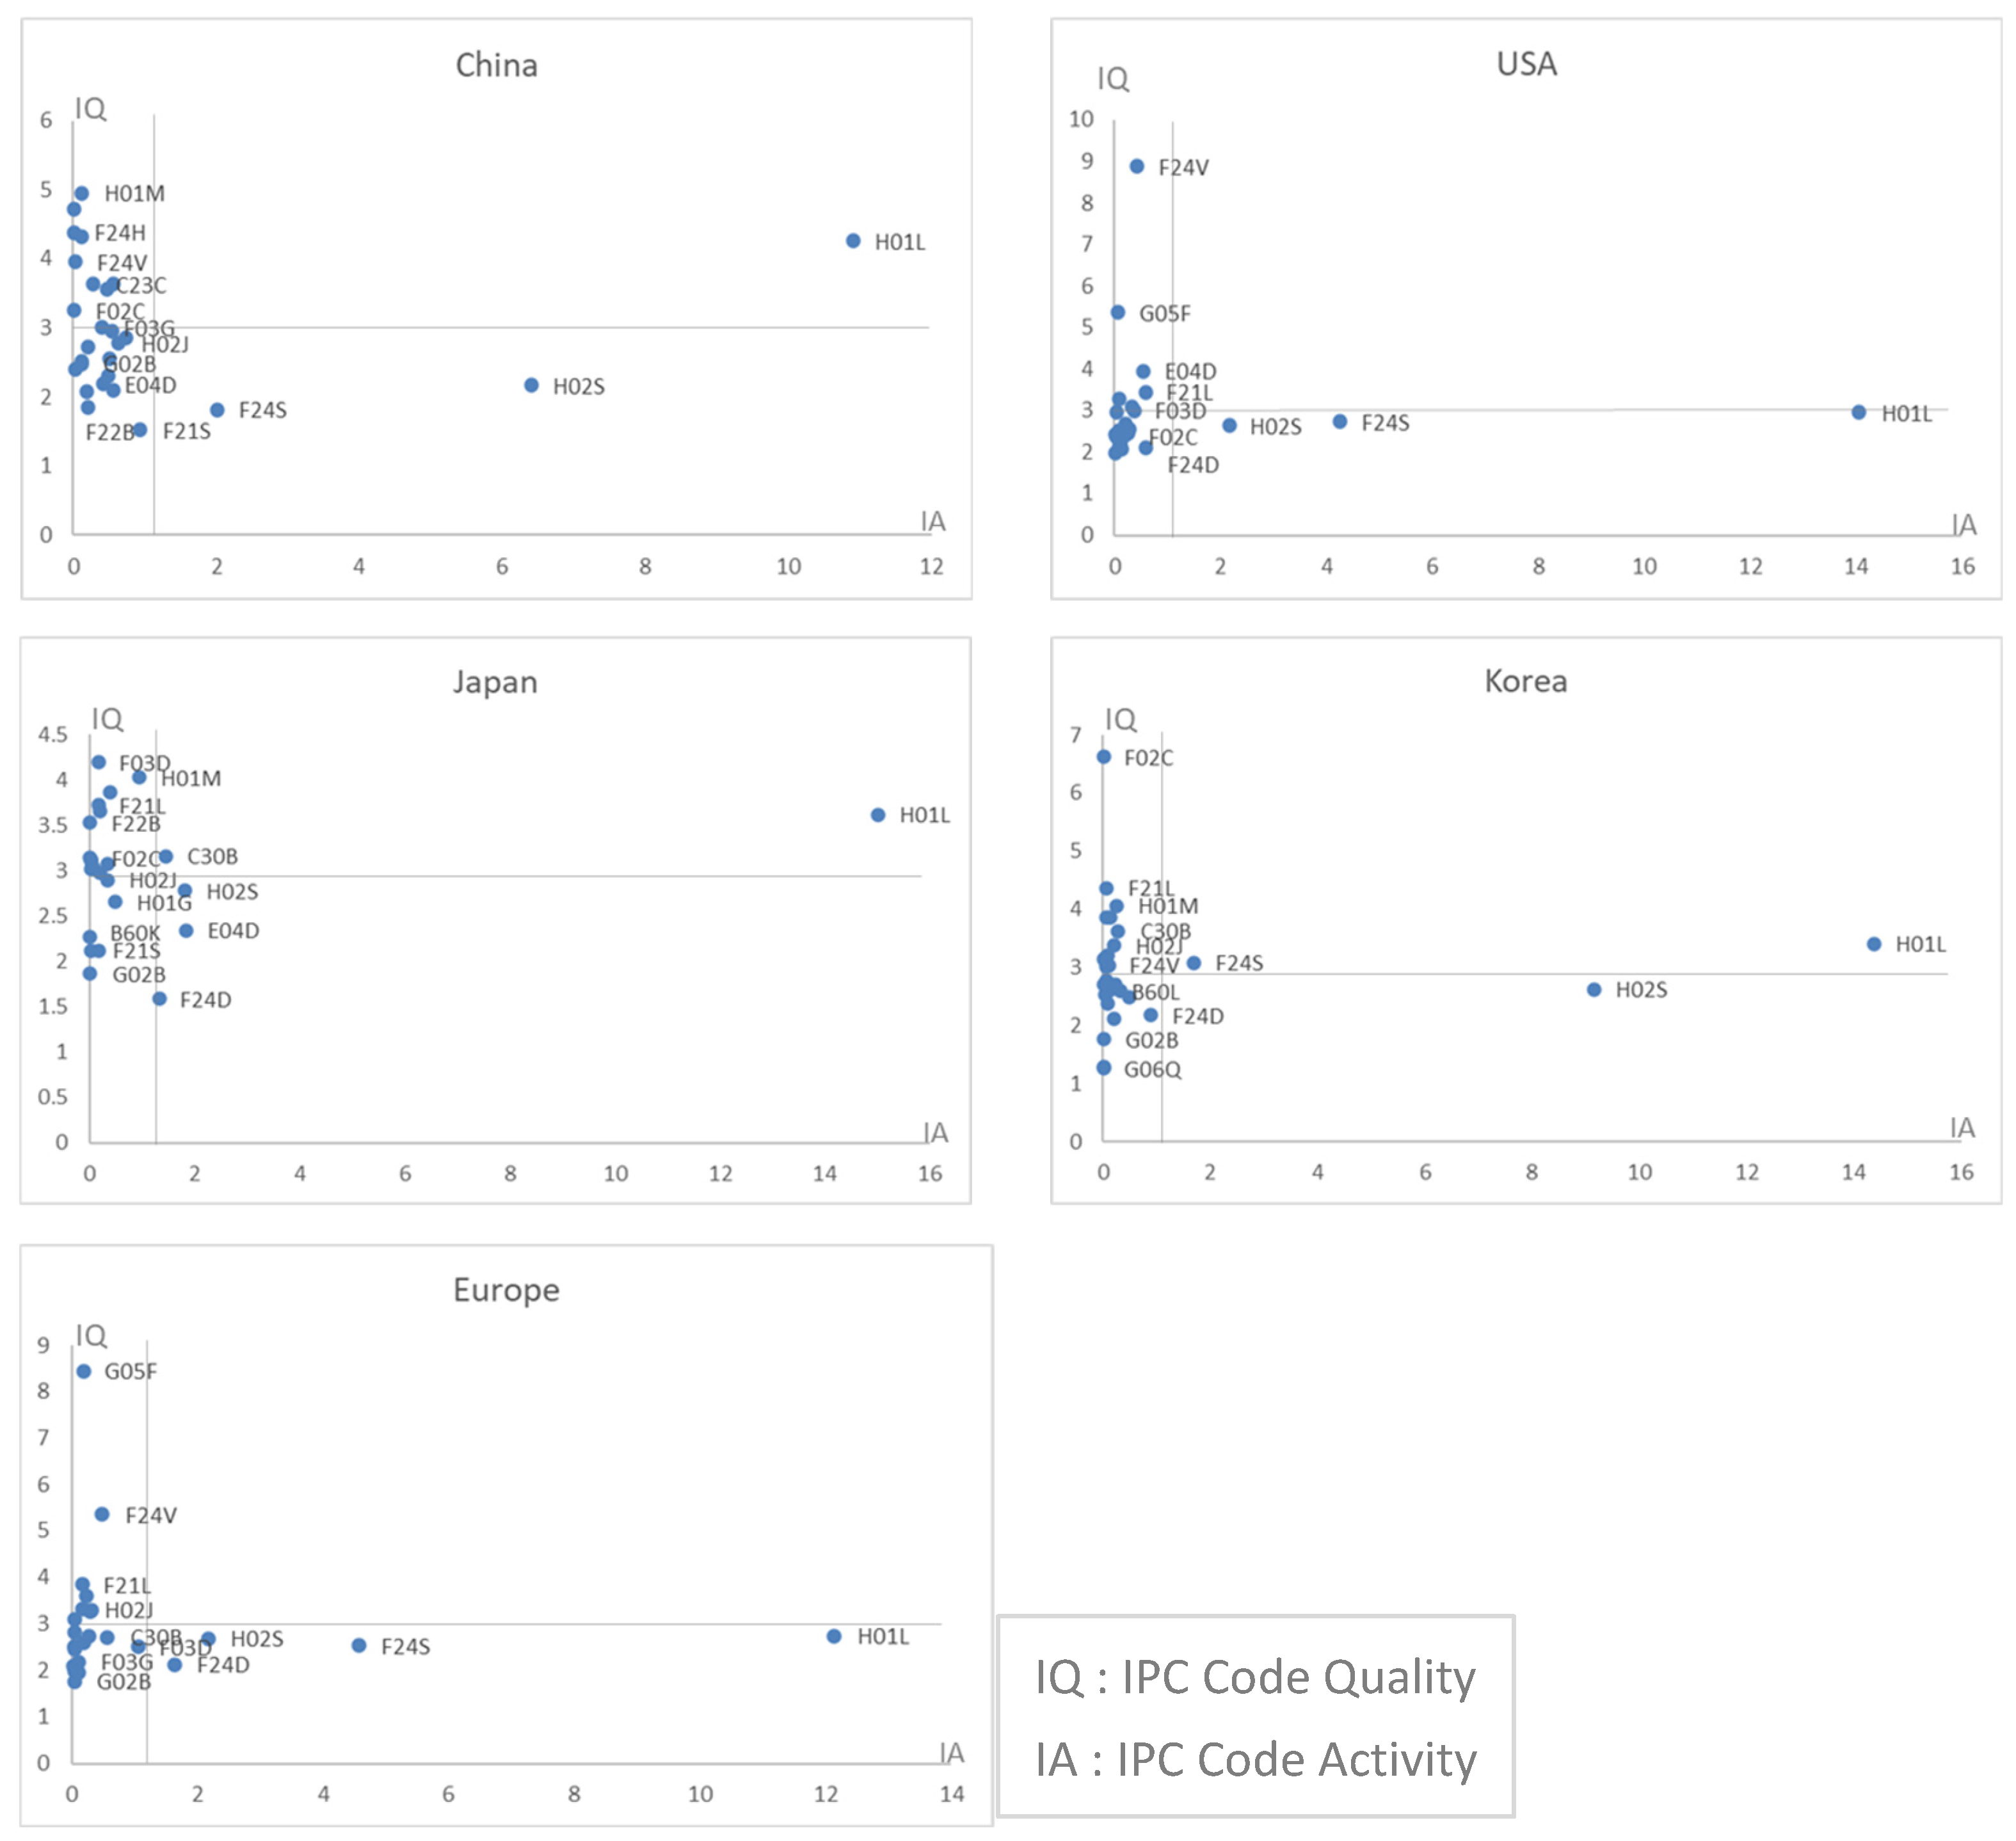
As
Figure 10 shows, H01L semiconductor-based solar cells constitute the single most critical technology for every country, combining high patent activity with high quality and underscoring their strategic role in photovoltaic power. Europe and the United States place additional emphasis on solar-control systems (G05F) and solar-thermal applications (F24V, F24S). Europe excels in control-system quality, whereas the United States records the strongest activity in thermal applications. China has very high activity in panel-related technology (H02S) and stands out for the quality of its dye-sensitized cell patents (H01M). Korea also exhibits strong activity and quality in H02S, maintaining solid quality in gas turbine integration for solar power (F02C). Japan’s portfolio is smaller in volume but skewed toward high-quality patents across several subclasses.
In the wind domain,
Appendix A Figure A5 confirms that F03D—wind-turbine technology—anchors competition worldwide, dominating both activity and quality metrics. All five economies are aggressively patented in this sub-class. Vehicle-related wind applications (B60L, B63H) have emerged as niche strengths for Japan and Korea; Japan achieves high quality in both codes, whereas Korea records the best quality in B63H. Europe’s overall activity is modest, yet its patents remain strong, particularly for H02K (turbine fixation), reflecting a focus on core component design and system reliability. China leads in F03D activity and files densely across many subclasses, but the average quality of its wind patents trails that of its peers. This suggests an intensifying rivalry around F03D, with each country leveraging its industrial advantages in complementary application areas.
Appendix A Figure A6 indicates that the F01K steam turbine technology serves as the universal cornerstone of geothermal portfolios, delivering high activity and quality in every nation. F03G (mechanical energy generation) shows lower activity but a respectable quality across the board. Japan and China are particularly active in F24F (heating and ventilation), whereas Korea concentrates on F24T (geothermal collectors), achieving relatively high quality in that niche.
As shown in
Appendix A Figure A7, F03B (liquid-driven machinery and turbines) remains the central water technology for all countries, with strong scores along both axes. B63H (marine propulsion) attracts limited filings but yields high-quality patents in Europe, Japan, the United States, and China. In contrast, Korea focuses on F03G and attains comparatively good quality. Europe also maintains solid activity and quality in E02B (hydraulic structures), whereas the United States demonstrates notable activity in F03C, indicating diversification across multiple hydropower conversion devices. Overall, traditional turbine technologies anchored in F03B still dominate hydropower competition, and nations supplement them with specialized technologies—marine drives, civil structures, or mechanical converters—aligned with their industrial bases.
5. Discussion
This study examines the technological competitiveness of renewable energy from three complementary perspectives: overall patent trends, country-level patent portfolio analysis, and technology-level portfolio analysis. In total, 194,485 granted patents were identified, with the number of filings increasing sharply after 2010. This surge coincides with global initiatives, such as RE100 and carbon neutrality commitments, which have intensified investment and corporate interest in renewable technologies. The sharp rise in patent filings corresponds closely with the expansion of global initiatives like RE100 and carbon neutrality pledges, which have prompted firms to accelerate clean-tech innovation to meet emission targets and secure leadership in future low-carbon markets. The noticeable increase in 2024 may partly be attributed to the post-COVID-19 recovery effect, as delayed examination procedures were resumed. However, it can also be interpreted as a reflection of the growing national and corporate interest in renewable energy, driven by stronger policy incentives and industrial engagement. Solar patents dominate, reflecting both large market size and comparatively low entry barriers that encourage diverse firms to build portfolios. Although wind accounts for fewer patents, sustained filings in maintenance and efficiency-improvement subclasses signal ongoing technological refinement. Geothermal and water technologies, representing roughly 10 percent and 8 percent of the total, respectively, show lower volumes, likely a result of geographic constraints and high upfront costs. In general, high volumes in solar and wind reflect mature markets with incremental innovation, while lower but accelerating patent activity in geothermal and water indicates earlier-stage development with higher breakthrough potential. However, their steady growth suggests that certain firms and nations are making long-term niche investments aimed at energy diversification and security.
An IPC-tier analysis reveals that solar patents are distributed evenly across all levels, indicating a broad research scope spanning materials, components, and power conversion systems. The competition is particularly intense in solar cell efficiency, new materials, and inverter technologies. Wind patents are clustered into a few core IPC groups, most notably F03D (turbine design) and H02K (power conversion), highlighting the central importance of turbine engineering and conversion efficiency. Geothermal and water patents also concentrate on a handful of key subclasses, reflecting limited markets and the strategic efforts of a small number of actors to secure specialized knowledge adapted to specific geological or topographical conditions. For example, the concentration of patents in H02S/50 (PV module interconnection) in Korea corresponds with a 23% increase in its global market share for solar module exports from 2015 to 2023, suggesting that strategic depth in key IPC subclasses can translate into commercial advantage.
Country-level comparisons reveal that the United States maintains leadership in terms of both patent volume and quality. China has matched the United States in sheer patent counts but lags in quality indicators, such as forward citations, implying room for improvement in technological depth and follow-on influence. Europe files fewer patents overall, yet its grants score high on quality metrics, suggesting a selective strategy that emphasizes originality and commercial value. Japan’s patent activity was vigorous until about 2014 but has since tapered, widening the gap with the front-runners. Korea records relatively low scores for both activity and quality, indicating weaker overall competitiveness; limited R&D investment and institutional support appear to be key constraints. These divergent national strategies mirror differences in industrial policy, investment priorities, and market environments and foreshadow an intensifying race between technology leaders and latecomers. It should be noted that the development and diffusion of renewable energy technologies are deeply shaped by regional characteristics, including the availability and quality of natural resources (e.g., solar irradiation, wind speed), grid interconnection capacity, and country-specific policy instruments such as subsidies, feed-in tariffs, or RPS targets. These contextual elements contribute to the differentiated innovation patterns observed across nations [
104]. While China’s scale positions it as a potential leader, its comparatively low citation depth suggests that without parallel improvements in patent quality, its long-term technological influence may remain limited—highlighting the need for policies that prioritize not just output but impact.
The following universal strategic core technologies can be identified across all energy sources: H01L (semiconductor-based solar cells) in solar, F03D (wind turbines) in wind, F01K (steam turbines) in geothermal, and F03B (fluid-based turbines) in water. These subclasses combine high activity and quality to form the backbone of global competition. Approaches to downstream and auxiliary technologies vary. Europe and the United States excel in the system- and infrastructure-oriented subclasses—such as control systems (G05F), thermal applications (F24V, F24S), and civil structures (E02B)—indicating a push toward high-value applications. China emphasizes traditional core technologies and rapid quantitative expansion, a strategy that may underpin its cost leadership and future standardization. Korea and Japan pursue quality-focused niches: Korea concentrates on cross-energy integration technologies, including solar–gas–turbine hybrids (F02C) and advanced collectors (F24T), while Japan stands out in specialized, high-value areas, such as marine drives (B63H) and precision materials. These core technologies were selected based on their dual strength in patent activity and quality, reflecting both innovation intensity and market relevance. For instance, H01L is pivotal due to its central role in next-generation photovoltaics—such as tandem and perovskite-silicon cells—which are key to achieving higher efficiency and lower costs in global solar adoption. Overall, renewable energy technology is evolving toward complex integrated systems rather than single-source solutions. The crafting of differentiated portfolios by nations reflects their industrial bases, policy priorities, and technological capabilities. To accelerate the energy transition and achieve carbon-neutral goals, countries must not only secure shared core technologies but also strategically focus on high-value applications and cross-sector linkages. Long-term competitiveness depends on expanding patent volumes and enhancing patent quality through deeper and more collaborative innovation.
6. Conclusions
This study classified renewable energy technologies—solar, wind, geothermal, and water—by IPC codes and, using a dataset of granted patents, compared the technological competitiveness of the United States, China, Japan, Korea, and Europe.
Drawing on long-term data from 1975 to 2024 and evaluating both patent and technology portfolios, the analysis yielded academic, policy, and managerial insights that the more fragmented earlier investigations could not provide. Previous studies focused more on a single snapshot, a limited set of countries, or a narrow group of technologies, relying primarily on patent application counts or simple shares. These approaches obscured long-run trajectories and masked cross-national competition. In contrast, the present work combined big-data analytics with multidimensional portfolio assessment, revealing each nation’s strengths and weaknesses at a granular level and identifying domains where targeted investment or collaboration is required the most. Region-specific implications can also be drawn: the United States should leverage its quality advantage to lead in next-generation PV and battery technologies; China may benefit from shifting focus toward impact-driven innovation to sustain long-term competitiveness; Europe can capitalize on its strength in infrastructure-related IP to advance offshore wind and grid integration; Japan and Korea are well-positioned to lead in specialized niches, including marine energy systems and hybrid integration technologies.
The findings confirmed that solar and wind sectors are highly dynamic and innovation-intensive arenas, whereas geothermal and water sectors tend to advance steadily under the leadership of specific countries. Solar patents span the entire IPC hierarchy, reflecting a broad research scope, from materials and components to power-conversion systems. Wind patents are clustered into a few critical subclasses, underscoring the pivotal role of turbine engineering and power electronics. Geothermal and water patents are concentrated in specialized areas suited to particular geological or topographical conditions, indicating strategic, long-term commitments by a limited set of actors. These patterns clarify where nations should allocate R&D resources and how they might structure international cooperation to accelerate the energy transition. These divergent trajectories are shaped by differing market dynamics and technological characteristics—solar and wind benefit from strong global demand, rapid modular innovation, and supportive policy frameworks, whereas geothermal and water face site-specific constraints and high upfront costs, limiting their pace of advancement.
These results provide a basis for policymakers to set investment priorities and strengthen national competitiveness through deliberate patent portfolio management. Aligning domestic R&D programs with global patent trends can help countries meet their RE100 and carbon-neutrality goals more rapidly. To accelerate the energy transition, policymakers could prioritize international R&D consortia focused on emerging technologies (e.g., green hydrogen, next-gen PV), expand cross-border demonstration projects, and invest in open-access pilot platforms that lower entry barriers for startups and public–private innovation partnerships.
For firms and research institutions, the analysis identifies vulnerable technological niches and highlights opportunities for market leadership through patent-driven differentiation. Companies can adjust their R&D roadmaps, pursue technology transfers, and frame overseas expansion strategies with a clearer view of their capabilities relative to their global rivals. For example, firms could license advanced thin-film PV technologies from U.S. startups or partner with EU-based consortia specializing in wind turbine recycling to incorporate proven innovations into domestic R&D roadmaps. Public–private joint ventures and participation in international testbeds may also accelerate effective technology transfer.
While patent data are frequently used as proxies for innovation, it is important to note that patent examination primarily focuses on novelty and enablement. Unlike peer review in academic publishing, patent review does not assess practical feasibility or market value, leading to potential gaps between patenting activity and actual innovation outcomes.
Although this study focused on solar, wind, geothermal, and water technologies, it is important to note that bioenergy—including biogas and biomass—also constitutes a major pillar of the global renewable energy mix. However, bioenergy is often accompanied by environmental and policy-related controversies, such as deforestation, land-use change, and uncertain carbon neutrality. These characteristics distinguish it from other renewables and necessitate a distinct analytical framework that considers broader sustainability and social acceptance issues. Future research will aim to incorporate bioenergy as a separate category to enable a more comprehensive assessment of innovation dynamics in the renewable energy sector.
One limitation of this study is that it does not include energy storage technologies such as batteries. Energy storage plays a critical role in stabilizing renewable energy systems and enabling their long-term integration. Considering the growing strategic importance of these technologies, future research is expected to enhance the comprehensiveness and practical relevance of the analysis by incorporating energy storage innovations.
While this study focused on patent-based measures of technological competitiveness, future research could benefit from incorporating broader national innovation indicators—such as STEM education outcomes, researcher density, digital infrastructure, adoption rates, and financing conditions. Integrating these complementary factors would allow for a more holistic understanding of the enabling environments that shape renewable energy innovation across countries.
Future work can refine competitiveness assessments by incorporating additional R&D indicators, such as publication records, corporate investment levels, and diverse performance metrics, and examining the growing convergence of renewable energy with artificial intelligence, the Internet of Things, and other emerging technologies. Beyond patent data, researchers should evaluate how effectively innovations reach the market and generate economic and environmental values. Such a comprehensive approach would yield a richer understanding of the real-world impacts and future potential of renewable energy innovation. Future studies could integrate AI-driven topic modeling of full-text patent data, correlate IoT deployment metrics with technology adoption rates, and use machine learning to predict innovation diffusion based on multi-source inputs such as R&D funding, regulatory signals, and citation networks—offering a more dynamic and predictive framework for assessing technological competitiveness.

