
Measuring Urban Quality of Life Through Spatial Analytics and Machine Learning: A Data-Driven Framework for Sustainable Urban Planning and Development


Abstract
1. Introduction
- Statistical, official, governmental, and census data;
- Spatial data, such as geospatial information system (GIS) layers;
2. Materials and Methods
2.1. Study Area
- Region 1, one of the city’s oldest areas, is located in the city center. This region has commercial, administrative, medical, and academic centers.
- Region 2 has four districts. Districts 1 and 4 are adjacent to the city center, and Districts 2 and 3 are considered to be on the city’s outskirts. Districts 1 and 4 are old and busy, with commercial centers. Districts 2 and 3 are characterized by lower socio-cultural status.
- Region 3 comprises three districts: District 1, situated adjacent to the city center, experiences high foot traffic due to its proximity to the railway station. In contrast, Districts 2 and 3, located on the urban periphery, exhibit unregulated development and diminished socio-cultural standards.
- Region 4 includes three districts, with Districts 1 and 2 positioned near the city center, while District 3 lies on the outskirts.
- Region 5 similarly consists of three districts: District 1 is centrally located, whereas Districts 2 and 3 occupy peripheral zones.
- Region 6 also features three districts. District 1 is centrally situated, with the remaining two districts extending to the outskirts.
- Region 7 contains three districts: District 1 hosts the city’s airport, District 3 encompasses peripheral areas and an industrial park, and District 2 remains undescribed.
- In Region 8, District 1 lies near the historic city limits and houses commercial hubs and a major government hospital. District 3 includes a critical passenger terminal for travelers, while District 2 boasts commercial and cultural centers alongside a sprawling tourist green space. The outer boundaries of Districts 2 and 3 extend into non-residential highland areas.
- Region 9 comprises three districts. District 1 is home to the city’s largest university campus, with its southern sector bordering highland terrain. Districts 2 and 3 are emerging development zones, with their southern edges adjacent to highlands that have spurred recent urban expansion.
- Region 10, a rapidly growing urban area, currently sustains a sizable population. District 1 features extensive green spaces and commercial centers, while District 2 aligns with the city’s developmental trajectory.
- Region 11 features a large recreational green space in its District 1, along with commercial centers. District 2 of this region is aligned with the city’s urban development trends.
- Region 12, an expanding zone, is undergoing active construction and infrastructure development.
- Finally, the “Samen region” represents the city’s historic and religious core, hosting a concentration of hotels, traditional markets, and culturally significant landmarks.
2.2. Data Used
2.3. Methodology
2.4. The Selected Indicators
2.5. Classification of Indicators
2.6. Fuzzy AHP
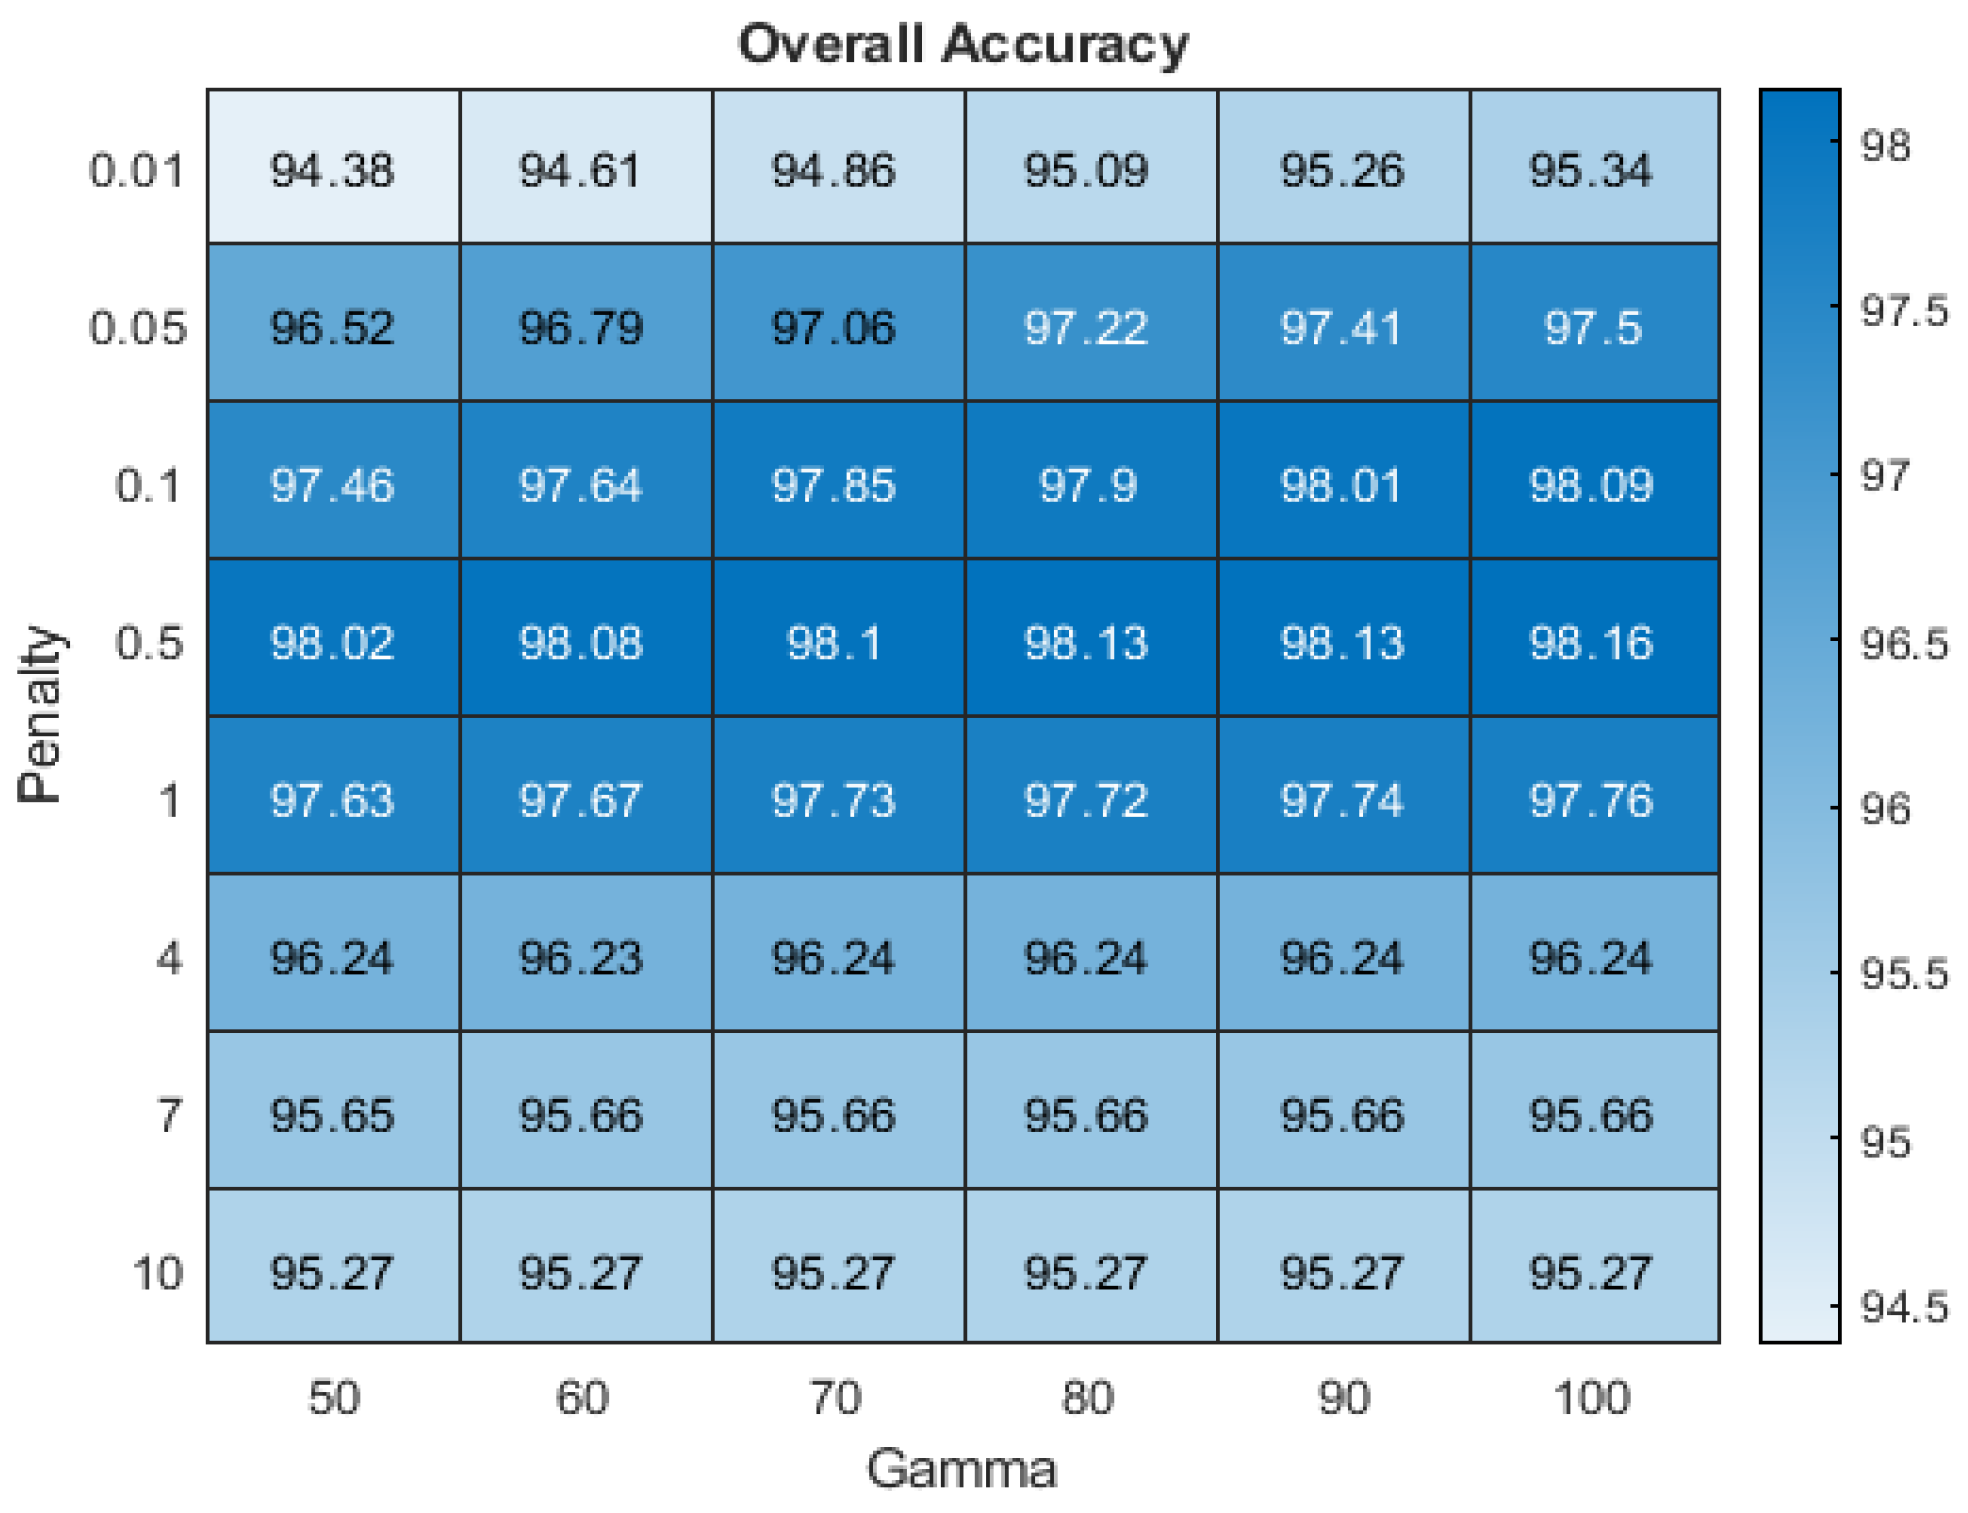
2.7. Support Vector Machine
2.8. Validation
3. Results
3.1. Environmental Indicators
3.2. Accessibility
3.3. Natural Environment Indicators
3.4. Socioeconomic Indicators
3.5. Per Capita Land Use
3.6. FAHP Method
3.7. Integrating Indicators of the Components
3.8. Analysis of Hot and Cold Spots
3.9. QOL with SVM
4. Discussion
5. Conclusions
Author Contributions
Funding
Institutional Review Board Statement
Informed Consent Statement
Data Availability Statement
Acknowledgments
Conflicts of Interest
Abbreviations
| QOL | Quality Of Life |
| FAHP | Fuzzy Analytical Hierarchy Process |
| SVM | Support Vector Machine |
| MCDM | Multicriteria Decision Making |
| ANP | Analytic Network Process |
| ANN | Artificial Neural Networks |
| ML | Machine Learning |
| NDVI | Normalized Difference Vegetation Index |
| LST | Land Surface Temperature |
References
- Khanderia, E.; Patel, V. Quality of Life Theory. In Patient Reported Outcomes and Quality of Life in Surgery; Athanasiou, T., Patel, V., Darzi, A., Eds.; Springer International Publishing: Cham, Switzerland, 2023; pp. 1–7. [Google Scholar]
- Marans, R.; Stimson, R. An Overview of Quality of Urban Life. In Investigating Quality of Urban Life: Theory, Methods, and Empirical Research; Springer: Dordrecht, The Netherlands, 2011; pp. 1–29. [Google Scholar]
- Li, G.; Weng, Q. Measuring the quality of life in city of Indianapolis by integration of remote sensing and census data. Int. J. Remote Sens. 2007, 28, 249–267. [Google Scholar] [CrossRef]
- Feizizadeh, B. Assessing urban quality of life using remote sensing and GIS (Case study: Urmia Urban Region). J. Appl. Res. Geogr. Sci. 2022, 22, 259–279. [Google Scholar]
- Mihaela, C.; Daniel, M. Comparative analisys between the objective and the subjective quality of life approach–Strengths and weaknesses. Ann. Fac. Econ. 2011, 1, 55–61. [Google Scholar]
- Farid, M. Assessment of Life Quality Using GIS and Remote Sensing Techniques: A Case Study on Assuit City, Egypt. Bull. Société Géographie d’Egypte 2015, 88, 123–167. [Google Scholar]
- Sőrés, A.; Pető, K. Measuring of Subjective Quality of Life. Procedia Econ. Financ. 2015, 32, 809–816. [Google Scholar] [CrossRef]
- Tehrani, N.A.; Janalipour, M. Predicting ecosystem shift in a Salt Lake by using remote sensing indicators and spatial statistics methods (case study: Lake Urmia basin). Environ. Eng. Res. 2021, 26, 200225-0. [Google Scholar] [CrossRef]
- Ghanbari, A.; Karimzadeh, S.; Taraneh, S. Evaluating the quality of urban life using remote sensing and GIS-Case study: District number 1 and 2 of Zahedan. Sci.-Res. Q. Geogr. Data (SEPEHR) 2022, 31, 93–110. [Google Scholar]
- Kazemi Garajjeh, M.; Valizadeh Kamran, K. Assessment of urban quality of life in Ardabil city using integrated remote sensing data and spatial analysis. Res. Urban Plan. 2021, 12, 24–36. [Google Scholar]
- Musse, M.A.; Barona, D.A.; Rodriguez, L.M.S. Urban environmental quality assessment using remote sensing and census data. Int. J. Appl. Earth Obs. Geoinf. 2018, 71, 95–108. [Google Scholar] [CrossRef]
- Asadi, A.; Akbari, E. Spatial Analysis Quality of Life in Urban Areas Using Geographic Information System (GIS) (Case Study: District 2 of Mashhad). J. Appl. Res. Geogr. Sci. 2020, 20, 35–52. [Google Scholar] [CrossRef]
- Hosingholizade, A.; Jelokhani-Niaraki, M.; Argany, M.; Hosseini, A. Analysis of urban quality of life in neighborhoods areas with emphasis on comparative methodological approaches; The case study on district 6 of Tehran. Sustain. City 2022, 4, 35–52. [Google Scholar] [CrossRef]
- Kazemzadeh, A.; Neisany Samany, N.; Darvishi Boloorani, A.; Toomanian, A.; Pourahmad, A. Assessment of the quality of urban life using remote sensing and GIS. Sci.-Res. Q. Geogr. Data (SEPEHR) 2018, 27, 113–132. [Google Scholar] [CrossRef]
- Saeideh Zarabadi, Z.S.; Nejati Alaf, N.; Jalili Safarian, H. Assessment and Analysis of Urban Life Quality by Using TOPSIS Technique in Mashhad. Arman. Archit. Urban Dev. 2016, 8, 301–311. [Google Scholar]
- Yagoub, M.M.; Tesfaldet, Y.T.; Elmubarak, M.G.; Al Hosani, N. Extraction of urban quality of life indicators using remote sensing and machine learning: The case of Al Ain city, United Arab Emirates (UAE). ISPRS Int. J. Geo-Inf. 2022, 11, 458. [Google Scholar] [CrossRef]
- Arribas-Bel, D.; Patino, J.E.; Duque, J.C. Remote sensing-based measurement of Living Environment Deprivation: Improving classical approaches with machine learning. PLoS ONE 2017, 12, e0176684. [Google Scholar] [CrossRef]
- Ghahremanpour, H.; Rezayan, H.; Sadidi, J. Spatial zoning of the quality of life in urban neighborhoods using FANP (case study: Areas 3, 4, 5, and 6 of Mashhad). Geogr. Urban Space Dev. 2024, 10, 125–145. [Google Scholar]
- He, D.; Shi, Q.; Xue, J.; Atkinson, P.M.; Liu, X. Very fine spatial resolution urban land cover mapping using an explicable sub-pixel mapping network based on learnable spatial correlation. Remote Sens. Environ. 2023, 299, 113884. [Google Scholar] [CrossRef]
- Nguyen, T.; Nguyen, H.; Doan, T.; Tri, D. Application Analytic Hierarchical Process (AHP) in Setting up Local Community Urban Environmental Quality of Life Index in a Developed Metropolitan Area in Ho Chi Minh City, Vietnam. Curr. Urban Stud. 2021, 9, 376–391. [Google Scholar] [CrossRef]
- Kim, J.; Jeong, K.; Lee, S.; Baek, Y. Machine-learning model predicting quality of life using multifaceted lifestyles in middle-aged South Korean adults: A cross-sectional study. BMC Public Health 2024, 24, 159. [Google Scholar] [CrossRef]
- Jannani, A.; Sael, N.; Benabbou, F. Machine learning for the analysis of quality of life using the World Happiness Index and Human Development Indicators. Math. Model. Comput. 2023, 10, 534–546. [Google Scholar] [CrossRef]
- Singh, S.; Tiwari, A.; Paliwal, H.K. A state-of-the-art review on the utilization of machine learning in nanofluids, solar energy generation, and the prognosis of solar power. Eng. Anal. Bound. Elem. 2023, 155, 62–86. [Google Scholar] [CrossRef]
- Sameh, S.; Zarzoura, F.; El-Mewafi, P.D.M. Spatio-temporal Analysis Mapping of Air Quality Monitoring in Cairo using Sentinel-5 satellite data and Google earth engine. MEJ Mansoura Eng. J. 2023, 49, 3. [Google Scholar] [CrossRef]
- Tehrani, N.A.; Mollalo, A.; Farhanj, F.; Pahlevanzadeh, N.; Janalipour, M. Time-series analysis of COVID-19 in Iran: A remote sensing perspective. In COVID-19 Pandemic, Geospatial Information, and Community Resilience; CRC Press: Boca Raton, FL, USA, 2021; pp. 277–290. [Google Scholar]
- Salavati, S.M.; Janalipour, M.; Abbaszadeh Tehrani, N. Measuring the Environmental Quality of Life Using Remote Sensing Products and Fuzzy Analytic Hierarchy Process (Case Study: Mashhad City). Remote Sens. Earth Syst. Sci. 2024, 8, 273–282. [Google Scholar] [CrossRef]
- Hataminezhad, H.; Poorahmad, A.; Mansourian, H.; Rajaei, S.A. Spatial Analysis of Quality of Life Indicators in Tehran City. Hum. Geogr. Res. 2013, 45, 29–56. [Google Scholar] [CrossRef]
- Ghoraniazam, A.; Riahi-Zanjani, B.; Balali-Mood, M. Effects of air pollution on human health and practical measures for prevention in Iran. J. Res. Med. Sci. 2016, 21, 65. [Google Scholar] [CrossRef] [PubMed]
- Sharifi, A.; Felegari, S. Nitrogen dioxide (NO2) pollution monitoring with sentinel-5P satellite imagery over during the coronavirus pandemic (case study: Tehran). Remote Sens. Lett. 2022, 13, 1029–1039. [Google Scholar] [CrossRef]
- Niliyeh Brojeni, M.; Ahmadi Nadoushan, M. The relationship between urban vegetation and land surface temperature in Isfahan city using Landsat TM and OLI satellite images and LST index. Environ. Sci. 2019, 17, 163–178. [Google Scholar] [CrossRef]
- Gupta, P.; Sharma, A.; Bhardwaj, L. Solid Waste Management (SWM) and Its Effect on Environment & Human Health. In Futuristic Trends in Agriculture Engineering & Food Sciences; IIP Proceedings; 2023; ISBN: 978-93-5747-344-6. Available online: https://www.researchgate.net/publication/379898490_SOLID_WASTE_MANAGEMENT_SWM_AND_ITS_EFFECT_ON_ENVIRONMENT_HUMAN_HEALTH (accessed on 5 April 2025).
- Streimikiene, D. Environmental indicators for the assessment of quality of life. Intellect. Econ. 2015, 9, 67–79. [Google Scholar] [CrossRef]
- Tehrani, N.A.; Makhdoum, M.F. Implementing a spatial model of Urban Carrying Capacity Load Number (UCCLN) to monitor the environmental loads of urban ecosystems. Case study: Tehran metropolis. Ecol. Indic. 2013, 32, 197–211. [Google Scholar] [CrossRef]
- Taplin, J.; Sun, Y. Optimizing bus stop locations for walking access: Stops-first design of a feeder route to enhance a residential plan. Environ. Plan. B Urban Anal. City Sci. 2019, 47, 239980831882410. [Google Scholar] [CrossRef]
- Kameli, M.; Hoseini, H.; Salmi, A.; Hoseini, B. Requirements of Passive defense in metro station with using the Delphi technique. Res. Urban Plan. 2017, 8, 45–60. [Google Scholar]
- Yang, R.; Yan, H.; Xiong, W.; Liu, T. The study of pedestrian accessibility to rail transit stations based on KLP model. Procedia-Soc. Behav. Sci. 2013, 96, 714–722. [Google Scholar] [CrossRef]
- Ahadnejad Reveshty, M.; Mousavi, M.N.; Mohammadi Hamidi, S.; Waysian, M. Investigating and Analyzing Social Justice in terms of Accessibility to Municipal Services (Case Study: Accessibility to Junior High School Educational Services in Miandoab. Geogr. Urban Space Dev. 2016, 3, 33–51. [Google Scholar] [CrossRef]
- Ghanei, M.; Esmailpoor, N.; Saraei, M.H. Evaluating quality of life in neighborhoods in order to improve quality of life (case study: Ghale neighborhood, Bafgh). Res. Urban Plan. 2017, 8, 21–44. [Google Scholar]
- Arvin, D.; Ghaedi, G.; Asadi, H.R. Evaluation and analysis of people’s access to the green space in Khomeinishahr city. Geogr. Territ. Spat. Arrange. 2019, 9, 105–124. [Google Scholar]
- Akbar, T.; Hassan, Q.; Ishaq, S.; Batool, M.; Butt, H.; Jabbar, H. Investigative Spatial Distribution and Modelling of Existing and Future Urban Land Changes and Its Impact on Urbanization and Economy. Remote Sens. 2019, 11, 105. [Google Scholar] [CrossRef]
- Anika, S.; Supriatna, S.; Erthalia, M.; Rokhmatuloh. Geothermal prospect areas based on physical characteristics using remote sensing at Cimandiri Fault, West Java. IOP Conf. Ser. Earth Environ. Sci. 2020, 561, 012037. [Google Scholar] [CrossRef]
- Hezareh, v.; Bakharzi Qaz-Alhesar, S. Urban flood risk zoning in zone 9 of Mashhad. Geogr. Hum. Relatsh. 2018, 1, 1140–1158. [Google Scholar]
- Mehdi, G.; Iman, F.; Hamed, B.; Bahareh, G. Study of the Relationship between Landuse Change and Topographic Parameters in Mashhad in GIS Environment. J. Environ. Sci. Technol. 2017, 19, 299–315. [Google Scholar]
- Nut, N.; Mihara, M.; Jeong, J.; Ngo, B.; Sigua, G.; Prasad, P.V.V.; Reyes, M. Land Use and Land Cover Changes and Its Impact on Soil Erosion in Stung Sangkae Catchment of Cambodia. Sustainability 2021, 13, 9276. [Google Scholar] [CrossRef]
- Liu, Y.; Eckert, C.M.; Earl, C. A review of fuzzy AHP methods for decision-making with subjective judgements. Expert Syst. Appl. 2020, 161, 113738. [Google Scholar] [CrossRef]
- Mahad, N.F.; Yusof, N.; Ismail, N.F. The application of fuzzy analytic hierarchy process (FAHP) approach to solve multi-criteria decision making (MCDM) problems. J. Phys. Conf. Ser. 2019, 1358, 012081. [Google Scholar] [CrossRef]
- Tehrani, N.A.; Janalipour, M.; Shami, F. Oil spill detection using optical remote sensing images and machine learning approaches (case study: Persian Gulf). In Geoinformatics for Geosciences; Elsevier: Amsterdam, The Netherlands, 2023; pp. 171–183. [Google Scholar]
- Tehrani, N.A.; Farhanj, F.; Janalipour, M. Introducing a novel dust source identification method based on edge points and paths extracted from integration of time-series MODIS products. Remote Sens. Appl. Soc. Environ. 2023, 32, 101054. [Google Scholar]
- Babaei, H.; Janalipour, M.; Tehrani, N.A. A simple, robust, and automatic approach to extract water body from Landsat images (case study: Lake Urmia, Iran). J. Water Clim. Change 2021, 12, 238–249. [Google Scholar] [CrossRef]
- Mohammadi, J.; Zanganeh, M. Assessing life quality indices from the view points of mashhad citizens. J. Urban Manag. Stud. 2010, 2, 97–117. [Google Scholar]


| Index | Unit | Very Good = 5 | Good = 4 | Medium = 3 | Weak = 2 | Very Weak = 1 | Calculation Method | Reference | |
|---|---|---|---|---|---|---|---|---|---|
| Socioeconomic level | Population density | p/ha | 0–50 | 50–70 | 70–90 | 90–110 | >110 | p/area | [35] |
| Employment level | % | 80–100 | 60–80 | 40–60 | 20–40 | 0–20 | |||
| Education level | % | 90–100 | 80–90 | 60–80 | 40–60 | 0–40 | |||
| Transportation access | Bus | m | 0–150 | 150–240 | 240–300 | 300–450 | >450 | Euclidean distance Rules | [37] |
| Subway | m | 0–400 | 400–500 | 500–800 | 800–1000 | >1000 | Euclidean distance Rules | [38,39] | |
| Educational access | Kindergarten | m | 0–300 | 300–350 | 350–400 | 400–500 | >500 | Euclidean distance Rules | [40] |
| Elementary | m | 0–500 | 500–600 | 600–700 | 700–1000 | >1000 | Euclidean distance Rules | ||
| High school | m | 0–1000 | 1000–1300 | 1300–1600 | 1600–2000 | >2000 | Euclidean distance Rules | ||
| University | m | 0–1000 | 1000–1300 | 1300–1600 | 1600–2000 | >2000 | Euclidean distance Rules | ||
| Access to treatment | Hospital | m | 0–1000 | 1000–1200 | 1200–1300 | 1300–1500 | >1500 | Euclidean distance Rules | [41] |
| Clinic | m | 0–650 | 650–680 | 680–710 | 710–750 | >750 | Euclidean distance Rules | ||
| Health center | m | 500–0 | 500–530 | 530–560 | 560–600 | >600 | Euclidean distance Rules | ||
| Access to green space | Green space | m | 0–400 | 400–600 | 600–750 | 750–1000 | >1000 | Euclidean distance Rules | [42] |
| Per capita urban use | Treatment | m2/p | >1.5 | 1–1.5 | 0.75–1 | 0.5–0.75 | 0–0.5 | Euclidean distance Rules | [35] |
| Educational | m2/p | >5 | 3–5 | 2–3 | 1–2 | 0–0.9 | Euclidean distance Rules | ||
| Transportation network | m2/p | >30 | 25–30 | 20–25 | 15–20 | 0–15 | Euclidean distance Rules | ||
| Green space | m2/p | >15 | 12–15 | 9–12 | 6–9 | 0–6 | Euclidean distance Rules | ||
| Residential | m2/p | >50 | 40–50 | 30–40 | 20–30 | 0–20 | Euclidean distance Rules | [35] | |
| Environment | NO2 | ppm | 0.108–0.141 | 0.141–0.172 | 0.172–0.207 | 0.207–0.239 | 0.239–0.27 | Google Earth Engine | [35] |
| SO2 | ppm | 0.178–0.225 | 0.225–0.278 | 0.278–0.332 | 0.332–0.383 | 0.383–0.434 | Google Earth engine | [35] | |
| LST | C | 29–36 | 36–42 | 42–48 | 48–54 | 54–55 | Landsat8 C2L2 | Global Warming and Changing the Range of Seasonal Temperatures | |
| NDVI | 0.26–0.52 | 0.17–0.26 | 0.10–0.17 | 0.05–0.10 | −0.12–0.05 | Landsat8 C2L2 | [43] | ||
| Trash produced | Ton/ha/year | 0–9 | 9–17 | 17–27 | 27–37 | >37 | Statistics | [35] | |
| Natural environment | Fault | m | >1200 | 900–1200 | 600–900 | 300–600 | 0–300 | Euclidean distance Rules | [44] |
| Flood channel | m | >777 | 545–777 | 345–545 | 160–345 | 0–160 | Euclidean distance Rules | [45] | |
| DEM | m | 915–1000 | 1000–1100 | 1100–1200 | 1200–1300 | 1300–1341 | DEM SRTM 1Arc-Second Global | [46] | |
| Slope | % | 0–2% | 2–5% | 5–8% | 8–12% | >12% | Spatial analyst/Surface/Slope | [47] |
| Regions | Districts | District’s Code | Very Weak | Weak | Medium | Good | Very Good | Quality |
|---|---|---|---|---|---|---|---|---|
| 1 | 1 | 0101 | - | 0.4% | 99.5% | - | - | 3 |
| 2 | 0102 | 0.05% | 90.6% | 9.2% | - | - | 2 | |
| 2 | 1 | 0201 | 98% | 1.4% | - | - | - | 1 |
| 2 | 0202 | - | - | 2.2% | 97.7% | - | 4 | |
| 3 | 0203 | 100% | - | - | - | - | 1 | |
| 4 | 0204 | 100% | - | - | - | - | 1 | |
| 3 | 1 | 0301 | 85.9% | 14% | - | - | - | 1 |
| 2 | 0302 | 100% | - | - | - | - | 1 | |
| 3 | 0303 | 39% | 60% | - | - | - | 2 | |
| 4 | 1 | 0401 | 26% | 73% | - | - | - | 2 |
| 2 | 0402 | 86% | 13% | - | - | - | 1 | |
| 3 | 0403 | 89% | 10% | - | - | - | 1 | |
| 5 | 1 | 0501 | - | 0.4% | 99% | - | - | 3 |
| 2 | 0502 | - | 2.9% | 97% | - | - | 3 | |
| 3 | 0503 | 6.2% | 93% | - | - | - | 2 | |
| 6 | 1 | 0601 | 0.2% | 98% | 1.3% | - | - | 2 |
| 2 | 0602 | - | 4.5% | 95% | - | - | 3 | |
| 3 | 0603 | 97.8% | 2.1% | - | - | - | 1 | |
| 7 | 1 | 0701 | - | - | - | 59% | 40% | 4 |
| 2 | 0702 | - | 1.9% | 98% | - | - | 3 | |
| 3 | 0703 | - | - | - | 46% | 53.9% | 5 | |
| 8 | 1 | 0801 | - | - | - | - | 100% | 5 |
| 2 | 0802 | - | - | - | 16% | 83.9% | 5 | |
| 3 | 0803 | - | - | - | 93.9% | 6% | 4 | |
| 9 | 1 | 0901 | - | - | 0.7% | 99% | - | 4 |
| 2 | 0902 | 4.3% | 95% | 0.6% | - | - | 2 | |
| 3 | 0903 | 0.01% | 26% | 73% | - | - | 3 | |
| 10 | 1 | 1001 | 0.5% | 82.9% | 16.4% | - | - | 2 |
| 2 | 1002 | 99.7% | 0.2% | - | - | - | 1 | |
| 3 | 1003 | 87% | 12.9% | - | - | - | 1 | |
| 11 | 1 | 1101 | 32.7% | 67% | - | - | - | 2 |
| 2 | 1102 | 0.4% | 84% | 15% | - | - | 2 | |
| 12 | 1 | 1201 | - | - | - | 97% | 2.7% | 4 |
| 2 | 1202 | - | - | - | 7.3% | 92.6% | 5 | |
| Samen | - | - | - | 6.2% | 93.7% | 5 | ||
| - | - | - | 0.15% | 99.8% | 5 |
| Regions | Districts | Socioeconomic Level | Urban Land Use | Environmental | Natural Environment | QOL | |||||||
|---|---|---|---|---|---|---|---|---|---|---|---|---|---|
| Population Density | Employment | Literacy | Access | Per Capita | Waste Production | Air Pollutants | LST | NDVI | Natural Feature | Natural Hazards | |||
| 1 | 1 | 2 | 5 | 5 | 3 | 4 | 3 | 1 | 4 | 2 | 4 | 5 | 3 |
| 2 | 1 | 5 | 5 | 5 | 3 | 3 | 1 | 4 | 2 | 4 | 5 | 2 | |
| 2 | 1 | 1 | 5 | 5 | 4 | 2 | 1 | 1 | 4 | 2 | 4 | 5 | 1 |
| 2 | 5 | 5 | 5 | 1 | 3 | 1 | 2 | 3 | 1 | 4 | 5 | 4 | |
| 3 | 1 | 5 | 5 | 1 | 2 | 1 | 2 | 3 | 1 | 4 | 5 | 1 | |
| 4 | 1 | 5 | 5 | 2 | 2 | 1 | 1 | 4 | 2 | 4 | 5 | 1 | |
| 3 | 1 | 1 | 5 | 5 | 4 | 2 | 1 | 2 | 4 | 2 | 4 | 5 | 1 |
| 2 | 1 | 5 | 5 | 1 | 1 | 1 | 5 | 3 | 1 | 4 | 3 | 1 | |
| 3 | 2 | 5 | 5 | 1 | 1 | 1 | 5 | 3 | 2 | 4 | 5 | 2 | |
| 4 | 1 | 1 | 5 | 4 | 5 | 2 | 2 | 3 | 4 | 2 | 4 | 5 | 2 |
| 2 | 1 | 5 | 4 | 4 | 1 | 2 | 4 | 4 | 2 | 4 | 5 | 1 | |
| 3 | 1 | 5 | 4 | 1 | 1 | 2 | 5 | 4 | 1 | 4 | 3 | 1 | |
| 5 | 1 | 2 | 5 | 5 | 2 | 3 | 3 | 3 | 3 | 2 | 4 | 5 | 3 |
| 2 | 2 | 5 | 4 | 1 | 3 | 3 | 4 | 3 | 1 | 4 | 5 | 3 | |
| 3 | 1 | 5 | 4 | 4 | 1 | 3 | 5 | 3 | 1 | 4 | 3 | 2 | |
| 6 | 1 | 1 | 5 | 5 | 2 | 3 | 2 | 3 | 4 | 2 | 4 | 5 | 2 |
| 2 | 3 | 5 | 4 | 1 | 2 | 2 | 4 | 3 | 1 | 4 | 5 | 3 | |
| 3 | 1 | 5 | 4 | 2 | 1 | 2 | 4 | 4 | 1 | 4 | 5 | 1 | |
| 7 | 1 | 5 | 5 | 5 | 1 | 3 | 2 | 3 | 3 | 2 | 4 | 5 | 4 |
| 2 | 3 | 5 | 5 | 1 | 3 | 2 | 1 | 3 | 2 | 4 | 3 | 3 | |
| 3 | 5 | 5 | 4 | 1 | 5 | 2 | 4 | 3 | 1 | 4 | 5 | 5 | |
| 8 | 1 | 5 | 5 | 5 | 5 | 5 | 3 | 1 | 4 | 2 | 4 | 5 | 5 |
| 2 | 5 | 5 | 5 | 1 | 5 | 3 | 1 | 3 | 2 | 1 | 3 | 5 | |
| 3 | 4 | 5 | 5 | 1 | 4 | 3 | 1 | 4 | 2 | 4 | 3 | 4 | |
| 9 | 1 | 5 | 5 | 5 | 1 | 4 | 1 | 2 | 4 | 2 | 1 | 3 | 4 |
| 2 | 2 | 5 | 5 | 1 | 4 | 1 | 1 | 4 | 2 | 1 | 2 | 2 | |
| 3 | 3 | 5 | 5 | 1 | 4 | 1 | 1 | 4 | 2 | 4 | 3 | 3 | |
| 10 | 1 | 2 | 5 | 5 | 2 | 4 | 1 | 1 | 3 | 1 | 4 | 5 | 2 |
| 2 | 1 | 5 | 5 | 4 | 2 | 1 | 1 | 3 | 2 | 4 | 5 | 1 | |
| 3 | 1 | 5 | 5 | 2 | 3 | 1 | 1 | 3 | 1 | 4 | 5 | 1 | |
| 11 | 1 | 1 | 5 | 5 | 4 | 3 | 2 | 1 | 4 | 2 | 4 | 5 | 2 |
| 2 | 2 | 5 | 5 | 2 | 3 | 2 | 1 | 4 | 2 | 4 | 4 | 2 | |
| 12 | 1 | 5 | 5 | 5 | 1 | 3 | 4 | 1 | 2 | 1 | 4 | 5 | 4 |
| 2 | 5 | 5 | 5 | 1 | 5 | 4 | 1 | 2 | 1 | 4 | 5 | 5 | |
| Samen | N/A | 5 | 5 | 4 | 4 | 5 | 5 | 2 | 4 | 1 | 4 | 5 | 5 |
Disclaimer/Publisher’s Note: The statements, opinions and data contained in all publications are solely those of the individual author(s) and contributor(s) and not of MDPI and/or the editor(s). MDPI and/or the editor(s) disclaim responsibility for any injury to people or property resulting from any ideas, methods, instructions or products referred to in the content. |
© 2025 by the authors. Licensee MDPI, Basel, Switzerland. This article is an open access article distributed under the terms and conditions of the Creative Commons Attribution (CC BY) license (https://creativecommons.org/licenses/by/4.0/).
Share and Cite
Salavati, S.M.; Janalipour, M.; Abbaszadeh Tehrani, N. Measuring Urban Quality of Life Through Spatial Analytics and Machine Learning: A Data-Driven Framework for Sustainable Urban Planning and Development. Sustainability 2025, 17, 4863. https://doi.org/10.3390/su17114863
Salavati SM, Janalipour M, Abbaszadeh Tehrani N. Measuring Urban Quality of Life Through Spatial Analytics and Machine Learning: A Data-Driven Framework for Sustainable Urban Planning and Development. Sustainability. 2025; 17(11):4863. https://doi.org/10.3390/su17114863
Chicago/Turabian StyleSalavati, Seyedeh Mahsa, Milad Janalipour, and Nadia Abbaszadeh Tehrani. 2025. "Measuring Urban Quality of Life Through Spatial Analytics and Machine Learning: A Data-Driven Framework for Sustainable Urban Planning and Development" Sustainability 17, no. 11: 4863. https://doi.org/10.3390/su17114863
APA StyleSalavati, S. M., Janalipour, M., & Abbaszadeh Tehrani, N. (2025). Measuring Urban Quality of Life Through Spatial Analytics and Machine Learning: A Data-Driven Framework for Sustainable Urban Planning and Development. Sustainability, 17(11), 4863. https://doi.org/10.3390/su17114863