
Morphological Structural Factors Affecting Urban Physical Vulnerability: A Case Study of the Spatial Configuration of Commercial Buildings in Nakhon Si Thammarat, Thailand


Abstract
1. Introduction
2. Literature Review
2.1. Urban Street Networks
2.2. Public Space Connectivity Patterns
- (1)
- Beady ring structure: A distributed system where public spaces are well-connected to main roads, facilitating convenient city travel. This includes grid and ring/loop street patterns.
- (2)
- Tree-like structure: A non-distributed system where public spaces are not well-connected, with most roads leading to dead ends or cul-de-sacs. Movement within the city with this pattern requires returning to the main road each time [16].
2.3. Transportation Networks Sustained by Natural Movement of People and Economic Activities
2.4. Visibility
3. Research Area
4. Research Methodology
4.1. Data Preparation for Developing the Physical Vulnerability Index (PVI)
4.1.1. Preliminary Agreement Analysis
4.1.2. Data Collection Methods for Each Variable
Space Syntax Methods
- (1)
- Integration value
- -
- Global integration value (Rn, n-step): This measures the connectivity of the selected street with all other streets in the system, known as the integration values of axial lines at an infinite radius or “radius n”. This represents the overall relationship, showing the main streets at the global level [44].
- -
- Local integration value (R3, 3 steps): This measures the connectivity of the selected street with the two adjacent connected streets and extends only to the next street in the sequence, without considering the entire system. This is referred to as “radius 3” and shows specific local relationships. Thus, this measurement indicates which streets are most commonly used at the neighborhood level [44].
- (2)
- Mean depth (MD)
- (3)
- Relative Asymmetry (RA)
Degree of Street Intervisibility
- (1)
- The registration of the number of building entrances and adjacent windows facing public areas shows how building entrances connect directly to streets and public spaces in the city. The interaction between the building façade and the sidewalk and street (building–street interfaces) can be classified into three types as follows:
- (2)
- The Measurement of the degrees of street intervisibility for each location involves the following variables:
Gate Count
4.2. Principal Component Analysis (PCA)
4.2.1. Variable Standardization
4.2.2. Correlation Matrix
4.2.3. Factor Extraction
4.2.4. Factor Rotation
4.2.5. Interpretation and Factor Analysis
4.3. Physical Vulnerability Index (PVI)
5. Research Results
5.1. Descriptive Statistics
5.2. Principal Component Analysis (PCA) Results
5.2.1. Correlation Matrix Results
- (1)
- (2)
- When examining the variance of each variable, considering the anti-image correlation values displayed along the diagonal of the anti-image matrices, it was found that all variables had values greater than 0.5, indicating suitability for component analysis.
- (3)
- Checking the communalities from the factor extraction revealed that the communalities of each variable were greater than 0.5 and close to 1, making them suitable for grouping into components.
5.2.2. Factor Extraction Results
5.2.3. Factor Rotation Results
- (1)
- The Component column indicates that two components were extracted from the nine variables related to physical vulnerability.
- (2)
- The Rotation sums of squared loadings column refers to the eigenvalues of each variable after component extraction and orthogonal rotation using the Varimax method. Only variables with an initial eigenvalue greater than 1 are considered, as this value indicates the component’s ability to explain a significant portion of the variance within the group of variables.
- -
- Component 1 included seven variables: Vacancy Rate, Degree of Street Intervisibility, Utilization Rate of Commercial Buildings, Mean Depth (MD), Degree of Natural Movement, Connectivity of the Location to the Main Road, and Visibility Potential from the Street to the Building. These variables, ordered by their factor loading (from most to least influential), explain 55.399% of the total variance.
- -
- Component 2 included two variables: Global Integration and Local Integration. These variables, also ordered by their factor loading, account for 26.184% of the total variance.
- The negative variables subgroup included three variables: building vacancy rate, connectivity of the location to the main road, and depth of the location relative to the main road. This means that as the values of the negative variables increase, the level of physical vulnerability also increases.
- The positive variables subgroup included four variables: degree of street intervisibility, utilization rate of commercial buildings, degree of natural movement, and visibility from the road to the building. This means that as the values of the positive variables increase, the level of physical vulnerability decreases.
5.2.4. Component Analysis and Interpretation
5.3. Application of the Physical Vulnerability Index (PVI)
6. Discussion
6.1. Configuration of Space
6.1.1. The Connectivity of the Location to Main Roads Was Low
6.1.2. The Depth Between the Location and Main Roads Was High
6.1.3. The Visibility from the Street to the Building Was Low
6.2. Characteristics and Levels of Usage
6.2.1. The Rate of Building Vacancy Was High
6.2.2. The Visibility of Buildings from the Street Was Low
6.2.3. The Utilization Rate of Commercial Buildings Was Low
6.2.4. The Level of Natural Movement Was Low
- (1)
- The urban accessibility potential was low. Among the eight high-vulnerability units, three units had Global Integration values lower than 0.7197, the average for all units. These units were located deep from main roads, resulting in low accessibility and insufficient natural movement.
- (2)
- The neighborhood accessibility potential was low. Among the eight high-vulnerability units, six had Local Integration values lower than 1.9640, the average for all units. This indicates low accessibility potential in the neighborhood street network.
7. Conclusions
Author Contributions
Funding
Institutional Review Board Statement
Informed Consent Statement
Data Availability Statement
Conflicts of Interest
References
- Birkmann, J.; Birkmann, J. Measuring Vulnerability to Natural Hazards: Towards Disaster Resilient Societies; United Nations University Press: Tokyo, Japan, 2006. [Google Scholar]
- Wisner, B.; Blaikie, P.; Cannon, T.; Davis, I. At Risk: Natural Hazards, People’s Vulnerability and Disasters; Routledge: London, UK, 2014. [Google Scholar] [CrossRef]
- Fekete, A.; Brach, K. Assessment of social vulnerability river floods in Germany. Ph.D. Dissertation, United Nations University, Institute for Environment and Human Security (UNU-EHS), Bonn, Germany, 2010. [Google Scholar]
- Zakour, M.J.; Gillespie, D.F. Community Disaster Vulnerability; Springer: New York, NY, USA, 2013; pp. 978–1001. [Google Scholar] [CrossRef]
- Cutter, S.L. Vulnerability to environmental hazards. Prog. Hum. Geog. 1996, 20, 529–539. [Google Scholar] [CrossRef]
- Laursen, L.L.H. Shrinking Cities or Urban Transformation. Ph.D. Thesis, Institut for Arkitektur og Medieteknologi, Aalborg University, Aalborg, Denmark, 2009. [Google Scholar]
- Hillier, B. Centrality as a process: Accounting for attraction inequalities in deformed grids. Urban Des. Int. 1999, 4, 107–127. [Google Scholar] [CrossRef]
- Hillier, B.; Hanson, J. The Social Logic of Space; Press Syndicate of the University of Cambridge: Cambridge, UK, 1984. [Google Scholar] [CrossRef]
- Hillier, B. Cities as movement economies. Urban Des. Int. 1996, 1, 41–60. [Google Scholar] [CrossRef]
- Hillier, B.; Penn, A.; Hanson, J.; Grajewski, T.; Xu, J. Natural movement: Or, configuration and attraction in urban pedestrian movement. Environ. Plann. B 1993, 20, 29–66. [Google Scholar] [CrossRef]
- Van Nes, A. Road Building and Urban Change: The Effect of Ring Roads on the Dispersal of Shop and Retail in Western European Towns and Cities. Ph.D. Thesis, Agricultural University of Norway, Department of Land Use and Landscape Planning, Oss, Norway, 2002. [Google Scholar]
- Fang, K.; Wang, X.; Zhang, W.; Zhang, Z.; Xie, Y.; Chen, L.; Zhu, G.; Furuya, N. Characteristics of space network system formed by the constituent elements in urban streets: Tianzifang in Shanghai as a case study. J. Asian Archit. Build. Eng. 2021, 20, 627–639. [Google Scholar] [CrossRef]
- Diao, J.; Lu, S. The culture-oriented urban regeneration: Place narrative in the case of the inner city of Haiyan (Zhejiang, China). Sustainability 2022, 14, 7992. [Google Scholar] [CrossRef]
- Lv, W.; Wang, N.; Huang, Y. Study on the sustainability of ancient canal towns on the basis of the topological structure analysis of streets and lanes: A case study of the Xixing ancient town. PLoS ONE 2023, 18, e0279979. [Google Scholar] [CrossRef]
- Teng, Y.; Yang, S.; Huang, Y. Structural features of the streetscape of Macau across four different spatial scales based on historical maps. PLoS ONE 2021, 16, e0258086. [Google Scholar] [CrossRef]
- Carmona, M. Public Places, Urban Spaces: The Dimensions of Urban Design; Routledge: London, UK, 2010. [Google Scholar]
- Cozens, P.; Hillier, D. The shape of things to come: New urbanism, the grid and the cul-de-sac. Int. Plann. Stud. 2008, 13, 51–73. [Google Scholar] [CrossRef]
- Hillier, B.; Shu, S. Do Burglars Understand Defensible Space; Space Syntax: Tokyo, Japan, 2000. [Google Scholar]
- Hillier, W.; Shu, S. Crime and urban layout: The need for evidence. In Secure Foundations: Key Issues in Crime Prevention, Crime Reduction and Community Safety; Ballintyne, S., Pease, K., McLaren, V., Eds.; Institute of Public Policy Research: London, UK, 1999; pp. 224–248. [Google Scholar]
- Rattanathavorn, T.; Paksukcharern, K.; Peerapun, W. Conservation of spatial centrality: A case study of markets in Ayutthaya Historic Town. Nakhara J. Environ. Des. Plan. 2013, 9, 15–28. [Google Scholar]
- Ye, Y.; Van Nes, A.J.A.; Architecture, Z.I. The spatial flaws of new towns: Morphological comparison between a Chinese new and old town through the application of space syntax, spacematrix and mixed use index. J. Fac. Archit. 2014, 11, 191–208. [Google Scholar]
- Jacobs, J. The Death and Life of Great American Cities; Penguin Books: London, UK, 1961. [Google Scholar]
- Gehl, J. Life Between Buildings: Using Public Space; Island Press: Washington, DC, USA, 2011. [Google Scholar]
- Ceccato, V.; Nalla, M.K. Crime and Fear in Public Places: Towards Safe, Inclusive and Sustainable Cities; Taylor & Francis: Oxford, UK, 2020. [Google Scholar] [CrossRef]
- Jiang, B.; Mak, C.N.S.; Zhong, H. From broken windows to perceived routine activities: Examining impacts of environmental interventions on perceived safety of urban alleys. Front. Psychol. 2018, 9, 374981. [Google Scholar] [CrossRef]
- Kim, Y.A.; Hipp, J.R. Pathways: Examining street network configurations, structural characteristics and spatial crime patterns in street segments. J. Quant. Criminol. 2020, 36, 725–752. [Google Scholar] [CrossRef]
- Newman, O. Defensible Space; Macmillan: New York, NY, USA, 1972. [Google Scholar]
- Crowe, T. Crime Prevention Through Environmental Design; Butterworth-Heinemann: Oxford, UK, 2000. [Google Scholar]
- Cozens, P. Planning, crime and urban sustainability. WIT Trans. Ecol. Environ. 2007, 102, 10. [Google Scholar] [CrossRef]
- Benedikt, M.L. To take hold of space: Isovists and isovist fields. Environ. Plann. B 1979, 6, 47–65. [Google Scholar] [CrossRef]
- Batty, M. Exploring isovist fields: Space and shape in architectural and urban morphology. Environ. Plann. B 2001, 28, 123–150. [Google Scholar] [CrossRef]
- Turner, A.; Penn, A. Making isovists syntactic: Isovist integration analysis. In Proceedings of the 2nd International Symposium on Space Syntax, Brasilia, Brazil, 24–28 June 1999. [Google Scholar]
- Addy, C.L.; Wilson, D.K.; Kirtland, K.A.; Ainsworth, B.E.; Sharpe, P.; Kimsey, D. Associations of perceived social and physical environmental supports with physical activity and walking behavior. Am. J. Public Health 2004, 94, 440–443. [Google Scholar] [CrossRef]
- Lee, S.; Ha, M. The duality of visibility: Does visibility increase or decrease the fear of crime in Schools’ Exterior Environments? J. Asian Archit. Build. Eng. 2015, 14, 145–152. [Google Scholar] [CrossRef]
- Lee, S.; Ha, M. The effects of visibility on fear of crime in schools’ interior environments. J. Asian Archit. Build. Eng. 2016, 15, 527–534. [Google Scholar] [CrossRef]
- Lee, J.S.; Park, S.; Jung, S. Effect of crime prevention through environmental design (CPTED) measures on active living and fear of crime. Sustainability 2016, 8, 872. [Google Scholar] [CrossRef]
- Tan, W.; Klaasen, I. Exploring 24/7 environments. Town Plan. Rev. 2007, 78, 699–723. [Google Scholar] [CrossRef]
- Nes, A.V.; López, M.J.J. Macro and micro scale spatial variables and the distribution of residential burglaries and theft from cars: An investigation of space and crime in the Dutch cities of Alkmaar and Gouda. J. Space Syntax 2010, 1, 314. [Google Scholar]
- Cutter, S.L.; Boruff, B.J.; Shirley, W.L. Social vulnerability to environmental hazards. Soc. Sci. Quart. 2003, 84, 242–261. [Google Scholar] [CrossRef]
- Schmidtlein, M.C.; Deutsch, R.C.; Piegorsch, W.W.; Cutter, S.L. A sensitivity analysis of the social vulnerability index. Risk Anal. 2008, 28, 1099–1114. [Google Scholar] [CrossRef]
- Tabachnick, B.G.; Fidell, L.S. Using Multivariate Statistics; Allyn & Bacon: Needham, MA, USA, 2001. [Google Scholar]
- Yamu, C.; Nes, A.V.; Garau, C.J.S. Bill Hillier’s legacy: Space syntax-A synopsis of basic concepts, measures, and empirical application. Sustainability 2021, 13, 3394. [Google Scholar] [CrossRef]
- Turner, A. Depthmap 4: A Researcher’s Handbook; Bartlett School of Graduate Studies, University College London: London, UK, 2004. [Google Scholar]
- Hillier, B. Space is the Machine: A Configurational Theory of Architecture; Space Syntax: Tokyo, Japan, 2007. [Google Scholar]
- Nes, A.V.; Yamu, C. Introduction to Space Syntax in Urban Studies; Springer Nature: Berlin/Heidelberg, Germany, 2021. [Google Scholar]
- Shu, C.F. Housing Layout and Crime Vulnerability; University of London, University College London: London, UK, 2000. [Google Scholar]
- Nes, A.V. The Burglar’s Perception of His Own Neighbourhood. In Proceedings of the 5th International Space Syntax Symposium, TU Delft, Delft, The Netherlands, 13–17 June 2005. [Google Scholar]
- López, M.; Nes, A.V. Space and crime in Dutch built environments. In Proceedings of the 6th International Symposium on Space Syntax, Istanbul, Turkey, 12–15 June 2007. [Google Scholar]
- Thinnakorn, R. Mono-economy and urban vulnerability: A case study of Pak Phanang Municipality in Nakhon Si Thammarat Province. Nakhara J. Environ. Des. Plan. 2019, 17, 111–134. [Google Scholar] [CrossRef]
- Tontisirin, N.; Marome, W.; Anantasuksomsri, S. Socioeconomic Risk Assessment of Flooding in the Urban Area of Udonthani for the Risk Management of Climate Change; The Thailand Research Fund: Bangkok, Thailand, 2016. [Google Scholar]
- Nes, A.V.; López, M.J. Micro scale spatial relationships in urban studies: The relationship between private and public space and its impact on street life. In Proceedings of the 6th Space Syntax Symposium, Istanbul, Turkiye, 12–15 June 2007. [Google Scholar]
- Birkmann, J. Measuring vulnerability to promote disaster-resilient societies: Conceptual frameworks and definitions. In Measuring Vulnerability to Natural Hazards: Towards Disaster Resilient Societies; United Nations University Press: Tokyo, Japan, 2006; pp. 7–54. [Google Scholar]
- Adger, W.N. Vulnerability. Glob. Environ. Change 2006, 16, 268–281. [Google Scholar] [CrossRef]
- Cutter, S.L.; Barnes, L.; Berry, M.; Burton, C.; Evans, E.; Tate, E.; Webb, J. A place-based model for understanding community resilience to natural disasters. Glob. Environ. Change 2008, 18, 598–606. [Google Scholar] [CrossRef]
- Gupta, J.; Termeer, C.; Klostermann, J.; Meijerink, S.; Van Den Brink, M.; Jong, P.; Nooteboom, S.; Bergsma, E. The adaptive capacity wheel: A method to assess the inherent characteristics of institutions to enable the adaptive capacity of society. Environ. Sci. Policy 2010, 13, 459–471. [Google Scholar] [CrossRef]
- Adger, W.N. Social Capital, Collective Action, and Adaptation to Climate Change; Springer: Berlin/Heidelberg, Germany, 2010; pp. 327–345. [Google Scholar] [CrossRef]
- Brondizio, E.S.; Ostrom, E.; Young, O.R. Connectivity and the governance of multilevel social-ecological systems: The role of social capital. Annu. Rev. Environ. Resour. 2009, 34, 253–278. [Google Scholar] [CrossRef]


| Urban Layout Morphology Variables | Variables | Related Urban Layout Morphology Concepts and Theories |
|---|---|---|
| 1. Urban Street Networks | 1. Accessibility of Global-level Transportation Projects | Space Syntax Theory, New Urbanism Theory, Eyes on the Street Theory, CPTED Theory, Defensible Space Theory, Space Syntax Theory, Isovist Field Theory |
| 2. Accessibility of Neighborhood-level Transportation Networks | ||
| 2. Public Space Connectivity Patterns | 3. Degree of Depth between the Location and Main Streets | |
| 4. Connectivity of the Location to Main Streets | ||
| 3. Transportation Networks Sustained by Natural Movement of People and Economic Activities | 5. Level of Natural Movement | |
| 6. Commercial Building Usage Rate | ||
| 7. Building Vacancy Rate | ||
| 4. Visibility | 8. Degree of Street Intervisibility | |
| 9. Visibility Potential between the Street and the Building |
| No. | Variables | Values Used for Analysis | Data Collection Methods |
|---|---|---|---|
| 1 | Accessibility of Global-level Transportation Networks | Global Integration | Space Syntax Methods: Depthmap Analysis |
| 2 | Accessibility of Neighborhood-level Transportation Networks | Local Integration | Space Syntax Methods: Depthmap Analysis |
| 3 | Degree of Depth between the Location and Main Streets | Mean Depth | Space Syntax Methods: Manual Survey and Calculation |
| 4 | Connectivity of the Location to Main Streets | Relative Asymmetry (RA) | Space Syntax Methods: Manual Survey and Calculation |
| 5 | Level of Natural Movement | Degree of Natural Movement | Gate Count |
| 6 | Commercial Building Usage Rate | Utilization Rate of Commercial Buildings | Survey |
| 7 | Building Vacancy Rate | Vacancy Rate of Commercial Buildings | Survey |
| 8 | Degree of Street Intervisibility | Degree of Street Intervisibility | Manual Survey and Calculation |
| 9 | Visibility Potential between the Street and the Building | Street Width | Survey |
| NO. | Values Used for Analysis | N | Minimum | Maximum | Mean | Std. Deviation |
|---|---|---|---|---|---|---|
| 1 | Global Integration | 60 | 0.5343 | 0.9198 | 0.7197 | 0.0956 |
| 2 | Local Integration | 60 | 0.6269 | 3.4588 | 1.9639 | 0.7710 |
| 3 | Mean Depth | 60 | 0.0000 | 2.3300 | 1.3148 | 0.6605 |
| 4 | Relative Asymmetry (RA) | 60 | 0.0000 | 1.0000 | 0.3345 | 0.2833 |
| 5 | Degree of Natural Movement | 60 | 2.4800 | 140.6900 | 50.6298 | 37.3138 |
| 6 | Utilization Rate of Commercial Buildings | 60 | 4.0000 | 100.0000 | 56.1610 | 29.9662 |
| 7 | Vacancy Rate of Commercial Buildings | 60 | 0.0000 | 93.7500 | 32.4083 | 25.3156 |
| 8 | Degree of Street Intervisibility | 60 | 0.0600 | 1.0000 | 0.6083 | 0.2845 |
| 9 | Street Width | 60 | 4.0000 | 28.0000 | 10.7666 | 5.3752 |
| Kaiser–Meyer–Olkin measure of sampling adequacy | 0.817 | |
| Bartlett’s test of sphericity | Approx. Chi-Square | 740.130 |
| df | 36.000 | |
| Sig. | 0.000 | |
| No. | Variable | Factor Loading | |
|---|---|---|---|
| Component 1 | Component 2 | ||
| 1 | Vacancy Rate | −0.925 | |
| 2 | Degree of Street Intervisibility | 0.924 | |
| 3 | Utilization Rate of Commercial Buildings | 0.898 | |
| 4 | Relative Asymmetry (RA) | −0.847 | |
| 5 | Degree of Natural Movement | 0.817 | |
| 6 | Mean Depth (MD) | −0.657 | |
| 7 | Street Width | 0.634 | |
| 8 | Global Integration | 0.926 | |
| 9 | Local Integration | 0.778 | |
| Initial Eigenvalues | Extraction Sums of Squared Loadings | Rotation Sums of Squared Loadings | |||||||
|---|---|---|---|---|---|---|---|---|---|
| Component | Total | % of Variance | Cumulative % | Total | % of Variance | Cumulative % | Total | % of Variance | Cumulative % |
| 1 | 6.230 | 69.227 | 69.227 | 6.230 | 69.227 | 69.227 | 4.986 | 55.399 | 55.399 |
| 2 | 1.112 | 12.356 | 81.583 | 1.112 | 12.356 | 81.583 | 2.357 | 26.184 | 81.583 |
| Component | Variable | Factor Loading | Positive/Negative Correlation | % of Variance |
|---|---|---|---|---|
| Component 1 | Vacancy Rate | −0.925 | Negative | 55.399 |
| Degree of Street Intervisibility | 0.924 | Positive | ||
| Utilization Rate of Commercial Buildings | 0.898 | Positive | ||
| Relative Asymmetry (RA) | −0.847 | Negative | ||
| Degree of Natural Movement | 0.817 | Positive | ||
| Mean Depth | −0.657 | Negative | ||
| Visibility | 0.634 | Positive | ||
| Component 2 | Global Integration | 0.926 | Positive | 26.184 |
| Local Integration | 0.778 | Positive |
| Descriptive Statistics | N | Minimum | Maximum | Mean | Std. Deviation | Ranking |
|---|---|---|---|---|---|---|
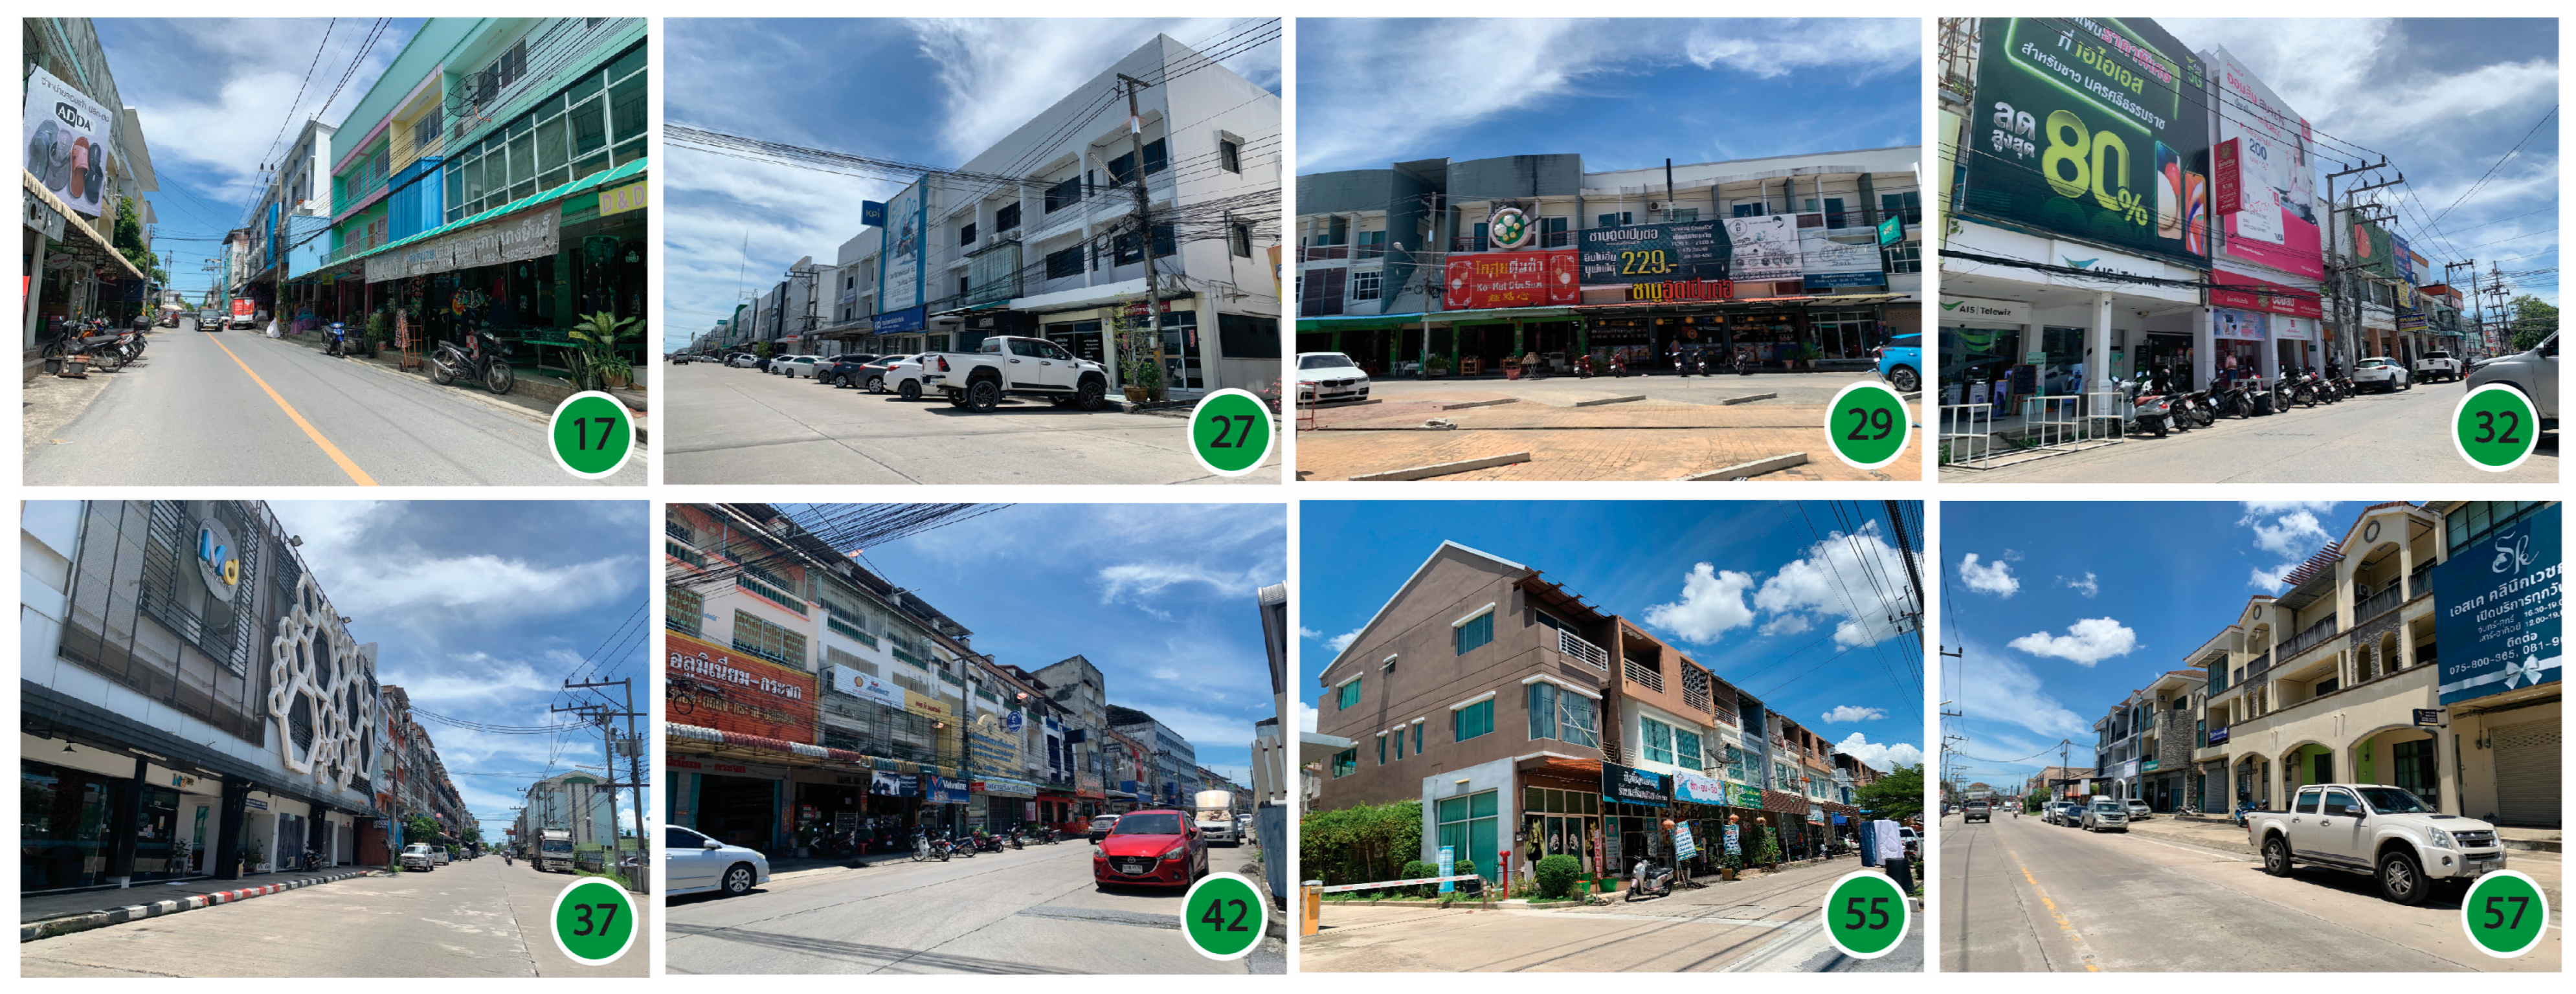
| PVI: Component 1 | 11 | 3.7402 | 4.9321 | 4.523918 | 0.2900815 | Low Physical Vulnerability |
| PVI: Component 2 | 11 | 0.2482 | 0.9020 | 0.543727 | 0.2645573 | |
| PVI | 11 | 3.9884 | 5.8340 | 5.067664 | 0.4988304 | |
| Z-score_PVI | 11 | 1.3046 | 1.9083 | 1.657636 | 0.1631639 |
| Descriptive Statistics | N | Minimum | Maximum | Mean | Std. Deviation | Ranking |
|---|---|---|---|---|---|---|
| PVI: Component 1 | 15 | 0.2938 | 3.2840 | 1.170807 | 0.8130417 | Moderately Low Physical Vulnerability |
| PVI: Component 2 | 15 | −0.4213 | 0.4371 | 0.049280 | 0.3035649 | |
| PVI | 15 | 0.0923 | 3.0425 | 1.220100 | 0.9317773 | |
| Z-score_PVI | 15 | 0.0302 | 0.9952 | 0.399113 | 0.3047823 |
| Descriptive Statistics | N | Minimum | Maximum | Mean | Std. Deviation | Ranking |
|---|---|---|---|---|---|---|
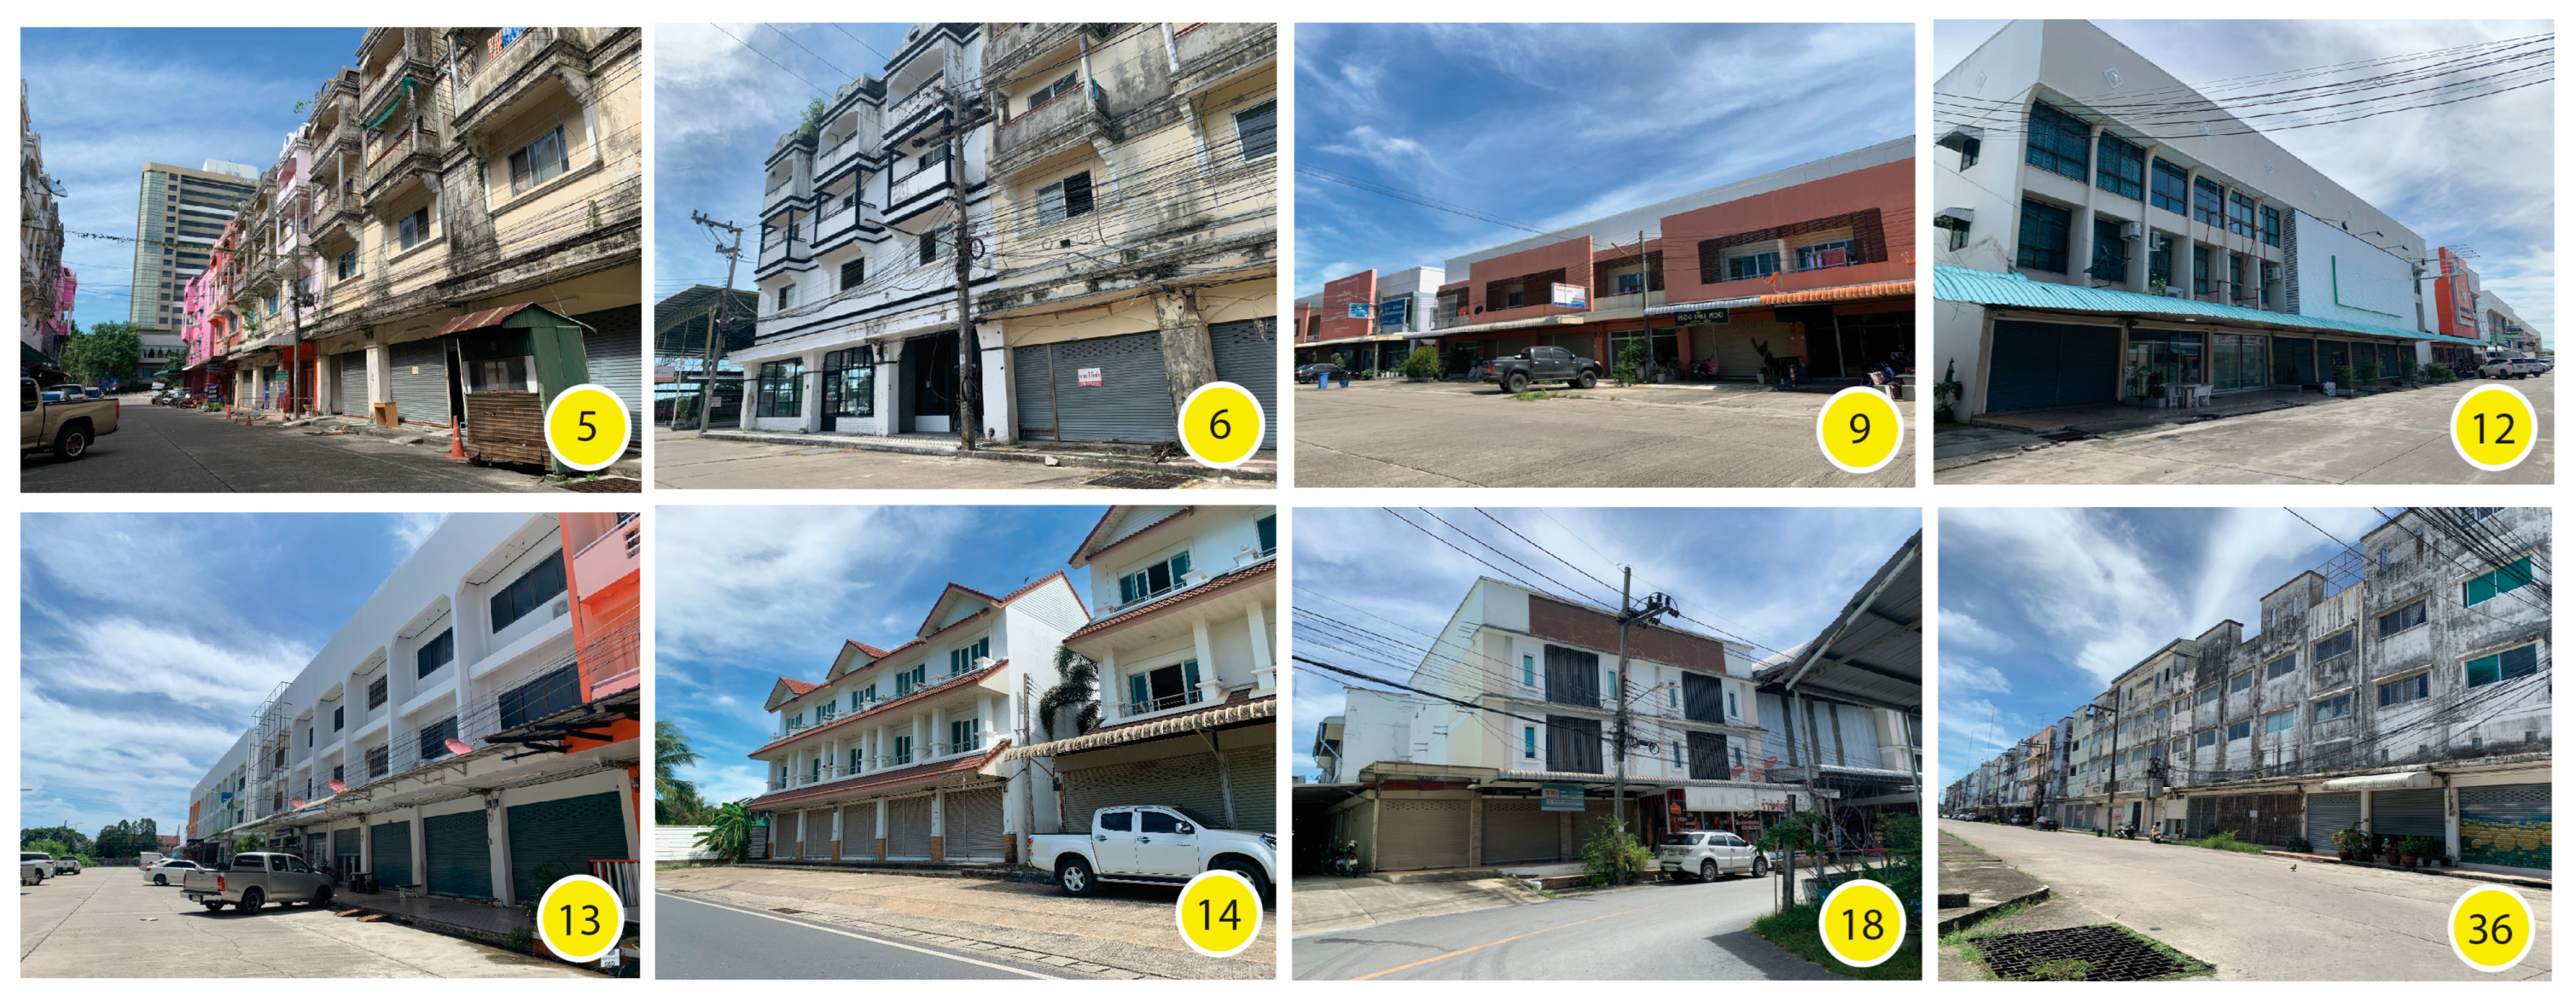
| PVI: Component 1 | 26 | −2.7492 | 0.2913 | −1.294754 | 0.8885008 | Moderately High Physical Vulnerability |
| PVI: Component 2 | 26 | −0.6550 | 0.4247 | −0.228285 | 0.2954769 | |
| PVI | 26 | −2.9462 | −0.0439 | −1.523054 | 0.9485837 | |
| Z-score_PVI | 26 | −0.9637 | −0.0144 | −0.498196 | 0.3102872 |
| Descriptive Statistics | N | Minimum | Maximum | Mean | Std. Deviation | Ranking |
|---|---|---|---|---|---|---|
| PVI: Component 1 | 8 | −4.9637 | −3.6678 | −4.207662 | 0.5200152 | High Physical Vulnerability |
| PVI: Component 2 | 8 | −0.5668 | 0.3562 | −0.098150 | 0.3544636 | |
| PVI | 8 | −4.8788 | −3.8826 | −4.305812 | 0.3453469 | |
| Z-score_PVI | 8 | −1.5959 | −1.2700 | −1.408437 | 0.1129653 |
| Component | Factor | Characteristics of Physical Vulnerability |
|---|---|---|
| Component 1 Micro-level Morphological Structure | 1. Configuration of Space | Non-distributed street network; dead-end or cul-de-sac streets |
| High depth between the location and main roads | ||
| Low street intervisibility | ||
| 2. Characteristics and Rate of Space Utilization | High building vacancy rate | |
| Low street intervisibility | ||
| Low level of natural movement | ||
| Component 2 Macro-level Morphological Structure | 1. Accessibility of Global-level Transportation Networks | Low accessibility of global-level transportation networks |
| 2. Accessibility of Neighborhood-level Transportation Networks | Low accessibility of neighborhood-level transportation networks |
Disclaimer/Publisher’s Note: The statements, opinions and data contained in all publications are solely those of the individual author(s) and contributor(s) and not of MDPI and/or the editor(s). MDPI and/or the editor(s) disclaim responsibility for any injury to people or property resulting from any ideas, methods, instructions or products referred to in the content. |
© 2025 by the authors. Licensee MDPI, Basel, Switzerland. This article is an open access article distributed under the terms and conditions of the Creative Commons Attribution (CC BY) license (https://creativecommons.org/licenses/by/4.0/).
Share and Cite
Thinnakorn, R.; Chanklap, B.; Tongseng, I. Morphological Structural Factors Affecting Urban Physical Vulnerability: A Case Study of the Spatial Configuration of Commercial Buildings in Nakhon Si Thammarat, Thailand. Sustainability 2025, 17, 4845. https://doi.org/10.3390/su17114845
Thinnakorn R, Chanklap B, Tongseng I. Morphological Structural Factors Affecting Urban Physical Vulnerability: A Case Study of the Spatial Configuration of Commercial Buildings in Nakhon Si Thammarat, Thailand. Sustainability. 2025; 17(11):4845. https://doi.org/10.3390/su17114845
Chicago/Turabian StyleThinnakorn, Rawin, Boontaree Chanklap, and Iayang Tongseng. 2025. "Morphological Structural Factors Affecting Urban Physical Vulnerability: A Case Study of the Spatial Configuration of Commercial Buildings in Nakhon Si Thammarat, Thailand" Sustainability 17, no. 11: 4845. https://doi.org/10.3390/su17114845
APA StyleThinnakorn, R., Chanklap, B., & Tongseng, I. (2025). Morphological Structural Factors Affecting Urban Physical Vulnerability: A Case Study of the Spatial Configuration of Commercial Buildings in Nakhon Si Thammarat, Thailand. Sustainability, 17(11), 4845. https://doi.org/10.3390/su17114845