Abstract
To achieve high-quality development, the Chinese government has proposed the establishment of Green Finance Reform and Innovation Pilot Zones (GFRIPZs). Green finance enhances environmental governance, guides capital flows, and supports sustainable economic growth. Against the backdrop of the “dual carbon” goals (carbon peaking and carbon neutrality), this study examines whether green finance significantly drives urban energy structure transition and explores its underlying mechanisms. Leveraging the GFRIPZ policy as a quasi-natural experiment, we construct a multi-period Difference-in-Differences (DID) model to systematically analyze the impact of green finance on energy structure transition. The findings reveal that the GFRIPZ policy significantly accelerates urban energy structure transition, with stronger effects observed in resource-based cities, central and western regions, and cities with higher administrative levels. Green finance drives this transition through the mediating effects of green technological innovation and resource allocation efficiency, while the digital economy further amplifies its positive impact. This study concludes that green finance effectively promotes urban energy structure transition and supports high-quality economic development. These findings provide empirical evidence and policy insights for advancing China’s energy revolution and achieving its climate objectives.
1. Introduction
The global climate crisis is reshaping human development agendas at an unprecedented pace. Over the coming decades, Earth’s climate will undergo significant changes due to anthropogenic greenhouse gas and aerosol emissions, and the primary goal of any mitigation strategy to avoid climate change risks is to reduce greenhouse gas emissions [1]. China’s 20th National Congress explicitly emphasized “promoting clean, low-carbon, and efficient energy utilization”, while the State Council’s Action Plan for Carbon Peaking Before 2030 set a binding target to increase the share of non-fossil energy consumption to 25% by 2030. These initiatives underscore energy structure transition as a cornerstone of China’s high-quality development. Globally, however, this transition faces formidable barriers: the existence of various barriers to energy efficiency [2] and energy poverty persist [3]. For China, as a latecomer to industrialization, the task is uniquely daunting. Unlike early industrializers such as the UK and France, which transitioned gradually from coal to oil and renewables over centuries, China must face the double pressure of the sustainable development of energy use and environmental protection [4].
The escalating energy crisis and the environmental toll of fossil fuel use demand urgent action. Excessive reliance on fossil fuels not only depletes finite resources but also exacerbates pollution, threatening public health [5]. Transitioning to cleaner energy systems is imperative. Yet, China’s energy structure optimization faces challenges such as the lack of coordination and consistence in policy, completeness in encouragement systems, and innovation in regional policy [6]. As the backbone of the economy, the financial sector must assume a pivotal role in addressing these challenges by leveraging green finance to drive structural reforms.
China has emerged as a global leader in green finance policy implementation [7]. Since the 2016 Guidelines for Building a Green Financial System, the country’s green finance framework has rapidly matured. By 2019, China’s green bond issuance exceeded CNY 3.39 trillion, accounting for 21.3% of the global total, while green loans surged from CNY 4.85 trillion in 2013 to CNY 8.3 trillion in 2017, driving systemic reductions in carbon emissions [8]. Despite these advancements, scholarly research on how green finance facilitates energy structure transition remains underdeveloped. Critical questions persist: Can green finance catalyze China’s energy transition? Does its impact vary across regions? Through which pathways does it operate? What factors influence its effectiveness, and how can policies be optimized? Addressing these questions holds profound theoretical and practical significance for understanding green finance’s role in sustainable development.
This study leverages panel data from 259 Chinese cities (2012–2022) and employs the GFRIPZ policy as an exogenous shock to empirically test green finance’s impact on energy structure transition using a multi-period DID model. The findings demonstrate that green finance significantly accelerates energy structure transition, with robustness checks confirming the results. Dynamic effect analysis reveals intensified policy impacts post implementation. Heterogeneity analysis highlights stronger effects in resource-based cities, central–western regions, and cities with higher administrative levels. Mechanism analysis identifies green technological innovation and resource allocation efficiency as key pathways, while the digital economy, particularly artificial intelligence, emerges as a positive moderator. These insights provide actionable recommendations for leveraging green finance to advance China’s energy transition and achieve its dual carbon goals.
This study contributes to the literature in three ways. First, it expands research on the economic and environmental impacts of green finance policies, enriching the theoretical framework of green finance. However, research studies have overlooked green finance initiatives on energy structure transition to some extent [9]. On the basis of exploring energy innovation under the impact of green finance [10], this work constructs a quasi-natural experiment based on the GFRIPZ policy, offering novel evidence on green finance’s role in energy transition and enhancing policy-oriented energy economics research in the Chinese context. Second, it uncovers the intrinsic mechanisms linking green finance to energy optimization. Existing studies largely focus on green finance’s relationship with emissions instead of its mechanism [11], especially with the limited exploration of resource allocation mechanisms [10]. By integrating green innovation and resource allocation efficiency, this study deepens our understanding of how policy-driven financial mechanisms reshape energy systems. Additionally, while prior research emphasizes technological progress [12] and carbon efficiency [13], this work introduces the digital economy, especially AI, as a moderating factor, broadening the analytical scope. Third, it proposes targeted policy recommendations to enhance green finance’s practical relevance. Despite mature green finance practices, regulatory frameworks remain underdeveloped [14]. Although some studies have analyzed the effects of influencing green finance and energy structure, there is relatively little focus on the analysis of heterogeneity differences in urban levels [15]. By analyzing heterogeneity across city tiers, regions, and resource endowments, this study provides nuanced insights for policymakers to tailor strategies and optimize energy structures.
2. Literature and Policy Context
2.1. Literature
2.1.1. Green Finance
Research on green finance has matured significantly in recent years, focusing on three main dimensions: foundations of green finance, implementation tools of green finance and economic impacts of green finance.
First, foundations of green finance: Yu and An (2024) analyzed the comprehensive impact of green finance on carbon emissions and removal from a carbon finance perspective, finding that green finance effectively curbs emissions and promotes carbon neutrality [16]. Chen et al. (2021) identified carbon emissions trading as a core mechanism of carbon finance, demonstrating its role in channeling green funds to low-carbon industries and achieving emission reduction targets [17]. Eichner and Pethig (2014) explored strategic incentives for green energy subsidies under carbon pricing systems, highlighting how subsidies influence carbon prices and, consequently, green finance [18]. Mondal et al. (2024) further emphasized the role of AI in driving net-zero transitions in emerging economies, underscoring AI’s potential to reduce emissions and foster green growth [19].
Second, implementation tools of green finance: Wang et al. (2021) developed a green finance index to examine its market linkages [20]. Subsequent studies revealed that this index captures the effects of green bonds [21], green credit [22], green investments [23] and green insurance [24]. Additionally, policies such as the GFRIPZ have advanced green finance through ecological product valuation [25], enhanced information disclosure [26], and eased financing constraints [27].
Third, economic impacts of green finance: Yang et al. (2022) argued that green finance stimulates corporate green innovation, mediated by environmental regulations [28]. Xu (2022) linked manufacturing capacity and pilot policies to significant carbon reductions [29]. Umar and Safi (2023) identified long-term interactions among green finance, green innovation, environmental policy stringency, GDP, trade, and carbon emissions [9]. Collectively, these studies illustrate the multifaceted perspectives and robust theoretical foundation underpinning green finance research.
2.1.2. Energy Structure Transition
Scholars have explored energy structure transition through three lenses: energy policies and institutional mechanisms, energy structure and technological innovation and energy markets and dynamic analysis.
First, energy policies and institutional mechanisms: Yang et al. (2022) employed quasi-natural experiments to assess renewable energy policies’ heterogeneous impacts on green innovation [30]. Eichner and Pethig (2014) and Zhang et al. (2023) evaluated carbon trading and green finance pilot zones, respectively, demonstrating their critical roles in advancing low-carbon energy transitions [18,31].
Second, energy structure and technological innovation: Technological innovation is widely recognized as a key driver of low-carbon transitions. Zhang and Yu (2024) examined regional innovation’s role in optimizing energy structures [32], while Tao et al. (2024) highlighted AI’s transformative potential in accelerating energy transitions [33]. Zhang et al. (2025) expanded this perspective globally, revealing the multifaceted effects of innovation on energy systems [34].
Third, energy markets and dynamic analysis: Research on energy markets elucidates the complexity and dynamism of transition processes. Yang et al. (2022) projected renewable energy potential through 2099 using climate models [1]. Liao et al. (2011) categorized renewable markets into three stages—undeveloped, developing, and mature—proposing tailored strategies for each [35]. Shi and Yang (2024) expanded this discourse by integrating digital inclusive finance into energy–finance interactions, offering insights for policymaking and market regulation [36].
2.1.3. Literature Gaps
While existing studies employ diverse models to explore the relationships between green finance, environmental outcomes, and energy systems, critical gaps persist. First, the majority of research isolates green finance or energy structure transition, with the limited integration of the two domains. Second, while green finance is posited to drive energy transition, the specific mechanisms—particularly how financial instruments interact with technological and institutional factors—remain underexamined. This study addresses these gaps by synthesizing these dimensions, offering a holistic framework to inform sustainable development strategies and policy design for China’s ecological modernization.
2.2. Policy Context
As the world’s largest developing economy, China has prioritized green finance and energy structure optimization [37]. Since the 18th National Congress of the Communist Party of China, the country has established a multi-tiered green financial system dominated by green loans and bonds. In August 2016, the People’s Bank of China (PBOC) issued the Guidelines for Building a Green Financial System, outlining nine key areas—including green credit and investment—to institutionalize green finance. In 2017, China designated 12 regions as the GFRIPZ to test policies supporting low-carbon transitions. These zones pioneered innovative tools such as carbon-neutral bonds, enhanced environmental disclosure requirements, and performance-based regulatory frameworks, establishing a dual-path model of “policy guidance and market-driven mechanisms”.
In 2024, the PBOC and three other ministries released the Opinions on Leveraging Green Finance to Support the Construction of a Beautiful China, further aligning green finance with national decarbonization goals. Future expansions of the pilot zones to Shandong, Shanghai, and other regions aim to deepen integration between green finance and innovation-driven development.
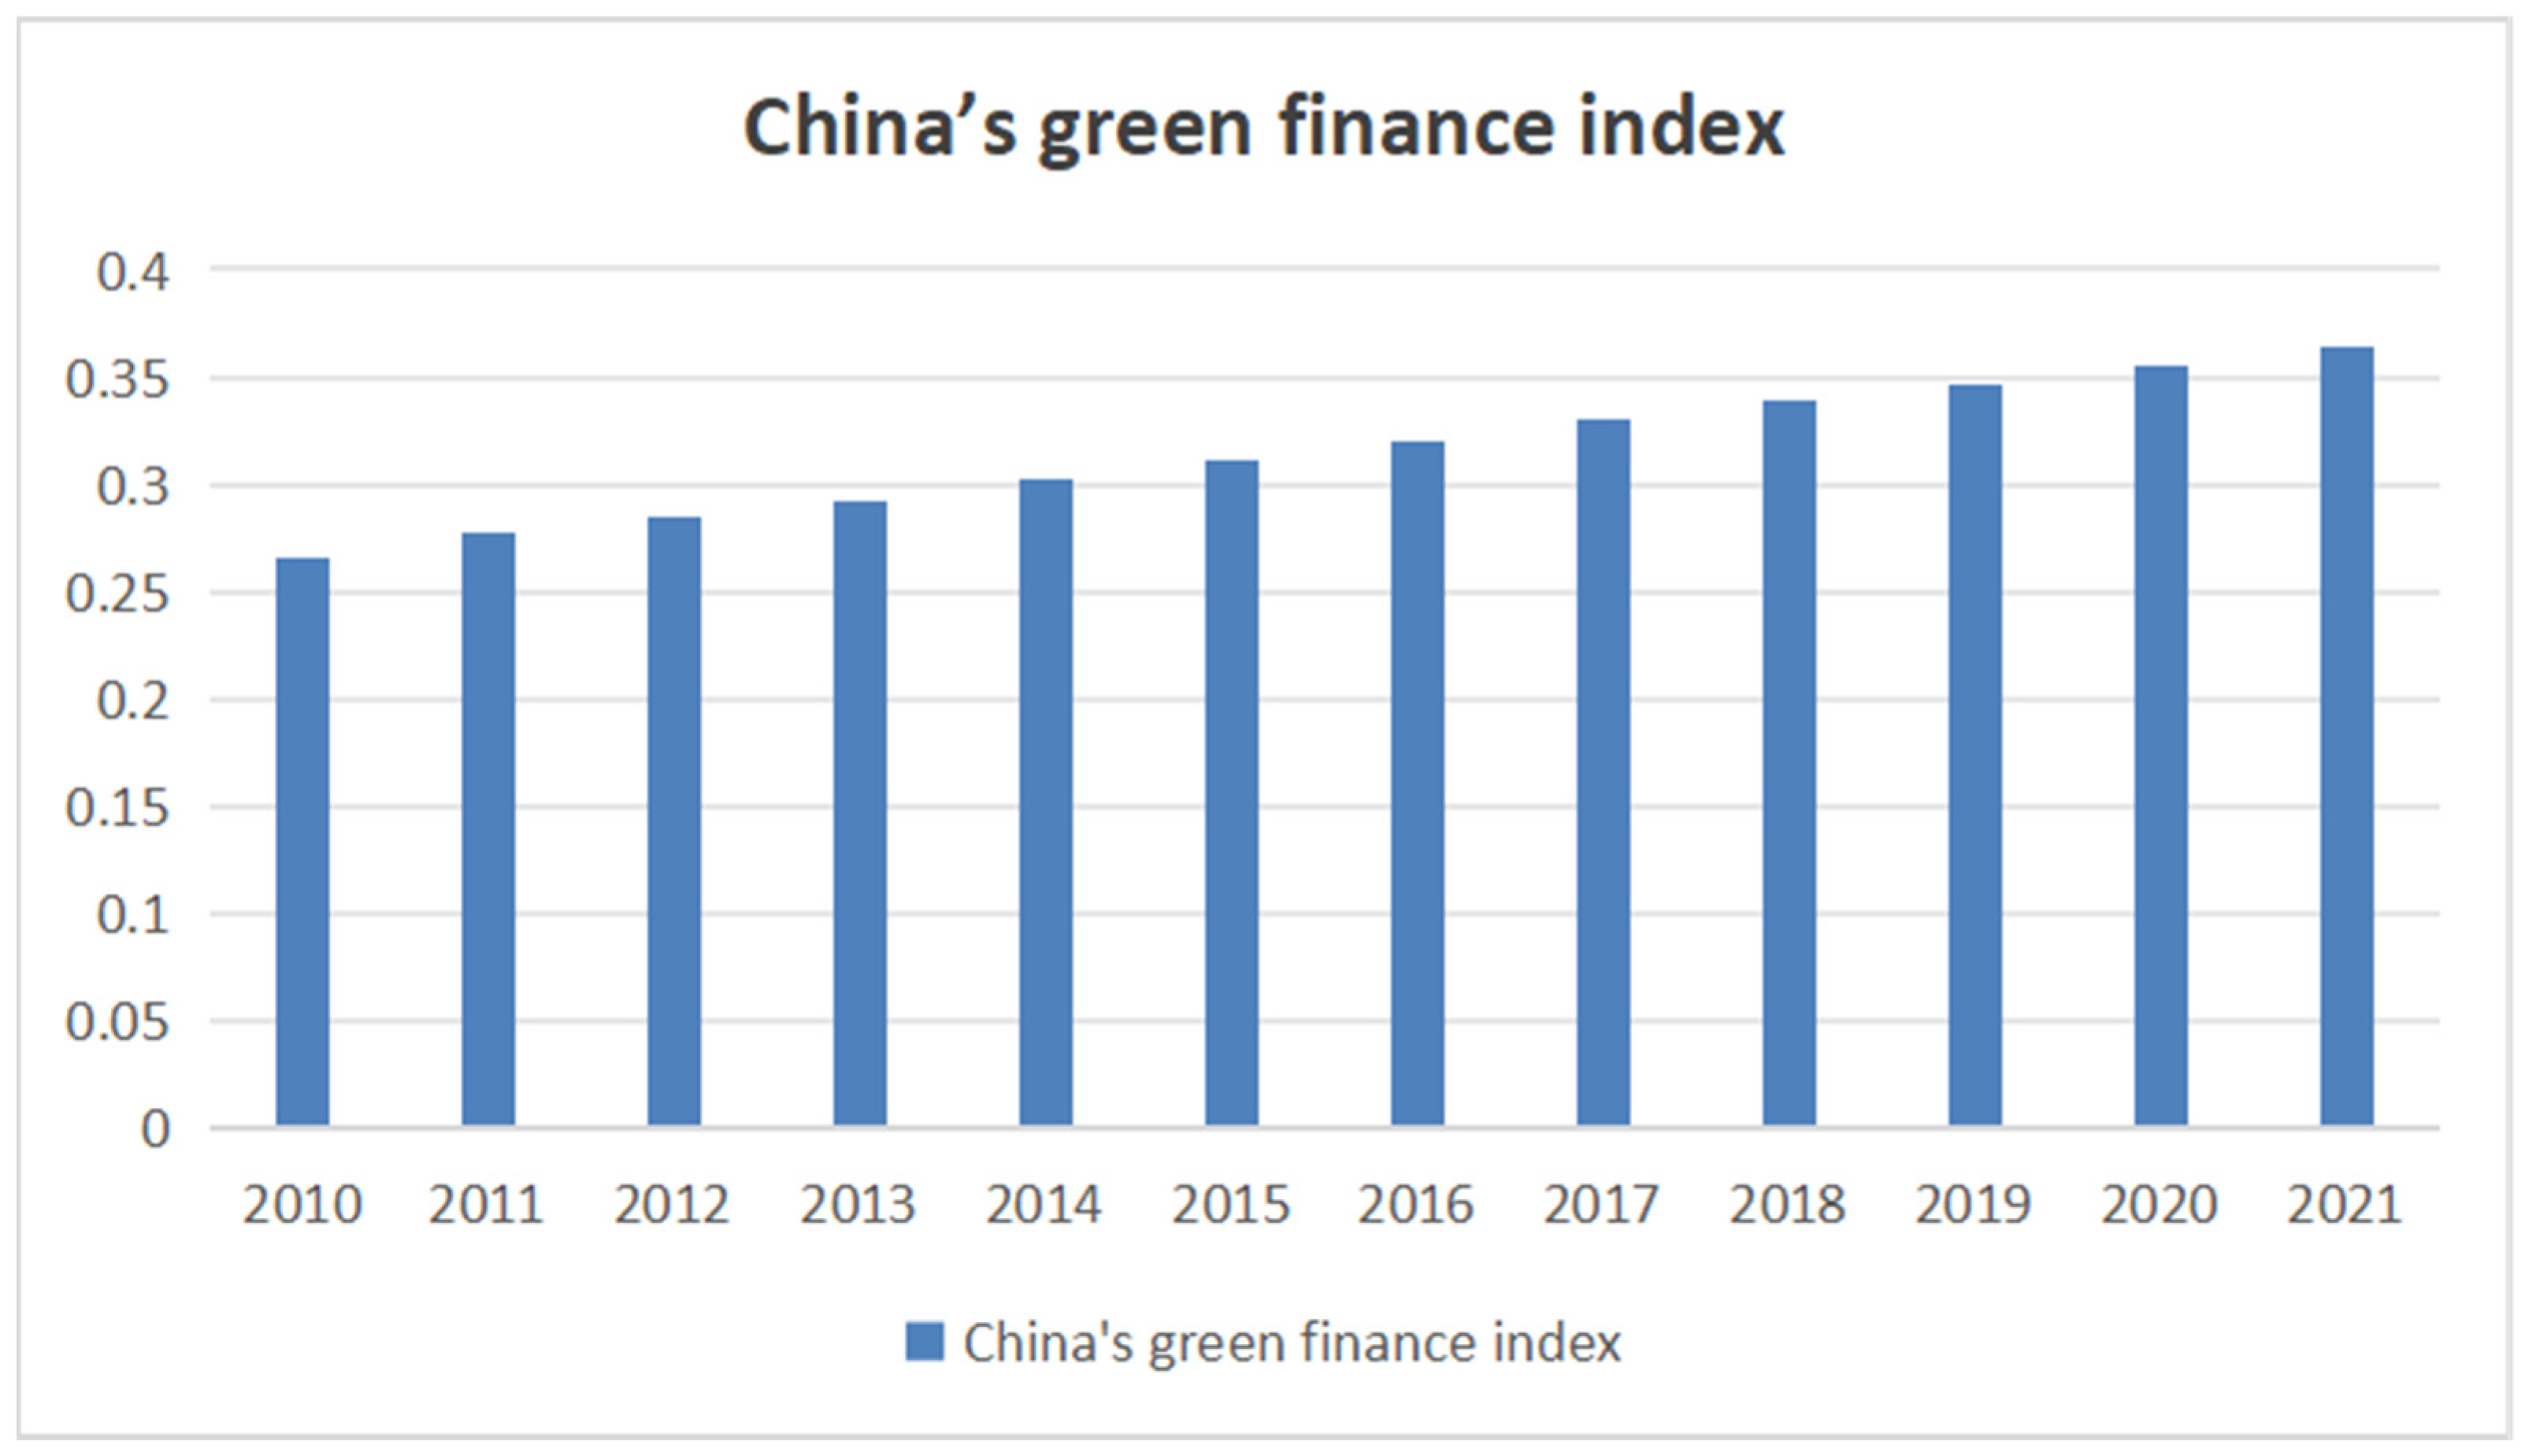
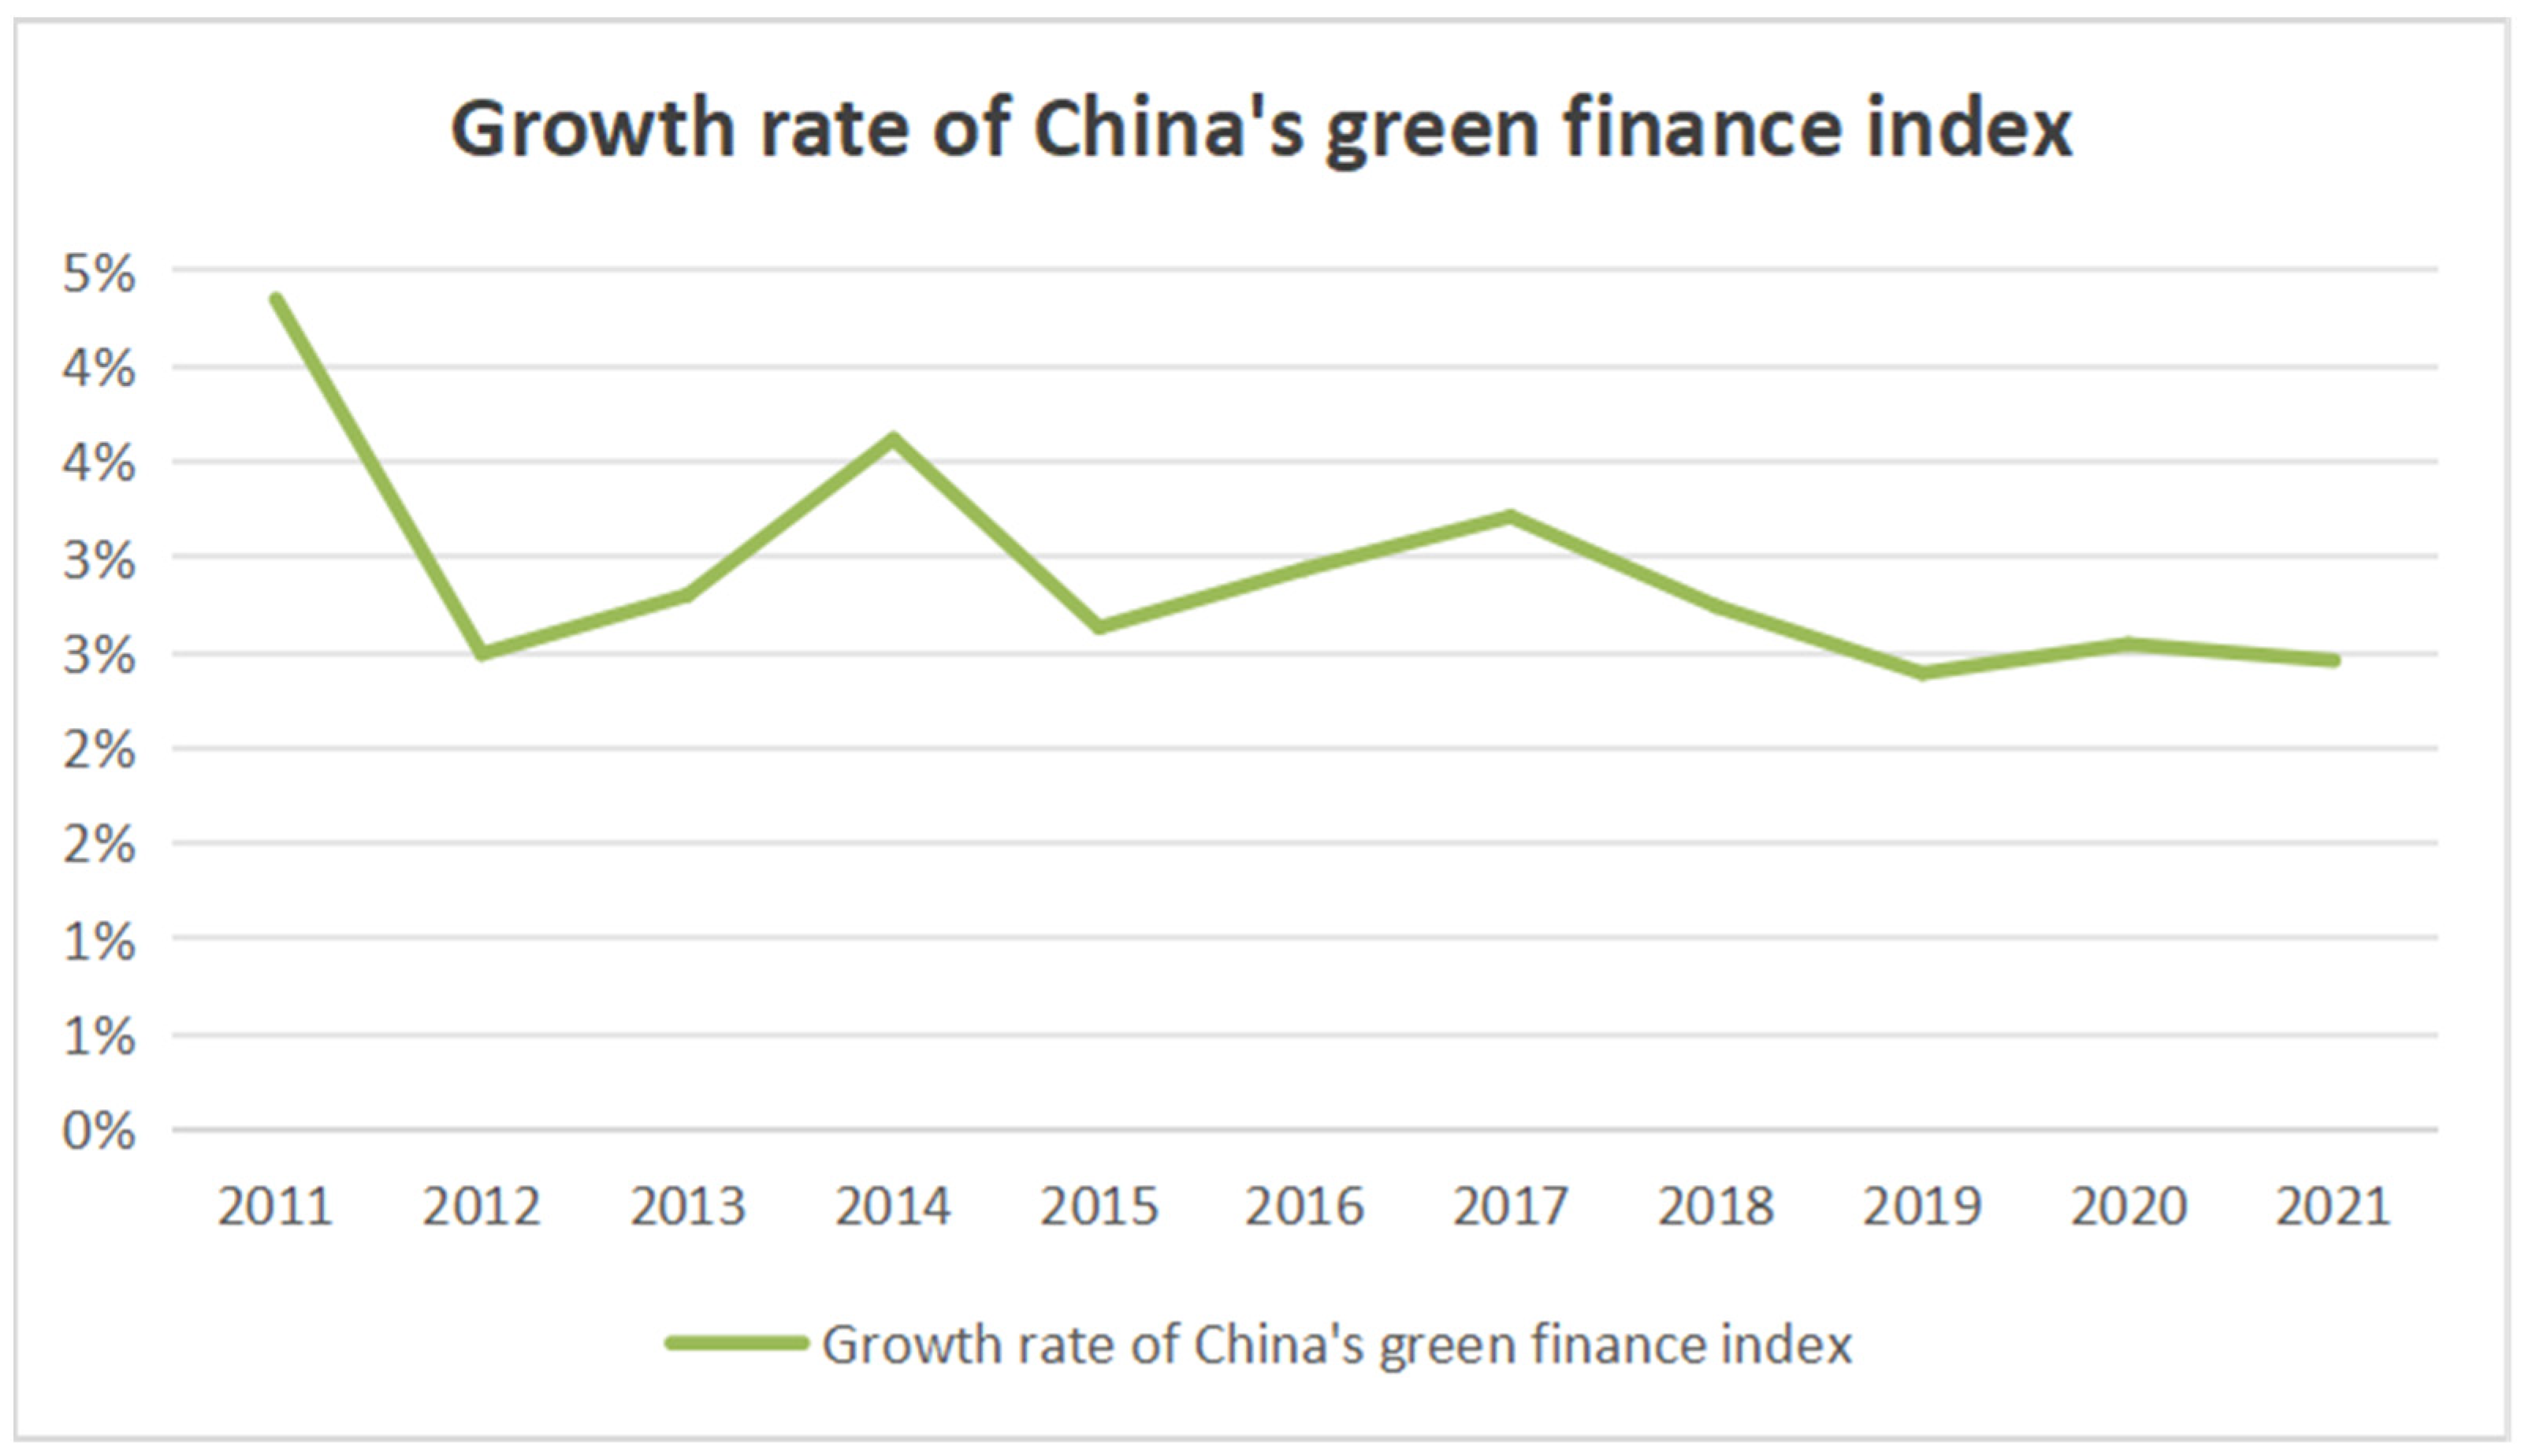
Empirical evidence underscores the policy’s success. As illustrated in Figure 1, China’s green finance index exhibited steady growth from 2010 to 2021, reflecting the sector’s maturation. Figure 2 reveals a declining yet stabilizing growth rate post 2017, signaling institutional consolidation. For instance, Lanzhou’s “Green Finance Hub” platform mobilized CNY 134 billion for ecological restoration in the Yellow River Basin, exemplifying localized policy impacts.
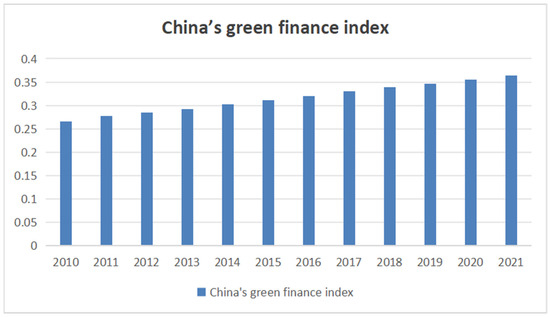
Figure 1.
China’s green finance index. Data source: This figure was drawn by the authors using an Excel spreadsheet; the same applies below.
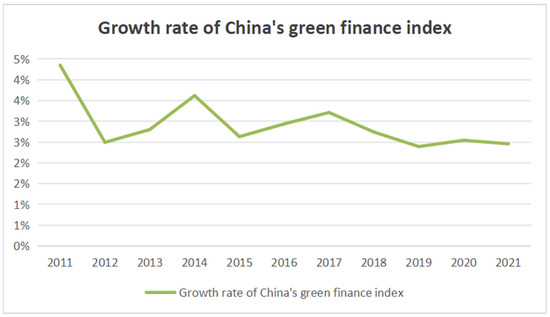
Figure 2.
Growth rate of China’s green finance index.
3. Theoretical Framework Components and Hypothesis Formulation
China’s energy structure is transitioning from traditional fossil fuels to renewable energy. While traditional energy sources remain dominant, their severe environmental impacts necessitate advanced technologies and increased investment in renewables [38]. Green finance plays a pivotal role in fostering low-carbon industries, accelerating the implementation of clean energy projects, and optimizing the energy mix. For instance, stringent environmental regulations driven by green finance compel high-pollution industries to adopt cleaner practices, enhancing their long-term viability [28]. Concurrently, the GFRIPZ regulate capital flows through the allocation of financial resources such as financing costs and financing scales, directing financial resources toward high-quality green energy projects [39].
3.1. The Direct Impact of the GFRIPZ on Energy Structure Transition
Green finance directly facilitates energy structure optimization. First, it reshapes the efficiency of energy market resource allocation with amplified effects under major policy shifts or external risks [36]. Second, green finance incentivizes innovation in clean energy technologies, improving efficiency and reliability. Enhanced technological capabilities enable firms to boost production capacity, develop eco-friendly products, and strengthen market competitiveness [25]. Collaborative efforts among governments, markets, and enterprises progressively elevate clean energy adoption, driving structural reforms [40]. Based on this, we propose the following hypothesis:
H1.
Green finance significantly promotes energy structure transition.
3.2. Indirect Impacts of the GFRIPZ on Energy Structure Transition
3.2.1. Green Technological Innovation
Green finance indirectly stimulates energy transition by fostering technological innovation. Financial institutions develop tailored instruments such as green credit, bonds, and funds to support low-carbon projects, while digital platforms enhance market accessibility. Carbon trading policies, implemented within market incentive environmental policies, improve carbon pricing efficiency and energy utilization under innovation [17]. Given the economic uncertainties and long payback periods inherent in structural reforms, robust financial systems are critical to incentivizing corporate green innovation. Drawing on international insights, such as the structural equation modeling of organizational learning by Alegre and Chiva (2008) [41], the analysis of R&D intensity and regional specialization by Michael and Viktor (2010) [42], and the patent-driven innovation studies by Thomas et al. (2015) [43], this study posits the following hypothesis:
H2.
Green finance drives energy structure transition through green technological innovation.
3.2.2. Resource Allocation Efficiency
Green finance enhances resource allocation efficiency [39], directing capital to low-carbon projects with the highest environmental potential. Financial institutions prioritize eco-friendly ventures, optimizing the distribution of green resources and reducing carbon-intensive energy consumption [44]. Based on this, we propose the following hypothesis:
H3.
Green finance promotes energy structure transition by improving resource allocation efficiency.
3.2.3. Moderating Role of Digital Economy
Emerging digital technologies revolutionize green finance practices, addressing inefficiencies in financial services and resource allocation. Industrial internet platforms empower firms to digitize operations and realize the dynamic leapfrogging process of digital transformation in traditional manufacturing enterprises [45]. Digital tools not only accelerate clean energy adoption [46] but also enhance urban ecological efficiency [47], moderating the socio-economic costs of structural shifts [48]. Based on this, we propose the following hypothesis:
H4.
The digital economy positively moderates the impact of green finance on low-carbon energy transition.
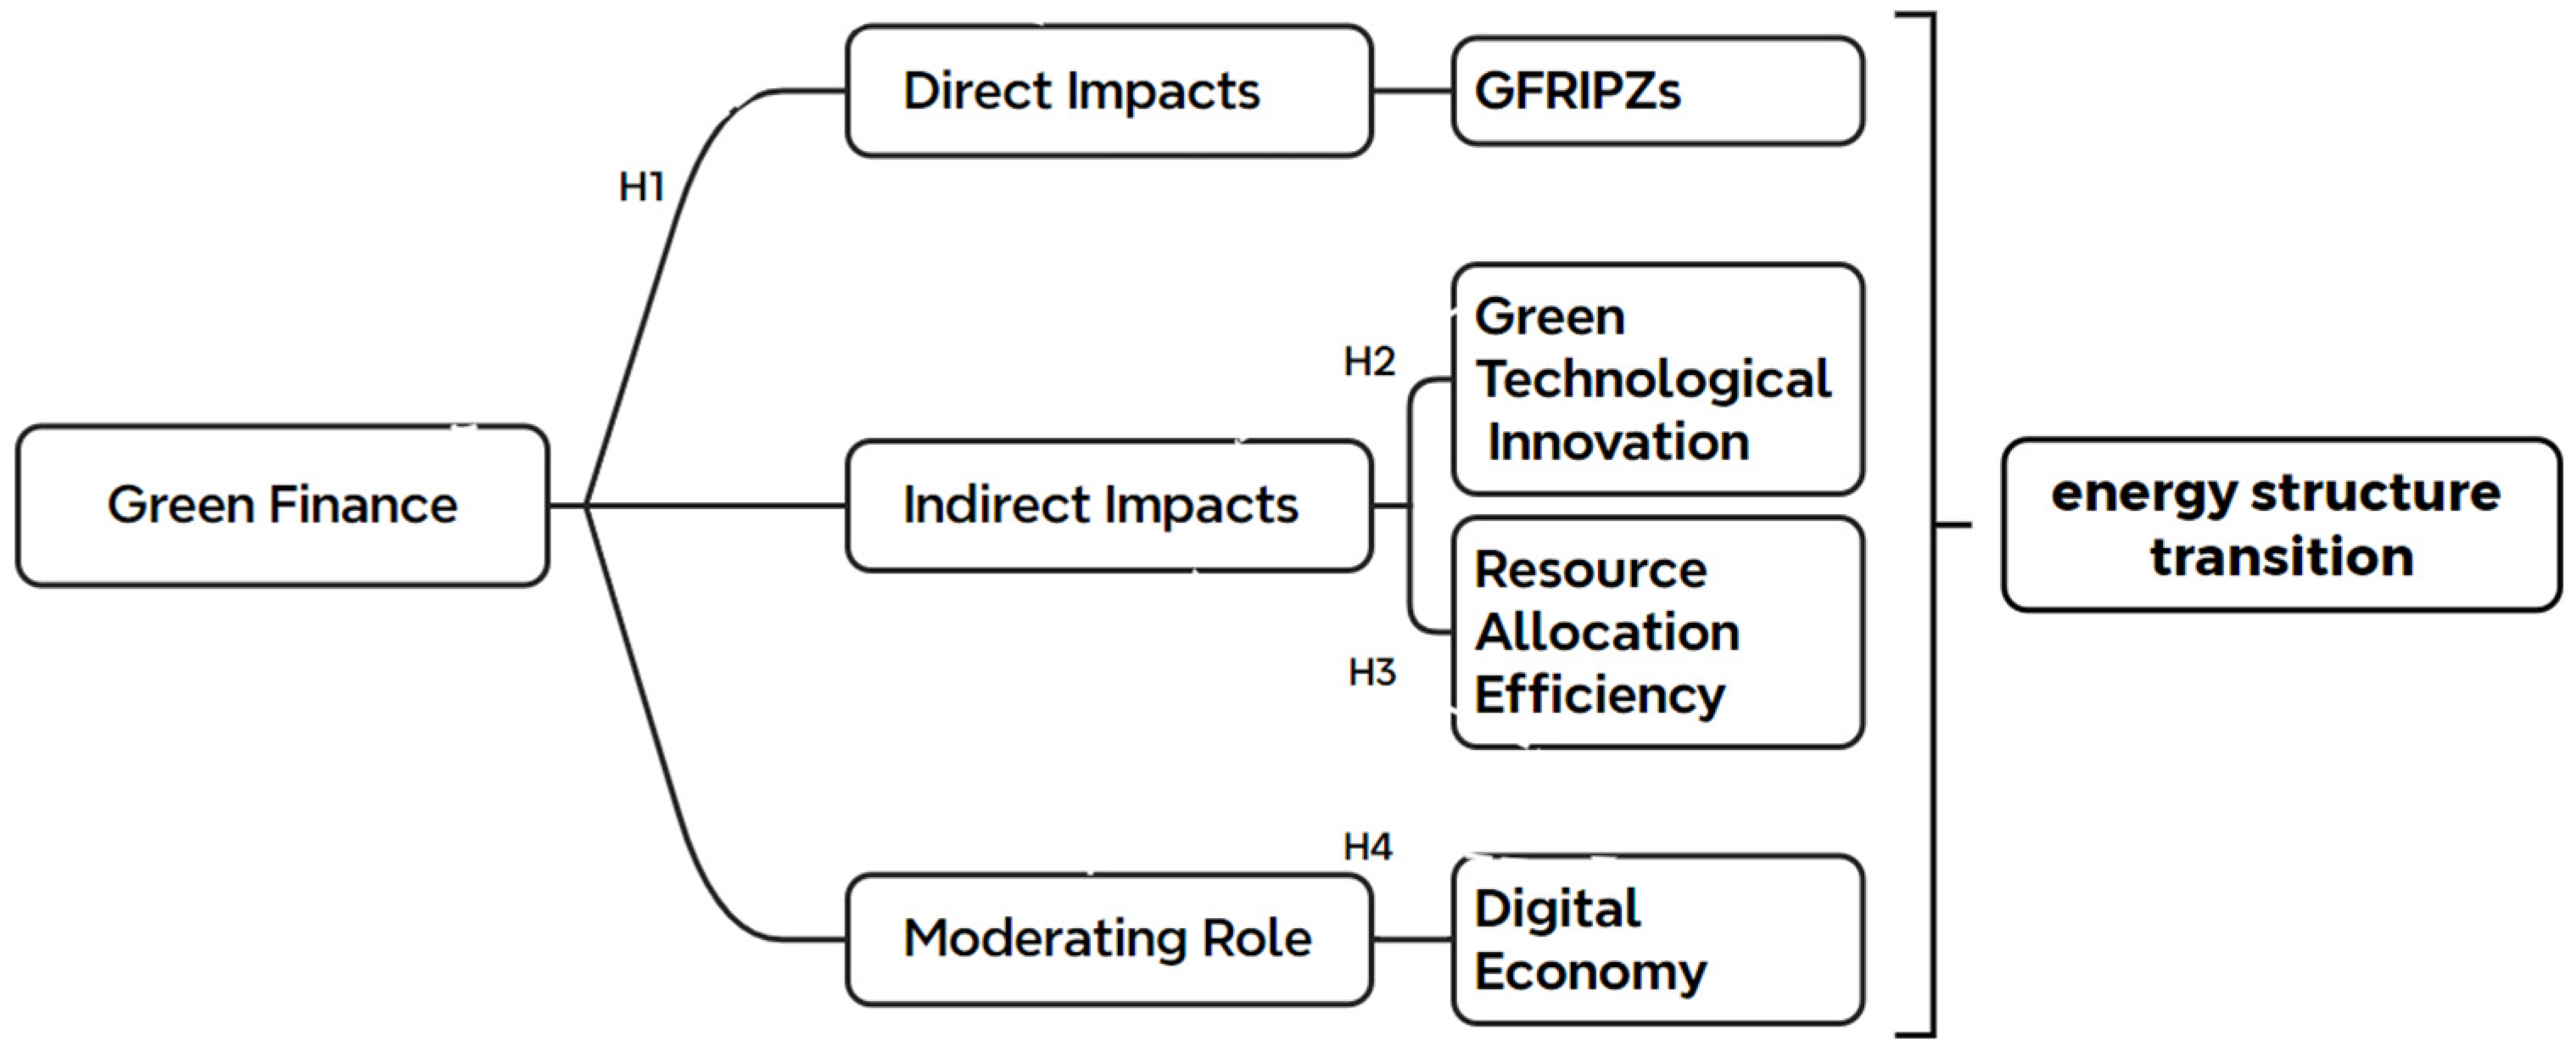
The theoretical framework is illustrated in Figure 3.
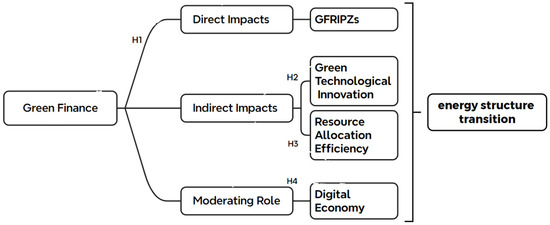
Figure 3.
The theoretical framework.
4. Method and Data
4.1. Model Specification
The Difference-in-Differences (DID) method is a prominent quasi-experimental approach in econometric policy evaluation [49]. Its strength lies in leveraging natural experiment designs to mitigate selection bias inherent in observational studies, thereby enhancing causal inference robustness [50]. This method is particularly effective for assessing localized policy interventions or exogenous shocks—such as regulatory reforms or natural disasters—where randomized controlled trials are infeasible.
Our empirical specification adopts a two-way fixed effects estimator within the DID framework, with cluster-robust standard errors reported at the provincial level. This approach achieves three objectives: (1) controlling for unobserved time-invariant heterogeneity and aggregate temporal shocks [10], (2) addressing potential cross-sectional dependence through intra-cluster error correlation [51], and (3) maintaining policy independence assumptions across provincial boundaries [52].
Thus, to assess the impact of the GFRIPZ policy on urban energy structure transition, this study employs a multi-period DID model with city and year fixed effects. The model is specified as follows:
In the model, and denote city and year, respectively. represents the energy structure transition, measured by the logarithm of renewable energy patents. is the GFRIPZ. includes control variables: economic growth rate, industrial structure upgrading index, foreign direct investment, and population size. and capture city and year fixed effects. is the error term. Positive and significant coefficient indicates that the GFRIPZ policy promotes energy structure transition.
4.2. Variable Definitions
4.2.1. Dependent Variable
Following Cheng and Yao (2021), the dependent variable is the logarithm of renewable energy patents [53]. Renewable energy patents reflect investments in clean technologies and serve as a proxy for energy structure transition.
4.2.2. Core Independent Variable
The key explanatory variable is the GFRIPZ policy dummy , constructed as follows: if the city is a GFRIPZ city (based on the State Council’s official list), and 0 otherwise. for years after the policy implementation, and 0 otherwise.
4.2.3. Control Variables
Considering that other urban characteristic factors may have an impact on urban green innovation, this article selects the following control variables : first, economic growth rate ; second, the industrial structure upgrading index ; third, the level of utilization of foreign investment ; and fourth, population size .
4.2.4. Mechanism Variables
According to the previous research, on the one hand, green finance can reduce the financing costs of enterprises, provide technological support for innovation, and thus generate green technology innovation. New technology energy changes the consumption of existing energy, so it is reasonable to adopt green technology innovation as a mechanism variable. So (green patent authorization) is used as a measure of green technology innovation to test its mechanism of action [54]. On the other hand, green finance can regulate and guide capital investment, optimize resource allocation, and change energy consumption patterns. Therefore, it is reasonable to adopt resource allocation effects as mechanism variables. The logarithm of the balance of various RMB loans of financial institutions is used to measure the efficiency of resource allocation effects at the micro level [10].
4.2.5. Moderating Variable
The digital economy, including core technologies such as artificial intelligence, can break through time constraints and regional limitations, improve factor productivity, and more reasonably and effectively reduce carbon consumption [19]. This article selects the number of artificial intelligence (AI) enterprises as the moderating variable [55]. The specific variable names and measurement methods mentioned above are shown in Table 1.

Table 1.
Variable names and measurement methods.
4.3. Data Sources
Given administrative boundary changes and data availability constraints, this study excludes cities such as Laiwu and Lanzhou, retaining a balanced panel of 259 prefecture-level cities in China from 2012 to 2022. Data are sourced from the China City Statistical Yearbook. Missing values are addressed using linear interpolation. To account for inflation, nominal GDP is deflated using price indices to derive real GDP. Descriptive statistics for key variables are presented in Table 2.
Table 2.
Descriptive statistics for key variables.
5. Results
5.1. Pre-Benchmark Regression Tests
5.1.1. Unit Root Test
This study utilizes data spanning the period from 2012 to 2022. To ensure data stability and mitigate risks of non-stationarity and spurious regression arising from unit roots, we employ the Harris–Tzavalis (HT) and Im–Pesaran–Shin (IPS) tests for unit root analysis. As presented in Table 3, all variables achieved stationarity at the 1% significance level after first-order differencing [57].
Table 3.
Unit root test.
5.1.2. Cross-Sectional Dependence
Cross-sectional dependence (CD) constitutes a critical concern in spatial panel data analysis, particularly when examining economic interactions across geographically proximate regions [58]. Ignoring CD may yield inefficient estimates and inflated Type I errors in conventional panel estimators.
In line with Wang et al. [59], we implement Pesaran (2004) and Pesaran’s (2015) CD test and its weak dependence variant. As Table 4 demonstrates, all variables exhibit statistically significant CD (p < 0.01). While multiple remedies exist—including spatial autoregressive models and Driscoll–Kraay standard errors—we prioritize cluster-robust standard errors for two theoretical reasons: First, provincial policy implementation creates within-province dependence while maintaining independence across provinces [52]. Second, the clustering standard error can effectively solve this problem [51]. So this article chooses the method of clustering standard error to deal with this problem.
Table 4.
Cross-sectional dependence.
5.2. Baseline Regression
By the Hausman test, a fixed effect model is chosen as the baseline regression model because it is more scientific and reasonable. Table 5 reports the regression results of the GFRIPZ policy’s impact on energy structure transition. Column (1) presents estimates without control variables or fixed effects, Column (2) includes controls but omits fixed effects, Column (3) incorporates fixed effects without controls, and Column (4) includes both controls and fixed effects. The coefficients of are consistently positive and statistically significant across all specifications, confirming that the pilot policy significantly promotes urban energy optimization. These results validate Hypothesis 1: green finance drives low-carbon energy structure transition.
Table 5.
Baseline regression.
5.3. Identification Tests
5.3.1. Dynamic Effect Test
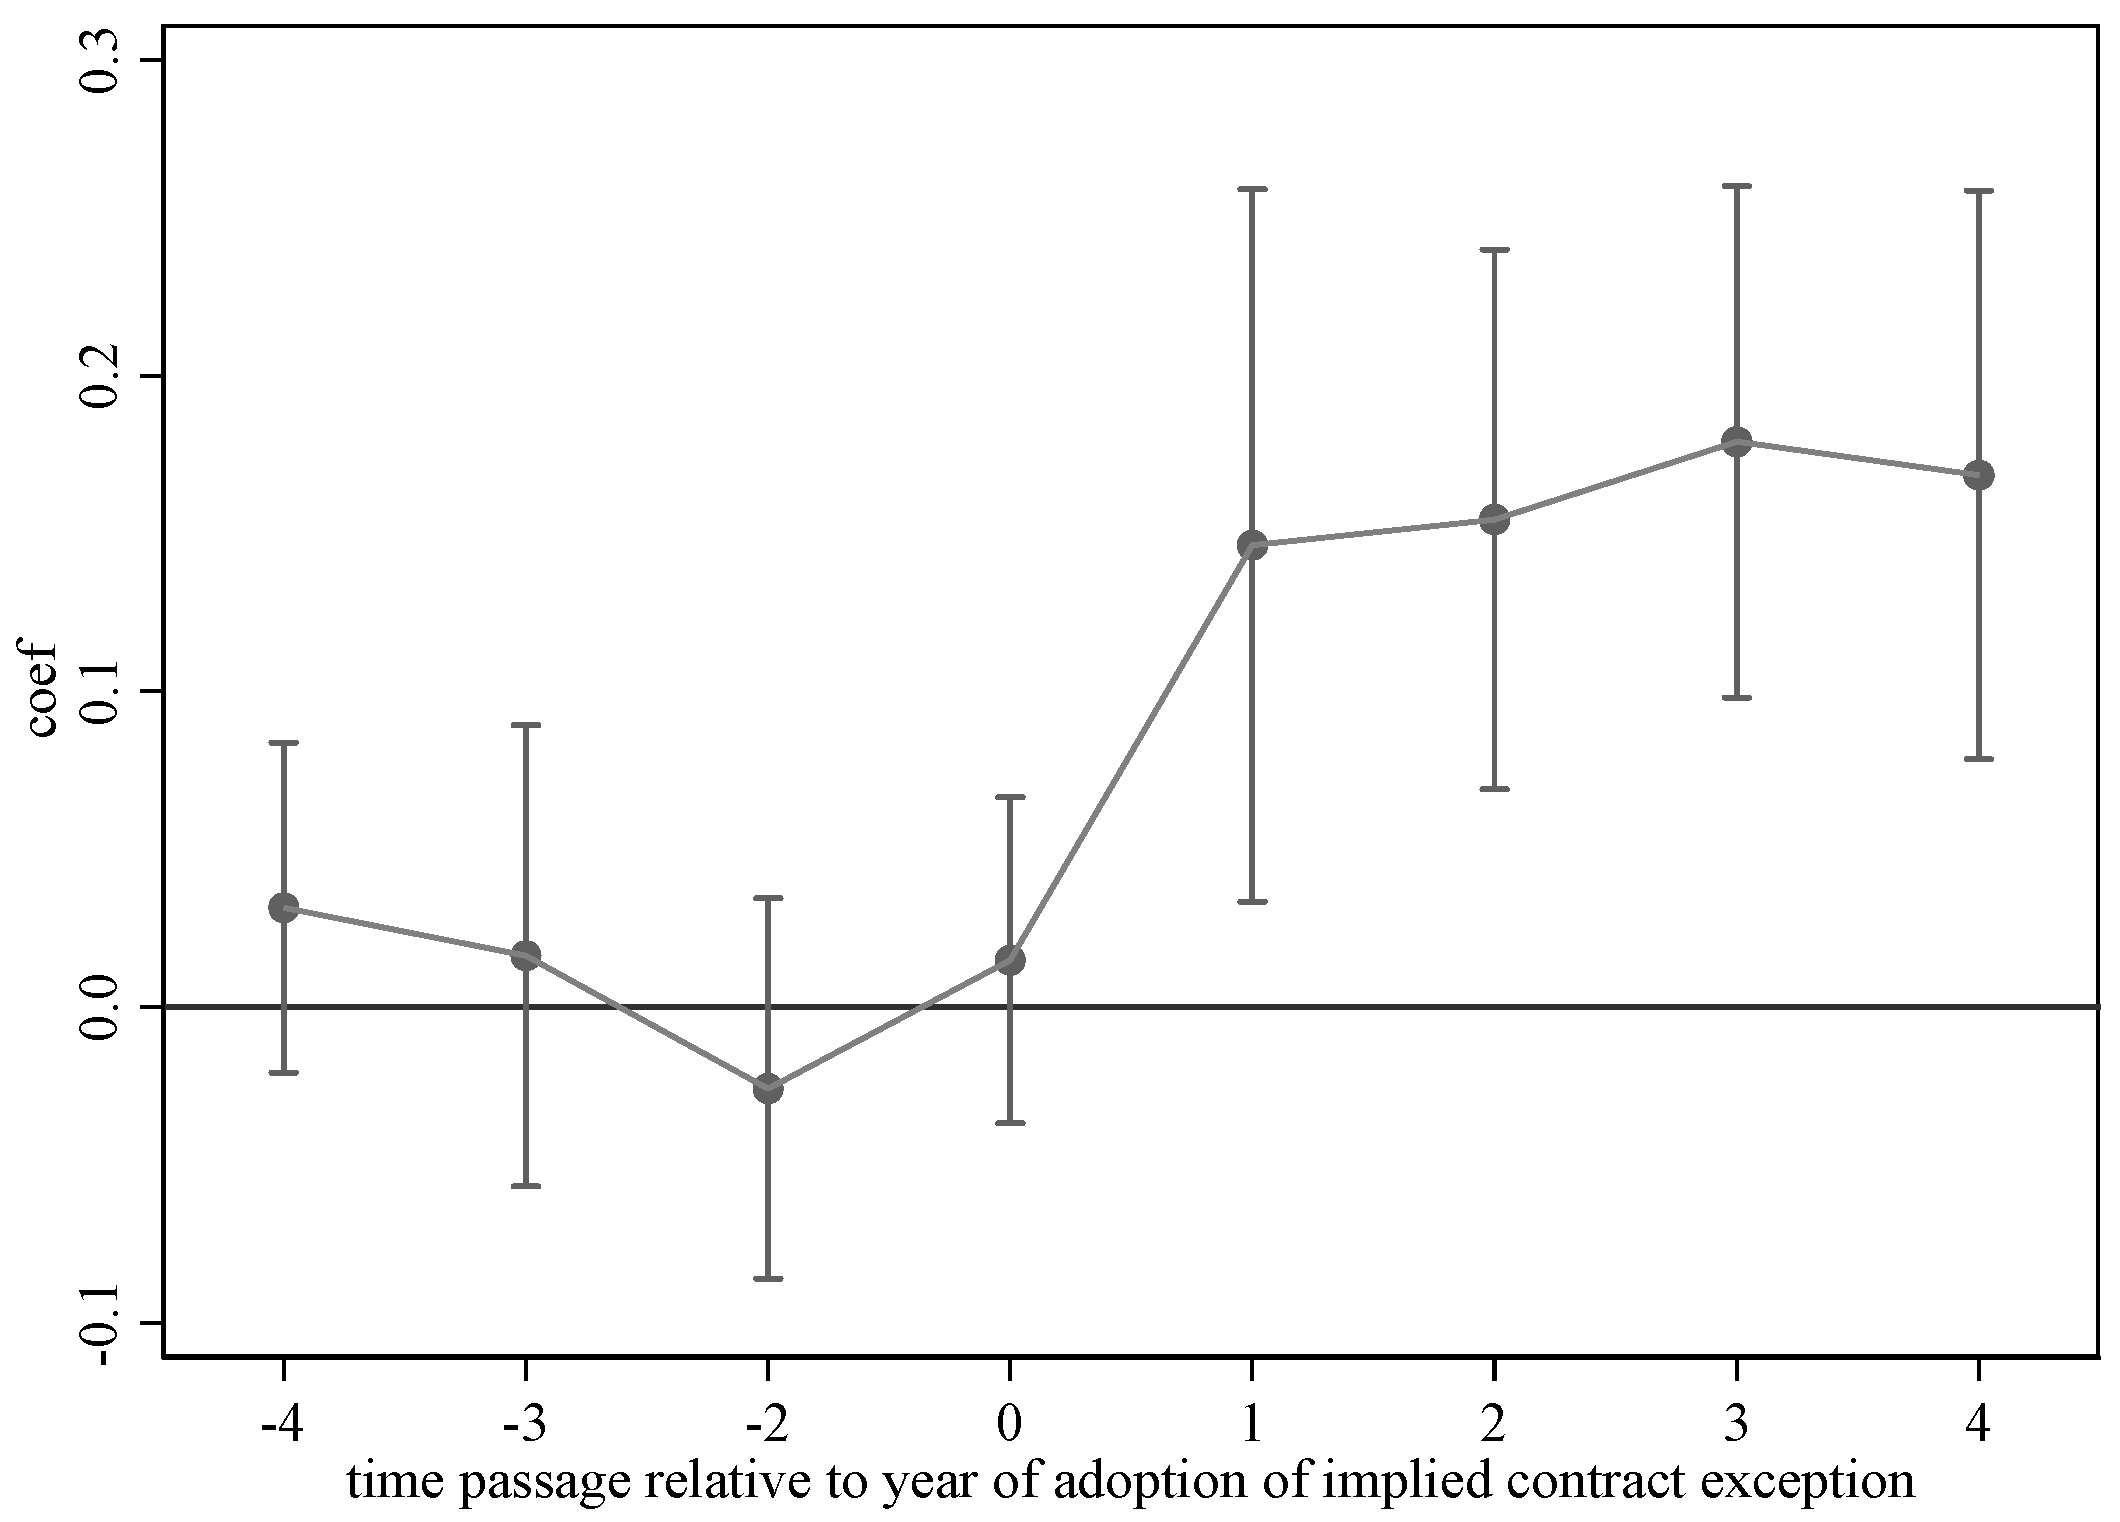
The implementation of the GFRIPZ policy represents an exogenous positive shock to urban energy transition [60]. A critical assumption of the DID approach is the parallel trend hypothesis, which requires that treatment and control groups exhibit similar pre-policy trends in energy structure changes. Violations of this assumption could bias estimates. To address this, we adopt a flexible dynamic regression specification:
In this context, denotes the policy dummy variable for year m + k, where m is the policy implementation year and k indicates the k-th year relative to m. captures dynamic effects in year k. The results from Equation (2) are visualized in Figure 4. The pre-policy coefficients are statistically insignificant, confirming parallel trends between treatment and control groups prior to the GFRIPZ implementation. Post-policy coefficients become significant and grow over time, indicating that the policy’s impact strengthened progressively. Specifically, the coefficient for 2018 (k = 1) is significant, likely due to immediate incentives such as subsidies, tax breaks, and green credit quotas that took effect in the initial phase. It amplified the policy’s influence on energy structure optimization in subsequent years.

Figure 4.
Parallel trend test.
5.3.2. Placebo Test
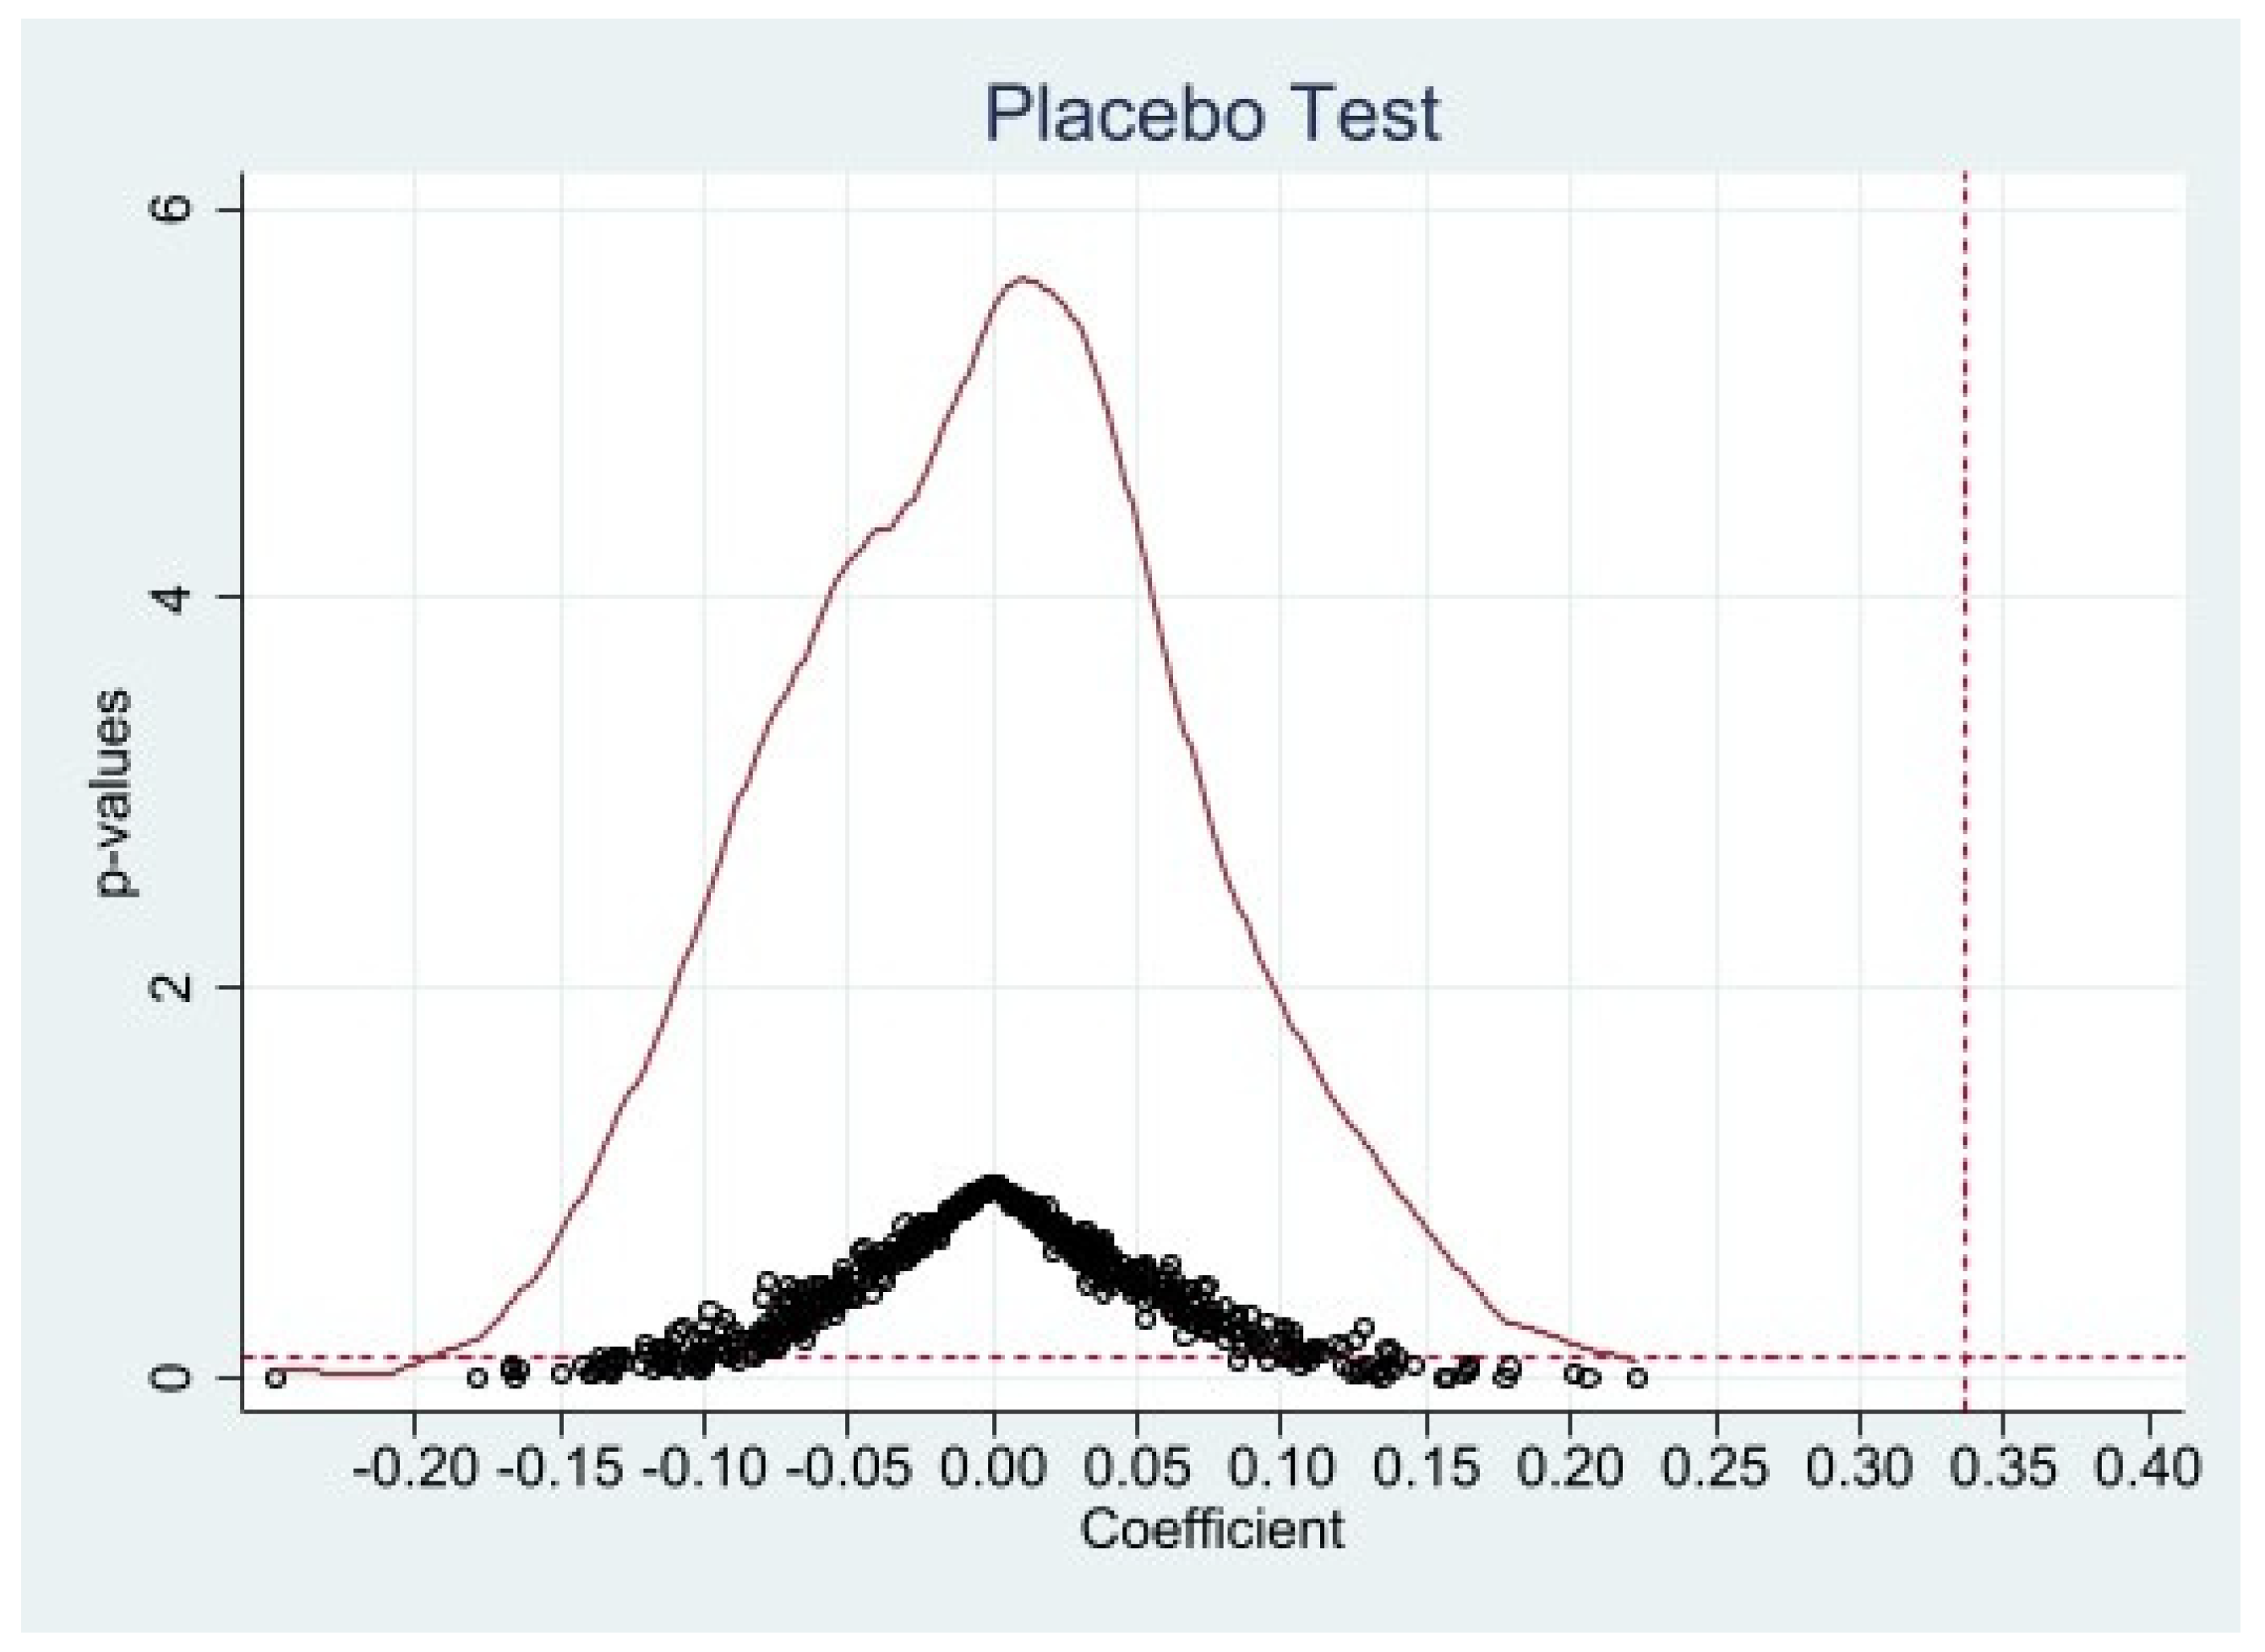
This paper conducts a placebo test by randomly generating dummy variables for pseudo-treatment groups and pseudo-policy shocks to examine whether unobserved city-specific factors might influence the adjustment of urban energy structures by the pilot policy [61]. Specifically, we use Stata 18 to randomly select 29 cities from the 259 sample cities as the treatment group and randomly assign policy shock timings, obtaining placebo coefficient estimates and p-values for the impact of the pilot policy on urban green innovation levels. This process is repeated 500 times. The kernel density of the 500 coefficient estimates and their p-value distributions are presented in Figure 5. The results show that the coefficient estimates generated through random treatment processes are mainly concentrated around zero, with most p-values exceeding 0.1. This provides evidence that the impact of the GFRIPZ policy on energy transition is not confounded by other random factors, thereby validating the robustness of our regression results.
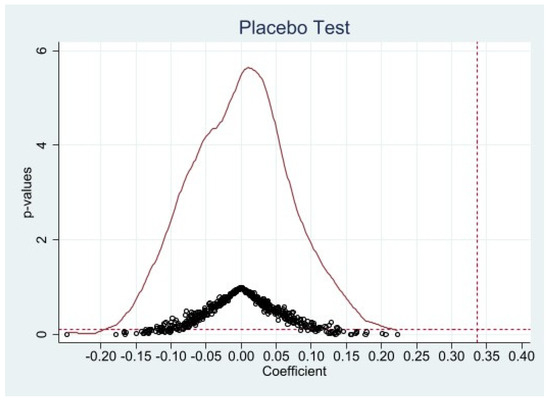
Figure 5.
Placebo test.
5.4. Robustness Tests
5.4.1. Excluding Influences of Other Policies
Urban low-carbon energy structural transitions within the sample period may also be influenced by other policies. In 2010, China issued the Notice on Launching Pilot Programs for Low-Carbon Provinces and Cities, marking the commencement of low-carbon pilot initiatives [10]. Subsequently, the “Broadband China” demonstration cities (city clusters) were announced in 2014, with pilot programs initiated in Beijing and other locations [62]. Furthermore, the “Made in China 2025” pilot demonstration cities were implemented in 2016, with pilot programs conducted in Ningbo and other regions [29]. To address potential confounding effects from these three policies, this study compiles policy dummy variables for overlapping “Low-Carbon China”, “Broadband China”, and “Made in China 2025” initiatives during the sample period and incorporates them into baseline regressions. The results in Columns (1), (2), and (3) of Table 6 show that after controlling for these policies, the estimated coefficient of lnrpats remains significantly positive, confirming that green finance effectively promotes urban energy transitions.
Table 6.
Robustness tests (I).
5.4.2. PSM-DID Estimation
To mitigate sample selection bias in the DID approach and overcome systematic differences in variable trends between treatment and control cities, this paper employs PSM for robustness verification [31]. The annual regression processing of control groups using radius matching ensures common support assumptions between treatment and control groups post matching. The PSM-DID results in Column (1) of Table 7 reveal that the ’s coefficient remains significantly positive, reaffirming the robustness of our regression results.
Table 7.
Robustness tests (II).
5.4.3. Incorporating Baseline Variables to Mitigate Selection Effects
The ideal scenario for DID assumes the random selection of treatment and control cities. Considering potential correlations between the GFRIPZ cities and economic development/environmental pollution factors that may cause estimation biases, we incorporate interaction terms between city baseline characteristics and time trends into Equation (1) to address non-random selection [63]:
where Q indicates whether a city is a “Two-Control Zone” (an acid rain control zone or sulfur dioxide pollution control zone), and trend represents the time trend variable. The results in Column (2) of Table 7 show that the ’s coefficient remains significantly positive, partially controlling for potential estimation biases from non-random selection between pilot and non-pilot cities. This validates the randomness in pilot city selection, considering varying geographic locations and economic development levels across cities.
5.4.4. Alternative Control Variables
Urban industrial structural differences objectively reflect disparities in resource endowments. Such differences may affect energy structural adjustments. This paper employs the tertiary-to-secondary industry ratio as a proxy for industrial upgrading indices to measure development levels. The regression results in Column (3) of Table 7 show a significantly positive ’s coefficient, indicating that green finance significantly stimulates energy structural transitions, with robust findings.
5.5. Endogeneity Analysis
Considering that the non-random selection of the GFRIPZ cities may introduce potential endogeneity issues, this study employs the number of post offices per million people by the end of 1984 as an instrumental variable (IV) and re-estimates using the Two-Stage Least Squares (2SLS) method. This selection is justified by two rationales: First, the post office density serves as a proxy for regional infrastructure development levels, which correlates with policy implementation. Second, the previous year’s tertiary industry contribution rate reflects industrial structural characteristics closely linked to energy development. By combining these two indicators, we construct an IV that correlates with the GFRIPZ policy but is unlikely related to the error term.
In an empirical analysis, we apply the 2SLS framework to estimate policy impacts on energy structural transformation while controlling for year and city fixed effects. The regression results in Columns (1) and (2) of Table 8 show that after addressing endogeneity concerns, the policy maintains a significantly positive effect on urban energy restructuring. This finding confirms that policy implementation genuinely promotes energy transition, validating the causal inference.
Table 8.
Endogeneity analysis.
6. Further Discussion
6.1. Heterogeneity Tests
6.1.1. Resource Endowment Heterogeneity
Based on the National Sustainable Development Plan for Resource-Based Cities (2013–2020), we categorize 156 cities into resource-based and non-resource-based cities [64]. The regression results in Table 9 show that Column (1) represents resource-based cities, while Column (2) represents non-resource-based cities. The coefficient of is significant in Column (1) but not in Column (2), indicating that resource-based cities are more responsive to the policy. This can be attributed to their industrial structures, which often rely on high-polluting industries such as mining and smelting [65]. Guided by the GFPZ policy, high-polluting industries face increased pressure to transition towards greener practices and upgrade their production processes, thereby contributing to more significant urban green growth.
Table 9.
Heterogeneity tests.
6.1.2. City Administrative Hierarchy Heterogeneity
Whether cities with different administrative statuses, such as provincial capitals (Beijing, Shenzhen), municipalities with independent planning status, and special economic zones versus non-designated cities (e.g., Suzhou), exhibit differential responses to the pilot policy remains an important question [15]. This paper examines heterogeneity across city administrative hierarchies. Column (3) in Table 9 includes core cities (provincial capitals, municipalities with independent planning status, and special economic zones), while Column (4) includes non-core cities. The results show that higher-tier cities experience more significant impacts, likely due to their advanced economies, denser populations, better infrastructure, and greater policy amplification effects.
6.1.3. City Geographical Location Heterogeneity
Considering potential regional variations in policy effectiveness, we further analyze differences between eastern and central–western regions. Table 9 reveals that the coefficient of is insignificant in eastern cities but significant in central and western cities. This suggests limited policy effects on energy transitions in eastern regions, which may stem from their already-developed financial systems and resource allocation mechanisms that inherently promote environmental protection. Conversely, in financially constrained western regions, green finance provides critical financial support and services for environmental protection and sustainable projects [66].
6.2. Mechanism Tests
6.2.1. Green Technology Innovation
If green finance generates green technology innovation, this indirectly indicates that green technology innovation serves as a critical mechanism through which green finance promotes energy structural transformation and upgrading. As shown in Table 10, Column (1) reveals a significant coefficient, demonstrating a mediation effect. The policy promotes energy structural transformation by stimulating green technology innovation. This occurs because green technology innovation effectively alleviates corporate financing constraints and promotes green R&D activities while optimizing green resource utilization [37]. This validates Hypothesis 2: green finance facilitates energy structural transformation through green technology innovation.
Table 10.
Mechanism tests and moderating effect.
6.2.2. Resource Allocation Efficiency
Following Jiang (2022)’s mechanism testing approach [67], if green finance enhances resource allocation efficiency, this suggests that improved allocation efficiency constitutes another critical mechanism. Table 10, Column (2) shows a significant coefficient, indicating a mediation effect where the policy optimizes energy structural transformation by improving resource allocation efficiency. Financial intermediaries and markets allocate scarce resources and capital to resource-efficient and environmentally friendly industries/projects across regions and time periods through their resource allocation functions, thereby enhancing natural resource utilization [44]. This confirms Hypothesis 3: green finance promotes energy structural transformation by improving resource allocation efficiency.
6.3. Moderating Effect of Digital Economy
Based on prior moderating mechanism analysis, the effectiveness of the GFRIPZ policies on energy structural transitions may be moderated by digital economy development levels. We verify this mechanism’s validity by constructing an interaction term between the number of AI enterprises (a proxy for digital economy development [19]) and core explanatory variables. As shown in Table 10, the interaction term is significant, confirming that the digital economy indeed moderates the green finance–energy structure nexus. This validates Hypothesis 4: the digital economy exerts a positive moderating effect on the green finance–energy structure relationship.
7. Conclusions and Policy Suggestions
7.1. Conclusions
Against the backdrop of China’s progressive implementation of the “dual carbon” goals, this paper evaluates the impact of green finance on urban low-carbon energy structural transitions using panel data from 259 prefecture-level and above cities in China (2012–2022) through a DID model. The key findings include the following: Green finance policies significantly promote urban energy structural transformations, with more pronounced effects in resource-based cities, central–western cities, and higher-tier cities. Furthermore, green finance effectively stimulates energy structural optimization through mediation effects of green technology innovation and resource allocation efficiency, moderated by the digital economy. Here are more specific conclusions.
The research results of this article are consistent with the existing literature in most aspects. Specifically, based on previous research on green finance and energy efficiency and conservation [31,64], this article explores the relationship between green finance and energy structure transformation. Similarly to Jiang (2022) and Huang (2019), green finance brings financial and technological support to cities, enabling them to spend more resources on green innovation, produce more environmentally friendly products using clean energy, and promote energy structure transformation [37,44]. Under the guidance of green finance policies, environmentally friendly regions have emerged, green resources have been optimized, and renewable energy has been more fully utilized. Furthermore, core cities and resource-based cities exhibit significant effects due to their resource endowments, which builds upon and significantly extends the foundational work established in prior research [15,65]. This consistency promotes people’s understanding of the field.
However, this paper extends the existing literature in key ways. Although Nepal (2024) suggests that green finance promotes energy changes in the eastern region [10], the heterogeneity analysis in this article shows the opposite results. Green finance is significant in the central–western cities instead of the eastern region. In the central–western cities, financial instruments are quite scarce, and green finance plays an important role in environmental protection and sustainable projects. In addition, this research introduces the digital economy, particularly artificial intelligence, as a moderating factor, a dimension underexplored in prior studies [36,55]. The digital economy, with its technological advantages, can accurately calculate carbon emissions, define the ownership of green financial products, regulate the use of various resources, scientifically calculate the environmental and social benefits of projects, and guide the investment of green finance in energy utilization. These contributions reinforce the theoretical framework of green finance while addressing calls for context-specific analyses in energy transition research.
7.2. Policy Suggestions
Based on these conclusions, the following policy implications are proposed:
First, expand policy coverage and optimize implementation channels. This study demonstrates that green finance policies exert remarkable driving effects on Chinese cities’ energy conservation and emission reduction efforts. It is recommended to expand policy implementation beyond current scopes to accelerate China’s green transition and high-quality development. Simultaneously, governments should enhance business environments, streamline policy implementation channels, and provide robust support for green finance development to mitigate issues such as high financing costs and superficial policy execution.
Second, innovate green financial products and services. The findings indicate that green technology innovation and resource allocation improvements driven by green finance facilitate energy structural optimization, contributing to the Beautiful China initiative. Additionally, the digital economy plays an indispensable role. Therefore, we propose developing innovative green products, increasing investments in emerging sectors like artificial intelligence, leveraging big data and cloud computing to strengthen heavy-polluting enterprise monitoring, guiding orderly participation in carbon emission trading, and optimizing human/material/financial resource allocation across sectors to achieve energy transition goals.
Third, implement differentiated regional development strategies. Heterogeneity analysis reveals that resource-based cities, central–western cities, and higher-tier cities are more responsive to policies. Governments should adopt regionally differentiated approaches tailored to local conditions, optimizing resource allocation based on regional realities. Policies should be formulated according to local contexts, leveraging unique advantages to guide enterprises’ transition from traditional to clean energy sources, avoiding the indiscriminate replication of strategies.
8. Discussion
8.1. Future Study Recommendations
Future research could explore the following areas: (1) The aspects that contradict previous research need further exploration; for example, is the impact of green finance on energy better in the east or in the central–western? (2) We only use one country as a sample. It can be expanded to various countries, from an international perspective, to jointly build a clean, beautiful, and sustainable world.
8.2. Study Limitations
The limitations of this study are as follows: (1) It is difficult to choose best indicators to measure energy structure transition. The indicator in this paper is representative of the topic but is unable to fully consider all aspects of policies and markets that may affect the empirical results. So do green technology innovation, resource allocation efficiency and digital economy. (2) Due to space limitations, this article does not provide two other methods (spatial econometric models and Driscoll–Kraay standard errors) for handling cross-sectional dependency.
Author Contributions
Conceptualization, W.X.; methodology, J.Y.; software, Q.Y.; validation, W.X., N.C. and Q.Y.; formal analysis, Q.Y.; data curation, Q.Y.; writing—original draft preparation, Q.Y.; writing—review and editing, W.X.; visualization, N.C.; supervision, J.Y.; project administration, W.X. All authors have read and agreed to the published version of the manuscript.
Funding
The Jiangxi Provincial Social Science Foundation “The Mechanism, Effect Evaluation, and Path Research of Digital Transformation Driving the Development of New Productive Forces in Manufacturing Industry”.
Institutional Review Board Statement
Not applicable.
Informed Consent Statement
Not applicable.
Data Availability Statement
Data are available on request.
Conflicts of Interest
The author declares no conflicts of interest.
References
- Yang, Y.; Javanroodi, K.; Nik, V.M. Climate Change and Renewable Energy Generation in Europe-Long-Term Impact Assessment on Solar and Wind Energy Using High-Resolution Future Climate Data and Considering Climate Uncertainties. Energies 2022, 15, 302. [Google Scholar] [CrossRef]
- Thollander, P.; Palm, J.; Hedbrant, J. Energy Efficiency as a Wicked Problem. Sustainability 2019, 11, 1569. [Google Scholar] [CrossRef]
- Anser, M.K.; Yusop, Z.; Abbas, S.; Ali, S.; Ahmad, M. Nexus Between Economic Development and Energy Poverty to Gain Energy Efficiency: Empirical Evidence From China. Front. Energy Res. 2022, 10, 843765. [Google Scholar] [CrossRef]
- Ming, Z.; Shaojie, O.; Hui, S.; Yujian, G.; Qiqi, Q. Overall review of distributed energy development in China: Status quo, barriers and solutions. Renew. Sustain. Energy Rev. 2015, 50, 1226–1238. [Google Scholar] [CrossRef]
- Saini, S.; Chand, P.; Joshi, A. Biomass derived carbon for supercapacitor applications: Review. J. Energy Storage 2021, 39, 102646. [Google Scholar] [CrossRef]
- Peidong, Z.; Yanli, Y.; Jin, S.; Yonghong, Z.; Lisheng, W.; Xinrong, L. Opportunities and challenges for renewable energy policy in China. Renew. Energy 2018, 4, 486–503. [Google Scholar] [CrossRef]
- Muganyi, T.; Yan, L.; Sun, H. Green finance, fintech and environmental protection: Evidence from China. Environ. Sci. Ecotechnol. 2021, 7, 100107. [Google Scholar] [CrossRef]
- Feng, W.; Bilivogui, P.; Wu, J.; Mu, X. Green finance: Current status, development, and future course of actions in China. Environ. Res. Commun. 2023, 5, 035005. [Google Scholar] [CrossRef]
- Umar, M.; Safi, A. Do green finance and innovation matter for environmental protection? A case of OECD economies. Energy Econ. 2023, 119, 106560. [Google Scholar] [CrossRef]
- Nepal, R.; Liu, Y.; Wang, J.; Dong, K. How does green finance promote renewable energy technology innovation? A quasi-natural experiment perspective. Energy Econ. 2024, 134, 107576. [Google Scholar] [CrossRef]
- Bilal, M.J.; Shaheen, W.A. Towards sustainable development: Investigating the effect of green financial indicators on renewable energy via the mediating variable. Renew. Energy 2024, 221, 119819. [Google Scholar] [CrossRef]
- Zhang, H.; Jin, J. Assessing the effect of green finance, energy consumption structure and environmental sustainable development: A moderated mediation model. Econ. Change Restruct. 2024, 57, 87. [Google Scholar] [CrossRef]
- Wang, S.; Shu, W.; Cui, L. Green finance policy and green economic transformation. Int. Rev. Financ. Anal. 2024, 96, 103785. [Google Scholar] [CrossRef]
- Wang, M.; Li, X.; Wang, S. Discovering research trends and opportunities of green finance and energy policy: A data-driven scientometric analysis. Energy Policy 2021, 154, 112295. [Google Scholar] [CrossRef]
- Wang, H.; Hao, Y.; Fu, Q. Data factor agglomeration and urban green finance: A quasi-natural experiment based on the National Big Data Comprehensive Pilot Zone. Int. Rev. Financ. Anal. 2024, 96, 103732. [Google Scholar] [CrossRef]
- Yu, M.; An, P. How much financing China needs to achieve carbon peak and carbon neutrality goals? Energy Econ. 2024, 137, 107779. [Google Scholar] [CrossRef]
- Chen, L.; Liu, Y.; Gao, Y.; Wang, J. Carbon Emission Trading Policy and Carbon Emission Efficiency: An Empirical Analysis of China’s Prefecture-Level Cities. Front. Energy Res. 2021, 9, 793601. [Google Scholar] [CrossRef]
- Eichner, T.; Pethig, R. International carbon emissions trading and strategic incentives to subsidize green energy. Resour. Energy Econ. 2014, 36, 469–486. [Google Scholar] [CrossRef]
- Mondal, S.; Das, S.; Vrana, V. Exploring the Role of Artificial Intelligence in Achieving a Net Zero Carbon Economy in Emerging Economies: A Combination of PLS-SEM and fsQCA Approaches to Digital Inclusion and Climate Resilience. Sustainability 2024, 16, 10299. [Google Scholar] [CrossRef]
- Wang, X.; Zhao, H.; Bi, K. The measurement of green finance index and the development forecast of green finance in China. Environ. Ecol. Stat. 2021, 28, 263–285. [Google Scholar] [CrossRef]
- Lin, B.; Su, T. Green bond vs conventional bond: Outline the rationale behind issuance choices in China. Int. Rev. Financ. Anal. 2022, 81, 102063. [Google Scholar] [CrossRef]
- Zhou, X.; Caldecott, B.; Hoepner, A.; Wang, Y. Bank green lending and credit risk: An empirical analysis of China’s Green Credit Policy. Bus. Strategy Environ. 2022, 31, 1623–1640. [Google Scholar] [CrossRef]
- Yu, H.; Zhang, J. Do green investors empower companies to develop sustainably? A study based on the perspective of innovation investment and corporate governance levels. Financ. Res. Lett. 2025, 79, 107263. [Google Scholar] [CrossRef]
- Hu, Y.; Du, S.; Wang, Y.; Yang, X. How Does Green Insurance Affect Green Innovation? Evidence from China. Sustainability 2023, 15, 12194. [Google Scholar] [CrossRef]
- Song, M.; Du, J. Mechanisms for realizing the ecological products value: Green finance intervention and support. Int. J. Prod. Econ. 2024, 271, 109210. [Google Scholar] [CrossRef]
- Liang, Z.; Yang, X. The impact of green finance on the peer effect of corporate ESG information disclosure. Financ. Res. Lett. 2024, 62, 105080. [Google Scholar] [CrossRef]
- Yu, C.-H.; Wu, X.; Zhang, D.; Chen, S.; Zhao, J. Demand for green finance: Resolving financing constraints on green innovation in China. Energy Policy 2021, 153, 112255. [Google Scholar] [CrossRef]
- Yang, Y.; Su, X.; Yao, S. Can green finance promote green innovation? The moderating effect of environmental regulation. Environ. Sci. Pollut. Res. 2022, 29, 74540–74553. [Google Scholar] [CrossRef] [PubMed]
- Xu, L. Towards Green Innovation by China’s Industrial Policy: Evidence From Made in China 2025. Front. Environ. Sci. 2022, 10, 924250. [Google Scholar] [CrossRef]
- Yang, Q.; Zheng, M.; Chang, C. Energy policy and green innovation: A quantile investigation into renewable energy. Renew. Energy 2022, 189, 1166–1175. [Google Scholar] [CrossRef]
- Zhang, Z.; Wang, J.; Feng, C.; Chen, X. Do pilot zones for green finance reform and innovation promote energy savings? Evidence from China. Energy Econ. 2023, 124, 106763. [Google Scholar] [CrossRef]
- Zhang, P.; Yu, Y. How does regional technological innovation affect energy poverty? The role of industrial structure distortion. Energy 2024, 291, 130387. [Google Scholar] [CrossRef]
- Tao, W.; Weng, S.; Chen, X.; ALHussan, F.B.; Song, M. Artificial intelligence-driven transformations in low-carbon energy structure: Evidence from China. Energy Econ. 2024, 136, 107719. [Google Scholar] [CrossRef]
- Zhang, Y.; Li, Y.; Wu, H.; Peng, Y. Evaluating the role of green innovation and global supply chain digitization in natural resource utilization for energy resilience: An empirical evidence from panel quantile regression. Energy Econ. 2025, 144, 108401. [Google Scholar] [CrossRef]
- Liao, C.; Ou, H.; Lo, S.; Chiueh, P.; Yu, Y. A challenging approach for renewable energy market development. Renew. Sustain. Energy Rev. 2011, 15, 787–793. [Google Scholar] [CrossRef]
- Shi, Y.; Yang, B. How digital finance and green finance can synergize to improve urban energy use efficiency? New evidence from China. Energy Strategy Rev. 2024, 55, 101553. [Google Scholar] [CrossRef]
- Jiang, S.; Liu, X.; Liu, Z.; Shi, H.; Xu, H. Does green finance promote enterprises’ green technology innovation in China? Front. Environ. Sci. 2022, 10, 981013. [Google Scholar] [CrossRef]
- Zhang, T.; Xu, Z. The informational feedback effect of stock prices on corporate investments: A comparison of new energy firms and traditional energy firms in China. Energy Econ. 2023, 127, 107086. [Google Scholar] [CrossRef]
- Liu, Y.; Li, X. Green finance policies, resource allocation, and corporate social responsibility. Financ. Res. Lett. 2025, 71, 106392. [Google Scholar] [CrossRef]
- Chen, W.; Chen, J.; Ma, Y. Competition vs cooperation: Renewable energy investment under cap-and-trade mechanisms. Financ. Innov. 2022, 8, 76. [Google Scholar] [CrossRef]
- Alegre, J.; Chiva, R. Assessing the impact of organizational learning capability on product innovation performance: An empirical test. Technovation 2008, 28, 315–326. [Google Scholar] [CrossRef]
- Fritsch, M.; Slavtchev, V. How does industry specialization affect the efficiency of regional innovation systems? Ann. Reg. Sci. 2010, 45, 87–108. [Google Scholar] [CrossRef]
- Thomas, V.J.; Sharma, S.; Jain, S.K. Thomas Using patents and publications to assess R&D efficiency in the states of the USA. World Pat. Inf. 2015, 33, 4–10. [Google Scholar] [CrossRef]
- Huang, Z.; Liao, G.; Li, Z. Loaning scale and government subsidy for promoting green innovation. Technol. Forecast. Soc. Change 2019, 144, 148–156. [Google Scholar] [CrossRef]
- Liu, Y.; Zhang, Y.; Xie, X.; Mei, S. Affording digital transformation: The role of industrial Internet platform in traditional manufacturing enterprises digital transformation. Heliyon 2024, 10, e28772. [Google Scholar] [CrossRef]
- Liu, X. Impacts of Environmental Pollution and Digital Economy on the New Energy Industry. Sustainability 2023, 15, 9296. [Google Scholar] [CrossRef]
- Ma, K. Digital inclusive finance and corporate green technology innovation. Financ. Res. Lett. 2023, 55, 104015. [Google Scholar] [CrossRef]
- Bortz, M.; Dadhe, K.; Engell, S.; Gepert, V.; Kockmann, N.; Müller-Pfefferkorn, R.; Schindler, T.; Urbas, L. AI in Process Industries—Current Status and Future Prospects. Chem. Ing. Tech. 2023, 95, 975–988. [Google Scholar] [CrossRef]
- Card, D.; Krueger, A.B. Minimum wages and Employment: A Case Study of the Fast Food Industry in New Jersey and Pennsylvania; National Bureau of Economic Research: Cambridge, MA, USA, 1993. [Google Scholar]
- Angrist, J.D.; Pischke, J.-S. Mostly Harmless Econometrics: An Empiricist’s Companion; Princeton University Press: Princeton, NJ, USA, 2009. [Google Scholar]
- Abadie, A.; Athey, S.; Imbens, G.W.; Wooldridge, J.M. When should you adjust standard errors for clustering? Q. J. Econ. 2023, 138, 1–35. [Google Scholar] [CrossRef]
- Autor, D.H.; Dorn, D.; Hanson, G.H. The China syndrome: Local labor market effects of import competition in the United States. Am. Econ. Rev. 2013, 103, 2121–2168. [Google Scholar] [CrossRef]
- Cheng, Y.; Yao, X. Carbon intensity reduction assessment of renewable energy technology innovation in China: A panel data model with cross-section dependence and slope heterogeneity. Renew. Sustain. Energy Rev. 2021, 135, 110157. [Google Scholar] [CrossRef]
- Liu, X.; Huang, N.; Su, W.; Zhou, H. Green innovation and corporate ESG performance: Evidence from Chinese listed companies. Int. Rev. Econ. Financ. 2024, 95, 103461. [Google Scholar] [CrossRef]
- Ling, J.; Chen, Z. Growth Goals and Industrial Transformation: A Micro Perspective on Government Land Transfer. Urban. Stud. 2024, 31, 100–108. [Google Scholar]
- Wang, W.; Liu, Y.; Peng, D. Research on the Industrial Structure Upgrading Effect of Population Aging. China’s Ind. Econ. 2015, 11, 47–61. [Google Scholar] [CrossRef]
- Zhang, H.; He, Y. The shrinking effect and mechanism of water resources ecological footprint of green technology progress. Resour. Sci. 2025, 47, 526–542. [Google Scholar]
- Pesaran, M.H. General diagnostic tests for cross-sectional dependence in panels. Empir. Econ. 2021, 60, 13–50. [Google Scholar] [CrossRef]
- Wang, Q.-J.; Wang, H.-J.; Chang, C.-P. Environmental performance, green finance and green innovation: What’s the long-run relationships among variables? Energy Econ. 2022, 110, 106004. [Google Scholar] [CrossRef]
- Shi, J.; Yu, C.; Li, Y.; Wang, T. Does green financial policy affect debt-financing cost of heavy-polluting enterprises? An empirical evidence based on Chinese pilot zones for green finance reform and innovations. Technol. Forecast. Soc. Change 2022, 179, 121678. [Google Scholar] [CrossRef]
- Bai, J.; Zhang, Y.; Bian, Y. Does innovation-driven policy enhance urban entrepreneurial activity? Empirical evidence from national innovative city pilot policies. China’s Ind. Econ. 2022, 6, 61–78. [Google Scholar] [CrossRef]
- Cao, Q.; Ni, P.; Guo, J. Broadband internet and income inequality among the floating population: Evidence from the “broadband China” strategy in China. China Econ. Rev. 2025, 90, 102369. [Google Scholar] [CrossRef]
- Wang, F.; Ge, G. Does low-carbon transformation impact employment? Evidence from low-carbon city pilot projects. China’s Ind. Econ. 2022, 81–99. [Google Scholar] [CrossRef]
- Zhao, X.; Zeng, B.; Zhao, X.; Zeng, S.; Jiang, S. Impact of green finance on green energy efficiency: A pathway to sustainable development in China. J. Clean. Prod. 2024, 450, 141943. [Google Scholar] [CrossRef]
- Farjana, S.H.; Huda, N.; Parvez Mahmud, M.A.; Saidur, R. A review on the impact of mining and mineral processing industries through life cycle assessment. J. Clean. Prod. 2019, 231, 1200–1217. [Google Scholar] [CrossRef]
- Liu, Y.; Dong, K.; Wang, K.; Taghizadeh-Hesary, F. Moving towards sustainable city: Can China’s green finance policy lead to sustainable development of cities? Sustain. Cities Soc. 2024, 102, 105242. [Google Scholar] [CrossRef]
- Jiang, T. Mediation and moderation effects in causal inference empirical research. China’s Ind. Econ. 2022, 5, 100–120. [Google Scholar] [CrossRef]
Disclaimer/Publisher’s Note: The statements, opinions and data contained in all publications are solely those of the individual author(s) and contributor(s) and not of MDPI and/or the editor(s). MDPI and/or the editor(s) disclaim responsibility for any injury to people or property resulting from any ideas, methods, instructions or products referred to in the content. |
© 2025 by the authors. Licensee MDPI, Basel, Switzerland. This article is an open access article distributed under the terms and conditions of the Creative Commons Attribution (CC BY) license (https://creativecommons.org/licenses/by/4.0/).