
Evolution Characteristics and Influencing Factors of Agricultural Drought Resilience: A New Method Based on Convolutional Neural Networks Combined with Ridge Regression

 , and
, and 
Abstract
1. Introduction
- (1)
- Construct a regional agricultural drought resilience evaluation index system based on the DPSIR conceptual model.
- (2)
- Accurately evaluate the regional agricultural drought resilience characteristics using the AdamW–CNN model.
- (3)
- Identify the key driving factors of regional agricultural drought resilience, establish the KOA–Ridge regression equation, and analyze the future evolution trend of resilience.
- (4)
- Verify the performance of AdamW–CNN and KOA–Ridge models.
2. Study Area and Data Source
2.1. Study Area
2.2. Data Sources
3. Methodology
3.1. Analysis of Connotation of Drought Resilience
3.2. Index System Construction Method
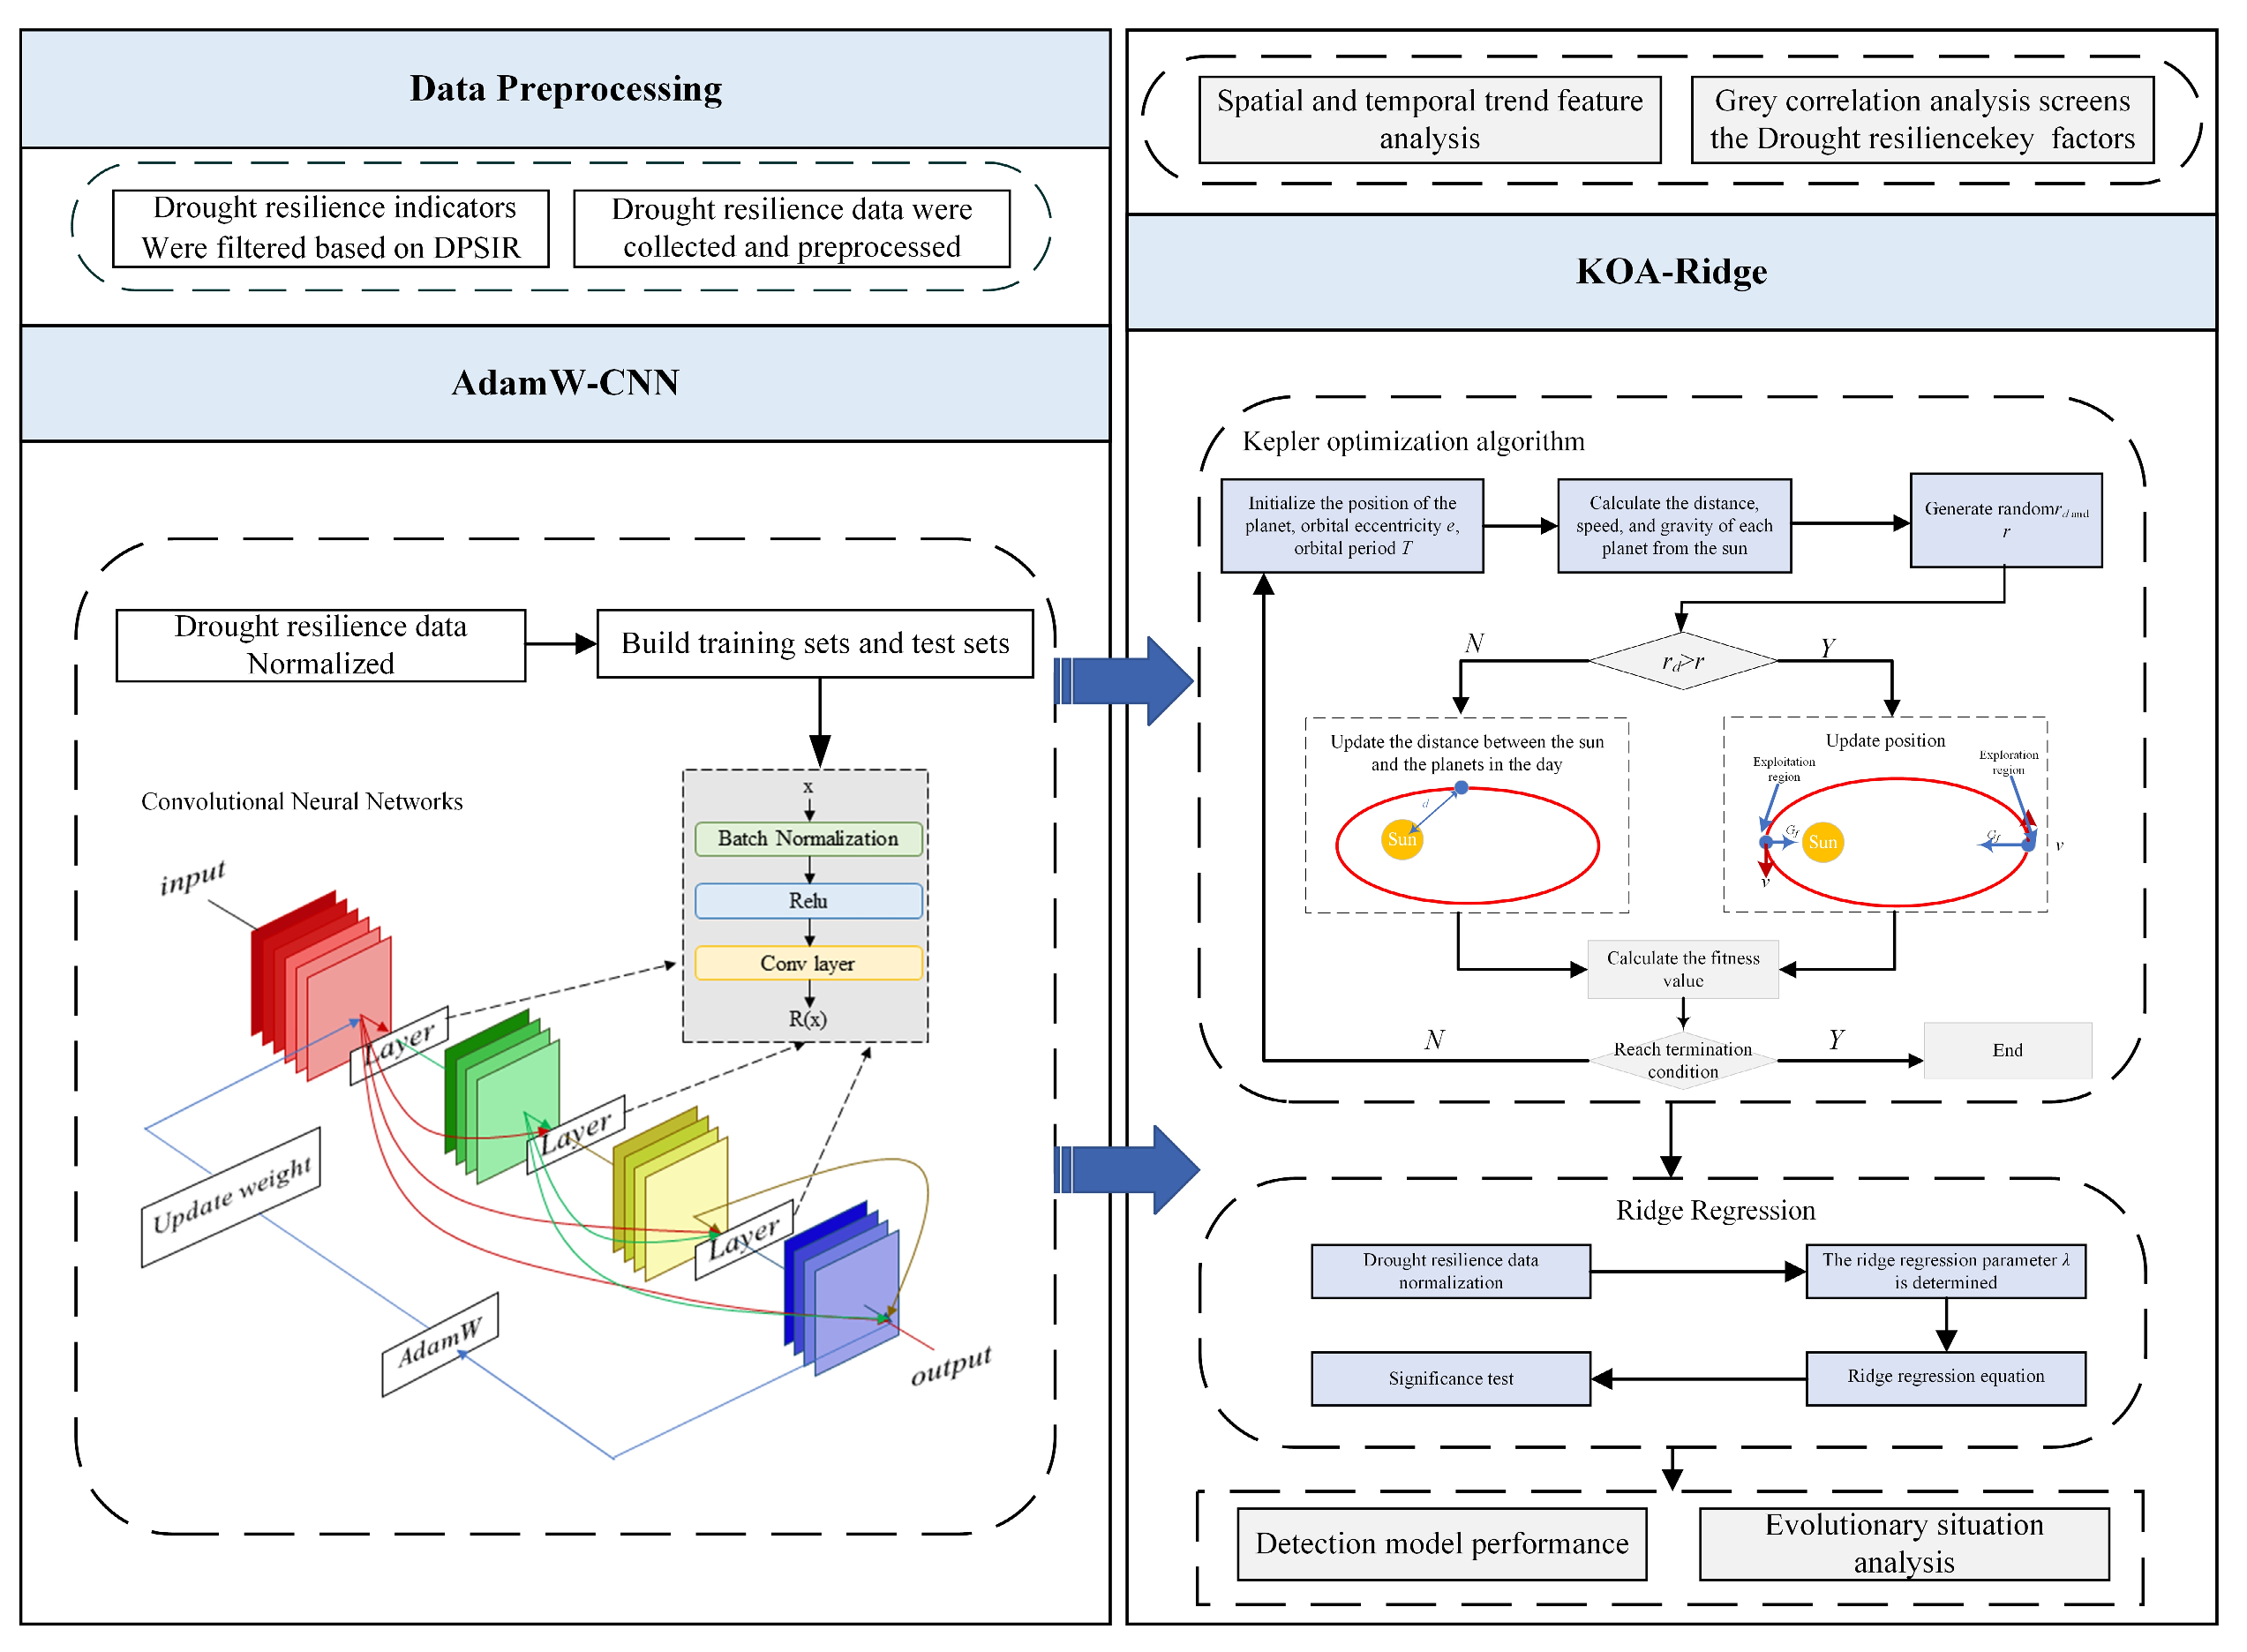
3.3. Data Preprocessing Methods
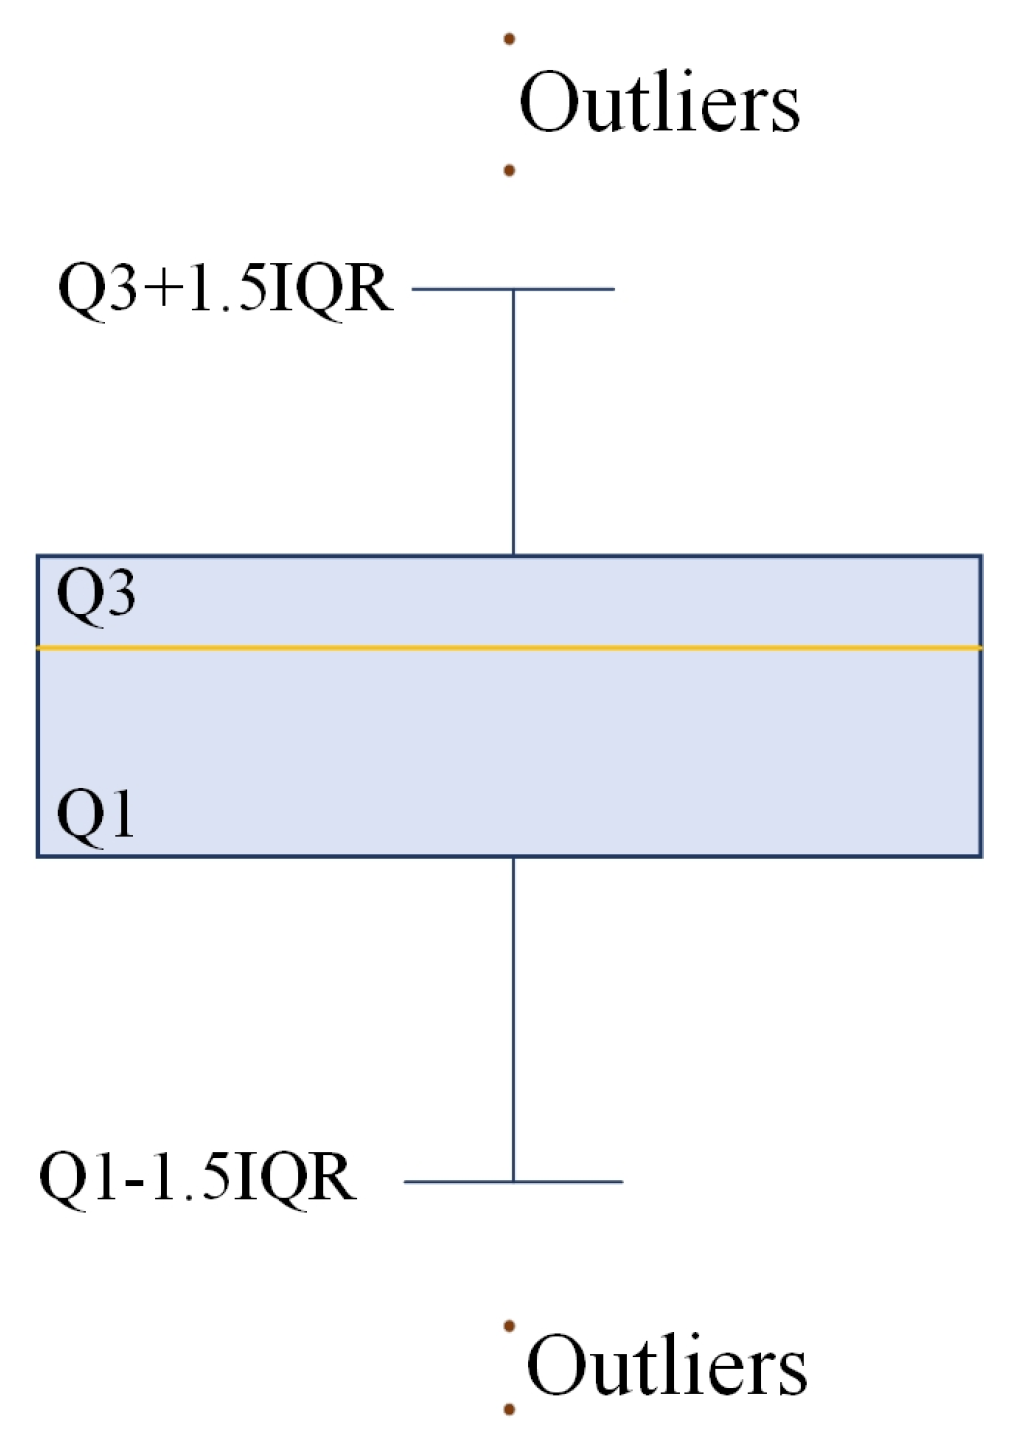
3.3.1. IQR and Boxplot Method
3.3.2. Kendall’s Tau-b Correlation Coefficient
3.4. Model Construction Method
3.4.1. Convolutional Neural Networks
- (1)
- In the convolution layer, the input data is convolved with multiple convolution cores. The mathematical expression of the convolution process is as follows:
- (2)
- The pooling layer is connected behind the convolutional layer, and its function is to reduce the dimension of the eigenvalues, while maintaining the invariance of the eigenscale to a certain extent. The pooling layer generally only performs dimensionality reduction operations, without parameters and without weight update.
- (3)
- The input data is propagated alternately through several convolutional layers and pooling layers, and the extracted features are classified by a fully connected layer network. On the fully connected layer, the input is the weighted sum of all the one-dimensional feature vectors expanded by the feature graph and obtained by the activation function. The calculation formula for the fully connected layer is as follows:
- (4)
- For specific classification tasks, the CNN needs to minimize the loss function of the network to determine whether the results of the regression model are optimal.
3.4.2. AdamW Adaptive Optimization Algorithm
3.4.3. AdamW–CNN Model
3.4.4. Gray Relational Analysis
3.4.5. Kepler Optimization Algorithm
3.4.6. KOA–Ridge Regression
3.4.7. Sequence Number Summation Theory
4. Results and Analysis
4.1. Indicator Selection
4.2. Data Preprocessing
4.3. Correlation Test
4.4. Drought Resilience Evaluation
4.5. Analysis of Spatiotemporal Variation Characteristics of Drought Resilience
4.6. Analysis of Key Factors of Drought Resilience
4.7. Construction of Drought Resilience Regression Equation
4.8. Evolution Situation Analysis
5. Discussion
5.1. AdamW–CNN Model Performance Evaluation
5.1.1. Fitting Evaluation
5.1.2. Rationality and Stability Evaluation
5.2. KOA–Ridge Model Performance Evaluation
5.3. Model Advantages
6. Conclusions
- (1)
- This study proposed an AdamW–CNN model and applied it to agricultural drought resilience evaluation. Through the analysis of the fitting effect of the model and the rationality and stability of the evaluation results, it is demonstrated that the AdamW–CNN model has high evaluation accuracy and reliability. This model will provide a new alternative and more accurate model for regional agricultural drought resilience evaluation. At the same time, this model can also be extended and applied to other similar multi-index evaluations.
- (2)
- During the study period, the time–history evolution of agricultural drought resilience in Qiqihar City can be divided into three stages: the first stage (2000–2004) was a period of fluctuation, the second stage (2004–2015) was a period of rapid improvement, and the third stage (2015–2021) was a period of slow improvement to a stable period. Precipitation, grain output per unit cultivated area, investment in primary industry, per capita cultivated land area, and proportion of effective irrigation area are the key factors influencing the change of agricultural drought resilience in the study area.
- (3)
- The KOA–Ridge regression model constructed in this study can objectively predict the evolution of agricultural drought resilience through key factors. Compared with the GA–Ridge and Ridge models, the KOA–Ridge regression model prevents overfitting of the model and improves the generalization ability of the model, making the simulation of the future evolution of agricultural drought resilience more accurate and effective.
- (4)
- By improving agricultural irrigation capacity through efficient use of agricultural water resources, consolidating and increasing grain production capacity, and increasing economic investment in the primary industry, sustainable improvement of agricultural drought resilience in Qiqihar City is possible along with stable and sustainable development.
- (5)
- Due to data limitations, the AdamW–CNN model and KOA–Ridge regression model proposed in this study have not been applied in other regions, which needs to be verified in future studies.
Author Contributions
Funding
Institutional Review Board Statement
Informed Consent Statement
Data Availability Statement
Conflicts of Interest
References
- Espinosa, L.A.; Portela, M.M.; Matos, J.P.; Gharbia, S. Climate change trends in a European coastal metropolitan area: Rainfall, temperature, and extreme events (1864–2021). Atmosphere 2022, 13, 1995. [Google Scholar] [CrossRef]
- Chiang, F.; Mazdiyasni, O.; AghaKouchak, A. Evidence of anthropogenic impacts on global drought frequency, duration, and intensity. Nat. Commun. 2021, 12, 2754. [Google Scholar] [CrossRef] [PubMed]
- Xu, J.; Ren, L.L.; Ruan, X.H.; Liu, X.F.; Yuan, F. Development of a physically based PDSI and its application for assessing the vegetation response to drought in northern China. J. Geophys. Res. Atmos. 2012, 117. [Google Scholar] [CrossRef]
- McKee, T.B.; Doesken, N.J.; Kleist, J. The relationship of drought frequency and duration to time scales. In Proceedings of the 8th Conference on Applied Climatology, Anaheim, CA, USA, 17–22 January 1993; Volume 17, pp. 179–183. [Google Scholar]
- Vicente-Serrano, S.M.; Beguería, S.; López-Moreno, J.I. A multiscalar drought index sensitive to global warming: The standardized precipitation evapotranspiration index. J. Clim. 2010, 23, 1696–1718. [Google Scholar] [CrossRef]
- Pellicone, G.; Caloiero, T.; Guagliardi, I. The de martonne aridity index in Calabria (Southern Italy). J. Maps 2019, 15, 788–796. [Google Scholar] [CrossRef]
- Swearingen, W.D. Drought hazard in Morocco. Geogr. Rev. 1992, 82, 401–412. [Google Scholar] [CrossRef]
- Holling, C.S. Resilience and stability of ecological systems. Annu. Rev. Ecol. Syst. 1973, 4, 1–23. [Google Scholar] [CrossRef]
- Dakos, V.; Kéfi, S. Ecological resilience: What to measure and how. Environ. Res. Lett. 2022, 17, 043003. [Google Scholar] [CrossRef]
- Walker, B.; Holling, C.S.; Carpenter, S.R.; Kinzig, A. Resilience, adaptability and transformability in social–ecological systems. Ecol. Soc. 2004, 9, 5. [Google Scholar] [CrossRef]
- Haile, G.G.; Tang, Q.; Sun, S.; Huang, Z.; Zhang, X.; Liu, X. Droughts in East Africa: Causes, impacts and resilience. Earth-Sci. Rev. 2019, 193, 146–161. [Google Scholar] [CrossRef]
- Ranjan, R. Combining social capital and technology for drought resilience in agriculture. Nat. Resour. Model. 2014, 27, 104–127. [Google Scholar] [CrossRef]
- Matlou, R.; Bahta, Y.T.; Owusu-Sekyere, E.; Jordaan, H. Impact of agricultural drought resilience on the welfare of smallholder livestock farming households in the Northern Cape Province of South Africa. Land 2021, 10, 562. [Google Scholar] [CrossRef]
- Bahta, Y.T.; Lombard, W.A. Nexus between Social Vulnerability and Resilience to Agricultural Drought amongst South African Smallholder Livestock Households. Atmosphere 2023, 14, 900. [Google Scholar] [CrossRef]
- Serdar, M.Z.; Koç, M.; Al-Ghamdi, S.G. Urban transportation networks resilience: Indicators, disturbances, and assessment methods. Sustain. Cities Soc. 2022, 76, 103452. [Google Scholar] [CrossRef]
- Yao, Y.; Fu, B.; Liu, Y.; Li, Y.; Wang, S.; Zhan, T.; Wang, Y.; Gao, D. Evaluation of ecosystem resilience to drought based on drought intensity and recovery time. Agric. For. Meteorol. 2022, 314, 108809. [Google Scholar] [CrossRef]
- Carr, E.R.; Wingard, P.M.; Yorty, S.C.; Thompson, M.C.; Jensen, N.K.; Roberson, J. Applying DPSIR to sustainable development. Int. J. Sustain. Dev. World Ecol. 2007, 14, 543–555. [Google Scholar] [CrossRef]
- Rey, D.; Holman, I.P.; Knox, J.W. Developing drought resilience in irrigated agriculture in the face of increasing water scarcity. Reg. Environ. Change 2017, 17, 1527–1540. [Google Scholar] [CrossRef]
- Maity, R.; Sharma, A.; Nagesh Kumar, D.; Chanda, K. Characterizing drought using the reliability-resilience-vulnerability concept. J. Hydrol. Eng. 2013, 18, 859–869. [Google Scholar] [CrossRef]
- Wang, H.; Gao, X.; Xu, T.; Xue, H.; He, W. Spatial-temporal evolution mechanism and efficiency evaluation of drought resilience system in China. J. Clean. Prod. 2023, 428, 139298. [Google Scholar] [CrossRef]
- Xu, W.; Yu, Q.; Proverbs, D. Evaluation of Factors Found to Influence Urban Flood Resilience in China. Water 2023, 15, 1887. [Google Scholar] [CrossRef]
- Kotzee, I.; Reyers, B. Piloting a social-ecological index for measuring flood resilience: A composite index approach. Ecol. Indic. 2016, 60, 45–53. [Google Scholar] [CrossRef]
- Watson, R.H. Interpretive structural modeling—A useful tool for technology assessment? Technol. Forecast. Soc. Change 1978, 11, 165–185. [Google Scholar] [CrossRef]
- Chen, Y.D.; Zhang, Q.; Xiao, M.; Singh, V.P. Evaluation of risk of hydrological droughts by the trivariate Plackett copula in the East River basin (China). Nat. Hazards 2013, 68, 529–547. [Google Scholar] [CrossRef]
- Liu, Y.; Eckert, C.M.; Earl, C. A review of fuzzy AHP methods for decision-making with subjective judgements. Expert Syst. Appl. 2020, 161, 113738. [Google Scholar] [CrossRef]
- Chen, W.; Shen, Y.; Wang, Y. Evaluation of economic transformation and upgrading of resource-based cities in Shaanxi province based on an improved TOPSIS method. Sustain. Cities Soc. 2018, 37, 232–240. [Google Scholar] [CrossRef]
- Lever, J.; Krzywinski, M.; Altman, N. Points of significance: Principal component analysis. Nat. Methods 2017, 14, 641–643. [Google Scholar] [CrossRef]
- Qian, L.; Zhang, R.; Hou, T.; Wang, H. A new nonlinear risk assessment model based on an improved projection pursuit. Stoch. Environ. Res. Risk Assess. 2018, 32, 1465–1478. [Google Scholar] [CrossRef]
- Pande, C.B.; Kushwaha, N.; Orimoloye, I.R.; Kumar, R.; Abdo, H.G.; Tolche, A.D.; Elbeltagi, A. Comparative assessment of improved SVM method under different kernel functions for predicting multi-scale drought index. Water Resour. Manag. 2023, 37, 1367–1399. [Google Scholar] [CrossRef]
- Huang, G.B.; Zhu, Q.Y.; Siew, C. Extreme learning machine: Theory and applications. Neurocomputing 2006, 70, 489–501. [Google Scholar] [CrossRef]
- Li, Z.; Liu, F.; Yang, W.; Peng, S.; Zhou, J. A survey of convolutional neural networks: Analysis, applications, and prospects. IEEE Trans. Neural Netw. Learn. Syst. 2021, 33, 6999–7019. [Google Scholar] [CrossRef]
- Şen, S.Y.; Özkurt, N. Convolutional neural network hyperparameter tuning with adam optimizer for ECG classification. In Proceedings of the 2020 Innovations in Intelligent Systems and Applications Conference (ASYU), Istanbul, Turkey, 15–17 October 2020; IEEE: Piscataway, NJ, USA, 2020; pp. 1–6. [Google Scholar]
- Gu, J.; Wang, Z.; Kuen, J.; Ma, L.; Shahroudy, A.; Shuai, B.; Liu, T.; Wang, X.; Wang, G.; Cai, J.; et al. Recent advances in convolutional neural networks. Pattern Recognit. 2018, 77, 354–377. [Google Scholar] [CrossRef]
- He, F.; Liu, T.; Tao, D. Control batch size and learning rate to generalize well: Theoretical and empirical evidence. Adv. Neural Inf. Process. Syst. 2019, 32, 1–10. [Google Scholar]
- Jiang, G. Security detection design for laboratory networks based on enhanced LSTM and AdamW algorithms. Int. J. Inf. Technol. Syst. Approach 2022, 16, 1–13. [Google Scholar] [CrossRef]
- Sun, H.; Cui, J.; Shao, Y.; Yang, J.; Xing, L.; Zhao, Q.; Zhang, L. A Gastrointestinal Image Classification Method Based on Improved Adam Algorithm. Mathematics 2024, 12, 2452. [Google Scholar] [CrossRef]
- Wang, Q.; Cao, L.; Zhang, B. Analysis of causes and countermeasures of drought in Qiqihar City. Heilongjiang Sci. Technol. Water Conserv. 2003, 138–140. Available online: https://link.cnki.net/doi/10.14122/j.cnki.hskj.2003.03.119 (accessed on 20 May 2025).
- Francis, R.; Bekera, B. A metric and frameworks for resilience analysis of engineered and infrastructure systems. Reliab. Eng. Syst. Saf. 2014, 121, 90–103. [Google Scholar] [CrossRef]
- Liu, J.; Shi, P.; Ge, Y.; Wang, J.; Lü, H. The review of disaster resilience research. Adv. Earth Sci. 2006, 21, 211–218. [Google Scholar]
- Sendai, U. Framework for Disaster Risk Reduction 2015–2030; United Nations International Strategy on Disaster Reduction: Geneva, Switzerland, 2015. [Google Scholar]
- Smeets, E.; Weterings, R. Environmental indicators: Typology and Overview; European Environment Agency: Copenhagen, Denmark, 1999. [Google Scholar]
- Hojo, T.; Pearson, K. Distribution of the median, quartiles and interquartile distance in samples from a normal population. Biometrika 1931, 23, 315–363. [Google Scholar] [CrossRef]
- Wilson, T.P. A proportional-reduction-in-error interpretation for Kendall’s tau-b. Soc. Forces 1969, 47, 340–342. [Google Scholar] [CrossRef]
- Sarıgül, M.; Ozyildirim, B.M.; Avci, M. Differential convolutional neural network. Neural Netw. 2019, 116, 279–287. [Google Scholar] [CrossRef]
- Zhou, P.; Xie, X.; Lin, Z.; Yan, S. Towards understanding convergence and generalization of AdamW. IEEE Trans. Pattern Anal. Mach. Intell. 2024, 46, 6486–6493. [Google Scholar] [CrossRef] [PubMed]
- Ioffe, S.; Szegedy, C. Batch normalization: Accelerating deep network training by reducing internal covariate shift. Int. Conf. Mach. Learn. 2015, 37, 448–456. [Google Scholar]
- Kuo, Y.; Yang, T.; Huang, G.W. The use of grey relational analysis in solving multiple attribute decision-making problems. Comput. Ind. Eng. 2008, 55, 80–93. [Google Scholar] [CrossRef]
- Hu, G.; Gong, C.; Li, X.; Xu, Z. CGKOA: An enhanced Kepler optimization algorithm for multi-domain optimization problems. Comput. Methods Appl. Mech. Eng. 2024, 425, 116964. [Google Scholar] [CrossRef]
- McDonald, G.C. Ridge regression. Wiley Interdiscip. Rev. Comput. Stat. 2009, 1, 93–100. [Google Scholar] [CrossRef]
- Hoerl, A.E.; Kennard, R.W. Ridge regression: Biased estimation for nonorthogonal problems. Technometrics 1970, 12, 55–67. [Google Scholar] [CrossRef]
- Liu, D.; Fan, Z.; Fu, Q.; Li, M.; Faiz, M.A.; Ali, S.; Li, T.; Zhang, L.; Khan, M.I. Random forest regression evaluation model of regional flood disaster resilience based on the whale optimization algorithm. J. Clean. Prod. 2020, 250, 119468. [Google Scholar] [CrossRef]
- Guo, X. Study on traffic volume forecasting of imperial river bridge based on the theory of serial number summation. Logist. Sci. Tech 2011, 34, 11–12. [Google Scholar]
- Guo, Y.; Huang, S.; Huang, Q.; Wang, H.; Fang, W.; Yang, Y.; Wang, L. Assessing socioeconomic drought based on an improved Multivariate Standardized Reliability and Resilience Index. J. Hydrol. 2019, 568, 904–918. [Google Scholar] [CrossRef]
- Chen, J.; Yang, S.; Li, H.; Zhang, B.; Lv, J. Research on geographical environment unit division based on the method of natural breaks (Jenks). Int. Arch. Photogramm. Remote Sens. Spat. Inf. Sci. 2013, 3, 47–50. [Google Scholar] [CrossRef]
- Zhang, G.P. Time series forecasting using a hybrid ARIMA and neural network model. Neurocomputing 2003, 50, 159–175. [Google Scholar] [CrossRef]
- Sun, T.Y.; Liu, D.P.; Liu, D.; Zhang, L.L.; Li, M.; Khan, M.I.; Li, T.X.; Cui, S. A new method for flood disaster resilience evaluation: A hidden markov model based on Bayesian belief network optimization. J. Clean. Prod. 2023, 412, 137372. [Google Scholar] [CrossRef]
- Skakun, S.; Kussul, N.; Shelestov, A.; Kussul, O. The use of satellite data for agriculture drought risk quantification in Ukraine. Nat. Hazards 2016, 7, 901–917. [Google Scholar] [CrossRef]
- Rippey, B.R. The US drought of 2012. Weather Clim. Extrem. 2015, 10, 57–64. [Google Scholar] [CrossRef]


| System | Evaluation Index | Index Code | Index Definition | Type | Unit |
|---|---|---|---|---|---|
| Driving forces | Precipitation | D1 | The depth of rainwater accumulation on the horizontal surface without evaporation; infiltration and loss are two of the important factors that affect the occurrence of drought | + | mm |
| Population density | D2 | The number of people per square kilometer of land area reflects the impact of drought on the labor force in the area | + | person/km2 | |
| Population growth rate | D3 | The proportion of population growth due to natural and migratory changes; reflects the vitality of the regional population | + | ‰ | |
| Pressure | Per capita cultivated land area | P1 | The ratio of cultivated land area to total population; reflects the regional food supply security | + | hm2/person |
| Proportion of effective irrigation area | P2 | The proportion of cultivated land area that is flat and can be used for normal irrigation to the total cultivated land area reflects the ability to alleviate drought through the irrigation system | + | % | |
| State | Forest coverage rate | S1 | The ratio of forest area to total area reflects the water conservation and water-holding capacity of the land, which can reduce the risk of drought | + | % |
| Water resources per capita water resources | S2 | The ratio of total water resources to total population is an important indicator to reflect the impact of drought | + | m3/person | |
| Proportion of agricultural population | S3 | The proportion of workers directly involved in agriculture to the regional population reflects the labor resources that can be mobilized in a timely response to drought | + | % | |
| Grain output per unit cultivated area | S4 | The ratio of total grain production to total arable land reflects the level of grain storage to withstand drought | + | kilogram/hm2 | |
| Impact | Per capita GDP | I1 | The ratio of gross domestic product (GDP) to total population reflects the economic strength of a region coping with drought | + | CNY |
| Proportion of agricultural output | I2 | The ratio of agricultural output value to total output value reflects the degree of regional agricultural development | + | % | |
| Proportion of dry land area | I3 | The ratio of dry land area to total cultivated land area; the higher the proportion of dry land, the stronger the recovery ability. | + | % | |
| Response | Investment in primary industry | R1 | The funds invested in agriculture, forestry, animal husbandry, and fishery reflect the economic situation of the primary industry and the supply capacity of materials in the disaster-stricken areas | + | 104 CNY |
| Proportion of investment in the tertiary industry | R2 | The proportion of investment in the tertiary industry each year; it mainly reflects the level of investment in transportation, environment and public facilities | + | % | |
| Electromechanical wells per hectare | R3 | The number of electromechanical wells per hectare reflects the water intake capacity of the region in response to drought | + | set/hm2 | |
| Total power of agricultural machinery per hectare | R4 | The power of the various types of machinery used for agricultural production per hectare reflects the ability to quickly recover production after a drought | + | kw/hm2 |
| Evaluation Index Code | I | II | III | IV |
|---|---|---|---|---|
| D1 | ≤354.5 | (354.5, 469.5] | (469.5, 593.1] | >593.1 |
| D2 | ≤83.99 | (83.99, 117.8] | (117.8, 168.33] | >168.33 |
| D3 | ≤−7.84 | (−7.84, 1.28] | (1.28, 5.98] | >5.98 |
| P1 | ≤0.1147 | (0.1147, 0.399] | (0.399, 0.477] | >0.477 |
| P2 | ≤0.16 | (0.16, 0.31] | (0.31, 0.69] | >0.69 |
| S1 | ≤8.18 | (8.18, 13.03] | (13.03, 19.90] | >19.90 |
| S2 | ≤650 | (650, 1033] | (1033, 1590] | >1590 |
| S3 | ≤24 | (24, 68] | (68, 78] | >78 |
| S4 | ≤2744 | (2744, 4311] | (4311, 6409] | >6409 |
| I1 | ≤8783 | (8783, 16,386] | (16,386, 25,483] | >25,483 |
| I2 | ≤44.13 | (44.13, 55.06] | (55.06, 63.31] | >63.31 |
| I3 | ≤61.23 | (61.23, 81.49] | (81.49, 94.71] | >94.71 |
| R1 | ≤98,865 | (98,865, 200,816] | (200,816, 379,639] | >379,639 |
| R2 | ≤27.9 | (27.9, 35.3] | (35.3, 44.8] | >44.8 |
| R3 | ≤0.07 | (0.07, 0.18] | (0.18, 0.24] | >0.24 |
| R4 | ≤1.03 | (1.03, 2.21] | (2.21, 2.93] | >2.93 |
| Level | I | II | III | IV |
|---|---|---|---|---|
| Range | [1.103, 1.309) | [1.309, 2.181) | [2.181, 3.366) | [3.366, 4.259) |
| Evaluation Index Code | Partial Regression Coefficient | t | p | F (p) |
|---|---|---|---|---|
| D1 | 0.283 | 3.104 | 0.000 *** | F = 332.61 (p = 0.002 ***) |
| R1 | 2.632 | 25.837 | 0.002 *** | |
| P1 | 0.25 | 2.778 | 0.023 ** | |
| P2 | 0.768 | 6.144 | 0.000 *** | |
| S4 | 0.834 | 9.839 | 0.000 *** | |
| R2 = 0.914 | After the λ adjustment R2 = 0.891 | |||
| Area | Comparison Models | ||
|---|---|---|---|
| AdamW–CNN | RMSProp-CNN | CNN | |
| Qiqihar Urban area | II | III | II |
| Nehe | III | III | III |
| Longjiang | III | III | III |
| Yian | IIII | II | II |
| Tailai | II | II | II |
| Gannan | III | III | III |
| Fuyu | II | II | I |
| Keshan | II | II | II |
| Kedong | II | II | I |
| Baiquan | III | III | II |
| Average | II | II | II |
| Evaluation Method | Comparison Models | ||
|---|---|---|---|
| AdamW–CNN | RMSProp-CNN | CNN | |
| Spearman correlation coefficient | 0.976 | 0.952 | 0.929 |
| 0.976 | 0.857 | 0.862 | |
| 0.965 | 0.895 | 0.879 | |
| 0.919 | 0.909 | 0.842 | |
| 0.944 | 0.903 | 0.873 | |
| 0.933 | 0.857 | 0.896 | |
| 0.911 | 0.926 | 0.873 | |
| 0.976 | 0.936 | 0.884 | |
| 0.963 | 0.898 | 0.842 | |
| 0.963 | 0.903 | 0.842 | |
| S | 0.953 | 0.904 | 0.872 |
| V | 0.977 | 0.971 | 0.974 |
| Evaluation Method | Ridge | GA-Ridge | KOA–Ridge |
|---|---|---|---|
| MSE | 0.213 | 0.124 | 0.075 |
| R2 | 0.914 | 0.882 | 0.891 |
Disclaimer/Publisher’s Note: The statements, opinions and data contained in all publications are solely those of the individual author(s) and contributor(s) and not of MDPI and/or the editor(s). MDPI and/or the editor(s) disclaim responsibility for any injury to people or property resulting from any ideas, methods, instructions or products referred to in the content. |
© 2025 by the authors. Licensee MDPI, Basel, Switzerland. This article is an open access article distributed under the terms and conditions of the Creative Commons Attribution (CC BY) license (https://creativecommons.org/licenses/by/4.0/).
Share and Cite
Jiang, C.; Zhang, L.; Liu, D.; Li, M.; Qi, X.; Li, T.; Cui, S. Evolution Characteristics and Influencing Factors of Agricultural Drought Resilience: A New Method Based on Convolutional Neural Networks Combined with Ridge Regression. Sustainability 2025, 17, 4808. https://doi.org/10.3390/su17114808
Jiang C, Zhang L, Liu D, Li M, Qi X, Li T, Cui S. Evolution Characteristics and Influencing Factors of Agricultural Drought Resilience: A New Method Based on Convolutional Neural Networks Combined with Ridge Regression. Sustainability. 2025; 17(11):4808. https://doi.org/10.3390/su17114808
Chicago/Turabian StyleJiang, Chenyi, Liangliang Zhang, Dong Liu, Mo Li, Xiaochen Qi, Tianxiao Li, and Song Cui. 2025. "Evolution Characteristics and Influencing Factors of Agricultural Drought Resilience: A New Method Based on Convolutional Neural Networks Combined with Ridge Regression" Sustainability 17, no. 11: 4808. https://doi.org/10.3390/su17114808
APA StyleJiang, C., Zhang, L., Liu, D., Li, M., Qi, X., Li, T., & Cui, S. (2025). Evolution Characteristics and Influencing Factors of Agricultural Drought Resilience: A New Method Based on Convolutional Neural Networks Combined with Ridge Regression. Sustainability, 17(11), 4808. https://doi.org/10.3390/su17114808