Article

Evaluating the Sustainability of Tetra Pak Smart Packaging Through Life Cycle and Economic Analysis

by
Marina Stramarkou
1,2,*,
Christos Boukouvalas
1,
Dimitra Nektaria Fragkouli
1,
Christos Tsamis
2 and
Magdalini Krokida
1
1
Laboratory of Process Analysis and Design, School of Chemical Engineering, National Technical University of Athens, Iroon Polytechneiou 9, 15780 Athens, Greece
2
Institute of Nanoscience and Nanotechnology, National Centre for Scientific Research (NCSR) “Demokritos”, 15341 Athens, Greece
*
Author to whom correspondence should be addressed.
Sustainability 2025, 17(11), 4810; https://doi.org/10.3390/su17114810
Submission received: 11 March 2025 / Revised: 13 May 2025 / Accepted: 20 May 2025 / Published: 23 May 2025

Abstract

:
Tetra Pak packaging represents a significant advancement in the field of packaging. However, in recent decades, the emerging needs of modern consumers for high-quality foods with extended shelf life, along with the increasing concerns about food waste, have made conventional packaging inadequate. In response, packaging technologies are evolving towards smart packaging, which includes active and intelligent packaging. This innovative solution can extend products’ shelf life and contribute to the decrease in food waste, providing higher environmental and economic sustainability compared to conventional TetraPak packaging. The objective of this work is the life cycle assessment (LCA) and economic analysis of an innovative smart packaging system, which consists of an antioxidant layer (active packaging) and a chemical sensor to detect food spoilage (intelligent packaging). This study examines the potential of integrating active and intelligent components into packaging to enhance environmental performance relative to conventional Tetra Pak packaging, while also assessing the associated economic trade-offs of smart packaging adoption. The environmental footprint of the production, use and end of life of the packaging and the contained food products are examined through four use scenarios (baseline, best-case, average-case, and worst-case), considering that the application of smart packaging leads to the prevention of food waste at different rates. LCA demonstrated that the environmental performance of smart packaging is 29.17% lower in the climate change category in the average-case scenario. The economic analysis showed that smart packaging increases costs by EUR 9.28 × 10⁻², demonstrating a significant benefit with only a minimal cost increase. Therefore, the findings of this study can provide new perspectives in the rapidly evolving field of food packaging, promoting smart packaging as a viable solution for reducing food waste and improving sustainability.

1. Introduction

Food packaging is the final stage of food processing and plays a critical role throughout the supply chain from production to final consumption [1]. The four basic functions of packaging are the containment of the food, its protection from degradation and spoilage processes, the facilitation of its transport and use, and the provision of information to consumers, such as the ingredients and nutritional value [2,3].
Tetra Pak packaging is a remarkable advancement in the field of packaging. It is a multilayer packaging that is applied in many food products, such as liquid foods (e.g., juices), refrigerated foods (e.g., dairy products), and shelf-stable foods (e.g., ready meals, sauces, vegetables). It consists of six layers of cardboard, low density polyethylene (LDPE), and aluminum foil. Cardboard constitutes 75% of the packaging mass and is used to ensure the packaging’s rigid shape, to increase its strength, and to print the provided information. LDPE, which is used at 20% and is present in four layers, presents several functions: protection of the paper layer from contact with external moisture, protection of the aluminum film from direct contact with the contents of the package, adhesion, and connection of the layers to each other and heat-sealing. LDPE is considered one of the most chemically inert plastics, which is why it is used in contact with food in the manufacture of the container [4,5]. Finally, aluminum foil is used at 5% of the total mass thanks to its excellent barrier properties to light, water vapor, oxygen, odors, and microorganisms. In addition, aluminum contributes to the rapid heating of plastic films and therefore facilitates the heat sealing of the multilayer film to form the container thanks to its good thermal and electrical conductivity. The percentages of each material and the layers of the Tetra Pak package are shown in Figure 1a and Figure 1b, respectively.
The food packaging sector is constantly evolving both in the scientific and industrial sectors due to the increasing expectations of consumers for high-quality food products with extended shelf life, along with the strict on food safety and environmental sustainability. Moreover, the depletion of natural resources and the inversely proportional population growth highlight the need for innovative and sustainable packaging solutions [7,8]. In response to these demands, packaging technologies are acquiring additional functionalities and evolving in two directions: (a) intelligent packaging, which has the ability to detect changes in the product and its environment, and (b) active packaging, which can then control and act according to these changes [8,9]. These two concepts are combined in an innovative packaging system, smart packaging.
As defined by the European Regulation 450/2009, active packaging includes packaging systems that interact with food and are designed to “intentionally incorporate ingredients that release or absorb substances into or from the packaged food or the surrounding environment” [1,10]. The addition of active substances through packaging affects the surface of the food, where the degradation most often occurs, and is more effective than the direct addition of active substances to food, which also requires larger quantities of these substances [11]. Therefore, by increasing the shelf life of food, active packaging contributes to decreasing food waste and to reducing the supply costs by offering foods with a longer expiration date [8,12].
Among the various active packaging technologies, antioxidant packaging is one of the most effective in preventing spoilage of perishable foods through the controlled release of antioxidant compounds. Antioxidant compounds, and especially natural antioxidants from plant extracts, have attracted great interest due to their ability to improve the stability of foods sensitive to oxidation [13,14,15,16]. In this study, aiming to promote sustainability, phenolic compounds from apricot and peach by-products were used since they are rich sources of these valuable components and widely cultivated crops [17]. The antioxidants were extracted and encapsulated into zein matrix through electrospinning to produce an antioxidant film (active layer) on top of the conventional TetraPak. The combination of nanocomposites, electrospinning techniques, and bioactive compounds offers innovative and sustainable solutions for the food packaging industry, improving both food safety and quality while addressing environmental challenges [18].
On the other hand, emerging demands for continuous monitoring of food quality have led to the emergence of advanced types of intelligent packaging systems. According to the European Food Safety Authority (EFSA), intelligent packaging materials are defined as “materials and objects that monitor the condition of packaged food or the environment surrounding food” [19]. Intelligent packaging has the ability to communicate the conditions of the packaged product to all the stakeholders in the supply chain, including producers, retailers and consumers, without interacting with it [7]. Their aim is to monitor the food product and transmit information regarding its condition and integrity, its contents, etc., using information either from the internal environment of the packaging (e.g., metabolites) or from the external environment (e.g., temperature). Therefore, intelligent packaging allows for a safer and more efficient supply chain, avoiding unnecessary transport and decreasing food waste [10,20].
Sensors, and especially chemical sensors, are one of the most suitable technologies for the development of intelligent packaging thanks to their receptor that is chemically able to detect volatile organic compounds and small gas molecules, which are produced due to food spoilage, such as carbon dioxide (CO2) [10,20]. CO2 is a product of the metabolic activities of bacteria and fungi, which contaminate various foods due to inappropriate handling and storage conditions [21]. Therefore, the detection of the change in the quantity of CO2 inside the packaged food by the chemical sensor can indicate its shelf life, quality and safety of the packaged food [22,23]. In this study, a chemical resistance sensor made from zinc oxide (ZnO) was developed due to its high stability, ease of use, low cost, and high resistance to humidity and temperature changes [24]. However, while this advancement in intelligent packaging is promising, the high production costs of sensors and the complexity of integrating them with existing packaging systems are barriers to widespread adoption [18].
Smart packaging is designed to enhance environmental sustainability by reducing food waste; however, the difficulty in its end of life due to multiple materials and embedded electronics may limit its overall sustainability. Therefore, it is essential to assess whether it truly meets this objective. This work evaluates the environmental impact of the proposed antioxidant and intelligent packaging system and examines its economic feasibility compared to conventional Tetra Pak packaging. In addition to assessing its sustainability credentials, the cost implications associated with integrating antioxidant and intelligent features are analyzed to determine whether the benefits outweigh the potential increase in production expenses. By considering both environmental and economic factors, this research aims to provide a comprehensive evaluation of smart packaging as a viable and sustainable alternative to traditional packaging solutions.

2. Materials and Methods

LCA was carried out in accordance with the protocols of ISO 14040 (14040:2006 [25] and 14044:2006 [26]). The Life Cycle Impact Assessment (LCIA) was performed using ReCiPe 2016 v1.1 (H, hierarchist) at midpoint level comprising 18 midpoint impact categories and the impact categories were calculated through the software of GABI ts (v10.6.2.9, Sphera Solutions GmbH, Stuttgart, Germany) [27].

2.1. Goal and Scope Definition

The goal of the LCA study is the determination of the environmental footprint of Tetrapak smart packaging, where a chemical sensor for detecting carbon dioxide (CO2)—intelligent packaging–and an electrospun film with encapsulated antioxidant compounds–active packaging—are integrated. This study assesses the environmental impact of smart Tetra Pak packaging and compares it with a conventional Tetra Pak packaging. The production of the two systems, as well as the use and end-of-life stages of (i) the packaging and (ii) the food contained in them are included. To do this, four use scenarios are adapted based on the approach that the extension of the shelf life of the contained foods through the use of smart TetraPak packaging is expected to decrease food spoilage and, therefore, food waste [28]:
  • Scenario S0: conventional Tetrapak packaging produces 30% food waste (base scenario);
  • Scenario S1: smart packaging can produce 5% food waste (best-case scenario);
  • Scenario S2: smart packaging can produce 10% food waste (average-case scenario);
  • Scenario S3: smart packaging can produce 20% (worst-case scenario) food waste.

2.1.1. Functional Unit

With regard to the conventional Tetra Pak packaging, the functional unit is considered to be the packaging that contains two liters (2 × 10⁻³ m3) of food product excluding the lid (cap) and that weighs 69.92 g. Accordingly, the functional unit of the smart Tetra Pak packaging is considered to be the Tetra Pak packaging that contains two liters of food product, includes the chemical sensor (2.76 g) and the film of encapsulated antioxidant compounds (2.70 g), and weighs a total of 75.38 g.

2.1.2. Product Systems

The product system of this LCA study are
  • The simple Tetra Pak package (Product System A);
  • The smart Tetra Pak packaging (Product System B), which consists of the simple package along with two subsystems: (i) the sensor that can detect changes in CO2 concentration (Product Subsystem B1) and (ii) the biodegradable film with the encapsulated antioxidant compounds (Product Subsystem B2).
Product System A
Product system A involves the conventional Tetra Pak packaging production, use and end of life.
Firstly, the production stage consists of
  • The production of the raw materials: four layers of polyethylene (PE) (20% of the total weight of the package), one layer of hard paper (75% of the package), one sheet of aluminum (5% of the package); then
  • The heat sealing of the multilayer films and the formation of the container [6,29].
The process flowchart of Product System A production is presented in Figure 2.
Product System B
Product System B refers to the smart Tetra Pak which is composed of the chemical sensor for detecting carbon dioxide (CO2)—intelligent packaging—(Subsystem B1) and the electrospun film with encapsulated antioxidant compounds–active packaging—(Subsystem B2).
Starting with the Subsystem B1, the fabrication of the chemical sensor is described in our previous works [27,30] and includes the development of three different layers: the ZnO sensing film, the silicon oxide (SiO2) substrate (Substrate 1), and the Printed Circuit Board (PCB) from PET substrate (Substrate 2). A photo and the structure of the chemical sensor is presented in Figure 3a and Figure 3b, respectively, whereas the process flowcharts of the fabrication of the ZnO sensing film, Substrate 1 and 2, are shown in Figure 4.
The production of the film with the encapsulated antioxidant compounds (Subsystem B2) is described in this Section. Specifically, phenolic antioxidant compounds were extracted from peach and apricot waste using the solvent system of ethanol: water, as described in our work [31]. A pre-weighed amount of zein, which served as the matrix, was dissolved in the extracts for a final polymer concentration of 33% w/v. The encapsulation of the bioactive compounds into the packaging was performed through electrospinning of the polymer solution onto the conventional Tetra Pak under the optimum conditions: temperature of 25 °C, applied voltage of 27 kV, solution flow rate of 1.2 mL/ h, and a tip-to-collector distance of 16 cm. The produced active film is shown in Figure 5a, whereas the electrospinning unit (TL-Pro-BM) is shown in Figure 5b. The process flowchart of the active film is given in Figure 6.
The production of the final smart packaging involves the electrospinning of the antioxidant solution (coating) onto the conventional TetraPak and afterwards the incorporation of the chemical sensor, and it is shown in Figure 7 for a better understanding of the whole process.
Following the production, the next stages that are examined in this study are the retail, the use, and the end of life of the two types of packaging and the contained food. Specifically,
  • Food retail stage covers all process/technology stages in the supply chain of a food store including transport and distribution of the packaged food.
  • Use stage generates the organic waste and packaging waste and four use scenarios are adapted: conventional packaging creates 30% food waste, while smart packaging can create 5% (best-case), 10% (average-case), and 20% (worst-case scenario) food waste [28].
  • The end of life of the Tetra Pak packaging refers to 26% recycling [32], 29.6% incineration and 46.4% landfilling. When recycling, the majority of Tetra Pak recycling plants (97 out of 170) [32] effectively recycle the 75% of the packaging, which represents the paper fraction. This process yields paper fibers, at a rate of 80% of the paper mass that are used to produce paper products other than packaging [33]. From 1 kg of packaging destined for recycling, 0.60 kg of paper fibers are produced, while the remaining 0.40 kg is directed to incineration (39%) and landfill (61%). Overall, from 1 kg of Tetra Pak packaging, 0.16 kg is recycled, 0.33 kg is incinerated, and 0.51 kg ends up in landfills.
  • The end-of-life treatment of organic food waste is distributed between 40% composting and 60% landfilling, according to the EUROSTAT report (2018) on the disposal of the organic fraction within EU-28 and US Environmental Protection Agency (EPA) [34,35].
The flow diagrams of the examined stages are presented in Figure 8.

2.1.3. System Boundaries

The processes that account for the greatest changes in the assessment of the environmental footprint of packaging are its production, its use and its waste management (end of life). The system boundaries are defined from cradle-to-grave and include the production of conventional and smart packaging, the food retail, the use, the end of life of packaging, and the food (organic) waste.
Regarding the geographical boundaries, Europe is chosen as the geographical area to which the study applies.

2.1.4. Data Requirements

The data used in the study derive from
(i)
Simulations of the manufacturing of the sensor and the film with the included antioxidant compounds on an industrial scale based on the performed measurements and experiments in laboratory scale;
(ii)
Publications in scientific papers;
(iii)
Reports on the Tetra Pak website containing the latest official Tetra Pak data;
(iv)
European statistical studies of the last 5 years;
(v)
Regarding the use stage of packaging, the scenarios, they are based on data from [28];
(vi)
Regarding the recycling process of Tetra Pak that initially takes place in the pulper, the data were found from official websites of pulper manufacturing companies. An average capacity was assumed (250 tons per day) and the energy and water consumptions were found, given the final moisture content of the pulp at the end of the process.

2.1.5. Assumptions and Limitations

The main limitations of this study are related to the pilot-scale production of the chemical sensor and the lack of data for industrial-scale production. Additionally, the four use scenarios used in the analysis are based on information from the literature rather than real-life applications, which may create some uncertainty in the environmental footprint estimations. However, this does not influence the main goal of the study, which is to compare the environmental impact of smart and conventional Tetra Pak packaging as the LCA evaluates both systems in the same way.

2.2. Life Cycle Inventory (LCI)

The LCI of the production of Product System A is found in Table 1.
The LCI of the production of Product Subsystem B1 is presented in Table 2.
The LCI of the production of Product Subsystem B2 is presented in Table 3.
Finally, the LCI for the retail, use, and end of life of Product Systems A and B are presented in Table 4.

2.3. Preliminary Economic Analysis

To enhance the study and the comparison between smart and conventional packaging, a cost analysis was conducted for the production of both systems. The preliminary economic assessment considered the primary operating costs, including materials and electricity required for manufacturing smart Tetra Pak packaging, while excluding fixed costs, such as equipment expenses, and labor costs. Labor costs and equipment depreciation were not included in the present study due to the lack of available data for their estimation. As the data were obtained at the laboratory scale, the calculation of equipment and labor expenses is not feasible at this stage.
The cost of the conventional Tetra Pak (System A), and of the production of CO2 sensor (Subsystem B1) and active layer (Subsystem B2) are presented in Table 5, Table 6 and Table 7, respectively. The cost of by-products of fruits that served as the source of the antioxidant compounds is equal to zero.

3. Results

3.1. Life Cycle Impact Assessment (LCIA)

The results of the LCA are presented in Table 8, showing the calculated values of the ReCiPe 2016 (H) midpoint indicators for Smart TetraPak Packaging (System B). These values are the sum of the contributions from the production of conventional Tetra Pak packaging, the sensor and the electrospun layer, as well as the packaging’s end-of-life phase, without including the retail, use, and end of life of the contained food.
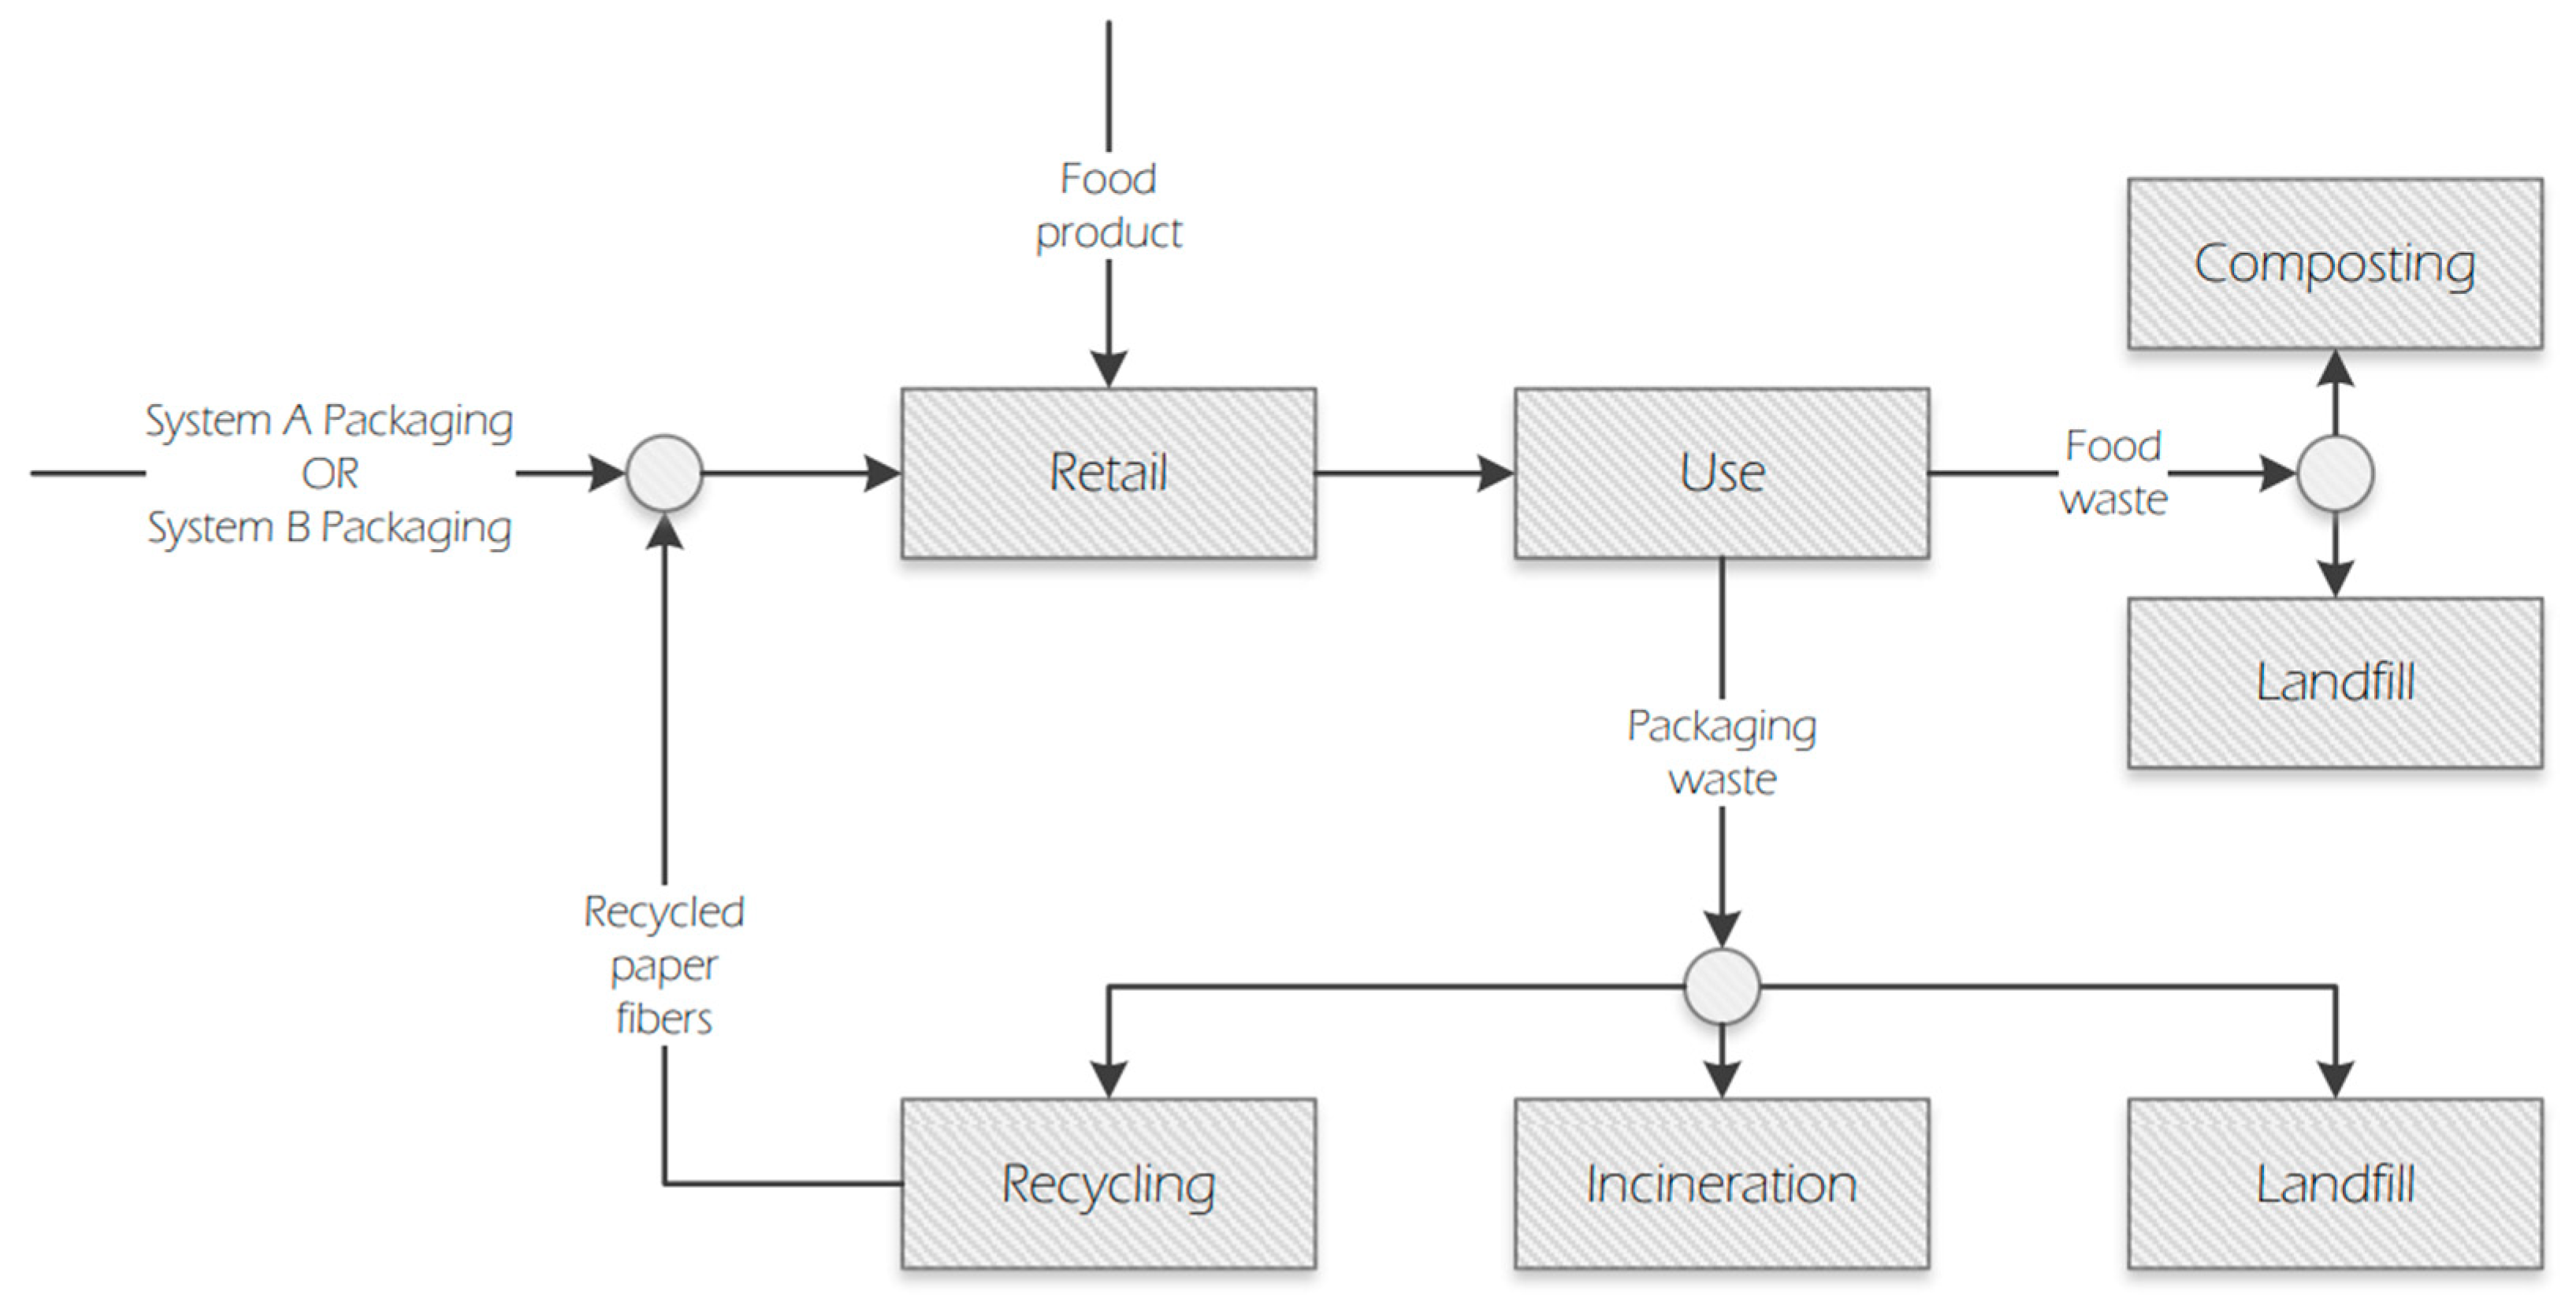
It is noteworthy that consistency of the comparative LCA analysis between conventional and smart Tetra Pak packaging, both packaging systems follow similar waste management pathways, namely incineration, recycling, or landfill, as explained in Section 2.1.2.
Among the various midpoint indicators, three of them were identified as particularly significant and are discussed in detail, including the contribution of each component of smart packaging. These indicators are “Climate Change”, “Fossil Depletion”, and “Freshwater Eutrophication”. For the overall Smart Packaging, the respective values of these indicators are 1.39 × 10⁻¹ kg CO2 eq., 3.95 × 10⁻² kg oil eq., and 2.60 × 10⁻⁶ kg P eq., as shown in Table 8.
The individual processes involved throughout the life cycle of smart packaging (System B) are depicted in Figure 9, Figure 10 and Figure 11 for each of the three midpoint indicators, respectively. These figures provide a detailed breakdown of the contributions from the production of the conventional Tetra Pak packaging (System A), the sensor, the electrospun layer, and the use and end-of-life stage of the packaging.
In general, the indicator of “Climate Change” addresses the impact of anthropogenic emissions on the atmosphere’s radiative forcing. Greenhouse gas emissions intensify the radiative forcing, raising the earth’s temperature [36]. Rising temperatures have a significant impact on climate, leading to climate disruptions, desertification, sea level rise, and the spread of diseases. Climate change is one of the most significant environmental impacts of economic activity and one of the most difficult aspects to address due to its large scale [37,38,39,40].
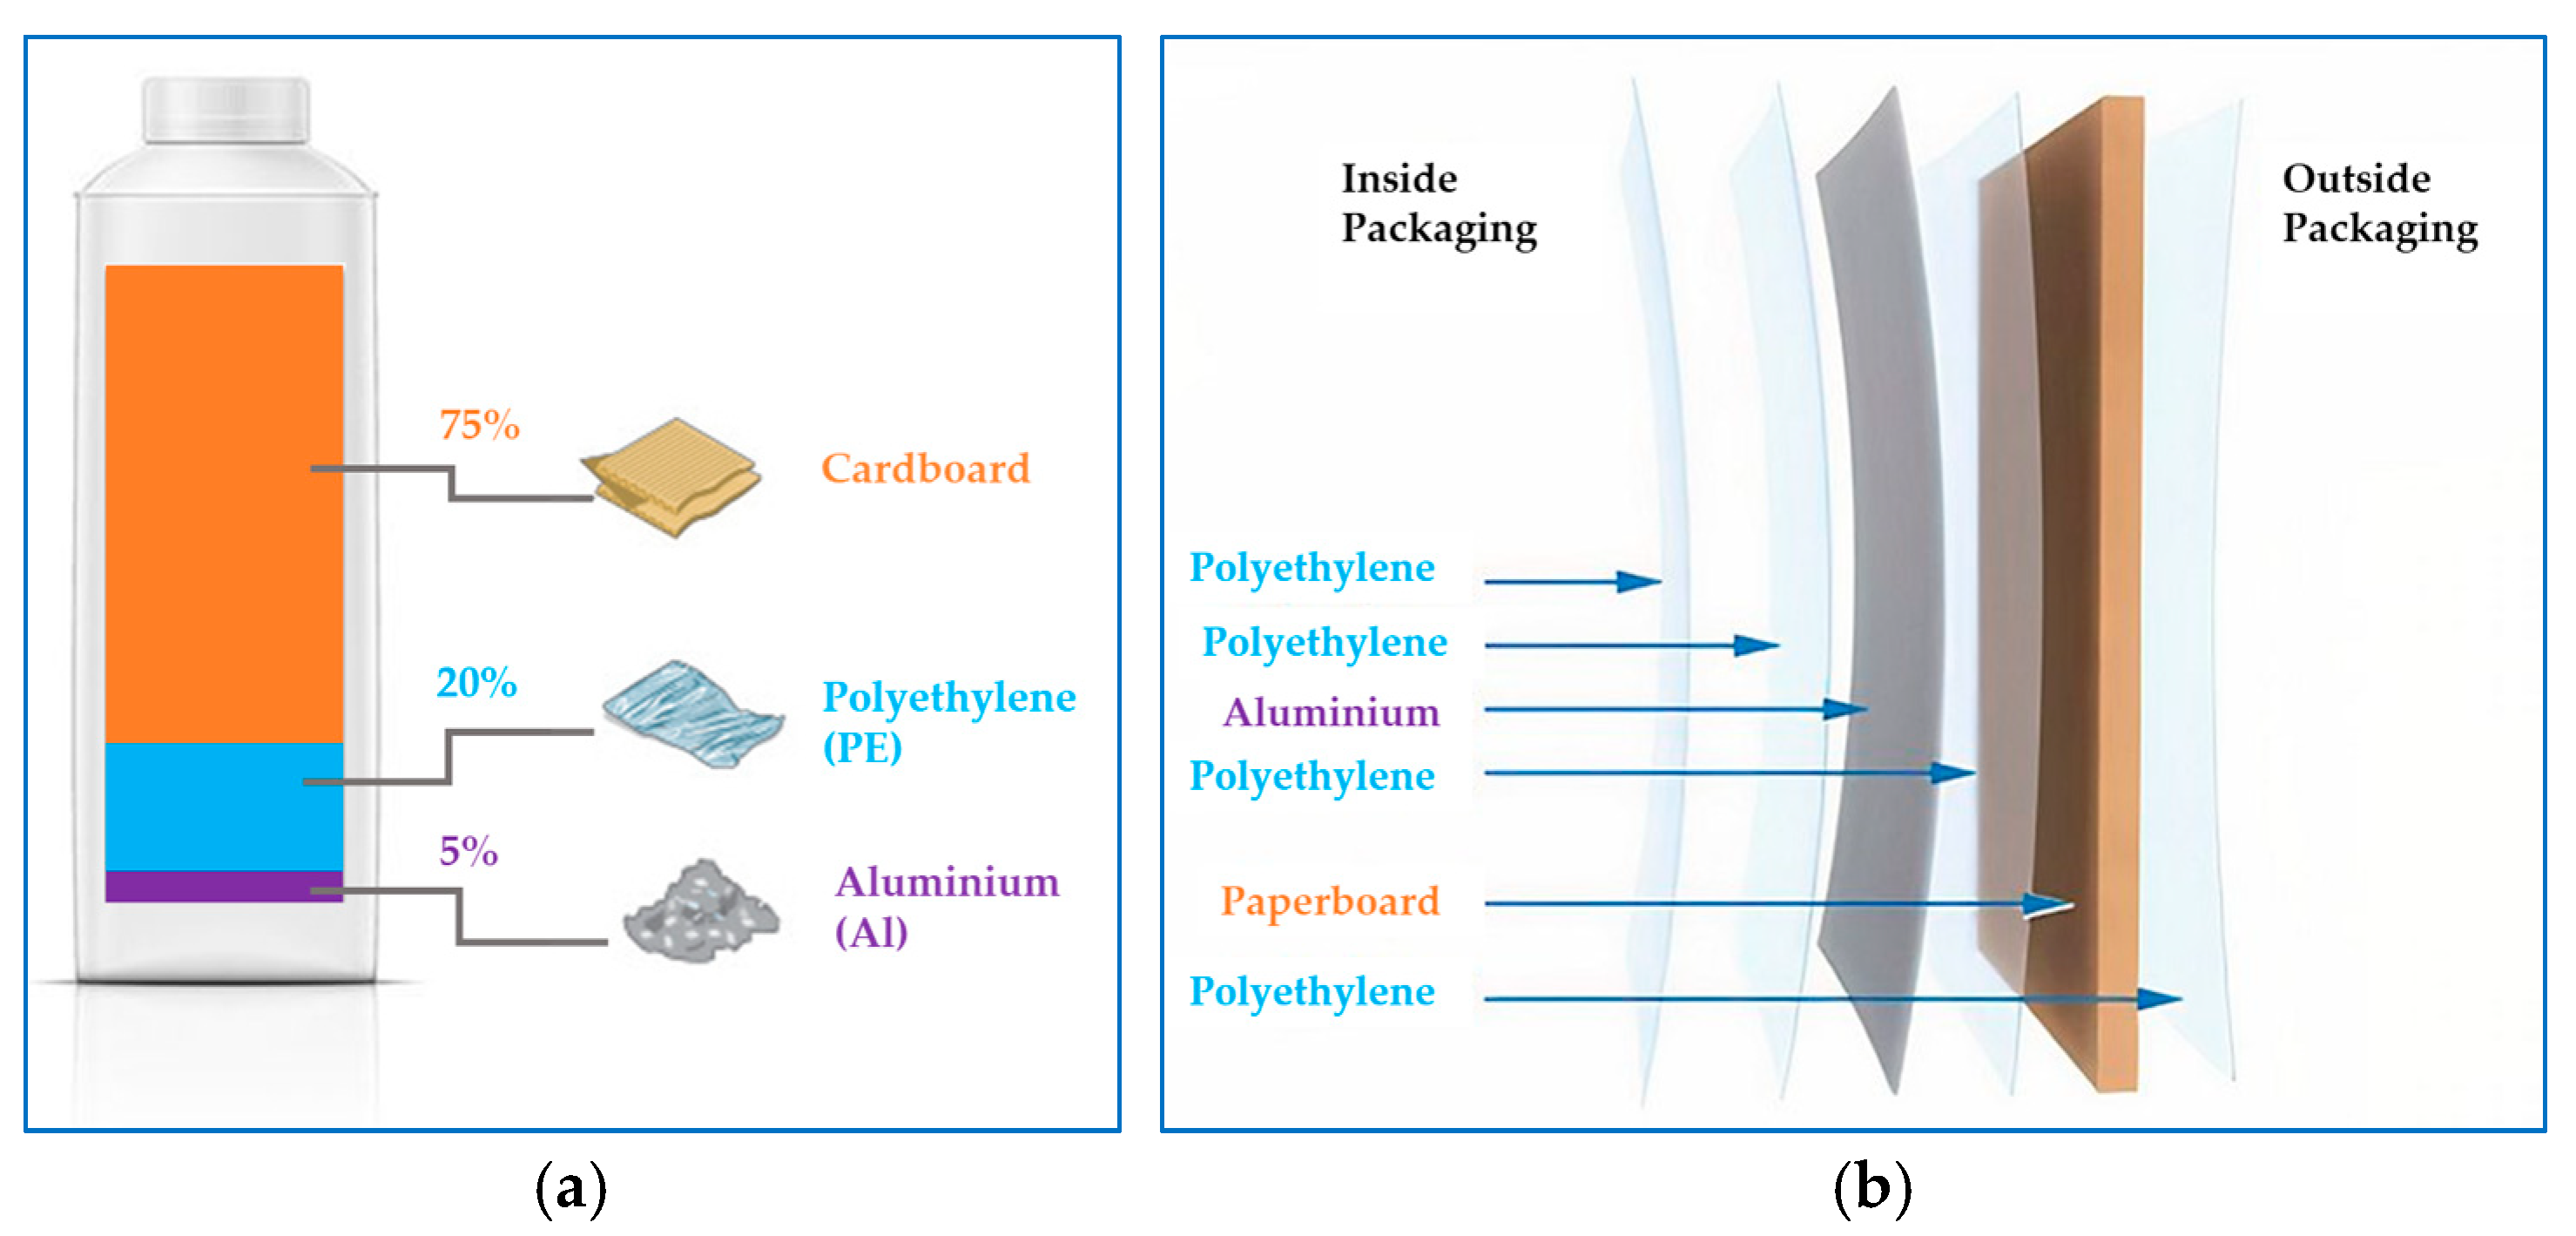
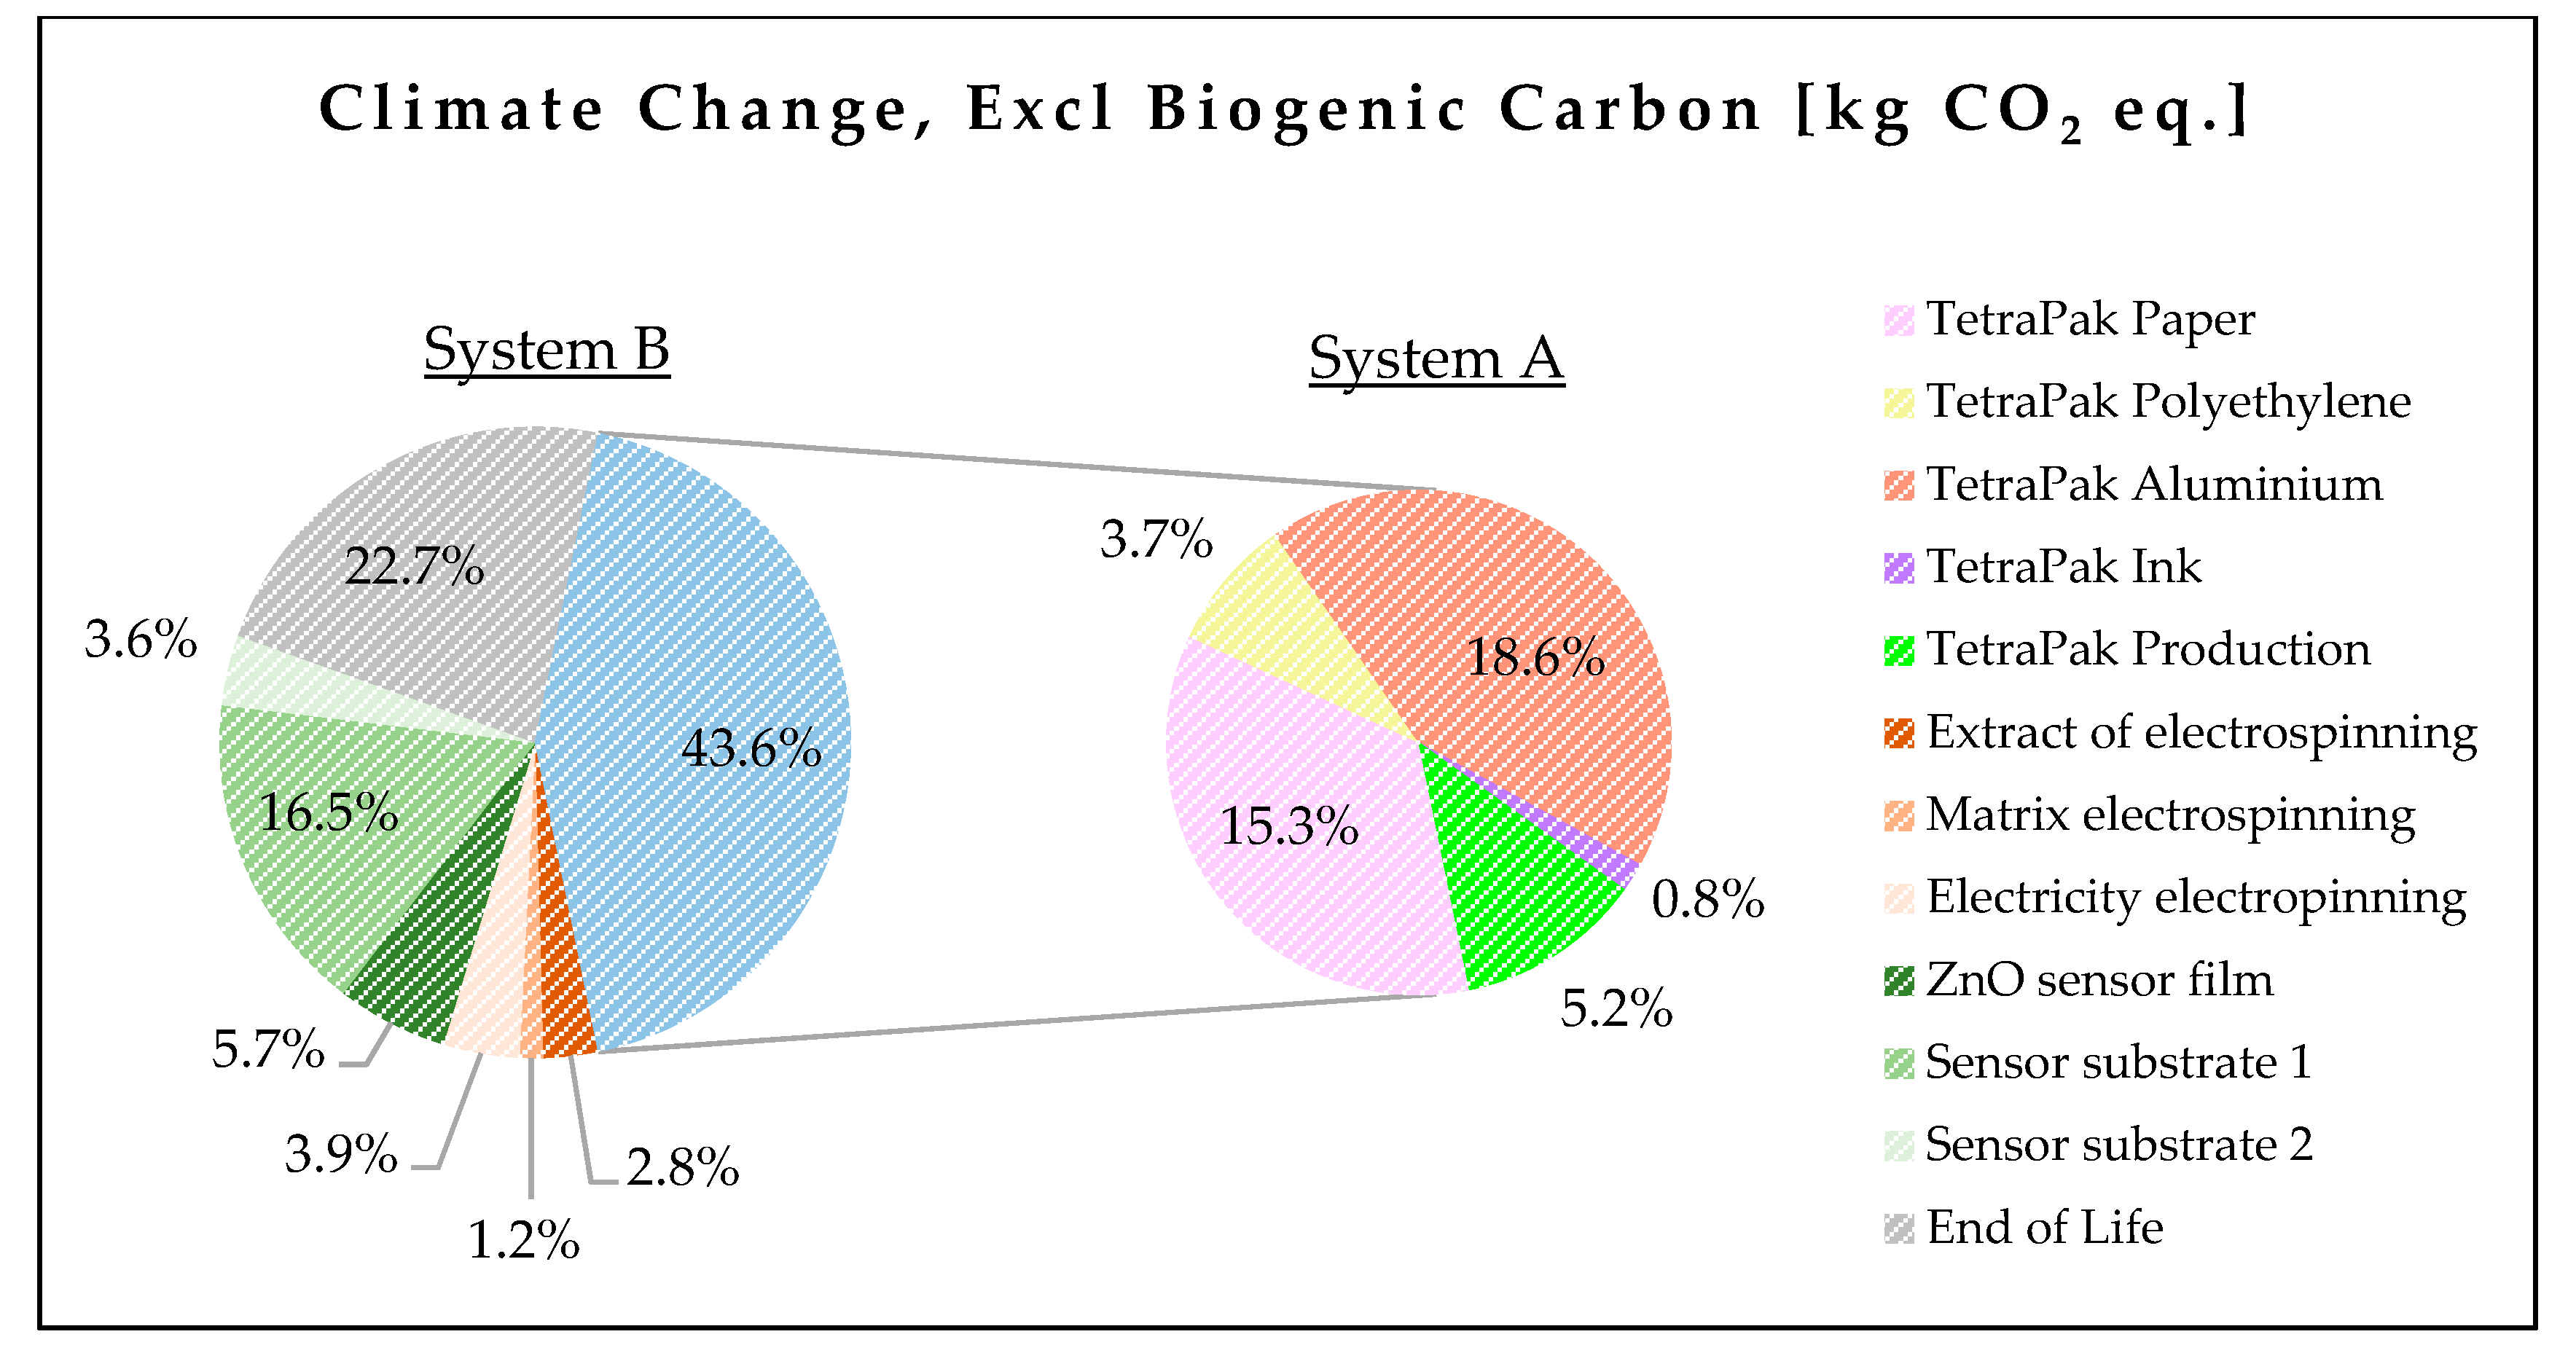
Figure 9 shows that the majority of CO2 emissions originate from the production of the conventional Tetra Pak packaging (System A) by 43.6%. Specifically, the aluminum and paper components required for this packaging have the most significant carbon footprint, 18.6% and 15.3%, respectively. As for aluminum, its production processes are energy-intensive and involve considerable resource extraction [41,42]. Regarding cardboard, the uptake of CO2 by trees harvested for its production plays a significant role. Carbon uptake is the process of conversion of CO2 to organic compounds by trees. The assimilated carbon is subsequently used to produce energy and body structures. However, in this case, the carbon uptake refers exclusively to the quantity of carbon which is stored in the product under study. This quantity can be re-emitted in the end of life either by landfilling or incineration [36].
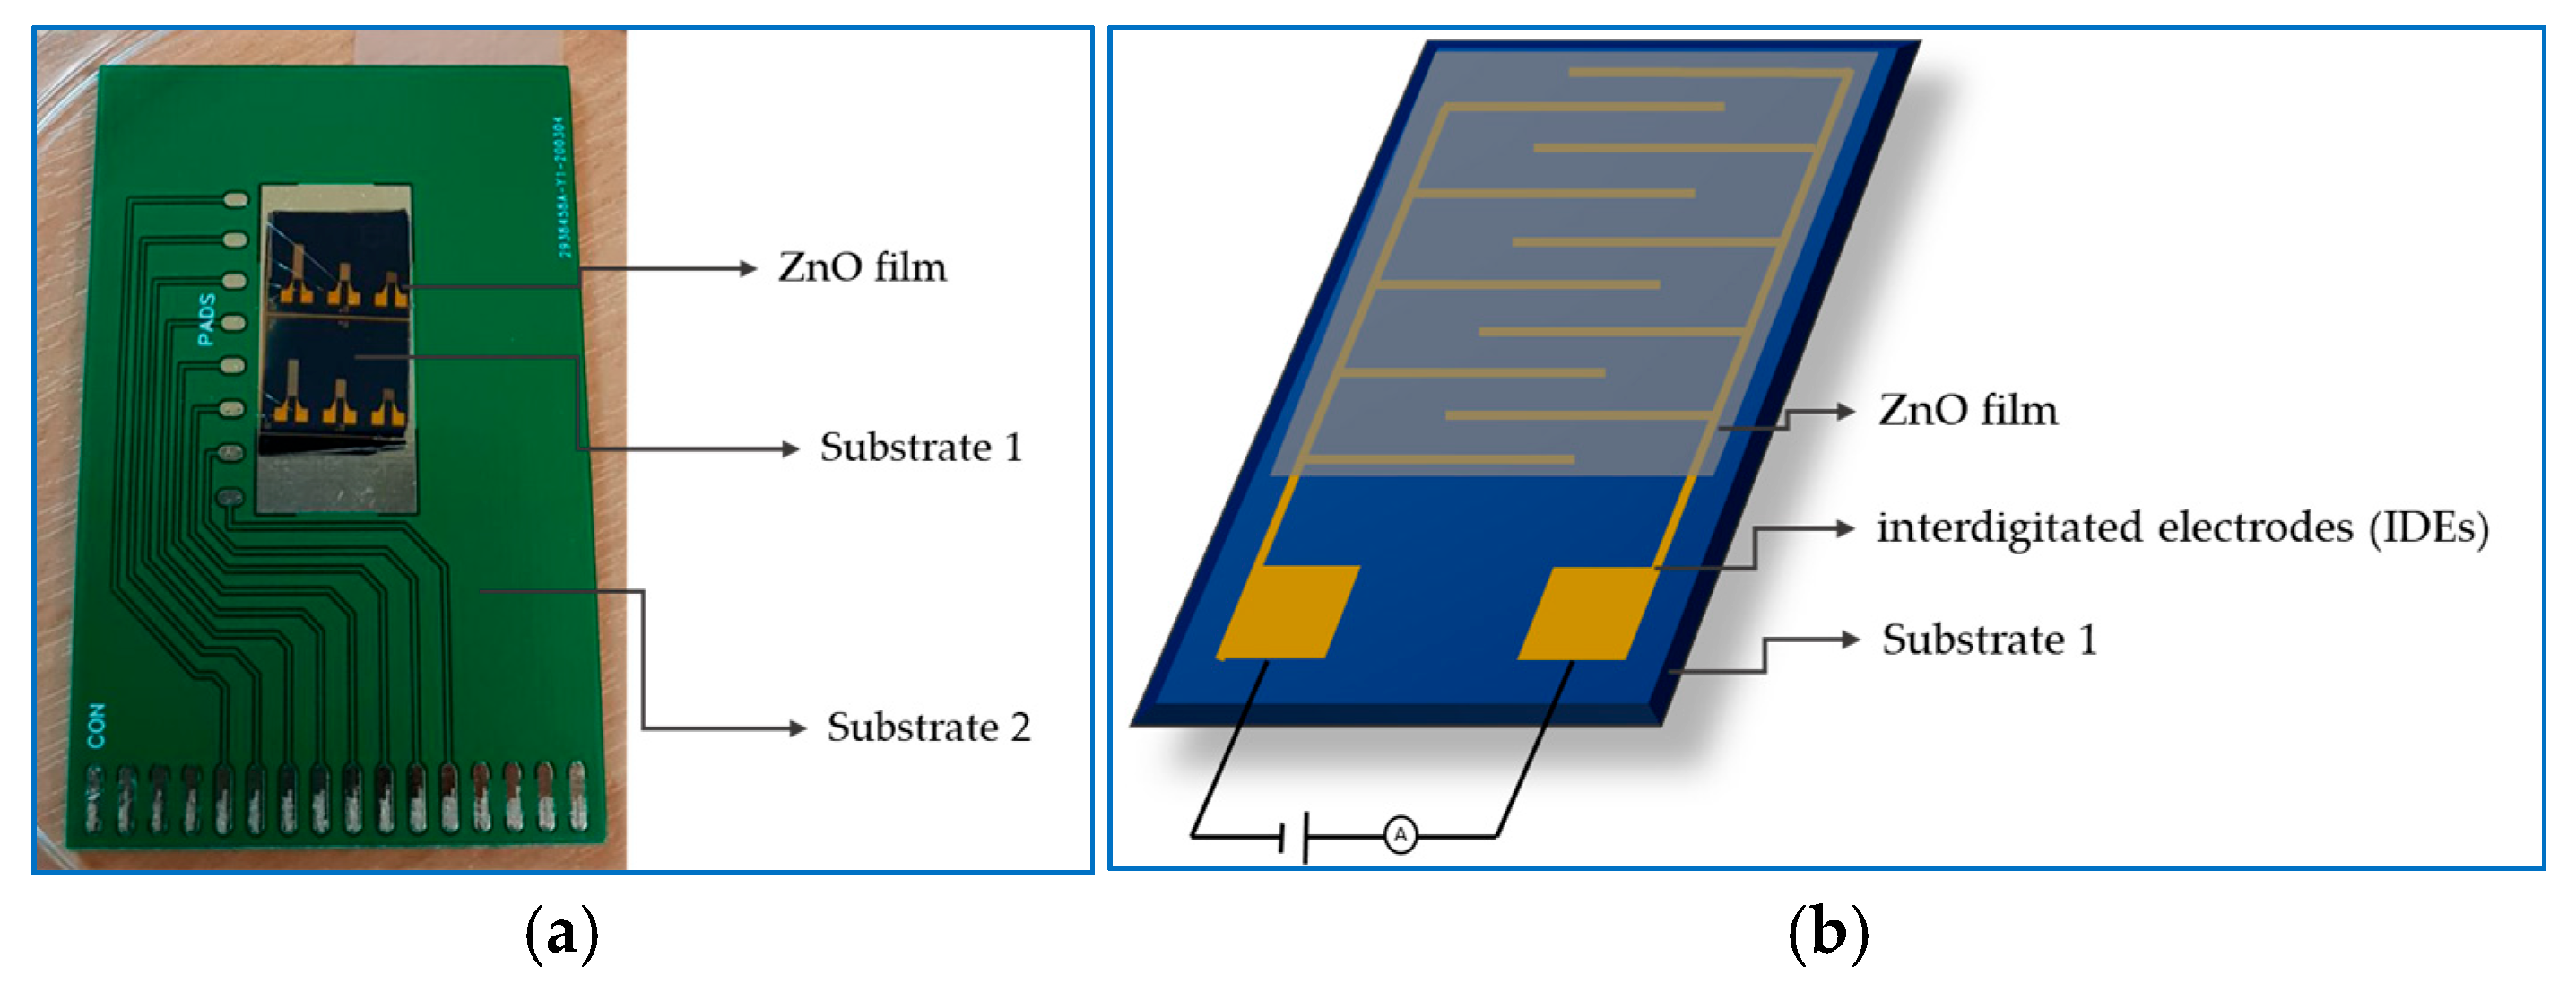
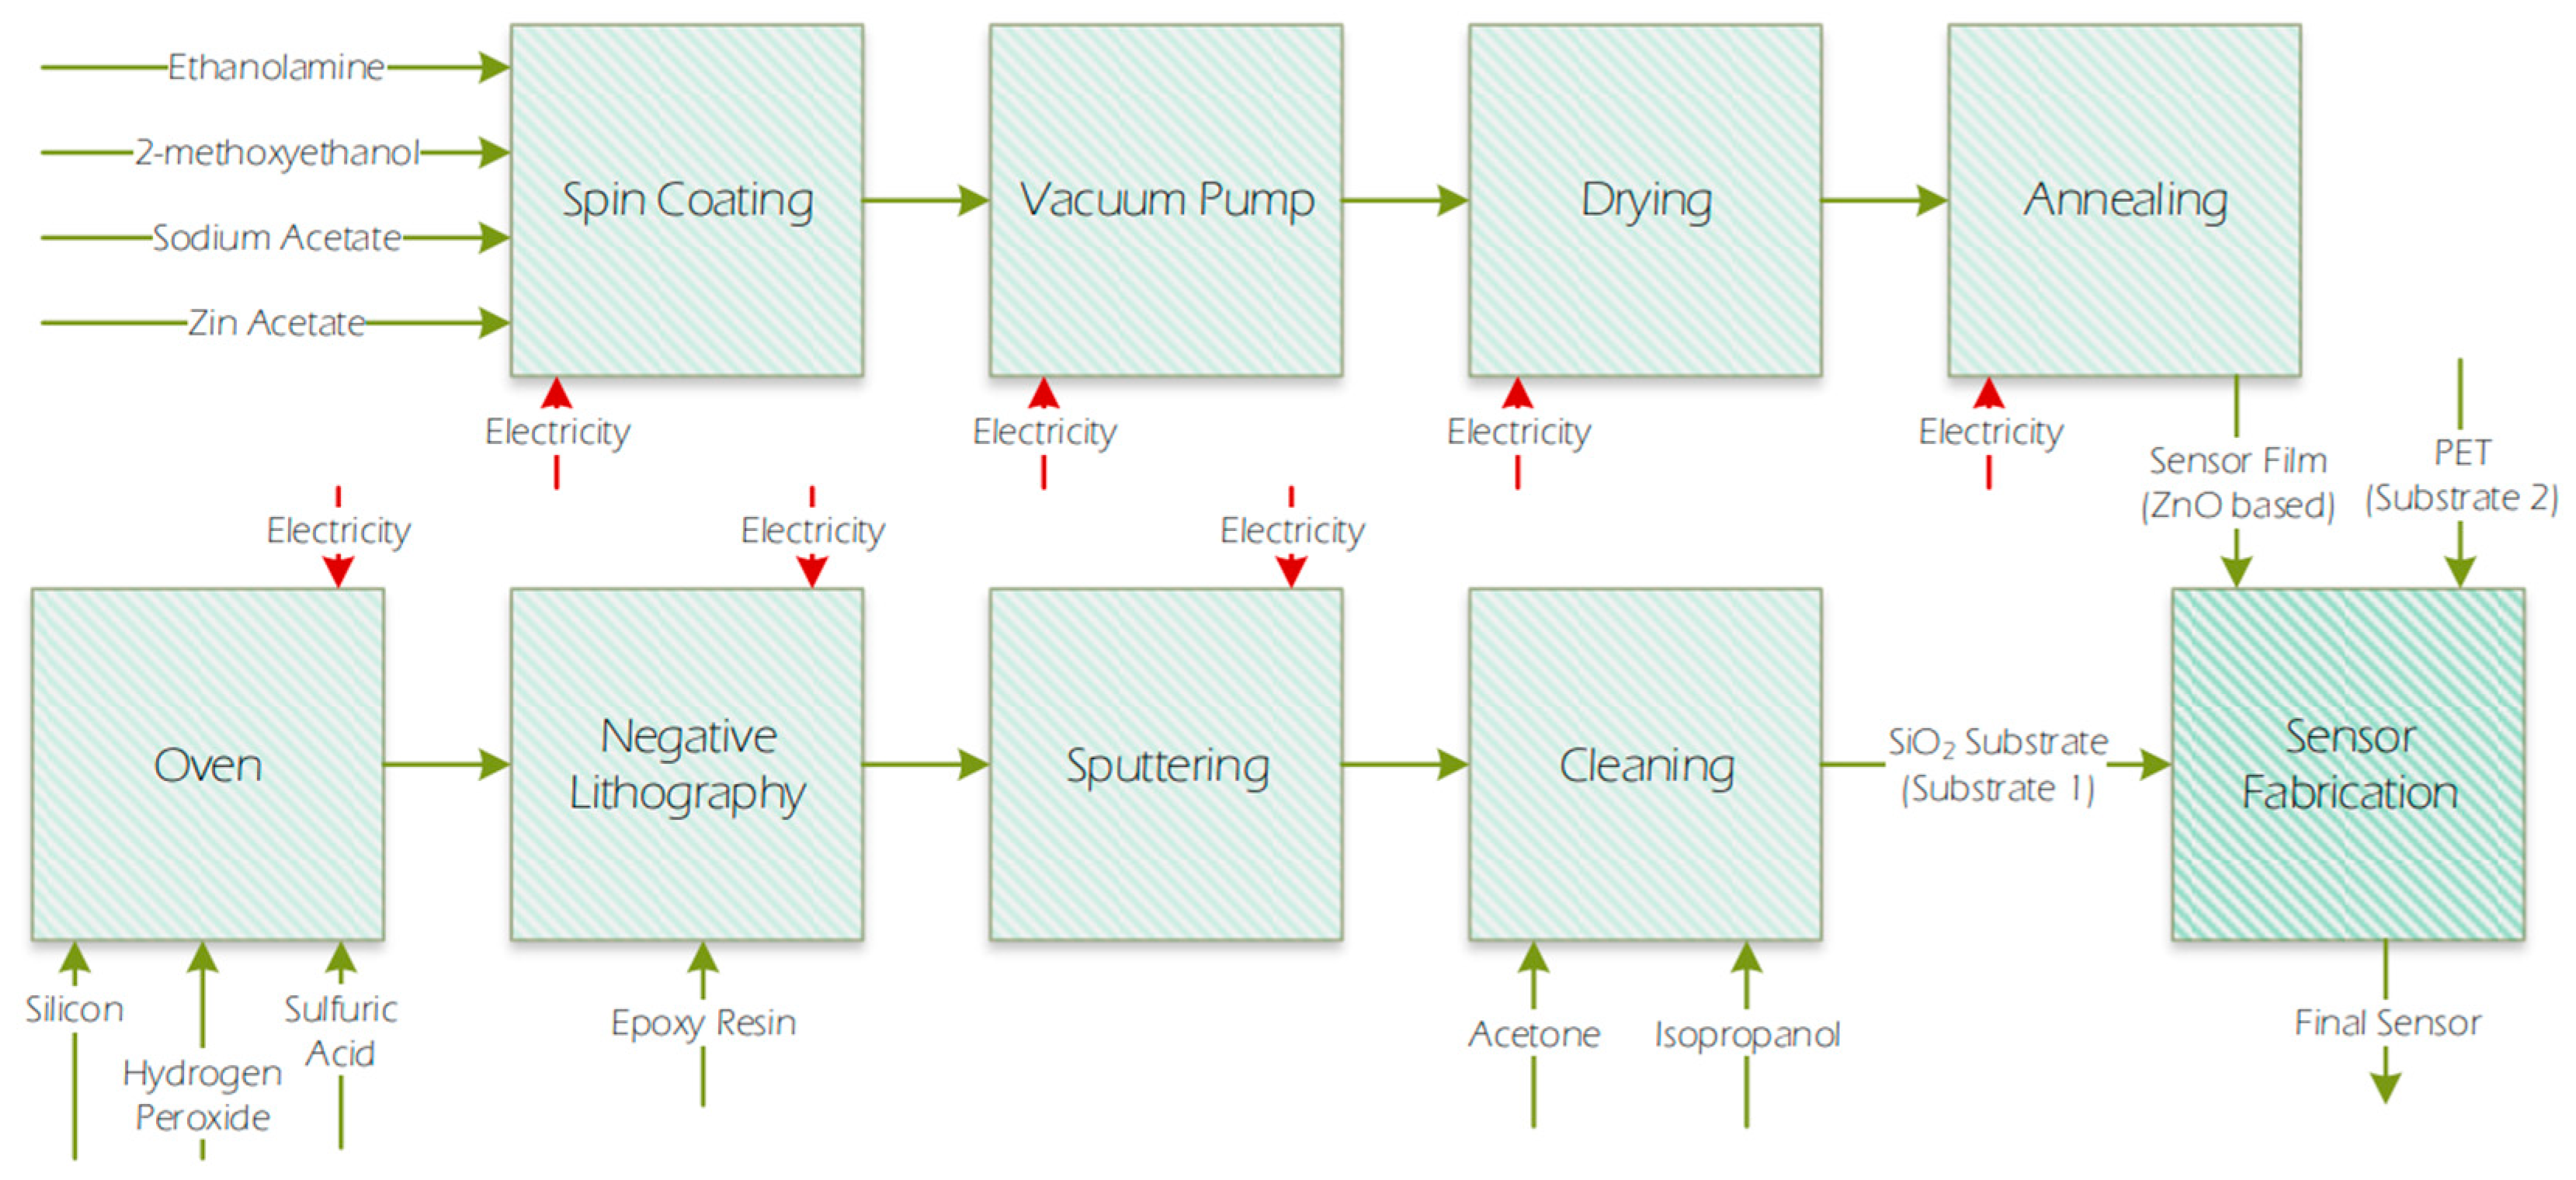
Furthermore, the production of the sensor contributes significantly to climate change impacts (25.9%), with the SiO2 substrate (Substrate 1) accounting for the largest share of emissions compared to the other two sensor components. The reason for this is the high electricity consumption during the fabrication of Substrate 1, which employs energy-intensive processes. Finally, a significant portion of the total CO2 emissions (22.7%) is also attributed to the end of life of smart packaging, which includes the waste management activities of incineration, recycling, or landfill, processes that can release additional CO2. This is due to greenhouse gas emissions during the combustion of packaging materials in municipal solid waste facilities [41], as well as during recycling [36].
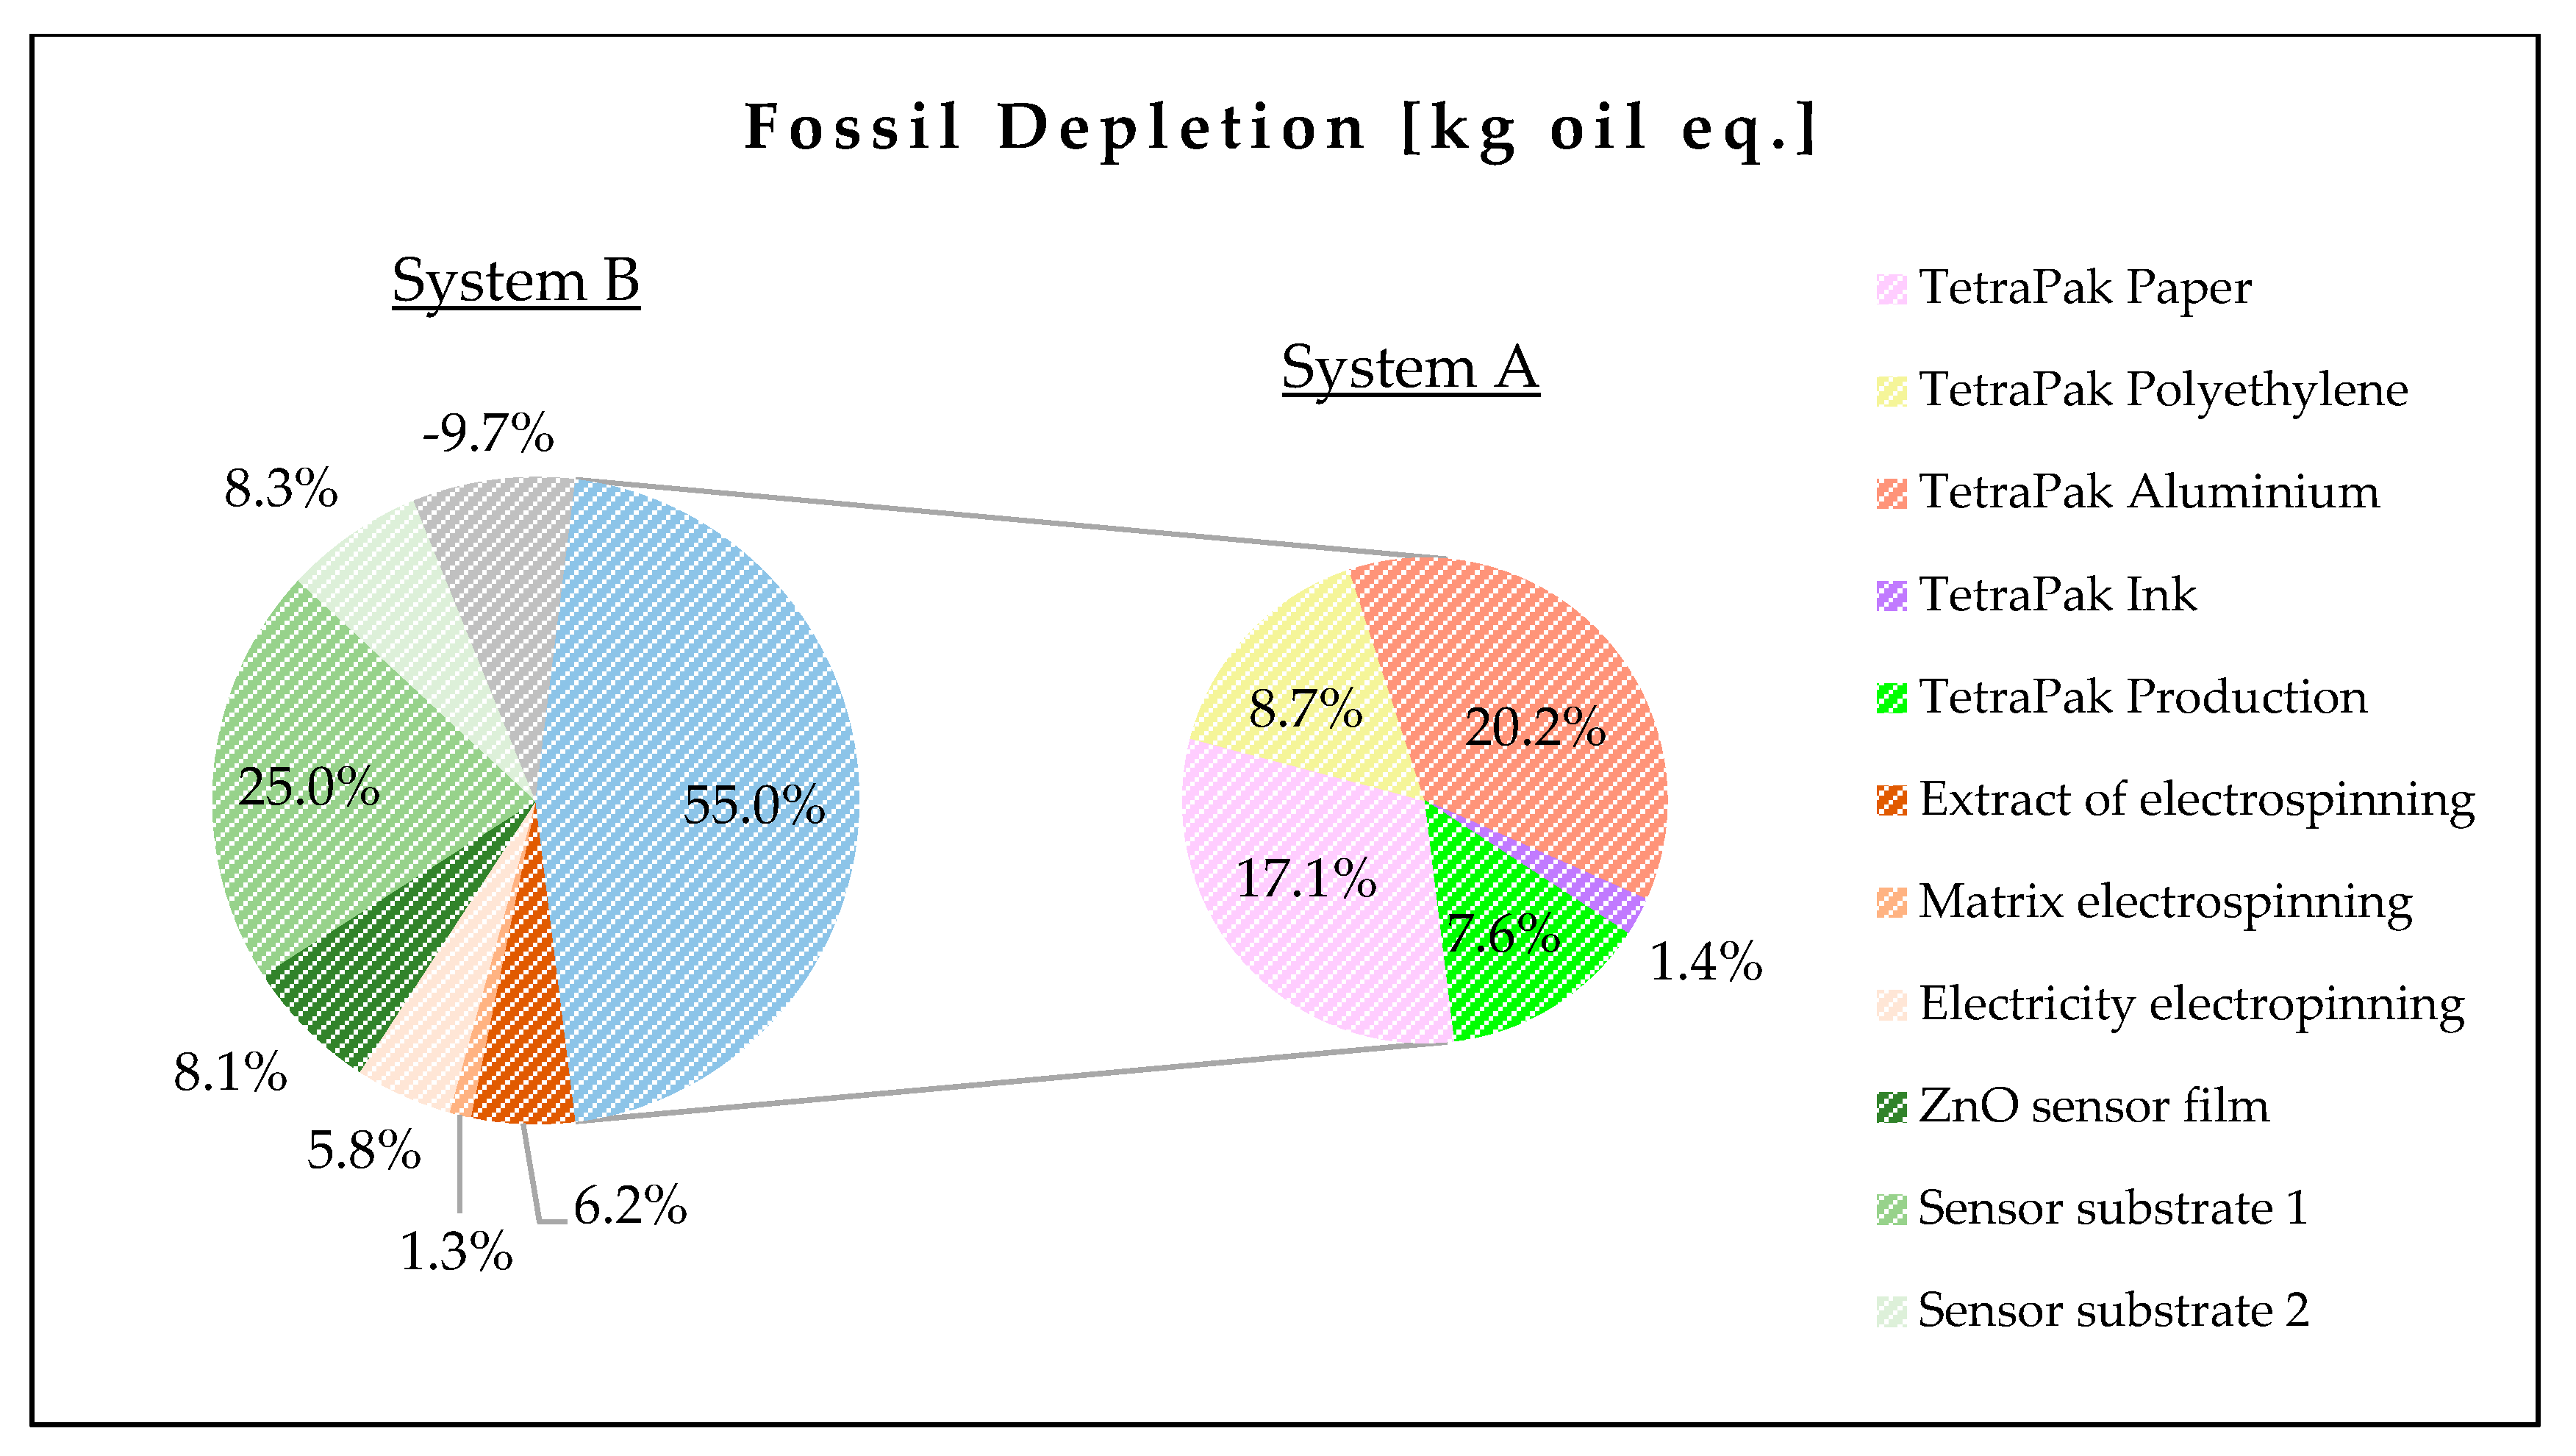
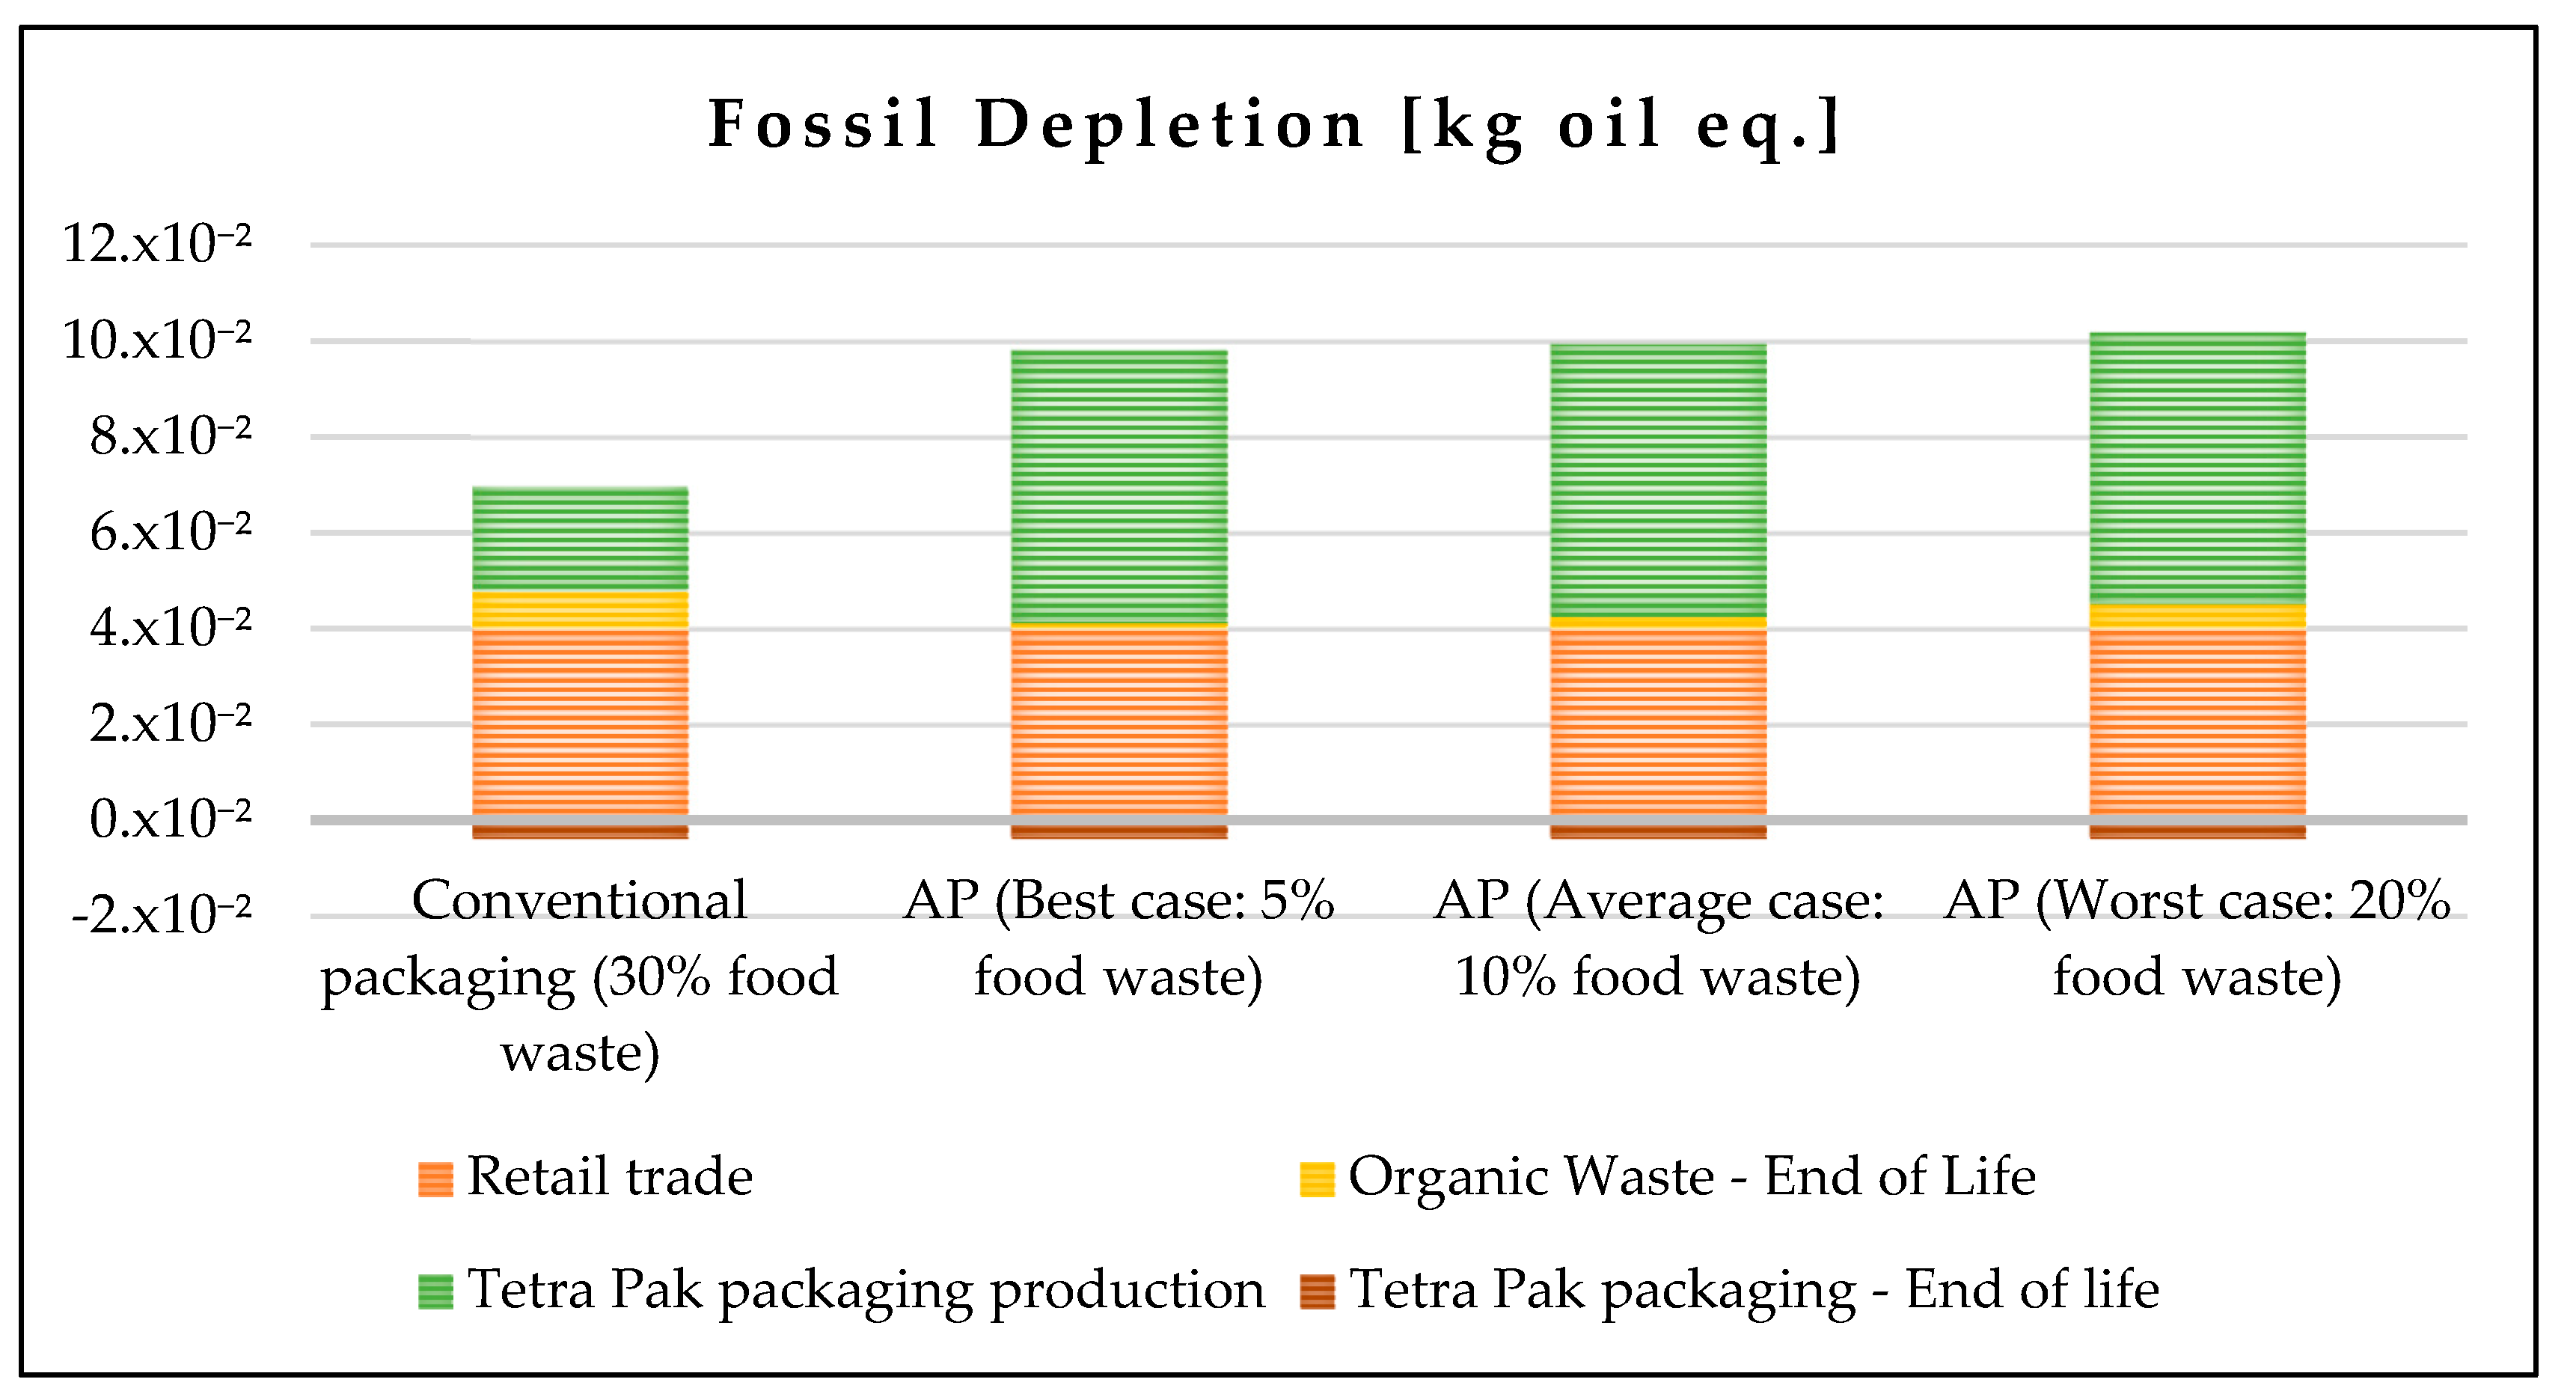
Regarding “Fossil Depletion”, this impact category refers to the consumption of non-biological resources, such as fossil fuels, and is concerned with the protection of human well-being and health, as well as the protection of ecosystems. Fossil depletion is a key indicator of resource sustainability and highlights the dependency on non-renewable resources [37,38,39,40]. Here, the production of the conventional Tetra Pak packaging accounts for the majority of the burden (54.8%), with paper and aluminum being the primary contributors, whereas the polyethylene contribution is lower. This fact may be attributed to the bauxite mining and refining during the primary production of aluminum, processes that require high fuel use. Similarly to the “Climate Change” indicator, the sensor also plays a significant role in fossil resource depletion, with the SiO2 substrate (Substrate 1) being the largest contributor among its components (25.0%). This is likely again due to the high consumption of energy during its fabrication processes, and especially sputtering and negative lithography. The generation of energy is based on fossil fuels (coal, gas, oil) leading to an indirect burden on this impact indicator. Additionally, the electrospun layer appears to have a minimal burden overall. However, within this process, electricity usage during electrospinning and the extract utilized are the main contributors. Interestingly, the end-of-life stage not only avoids contributing to fossil depletion but also has a positive effect by reducing this environmental indicator. This could be attributed to recovery or recycling processes that offset some of the resource consumption.
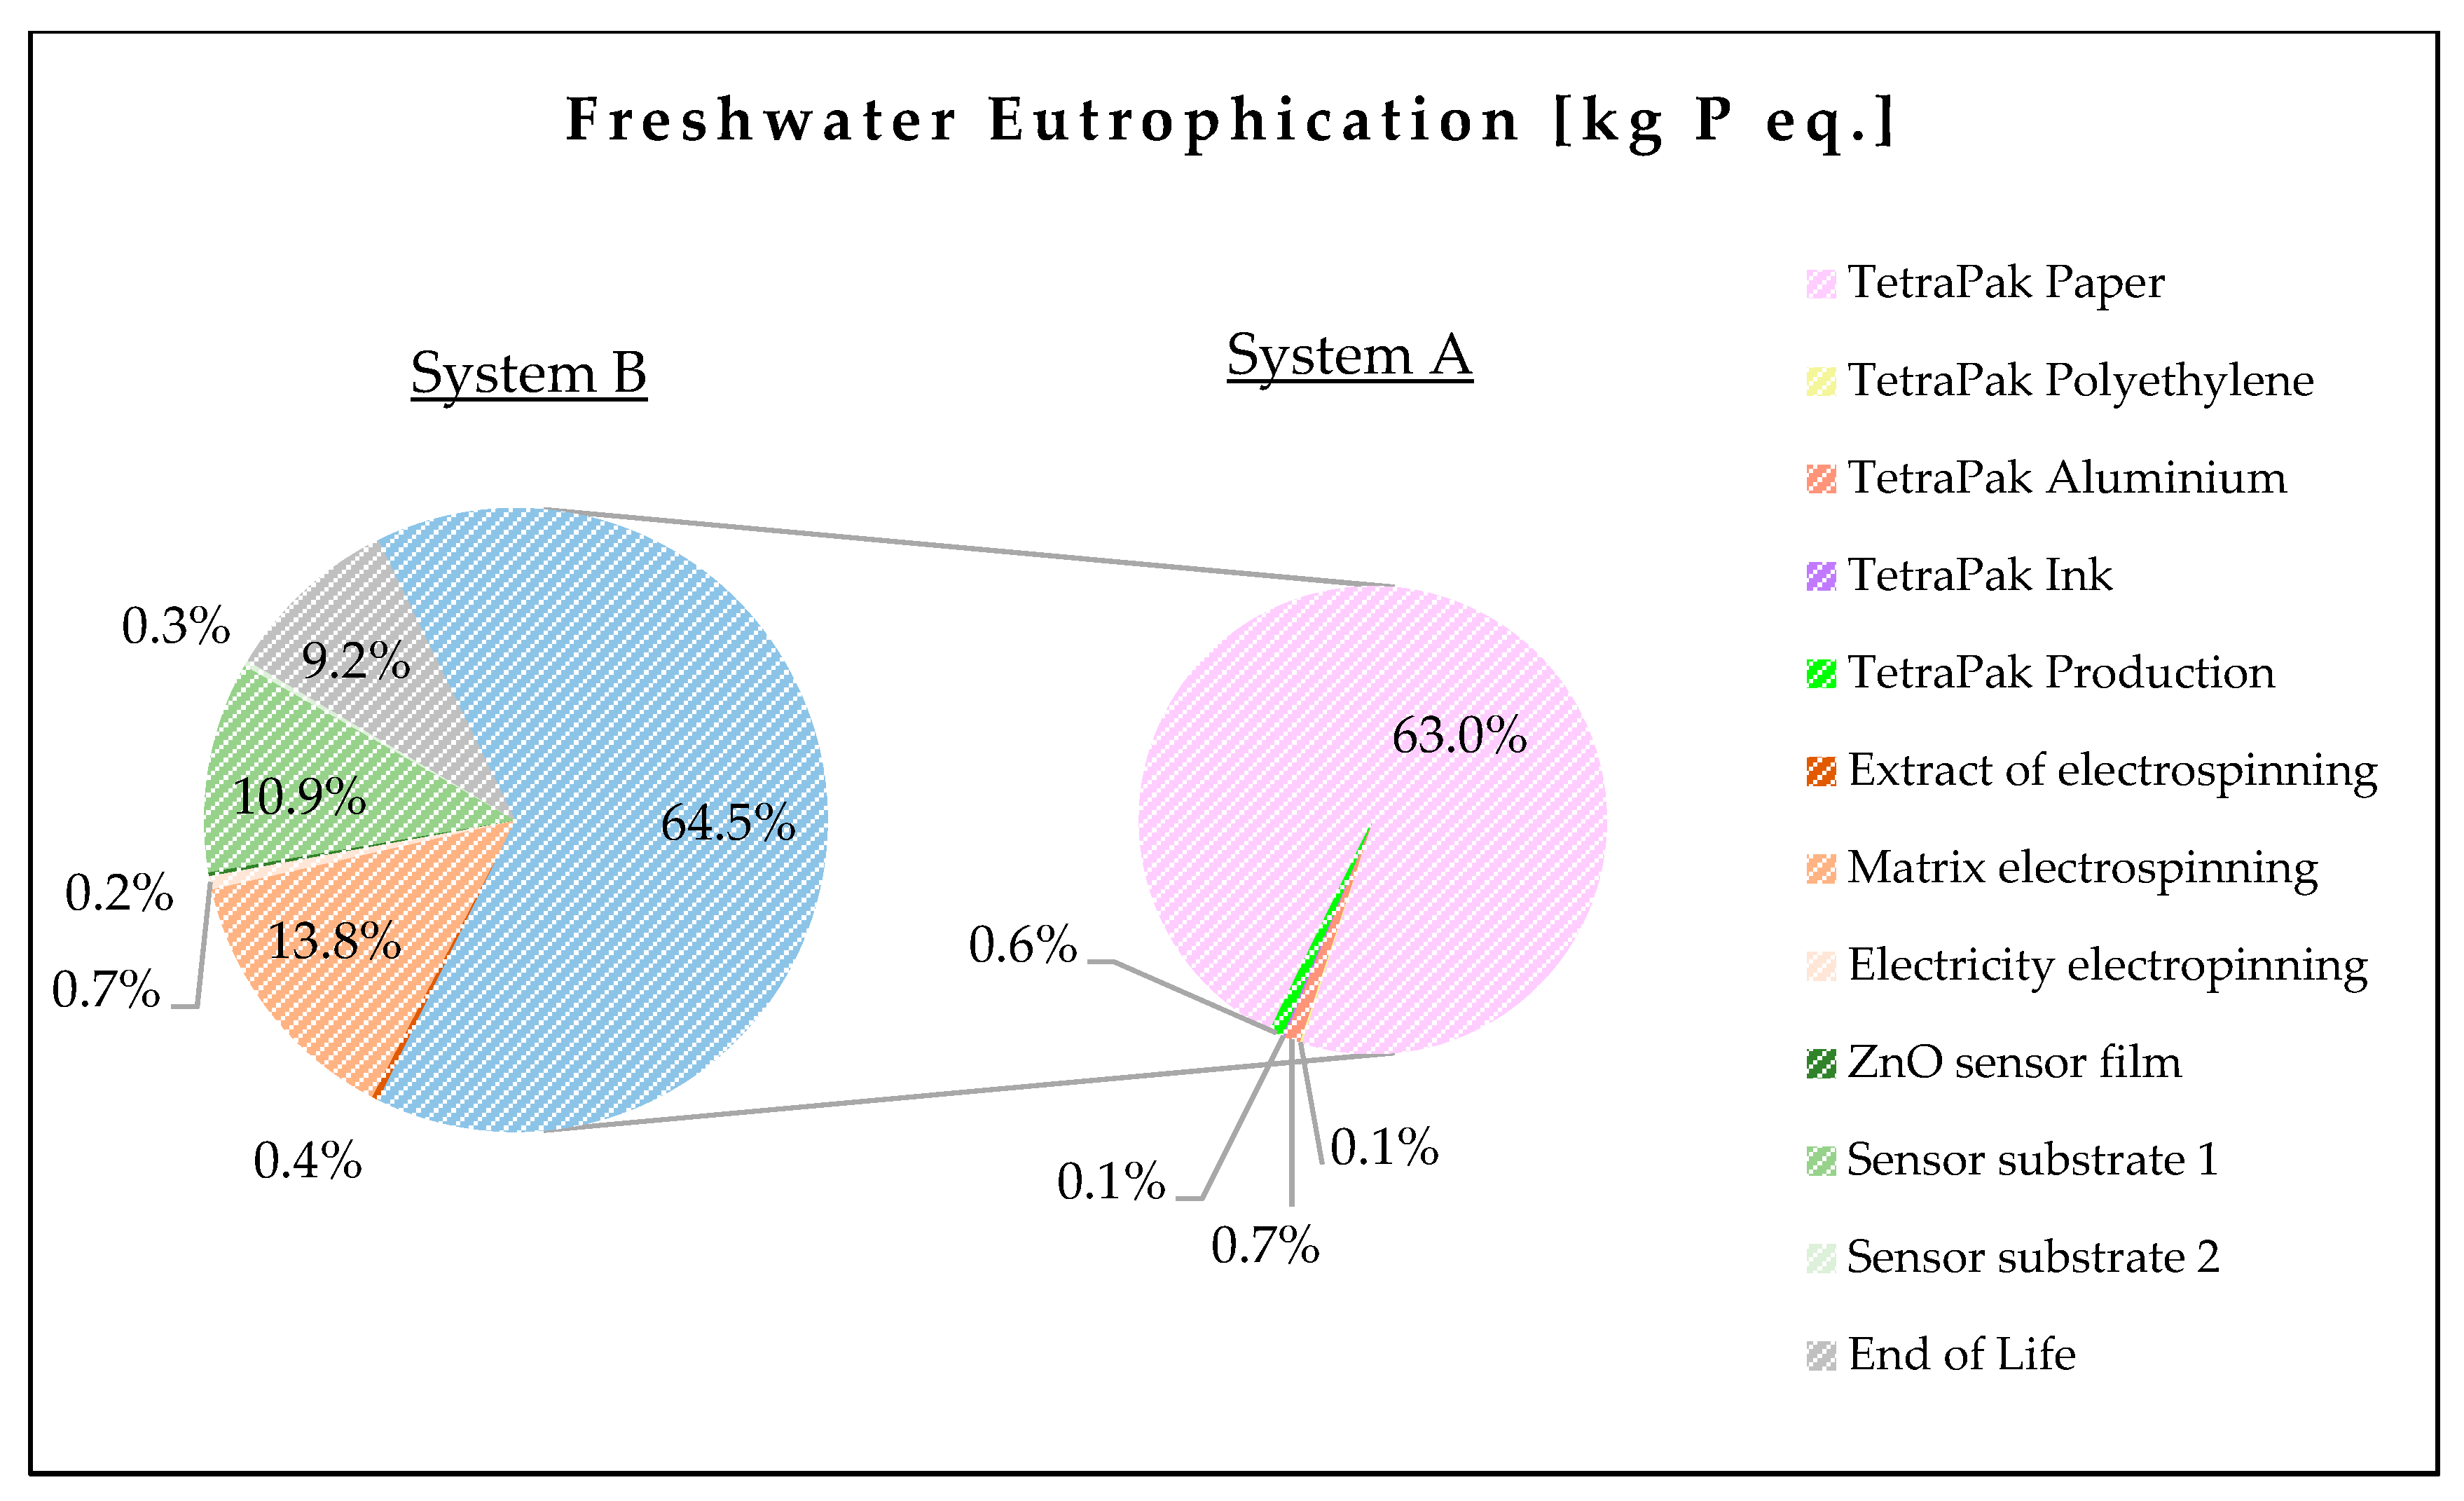
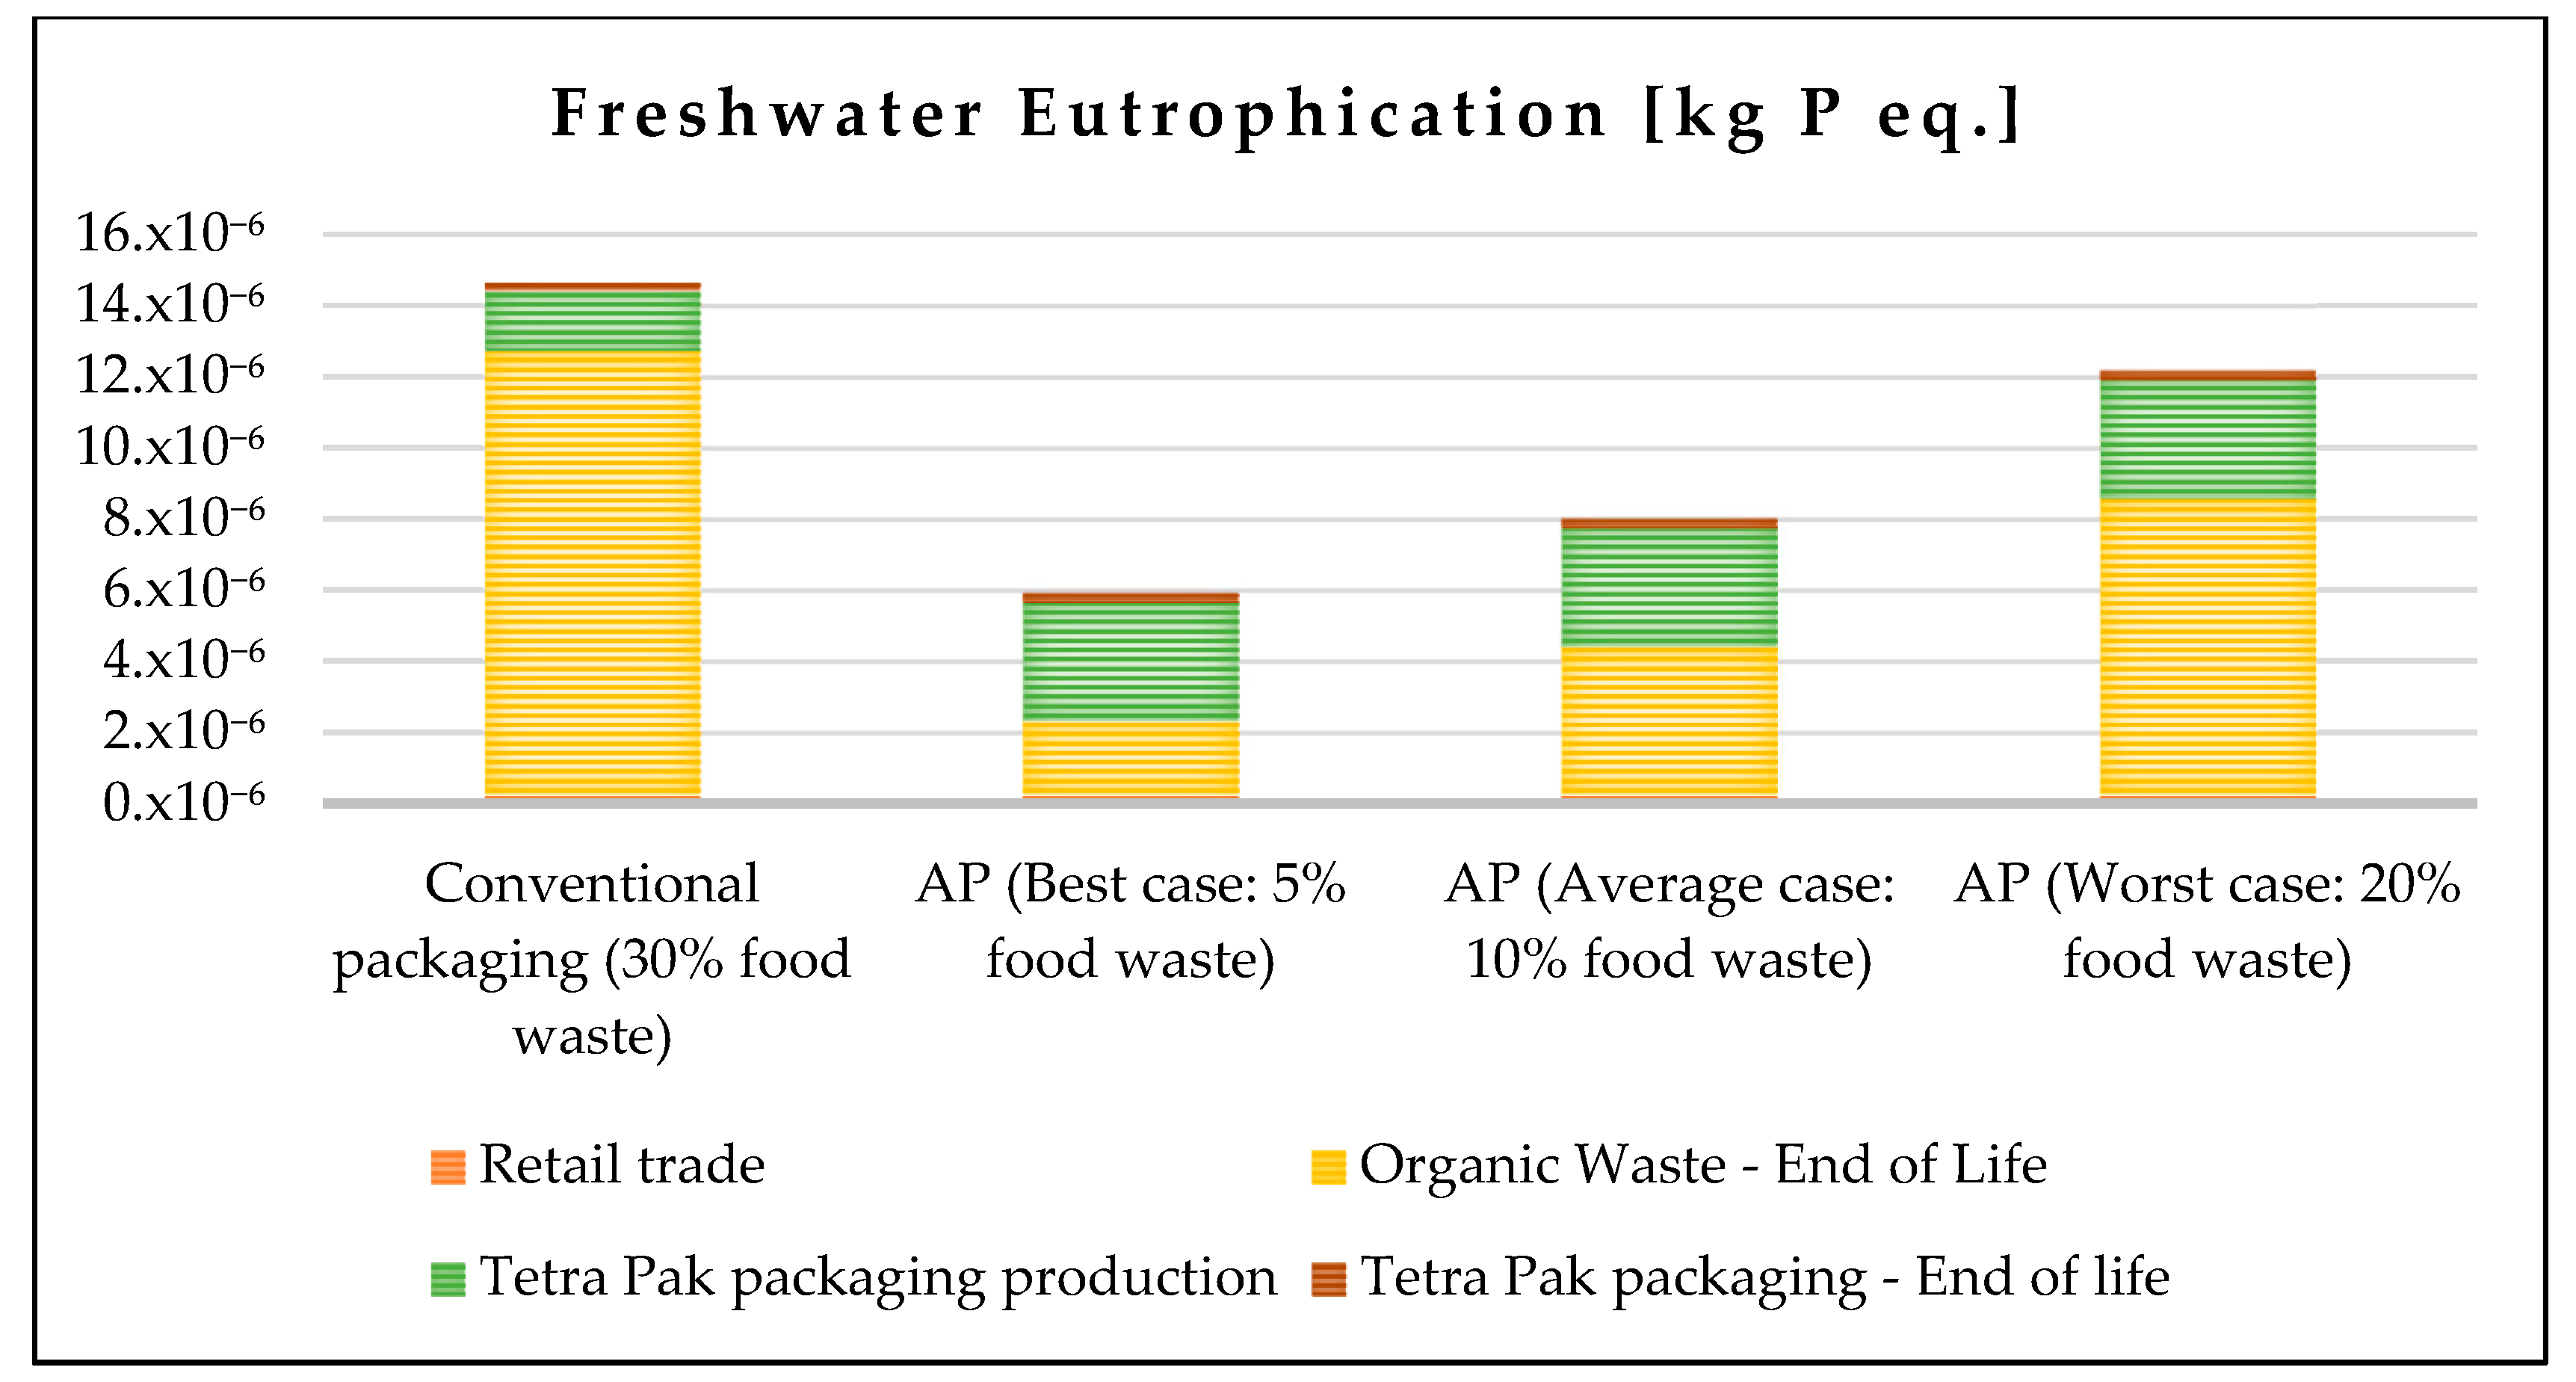
The impact indicator of “Freshwater Eutrophication” includes all the impacts resulting from increased nutrient emissions into the aquatic environment. The accumulation of chemical nutrients in aquatic ecosystems leads to excessive and abnormal growth of plants and algae, which causes low dissolved oxygen, serious declines in animal populations and deterioration of water quality levels. Phosphorus emissions into water have an impact on eutrophication, which is why the indicator is expressed as kg phosphorus equivalent [37,38,39,40,43]. This impact indicator was selected for further discussion as it not only represents an important impact category but also has interesting findings. As can be seen in Figure 10, the paper used in the production of the conventional Tetra Pak packaging is the primary contributor. It significantly impacts both the conventional Tetra Pak packaging (System A) and smart packaging (System B), accounting for nearly two thirds of the total burden. The production of paper contributes organic compounds into the surface water resulting in excessive oxygen-consuming reactions and oxygen deficiency in the water [36].
Beyond this, other contributors include the matrix used for the development of the electrospun layer (active layer), the SiO2 substrate (Substrate 1), and the end-of-life processes. These activities have a lower but significant burden in “Freshwater Eutrophication”. In contrast, the remaining processes have a negligible contribution, highlighting the dominance of the paper production in the total impact analysis.
As expected, the first Section of the LCIA, which included exclusively the production and the end of life of the two packaging systems demonstrated that the incorporation of additional factors, namely the active and the intelligent layers, in a conventional packaging burdens the environmental performance. However, the notable benefits of the innovative smart packaging are observed during its use stage, as well as during the end-of-life stage of the food product contained, as smart Tetra Pak decreases the generation of food waste. Therefore, the next Section takes into account the phases of use and end of life of packaging and the food contained and explores how they affect the total environmental performance.

3.2. Discussion (Interpretation)

Table 9 presents the comparative environmental footprints across all the ReCiPe midpoint indicators that include the production of Tetra Pak packaging, whether conventional or smart, along with the retail trade and end-of-life stage of the packaging and the organic waste. For the sensitivity analysis and the better comparison of the environmental impacts of the two types of packaging, three scenarios were examined for smart packaging: a best-case scenario, S1, with 5% food waste, an average-case scenario, S2, with 10% food waste and a worst-case scenario, S3, with 20% food waste. For the conventional packaging scenario, food waste was assumed to be 30% (baseline scenario, S0). The scenarios are based on the ability of smart packaging to slow microbial spoilage by controlling the release of antioxidant agents from the extract, thereby extending the shelf life of the packaged food. The additional shelf life allows for a decrease in the waste of food contained in smart packaging compared to that contained in conventional packaging. In Table 9, the rate of change in the environmental footprint of smart packaging compared to conventional packaging is also presented. Negative percentages indicate that smart packaging has a lower impact, whereas positive percentages indicate a higher impact.
In the best-case scenario, smart packaging exhibits negative rates in 13 out of 18 impact categories, highlighting its environmental benefits compared to conventional packaging. In the other seven categories, its highest rates appear in the categories of “Ionizing Radiation” and “Terrestrial Ecotoxicity”. The high environmental burden of smart packaging on these two impact indicators was also observed in Section 3.1. This means that the benefit of lower food waste from smart packaging does not compensate for its high production footprint in these impact categories.
In general, “Ionizing Radiation” is linked with the release of radionuclides during human activities related to either the nuclear fuel cycle (mining, processing, and waste disposal) or more conventional energy generation, such as coal combustion [37]. On the other hand, Terrestrial Ecotoxicity” examines the effects of toxic substances on the terrestrial ecosystems. This high burden of smart packaging is mainly attributed to the raw material of the CO2 sensing layer, zinc. Zinc is shown to be harmful to terrestrial organisms [44] and is reported that the environmental compartment of zinc emission is the soil [45].
In the average-case scenario, smart packaging has a lower environmental impact (negative percentages) across nine categories, a comparable performance in five categories (with percentage variations between 0 and 5%), and higher impact in the two categories of “Ionizing Radiation” and “Terrestrial Ecotoxicity”. Finally, under the worst-case scenario, smart packaging shows lower environmental burden in seven categories, remains nearly the same in two categories (0–5%) and has a greater impact in nine categories. Overall, smart packaging outperforms conventional packaging in terms of environmental performance across multiple impact categories, particularly in “Climate Change”, which the Federal Environment Agency classifies as having “very high” environmental significance [46]. The total performance in climate change is analytically shown in
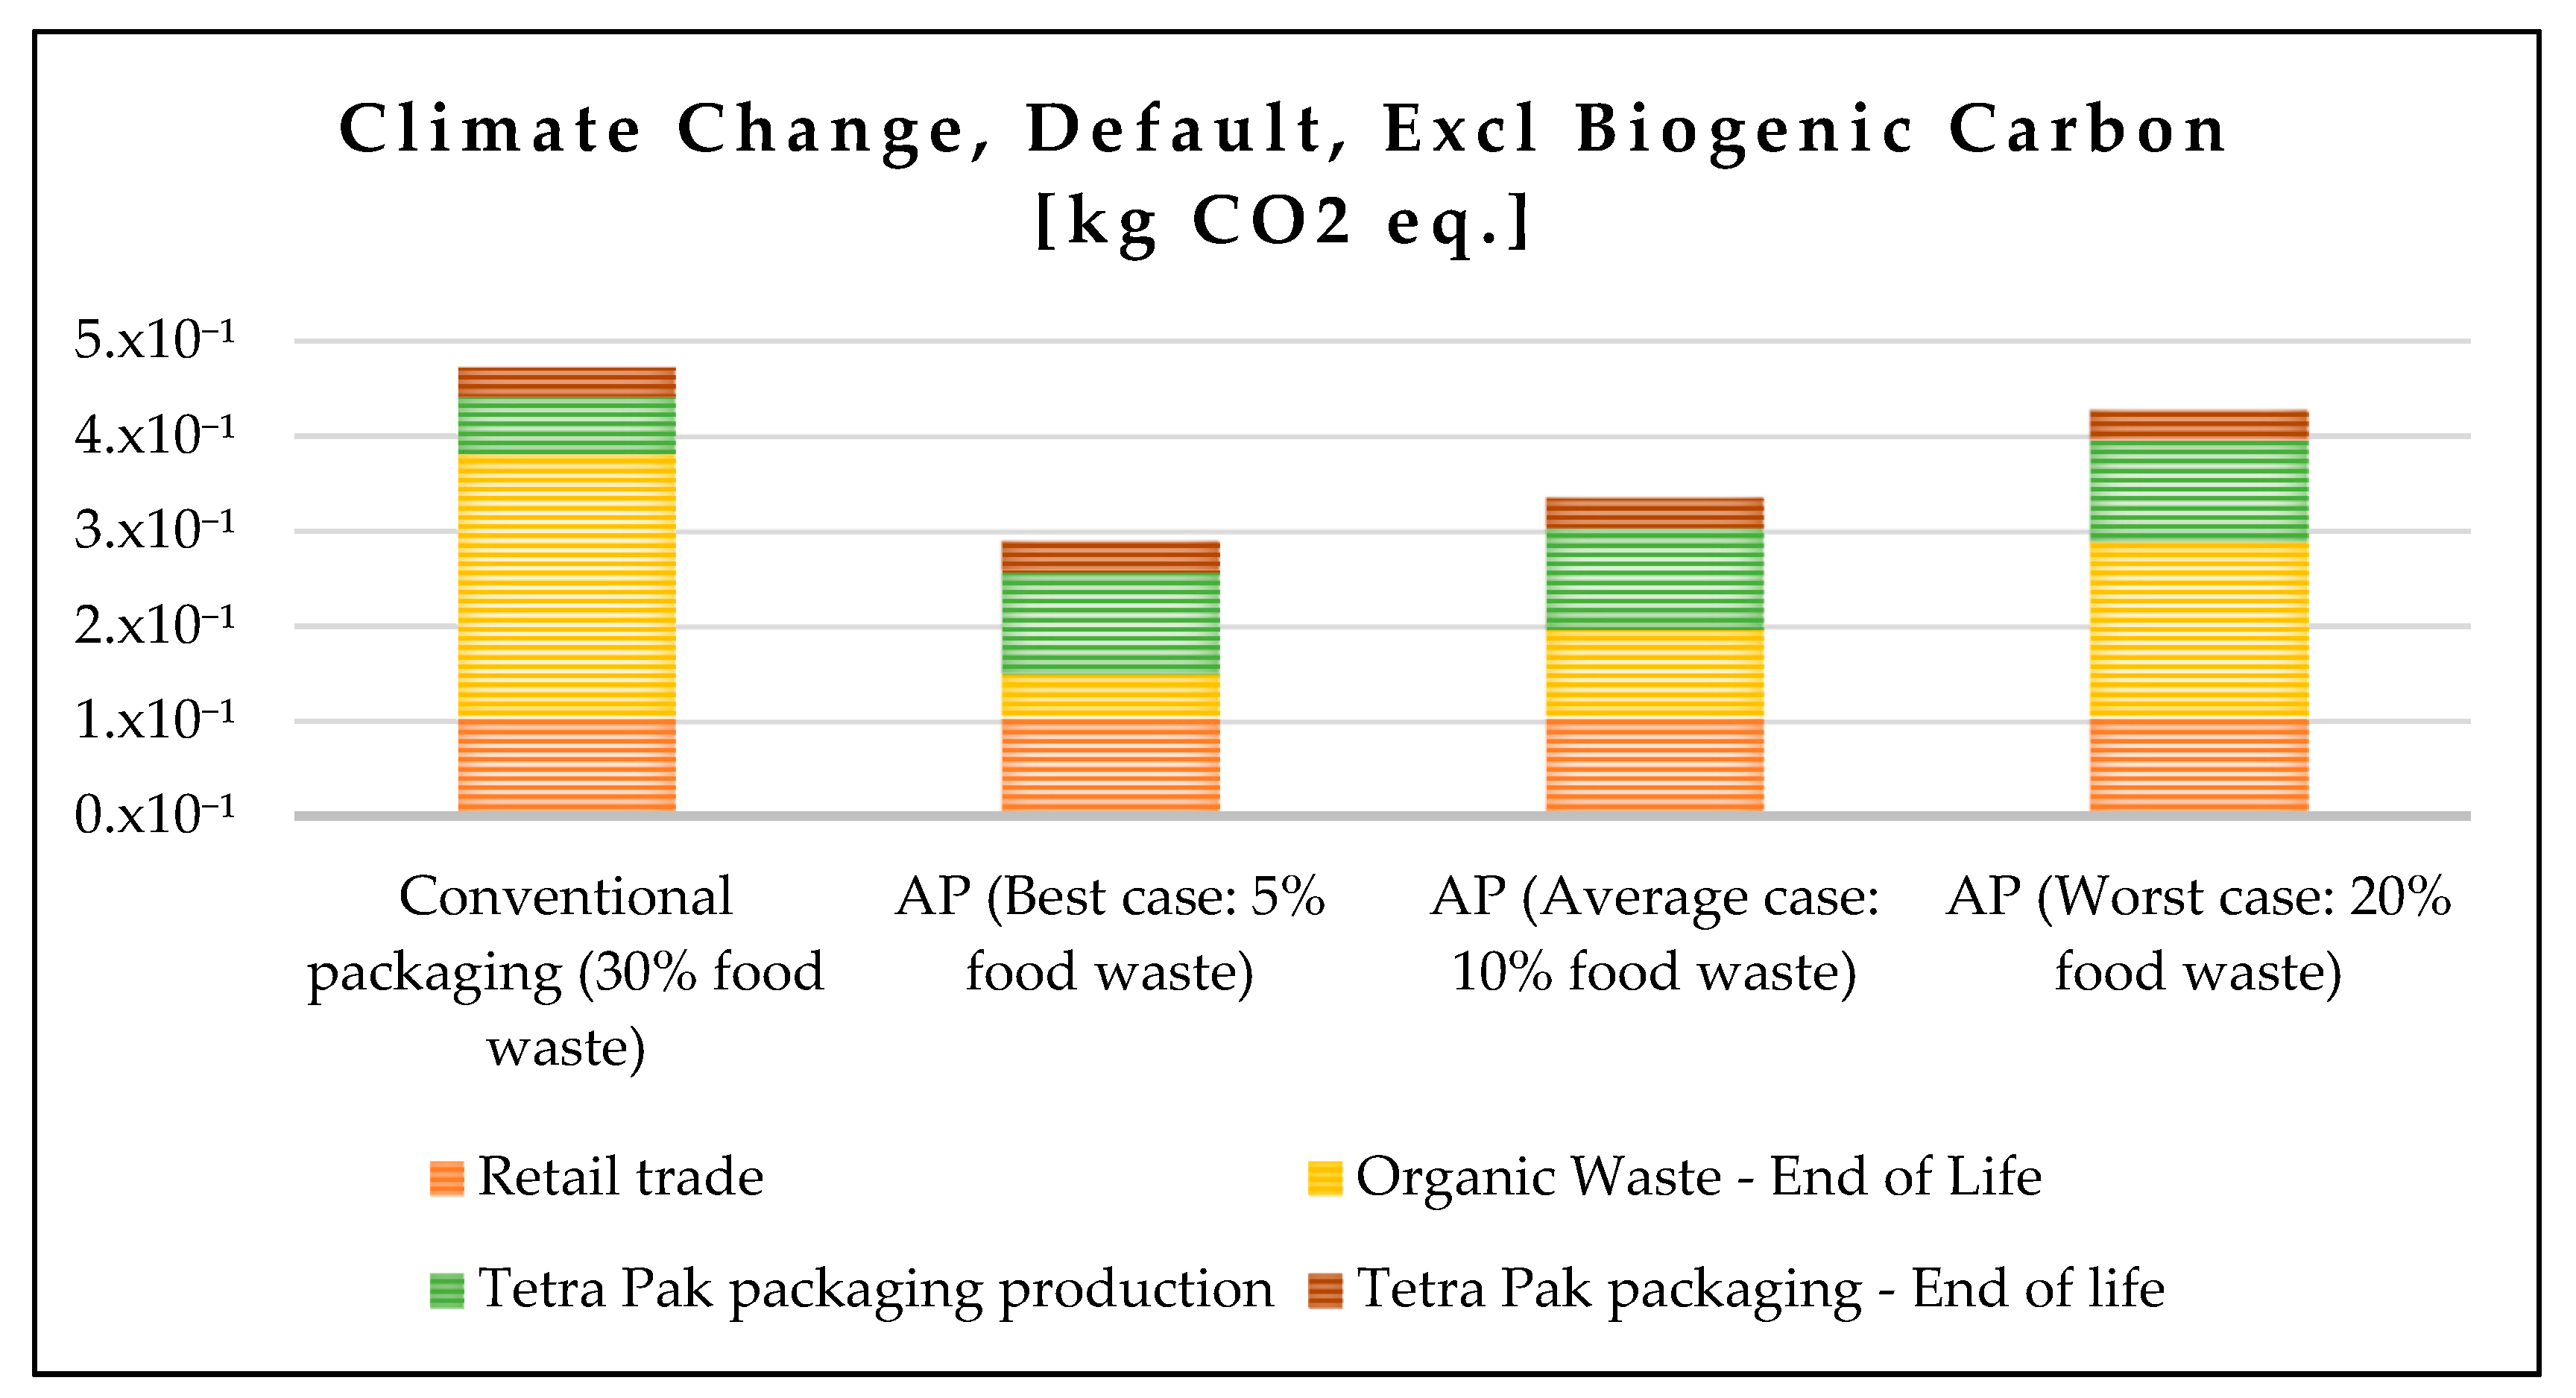
 Figure 12.
The retail trade (indicated in orange) and the end-of-life stage of Tetra Pak packaging (indicated in brown) remain consistent across all four scenarios for both conventional and smart packaging. The production phase of Tetra Pak packaging (indicated in green) is higher for smart packaging, which aligns with the results shown in Figure 9. However, the reduction in food waste (indicated with yellow) plays the most critical role in decreasing CO2 emissions across all scenarios. In the case of conventional packaging, the environmental burden of organic waste is 2.77 × 10⁻¹ kg CO2 eq., contributing to 58.59% of the total environmental burden.
In contrast, in the best-case, average-case, and worst-case smart packaging scenarios, the end-of life-burden of organic waste is significantly reduced to 4.62 × 10⁻², 9.23 × 10⁻², and 1.85 × 10⁻¹ kg CO2 eq., contributing to 16.00, 27.56, and 43.21% of the total climate change burden, respectively. This leads to a total reduction in the climate change footprint at percentages of 38.92%, 29.17%, and 9.65% for the best-case, average-case, and worst-case scenario compared to conventional packaging.
The results indicate that not only does it offset the higher carbon footprint associated with the production of smart packaging, but it also significantly reduces the overall impact on the most important impact category of “Climate Change”. Therefore, despite the added complexity of the materials used through the incorporation of the sensor, the smart packaging system can yield a net environmental benefit through food waste reduction. This trade-off emphasizes how crucial it is to take the entire product-packaging system into account when evaluating innovations intended to improve supply chain sustainability.
Similarly to the “Climate Change” indicator, the contributions from retail trade and the end-of-life stage for both the conventional and smart Tetra Pak packaging remain unchanged across scenarios. However, in the case of the “Fossil Depletion” indicator (Figure 13), the reduction in food waste does not have a sufficiently positive impact to counterbalance the negative contribution from the production of smart Tetra Pak packaging (Figure 10). This is likely due to the increased resource demand for producing the additional components in smart packaging, such as the sensor and the electrospun layer. Consequently, the overall “Fossil Depletion” indicator worsens despite efforts to reduce food waste.
In contrast, the “Freshwater Eutrophication” indicator (Figure 14) is significantly reduced as food waste decreases. This suggests that reducing food waste has a much greater positive impact on lowering the freshwater eutrophication indicator than the increase in this indicator caused by the production of smart packaging. Essentially, less food waste means fewer nutrients, such as phosphorus, are released into freshwater ecosystems, which helps mitigate eutrophication. The contributions from retail trade and the end-of-life stage for Tetra Pak packaging remain the same across all four scenarios, indicating no significant change in these stages regardless of food waste levels.
Following the LCA study, an economic analysis was performed to evaluate the economic feasibility of the developed smart TetraPak packaging.

3.3. Preliminary Economic Analysis

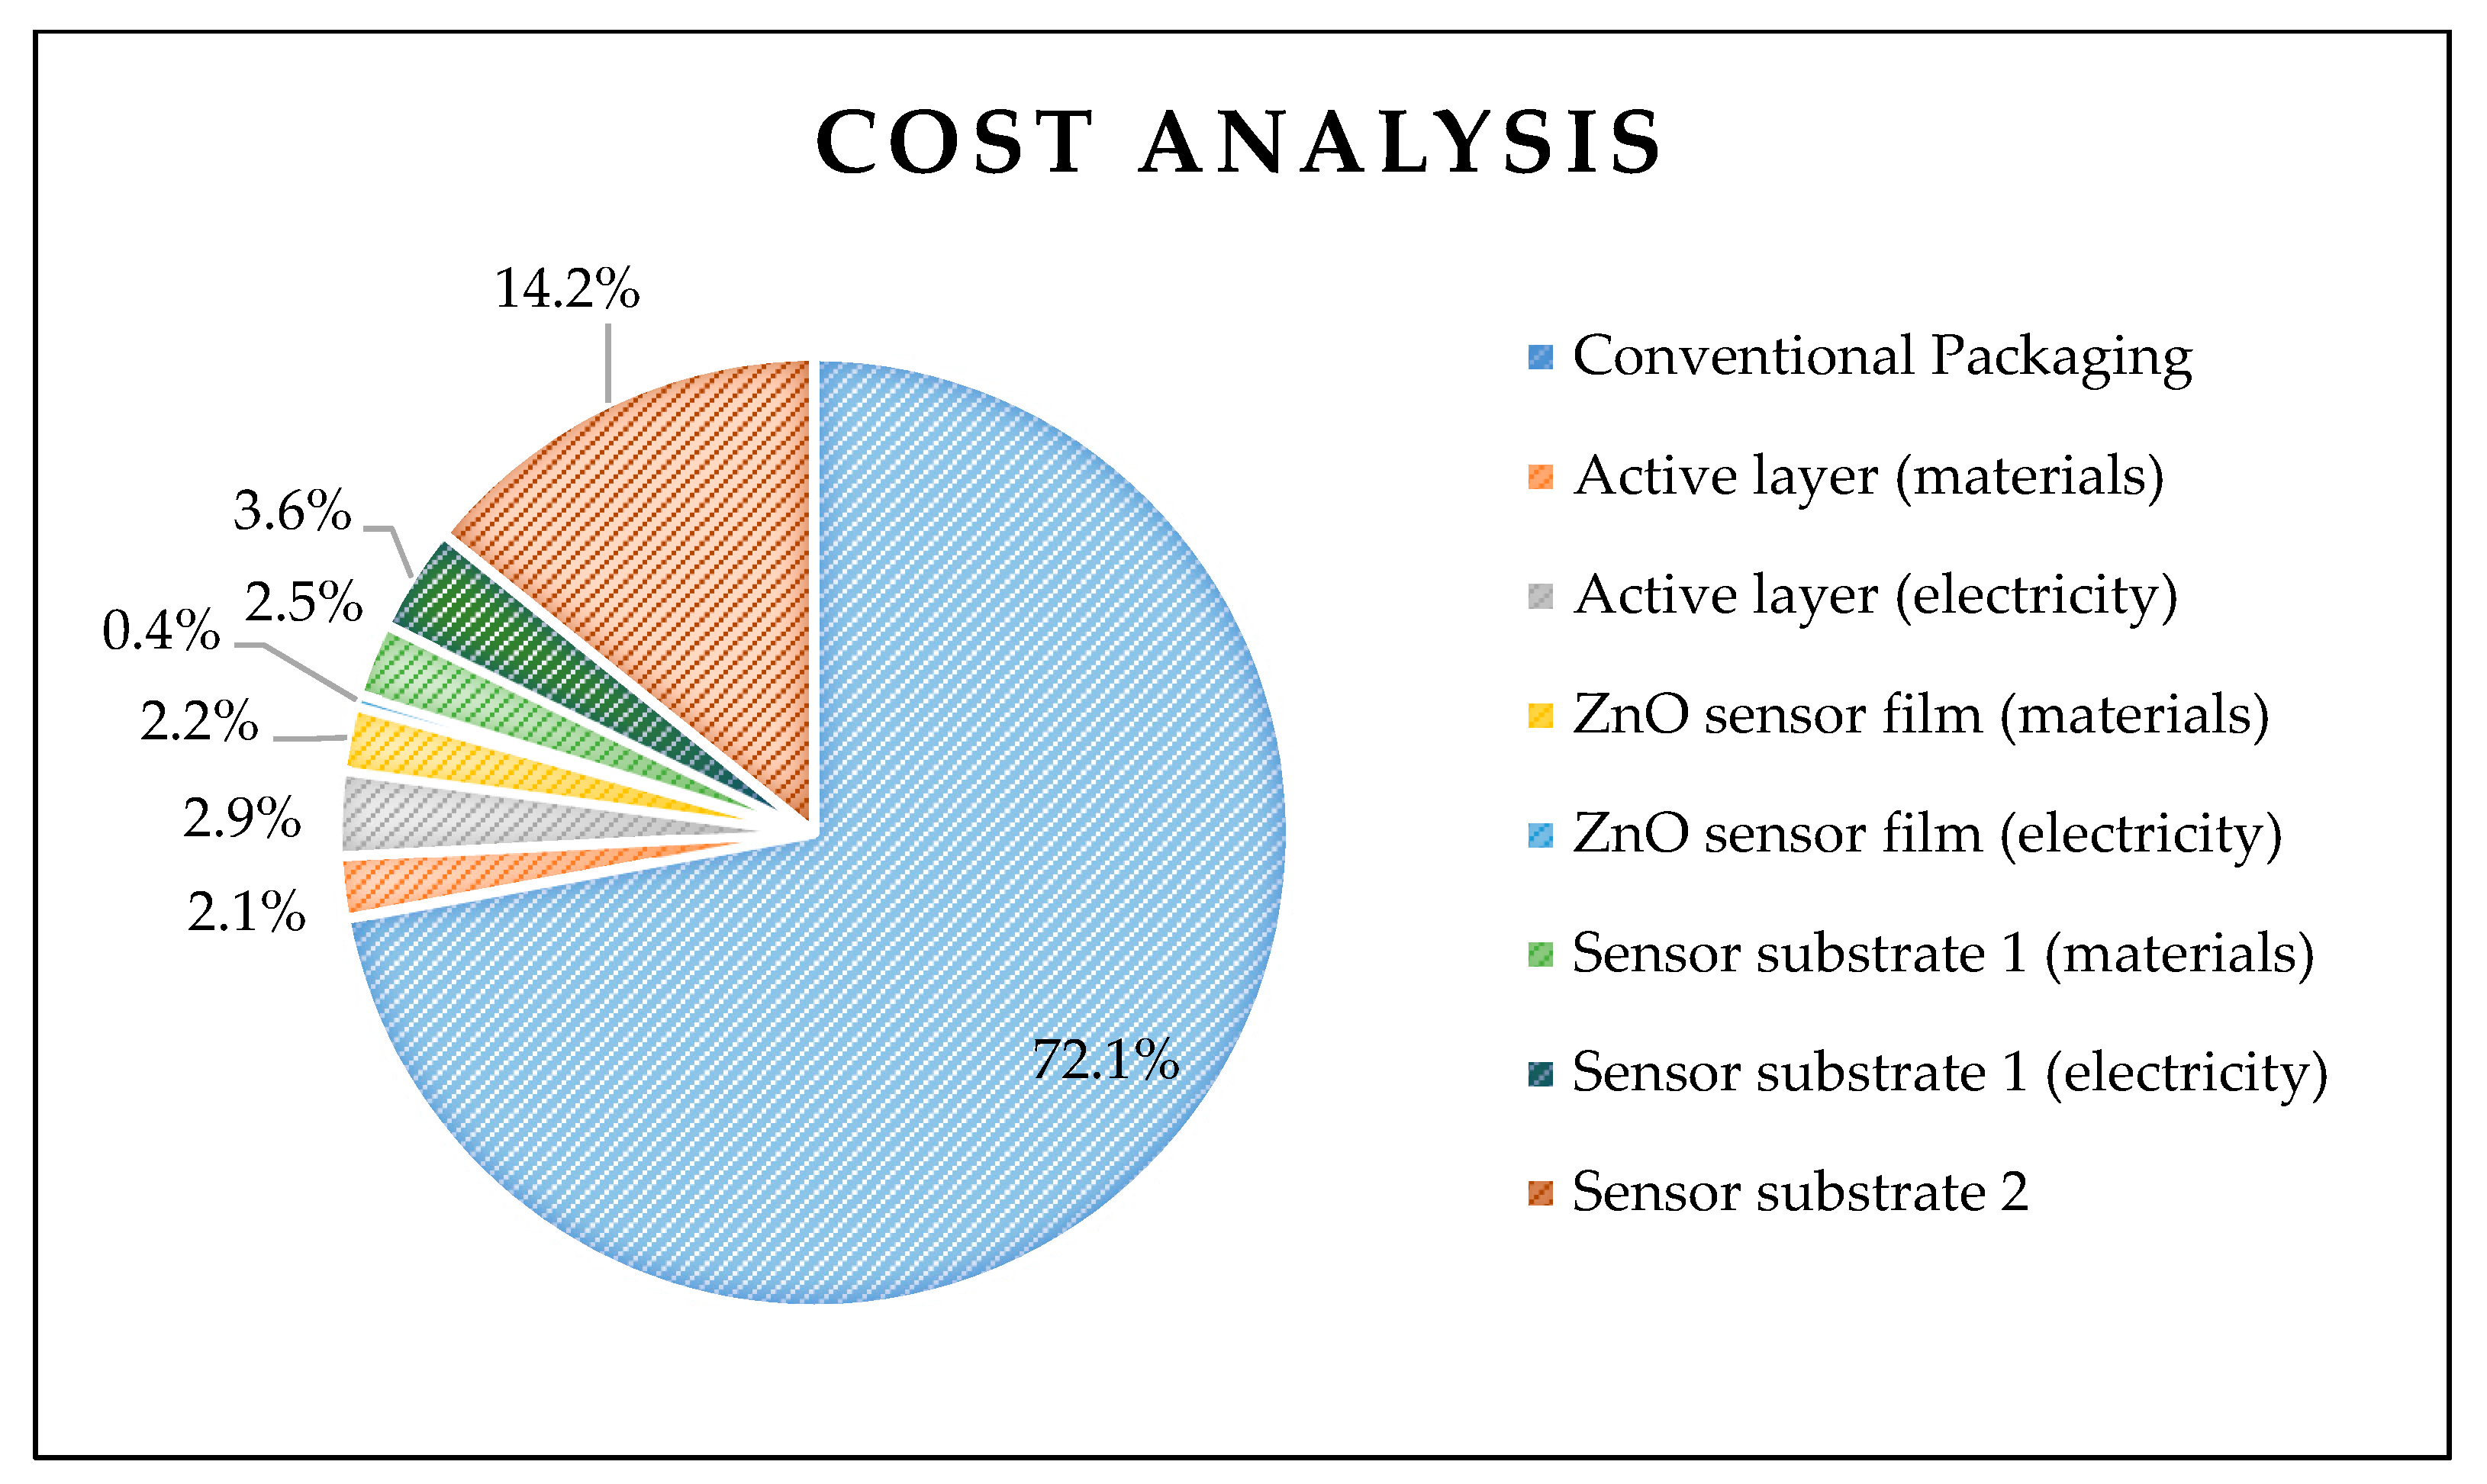
Following the LCA study, an economic analysis was performed to determine the economic feasibility of the developed smart TetraPak packaging. The results are presented in Table 10 and more illustratively in Figure 15.
The cost of conventional TetraPak packaging in the industry is approximately EUR 2.40 × 10⁻¹. The additional components that enhance the functionality of smart packaging have a combined production cost of about EUR 9.28 × 10⁻² in total, with the antioxidant film accounting for EUR 1.65 × 10⁻² and the sensor costing EUR 7.63 × 10⁻². Among these additions, the antioxidant layer contributes 4.96% of the total production cost, while the integrated sensor represents 22.92%. Overall, the total production cost of smart packaging amounts to EUR 3.33 × 10⁻¹, which is 38.66% higher than that of the conventional alternative. While this cost increase may appear significant, the actual price remains almost similar and justifiable given the advantages of smart packaging. First, the controlled release of the antioxidant agents by the active layer extends the shelf life of the food product and leads to fewer early food discards and minimization of food waste. This not only benefits financially the retailers and the consumers but also addresses one of the major global sustainability challenges. Furthermore, the integrated sensor detects microbial spoilage and provides real-time information about food quality. The improvement of consumer awareness and safety, which is a top priority, and better food quality monitoring make smart packaging a promising solution for economic challenges in the food industry. Finally, the extended shelf life provided by smart packaging reduces the frequency of consumer purchases compared to conventional packaging, as the need for replenishment decreases. As a result, the higher cost of smart packaging is offset over time.

4. Conclusions

The life cycle assessment of smart Tetra Pak packaging, incorporating an antioxidant film (active layer) and a chemical sensor (intelligent packaging), demonstrated that, under realistic conditions, it achieved reduction in the environmental burden in the majority of impact categories and most notably in climate change with a 29.17% reduction compared to conventional Tetra Pak. This benefit is primarily due to the potential of smart packaging to extend the shelf life and reduce food waste. However, increases in some impact categories were also observed, mainly due to the sensor incorporation, indicating trade-offs, particularly regarding material complexity and end-of-life recyclability. While this may increase the environmental impact in specific categories, such as ionizing radiation and terrestrial ecotoxicity, the sensing system provides an efficient approach for spoilage indication. Nonetheless, further research is needed to optimize sensor materials and improve recyclability, ensuring a more sustainable smart packaging design.
The economic analysis revealed that the integration of smart features resulted in a cost increase of EUR 9.28 × 10⁻² per unit, representing a 38.66% rise in production costs compared to conventional Tetra Pak. Although this cost rise may be notable, the added functionalities could provide significant value to consumers and food supply chain, offsetting the extra costs through reduced waste and improved food safety.
Overall, the results demonstrate how smart packaging can be a promising yet complex alternative to conventional systems, offering potential environmental advantages tempered by moderately elevated production costs. To further improve sustainability and cost-effectiveness, future research should focus on the optimization of material choices, possibly exploring mono-material packaging, which may be more easily recycled, as well as on the scaling up of smart packaging technologies. Continued research may help overcome barriers, facilitating the broader application of these effective packaging solutions.

Author Contributions

Conceptualization, M.S. and M.K.; methodology, C.B. and M.S.; software, C.B. and M.S.; validation, C.B. and M.S.; formal analysis, M.S., D.N.F., and C.B.; investigation, M.S. and C.B.; resources, M.K.; data curation, M.S., D.N.F. and C.B.; writing—original draft preparation, M.S.; writing—review and editing, M.S. and C.B.; visualization, M.S., D.N.F., and C.B.; supervision, C.T and M.K.; project administration, C.T. and M.K.; funding acquisition, M.S. and M.K. All authors have read and agreed to the published version of the manuscript.

Funding

This research is sponsored by the Stavros Niarchos Foundation through the Industrial Research Fellowship Program at NCSR “Demokritos” in collaboration with NTUA.

Institutional Review Board Statement

Not applicable.

Informed Consent Statement

Not applicable.

Data Availability Statement

The original contributions presented in this study are included in the article. Further inquiries can be directed to the corresponding author.

Acknowledgments

The authors thank Achilleas Bardakas, Marios Chronis, Olga Serifi, and Sokratis Emmanouil Koskinakis for their guidance and technical assistance.

Conflicts of Interest

The authors declare no conflicts of interest.

References

  1. Yildirim, S.; Röcker, B.; Pettersen, M.K.; Nilsen-Nygaard, J.; Ayhan, Z.; Rutkaite, R.; Radusin, T.; Suminska, P.; Marcos, B.; Coma, V. Active Packaging Applications for Food. Compr. Rev. Food Sci. Food Saf. 2018, 17, 165–199. [Google Scholar] [CrossRef] [PubMed]
  2. Ramos, M.; Valdés, A.; Mellinas, A.; Garrigós, M. New Trends in Beverage Packaging Systems: A Review. Beverages 2015, 1, 248–272. [Google Scholar] [CrossRef]
  3. Marsh, K.; Bugusu, B. Food packaging-Roles, materials, and environmental issues: Scientific status summary. J. Food Sci. 2007, 72, R39–R55. [Google Scholar] [CrossRef]
  4. Ebadi, M.; Farsi, M.; Narchin, P.; Madhoushi, M. The effect of beverage storage packets (Tetra Pak™) waste on mechanical properties of wood–plastic composites. J. Thermoplast. Compos. Mater. 2016, 29, 1601–1610. [Google Scholar] [CrossRef]
  5. Zawadiak, J.; Wojciechowski, S.; Piotrowski, T.; Krypa, A. Tetra Pak Recycling–Current Trends and New Developments. Am. J. Chem. Eng. 2017, 5, 37–42. [Google Scholar] [CrossRef]
  6. Available online: https://www.tetrapak.com/solutions/packaging/packaging-material (accessed on 9 March 2025).
  7. Firouz, M.; Mohi-alden, K.; Omid, M. A critical review on intelligent and active packaging in the food industry: Research and development. Food Res. Int. 2021, 141, 110113. [Google Scholar] [CrossRef] [PubMed]
  8. Schaefer, D.; Cheung, W.M. Smart Packaging: Opportunities and Challenges. Procedia CIRP 2018, 72, 1022–1027. [Google Scholar] [CrossRef]
  9. Siracusa, V.; Lotti, N. Intelligent Packaging to Improve Shelf Life; Elsevier: Amsterdam, The Netherlands, 2019. [Google Scholar] [CrossRef]
  10. Drago, E.; Campardelli, R.; Pettinato, M.; Perego, P. Innovations in smart packaging concepts for food: An extensive review. Foods 2020, 9, 1628. [Google Scholar] [CrossRef]
  11. Actin Pak. Ενεργη Συσκευασια; Actin Pak: Vienna, Austria, 2020. [Google Scholar]
  12. Zhang, H.; Hortal, M.; Dobon, A.; Bermudez, J.; Marta, L.-L. The Effect of Active Packaging on Minimizing Food Losses: Life Cycle Assessment (LCA) of Essential Oil Component-enabled Packaging for Fresh Beef. Packag. Technol. Sci. 2015, 28, 761–774. [Google Scholar] [CrossRef]
  13. Vilela, C.; Kurek, M.; Hayouka, Z.; Röcker, B.; Yildirim, S.; Antunes, M.D.C.; Nilsen-Nygaard, J.; Pettersen, M.K.; Freire, C.S.R. A concise guide to active agents for active food packaging. Trends Food Sci. Technol. 2018, 80, 212–222. [Google Scholar] [CrossRef]
  14. Yan, M.R.; Hsieh, S.; Ricacho, N. Innovative Food Packaging, Food Quality and Safety, and Consumer Perspectives. Processes 2022, 10, 747. [Google Scholar] [CrossRef]
  15. Cheng, H.; Chen, L.; McClements, D.J.; Xu, H.; Long, J.; Zhao, J.; Xu, Z.; Meng, M.; Jin, Z. Recent advances in the application of nanotechnology to create antioxidant active food packaging materials. Crit. Rev. Food Sci. Nutr. 2024, 64, 2890–2905. [Google Scholar] [CrossRef]
  16. Deshmukh, R.K.; Gaikwad, K.K. Natural antimicrobial and antioxidant compounds for active food packaging applications. Biomass Convers. Biorefin. 2024, 14, 4419–4440. [Google Scholar] [CrossRef]
  17. Available online: https://www.fao.org/faostat/en/#data/QCL (accessed on 10 March 2025).
  18. D’Almeida, A.P.; de Albuquerque, T.L. Innovations in Food Packaging: From Bio-Based Materials to Smart Packaging Systems. Processes 2024, 12, 2085. [Google Scholar] [CrossRef]
  19. European Food Safety Authority (EFSA). Guidelines on submission of a dossier for safety evaluation by the EFSA of active or intelligent substances present in active and intelligent materials and arti. EFSA J. 2009, 7, 1208. [Google Scholar]
  20. Müller, P.; Schmid, M. Intelligent packaging in the food sector: A brief overview. Foods 2019, 8, 16. [Google Scholar] [CrossRef] [PubMed]
  21. de Cássia Martins Salomão, B. Pathogens and Spoilage Microorganisms in Fruit Juice: An Overview. In Fruit Juices; Academic Press: Cambridge, MA, USA, 2018; pp. 291–308. [Google Scholar] [CrossRef]
  22. Gobbi, E.; Falasconi, M.; Concina, I.; Mantero, G.; Bianchi, F.; Mattarozzi, M.; Musci, M.; Sberveglieri, G. Electronic nose and Alicyclobacillus spp. spoilage of fruit juices: An emerging diagnostic tool. Food Control 2010, 21, 1374–1382. [Google Scholar] [CrossRef]
  23. Weston, M.; Geng, S.; Chandrawati, R. Food Sensors: Challenges and Opportunities. Adv. Mater. Technol. 2021, 6, 2001242. [Google Scholar] [CrossRef]
  24. Rezk, M.Y.; Sharma, J.; Gartia, M.R. Nanomaterial-based CO2 sensors. Nanomaterials 2020, 10, 2251. [Google Scholar] [CrossRef]
  25. ISO 14040:2006; Environmental Management—Life Cycle Assessment—Principles and Framework. International Organization for Standardization: Geneva, Switzerland, 2006.
  26. ISO 14044:2006; Environmental Management—Life Cycle Assessment—Requirements and Guidelines. International Organization for Standardization: Geneva, Switzerland, 2006.
  27. Stramarkou, M.; Boukouvalas, C.; Koskinakis, S.E.; Serifi, O.; Bekiris, V.; Tsamis, C.; Krokida, M. Life Cycle Assessment and Preliminary Cost Evaluation of a Smart Packaging System. Sustainability 2022, 14, 7080. [Google Scholar] [CrossRef]
  28. Ganczewski, G. Cradle-to-Gate Life Cycle Assessment Results. 2018. Available online: http://www.actinpak.eu/wp-content/uploads/2018/11/LCA_fulltext.pdf (accessed on 10 March 2025).
  29. Stramarkou, M.; Boukouvalas, C.; Eleni, P.; Karalekas, D.; Krokida, M. Comparative Life Cycle Assessment of Polyethylene Terephthalate (PET) and Multilayer Tetra Pak Juice Packaging Systems. Chem. Eng. Trans. 2021, 87, 103–108. [Google Scholar] [CrossRef]
  30. Stramarkou, M.; Bardakas, A.; Krokida, M.; Tsamis, C. Fabrication of ZnO Thin Films Doped with Na at Different Percentages for Sensing CO2 in Small Quantities at Room Temperature. Sensors 2025, 25, 2705. [Google Scholar] [CrossRef]
  31. Stramarkou, M.; Oikonomopoulou, V.; Panagiotopoulou, M.; Papadaki, S.; Krokida, M. Sustainable Valorisation of Peach and Apricot Waste Using Green Extraction Technique with Conventional and Deep Eutectic Solvents. Resources 2023, 12, 72. [Google Scholar] [CrossRef]
  32. Tetra Pak. Sustainability Report 2020; Tetra Pak: Pully, Switzerland, 2020. [Google Scholar]
  33. Xie, M.; Qiao, Q.; Sun, Q.; Zhang, L. Life cycle assessment of composite packaging waste management—A Chinese case study on aseptic packaging. Int. J. Life Cycle Assess. 2013, 18, 626–635. [Google Scholar] [CrossRef]
  34. Eurostat. Municipal Waste Statistics; Eurostat: Luxembourg, 2025. [Google Scholar]
  35. United States Environmental Protection Agency. 2019 Wasted Food Report Estimates of Generation and Management of Wasted Food in the United States in 2019; United States Environmental Protection Agency: Washington, DC, USA, 2023. [Google Scholar]
  36. Schlecht, S.; Wellenreuther, F.; Busch, M.; Markwardt, S. Comparative Life Cycle Assessment of Tetra Pak® Carton Packages and Alternative Packaging Systems for Beverages and Liquid Dairy Products on the Swiss and Austrian Market; IFEU: Heidelberg, Germany, 2019. [Google Scholar]
  37. Huijbregts, M.A.J.; Steinmann, Z.J.N.; Elshout, P.M.F.; Stam, G.; Verones, F.; Vieira, M.; Zijp, M.; Hollander, A.; van Zelm, R. ReCiPe2016: A harmonised life cycle impact assessment method at midpoint and endpoint level. Int. J. Life Cycle Assess. 2017, 22, 138–147. [Google Scholar] [CrossRef]
  38. Baumann, H.; Tillman, A.-M. The Hitch Hiker’s Guide to LCA; Springer: Berlin/Heidelberg, Germany, 2004. [Google Scholar]
  39. Guinée, J.B. Handbook on life cycle assessment—Operational guide to the ISO standards. Int. J. Life Cycle Assess. 2001, 6, 255. [Google Scholar] [CrossRef]
  40. Acero, A.P.; Rodríguez, C.; Ciroth, A. LCIA methods Impact assessment methods in Life Cycle Assessment and their impact categories. Open J. Appl. Sci. 2014, 14. Available online: https://nexus.openlca.org/ws/files/10551 (accessed on 19 May 2025).
  41. Markwardt, S.; Wellenreuther, F.; Drescher, A.; Harth, J.; Busch, M. Comparative Life Cycle Assessment of Tetra Pak carton packages and alternative packaging systems for liquid food on the Nordic market. Inst. Energy Environ. Res. 2017, 49, 445. [Google Scholar]
  42. Nunez, P.; Jones, S. Cradle to gate: Life cycle impact of primary aluminium production. Int. J. Life Cycle Assess. 2016, 21, 1594–1604. [Google Scholar] [CrossRef]
  43. Akinnawo, S.O. Eutrophication: Causes, consequences, physical, chemical and biological techniques for mitigation strategies. Environ. Chall. 2023, 12, 100733. [Google Scholar] [CrossRef]
  44. Boros, B. Evaluation of Ecotoxicology Assessment Methods of Nanomaterials and Their Effects. Nanomaterials 2020, 10, 610. [Google Scholar] [CrossRef] [PubMed]
  45. Siracusa, V.; Ingrao, C.; Giudice, A.L.; Mbohwa, C.; Rosa, M.D. Environmental assessment of a multilayer polymer bag for food packaging and preservation: An LCA approach. Food Res. Int. 2014, 62, 151–161. [Google Scholar] [CrossRef]
  46. Kartonverpackungen, F.; Gmbh, E.; Gmbh, T.P. Life Cycle Assessment Beverage Cartons Under Test. 2007. Available online: https://www.ifeu.de/fileadmin/uploads/LCA_EcoPlus_Final-Report-inkl-Critical-Rev_October-2012.pdf (accessed on 19 May 2025).
Figure 1. (a) Percentages of cardboard, LDPE and aluminum, and (b) the various layers in conventional Tetra Pak packaging [6].
Sustainability 17 04810 g001
Figure 2. Process flowchart of the production of Product System A (conventional TetraPak packaging).
Sustainability 17 04810 g002
Figure 3. (a) Macroscopic image of the CO2 chemical sensor consisting of ZnO film, Substrate 1—SiO2 substrate—(blue color) and Substrate 2—PCB substrate—(green color), and (b) schematic illustration of ZnO film and Substrate 1.
Sustainability 17 04810 g003
Figure 4. Process flowchart of the fabrication of Product Subsystem B1 (CO2 chemical sensor consisting of the sensor film, Substrate 1 and Substrate 2).
Sustainability 17 04810 g004
Figure 5. (a) Biodegradable film with the encapsulated antioxidant compounds that serves as an active layer in smart packaging and (b) the electrospinning unit.
Sustainability 17 04810 g005
Figure 6. Process flowchart of the development of Product Subsystem B2 (active layer with the encapsulated antioxidants).
Sustainability 17 04810 g006
Figure 7. Process flowchart of the development of Product System B (smart Tetra Pak packaging).
Sustainability 17 04810 g007
Figure 8. Flow diagrams of the retail use and end-of-life stages of the packaging systems and the contained food.
Sustainability 17 04810 g008
Figure 9. Percentage contribution of all processes included in System A (conventional TetraPak packaging) and System B (Smart TetraPak packaging) to the midpoint indicator “Climate Change”.
Sustainability 17 04810 g009
Figure 10. Percentage contribution of all processes included in System A (conventional TetraPak packaging) and System B (Smart packaging) to the midpoint indicator “Fossil Depletion”.
Sustainability 17 04810 g010
Figure 11. Percentage contribution of all processes included in System A (conventional TetraPak packaging) and System B (Smart packaging) to the midpoint indicator “Freshwater Eutrophication”.
Sustainability 17 04810 g011
Figure 12. Comparison, overall and for each process separately, between conventional TetraPak packaging (30% food waste) and smart packaging in best-case, average-case, and worst-case scenarios (5%, 10%, and 20% food waste, respectively) for the “Climate Change” indicator.
Sustainability 17 04810 g012
Figure 13. Comparison, overall and for each process separately, between conventional TetraPak packaging (30% food waste) and smart packaging in best-case, average-case, and worst-case scenarios (5%, 10%, and 20% food waste, respectively) for the “Fossil Depletion” indicator.
Sustainability 17 04810 g013
Figure 14. Comparison, overall and for each process separately, between conventional TetraPak packaging (30% food waste) and smart packaging in best-case, average-case, and worst-case scenarios (5%, 10%, and 20% food waste, respectively) for the “Freshwater Eutrophication” indicator.
Sustainability 17 04810 g014
Figure 15. Contribution of each component of smart packaging in its total cost.
Sustainability 17 04810 g015
Table 1. LCI with input and output data for the production of conventional Tetra Pak packaging.
Flow TypeFlow NameValueFlow UnitSource
InAluminum foil2.72 × 10−3kg[6,29]
Polyethylene film1.59 × 10−3kg
Cardboard1.61 × 10−3kg
Printing ink2.74 × 10−4kg
Multi-layer packaging board4.26 × 10−2kg
Electricity grid mix EU-284.98 × 10⁴JLCA for Experts Professional database
Light fuels4.52 × 10−6kg
Liquefied petroleum gas (LPG)5.38 × 10⁻⁵kg
Natural gas4.04 × 10−4kg
Water1.77 × 10−2kg
OutCarbon dioxide1.06 × 10−3kgLCA for Experts Professional database
Carbon monoxide4.04 × 10−7kg
Volatile organic compounds (VOCs)9.66 × 10⁻⁸kg
Non-methane VOC1.57 × 10−5kg
Sulfur dioxide2.36 × 10−8kg
Nitric oxides1.93 × 10−8kg
Nitrogen dioxide1.07 × 10−6kg
Hazardous waste5.14 × 10−5kg
Particulate matter (>PM10)2.86 × 10⁻⁹kg
Methane9.70 × 10−8kg
Tetra Pak packaging1.00pcs
Table 2. LCI with input and output data for the production of CO2 sensors.
ZnO Sensing Film
Flow TypeFlow nameValueFlow unitSource
InZinc acetate7.70 × 10−4kgSimulations on industrial scale based on the performed measurements and experiments in laboratory scale
2-methoxyethanol6.76 × 10−4kg
Ethanolamine2.10 × 10−4 kg
Sodium acetate1.00 × 10−5kg
Electricity grid mix EU-284.45 × 10⁴J
OutZnO sensing film1pcs.
Substrate 1
Flow TypeFlow nameValueFlow unitSource
InSilicon1.80 × 10−4kgSimulations on industrial scale based on the performed measurements and experiments in laboratory scale
Resin2.00 × 10−4 kg
Hydrogen peroxide2.18 × 10−6kg
Sulfuric acid2.75 × 10−6 kg
Acetone 7.80 × 10⁻⁴kg
Isopropanol8.00 × 10−4kg
Electricity grid mix EU-281.20 × 10⁵J
OutSubstrate 11pcs.
Substrate 2
Flow TypeFlow nameValueFlow unitSource
InPET1.80 × 10−3 kgExperimental data
OutSubstrate 21pcs.
Table 3. LCI with input and output data for the production of active layers with antioxidant compounds.
Flow TypeFlow NameValueFlow UnitSource
InAntioxidants extract 5.17 × 10⁻³kgSimulations on industrial scale based on the performed measurements and experiments in laboratory scale
Zein (polysaccharide as matrix)3.18 × 10⁻³kg
Water1.28 × 10−3kg
Ethanol4.00 × 10−3kg
Tetra Pak packaging6.99 × 10−1kg
Electricity grid mix EU-281.71 × 10⁵J
OutActive layer coated on Tetra Pak1pcs
Table 4. LCI with input and output data for the retail, use and end of life of Product Systems A and B.
Retail and Storage
Flow TypeFlow nameValueFlow unitSource
InPackaged juice2.07kgLCA for Experts Professional database
Store and retail2.00kg
OutSold packaged juice2.03kg
Mixed waste (to landfill)4.14 × 10⁻²kgA total of 2% losses to landfill, LCA for Experts Professional database
Use
Flow TypeFlow nameValueFlow unitSource
InSold packaged juice2.03kg
OutPackaging (Waste)6.86 × 10⁻²kg
Organic waste9.80 × 10−2kgLCA for Experts Professional database [34,35]
End of life Packaging
Flow TypeFlow nameValueFlow unitSource
InActive layer coated on Tetra Pak1pcs
OutWaste for incineration2.35 × 10−2kgLCA for Experts Professional database
Waste for landfill3.53 × 10−2kg
Waste for recycling9.80 × 10−3kg[32,33]
Recycling
Flow TypeFlow nameValueFlow unitSource
InWaste (to recycle)9.80 × 10⁻³kg[32,33]
Electricity grid mix EU-288.46 × 10²JLCA for Experts Professional database [32,33]
Water1.96 × 10−2kg
OutRecycled materials (credit)9.80 × 10⁻³kgLCA for Experts Professional database
Table 5. Cost of the conventional Tetra Pak (System A).
Conventional Tetra Pak (System A)
CategoryCost (EUR/kg)Amount UsedCost (EUR/pc)Source
Tetra Pak (2 lt) 2.40 × 10⁻¹Industrial data from Greek company
Table 6. Operating costs for the fabrication of CO2 sensors (Subsystem B1).
ZnO Sensing Film
CategoryCost (EUR/kg or MJ)Amount usedCost (EUR/pc)Source
Zinc acetate9.45 × 10−17.70 × 10⁻⁴ kg7.27 × 10−4Commercial price for industrial scale
2-methoxyethanol9.50 × 10−16.76 × 10⁻³ kg6.42 × 10−3
Ethanolamine1.422.10 × 10−4 kg2.98 × 10−4
Sodium acetate3.69 × 10−11.00 × 10⁻⁵ kg3.69 × 10−6
Total raw materials 7.75 × 10⁻³ kg7.45 × 10−3
Electricity of spin coating2.78 × 10−23.60 × 10⁻² MJ1.00 × 10−3Data from the Public Power Corporation of Greece based on the consumption of the machines used
Electricity of vacuum pump2.78 × 10−24.10 × 10⁻³ MJ1.14 × 10−4
Electricity of drying 2.78 × 10−23.82 × 10−3 MJ1.06 × 10−4
Electricity of annealing2.78 × 10−25.40 × 10⁻⁴ MJ1.50 × 10−5
Total electricity 4.45 × 10⁻² MJ1.23 × 10−3
Substrate 1
CategoryCost (EUR/kg or MJ)Amount usedCost (EUR/pc)Source
Silicon1.131.80 × 10−4 kg2.04 × 10−4Commercial price for industrial scale
Resin4.222.00 × 10−4 kg8.44 × 10−4
Hydrogen peroxide1.15 × 1022.18 × 10−6 kg2.50 × 10−4
Sulfuric acid9.11 × 1022.75 × 10−6 kg5.00 × 10−3
Acetone1.287.80 × 10−4 kg1.00 × 10−3
Isopropanol1.258.00 × 10−4 kg1.00 × 10−3
Total raw materials 8.30 × 10⁻³
Electricity of oven2.78 × 10−24.05 × 10⁻⁴ MJ1.13 × 10−5Data from the Public Power Corporation of Greece based on the consumption of the machines used
Electricity of negative lithography2.78 × 10−27.20 × 10⁻² MJ2.00 × 10−3
Electricity of sputtering2.78 × 10−23.60 × 10⁻¹ MJ1.00 × 10−2
Electricity of cleaning2.78 × 10−20.000.00
Total electricity2.78 × 10−24.36 × 10⁻¹ MJ1.20 × 10−2
Substrate 24.73 × 10⁻²¹ pc4.73 × 10−2Commercial price
Total cost 7.63 × 10⁻²
Table 7. Operating costs for the development of active layers (Subsystem B2).
Active Layer (Subsystem B2)
CategoryCost (EUR/kg or MJ)Amount usedCost (EUR/pc)Source
Zein (polysaccharide as matrix)21.00 × 10−32.00 × 10−3Commercial price for industrial scale
Ethanol1.254.00 × 10−35.00 × 10⁻³
Total raw materials3.255 × 10−3 kg7.00 × 10−3
Electricity for extraction 2.78 × 10−21.71 × 10−14.75 × 10⁻³Data from the Public Power Corporation of Greece based on the consumption of the machines used
Electricity for electrospinning2.78 × 10−21.71 × 10−14.75 × 10−3
Total electricity 3.42 × 10−19.50 × 10−3
Total Cost3.31 1.65 × 10⁻²
Table 8. Environmental effects of the production and end of life of smart packaging (System B) in ReCiPe midpoint impact categories.
Midpoint IndicatorValue
Climate Change [kg CO2 eq.]1.39 × 10⁻¹
Fine Particulate Matter Formation [kg PM2.5 eq.]8.58 × 10⁻⁵
Fossil Depletion [kg oil eq.]3.95 × 10⁻²
Freshwater Consumption [m3]4.62 × 10⁻³
Freshwater Ecotoxicity [kg 1,4 DB eq.]9.29 × 10⁻⁵
Freshwater Eutrophication [kg P eq.]2.60 × 10⁻⁶
Human Toxicity, Cancer [kg 1,4-DB eq.]3.72 × 10⁻⁵
Human Toxicity, Non-Cancer [kg 1,4-DB eq.]8.66 × 10⁻³
Ionizing Radiation [Bq C-60 eq. to air]4.14 × 10⁻³
Land Use [Annual crop eq.·y]6.59 × 10⁻³
Marine Ecotoxicity [kg 1,4-DB eq.]1.76 × 10⁻⁴
Marine Eutrophication [kg N eq.]6.09 × 10⁻⁶
Metal Depletion [kg Cu eq.]5.69 × 10⁻⁴
Photochemical Ozone Formation, Ecosystems [kg NOx eq.]1.80 × 10⁻¹
Photochemical Ozone Formation, Human Health [kg NOx eq.]1.12 × 10⁻¹
Stratospheric Ozone Depletion [kg CFC-11 eq.]4.13 × 10⁻⁸
Terrestrial Acidification [kg SO2 eq.]2.82 × 10⁻⁴
Terrestrial Ecotoxicity [kg 1,4-DB eq.]8.26 × 10⁻²
Table 9. Comparison between conventional TetraPak packaging (30% food waste) and smart packaging in best-case (S1), average-case (S2), and worst-case (S3) scenarios (5%, 10%, and 20% food waste, respectively).
Midpoint IndicatorValue of IndicatorPercentage Reduction Compared to Conventional
Conventional Packaging, S0 (30% Food Waste)Smart Packaging, S1 (Best Case: 5% Food Waste)Smart Packaging, S2 (Average Case: 10% Food Waste)Smart Packaging, S3 (Worst Case: 20% Food Waste)Smart Packaging, S1 (Best Case: 5% Food Waste)Smart Packaging, S2 (Average Case:10% Food Waste)Smart Packaging, S3 (Worst Case: 20% Food Waste)
Climate change [kg CO2 eq.]4.73 × 10−12.89 × 10−13.35 × 10−14.27 × 10−1−38.92%−29.17%−9.65%
Fine particulate matter formation [kg PM2.5 eq.]1.37 × 10−41.42 × 10−41.47 × 10−41.58 × 10−43.51%7.25%14.75%
Fossil depletion [kg oil eq.]6.57 × 10−26.67 × 10−26.82 × 10−27.07 × 10−21.59%3.93%7.65%
Freshwater consumption [m3]4.72 × 10−35.21 × 10−35.23 × 10−35.27 × 10−310.34%10.72%11.50%
Freshwater ecotoxicity [kg 1,4 DB eq.]1.28 × 10−41.08 × 10−41.16 × 10−41.32 × 10−4−15.62%−9.40%3.03%
Freshwater eutrophication [kg P eq.]1.47 × 10−54.91 × 10−67.00 × 10−61.12 × 10−5−66.49%−52.23%−23.78%
Human toxicity, cancer [kg 1,4-DB eq.]6.36 × 10−56.13 × 10−56.50 × 10−57.23 × 10−5−3.57%2.20%13.72%
Human toxicity, non-cancer [kg 1,4-DB eq.]3.88 × 10−17.34 × 10−21.38 × 10−12.66 × 10−1−81.07%−64.55%−31.54%
Ionizing radiation [Bq C-60 eq. to air]6.73 × 10−38.41 × 10−38.43 × 10−38.48 × 10−325.07%25.38%26.00%
Land use [Annual crop eq.·y]7.93 × 10−37.29 × 10−37.30 × 10−37.32 × 10−3−8.04%−7.91%−7.66%
Marine ecotoxicity [kg 1,4-DB eq.]1.85 × 10−41.80 × 10−41.84 × 10−41.86 × 10−4−2.36%−0.32%0.66%
Marine eutrophication [kg N eq.]3.56 × 10−51.31 × 10−51.81 × 10−52.81 × 10−5−63.37%−49.34%−21.29%
Metal depletion [kg Cu eq.]2.23 × 10−39.52 × 10−41.24 × 10−31.82 × 10−3−57.25%−44.23%−18.23%
Photochemical ozone formation, ecosystems [kg NOx eq.]4.01 × 10−13.96 × 10−14.13 × 10−14.47 × 10−1−1.26%3.01%11.53%
Photochemical ozone formation, human health [kg NOx eq.]2.49 × 10−12.46 × 10−12.57 × 10−12.78 × 10−1−1.19%3.10%11.64%
Stratospheric ozone depletion [kg CFC-11 eq.]4.51 × 10−71.36 × 10−72.03 × 10−73.37 × 10−7−69.88%−55.03%−25.33%
Terrestrial acidification [kg SO2 eq.]4.69 × 10−44.66 × 10−44.86 × 10−45.27 × 10−4−0.72%3.67%12.43%
Terrestrial ecotoxicity [kg 1,4-DB eq.]5.60 × 10−21.06 × 10−11.08 × 10−11.14 × 10−188.58%93.44%103.16%
Table 10. Costs of conventional packaging and of the different components of a smart TetraPak and their percentage in the total cost.
Cost CategoryCost ValueCost Percentage
Conventional Packaging2.40 × 10−172.12%
Active layer (materials)2.00 × 10−32.10%
Active layer (electricity)9.50 × 10−32.85%
ZnO sensor film (materials)7.45 × 10−32.24%
ZnO sensor film (electricity)1.23 × 10−30.37%
Sensor substrate 1 (materials)8.30 × 10−32.49%
Sensor substrate 1 (electricity)1.20 × 10−23.61%
Sensor substrate 24.73 × 10−214.21%
Smart Packaging3.28 × 10−1
Disclaimer/Publisher’s Note: The statements, opinions and data contained in all publications are solely those of the individual author(s) and contributor(s) and not of MDPI and/or the editor(s). MDPI and/or the editor(s) disclaim responsibility for any injury to people or property resulting from any ideas, methods, instructions or products referred to in the content.

